
Understanding Bridging Sites and Accelerating Quantum Efficiency for Photocatalytic CO2 Reduction
2024-02-09 08:16:36KangwangWangZhuofengHuPeifengYuAlinaBaluKuanLiLongfuLiLingyongZengChaoZhangRafaelLuqueKaiYanHuixiaLuo
Nano-Micro Letters 2024年1期
Kangwang Wang, Zhuofeng Hu, Peifeng Yu, Alina M.Balu, Kuan Li, Longfu Li,Lingyong Zeng, Chao Zhang, Rafael Luque, Kai Yan✉, Huixia Luo✉
ABSTRACT We report a novel double-shelled nanoboxes photocatalyst architecture with tailored interfaces that accelerate quantum efficiency for photocatalytic CO2 reduction reaction (CO2RR) via Mo-S bridging bonds sites in Sv-In2S3@2H-MoTe2.The X-ray absorption near-edge structure shows that the formation of Sv-In2S3@2H-MoTe2 adjusts the coordination environment via interface engineering and forms Mo-S polarized sites at the interface.The interfacial dynamics and catalytic behavior are clearly revealed by ultrafast femtosecond transient absorption, time-resolved, and in situ diffuse reflectance-Infrared Fourier transform spectroscopy.A tunable electronic structure through steric interaction of Mo-S bridging bonds induces a 1.7-fold enhancement in Sv-In2S3@2H-MoTe2(5) photogenerated carrier concentration relative to pristine Sv-In2S3.Benefiting from lower carrier transport activation energy, an internal quantum efficiency of 94.01% at 380 nm was used for photocatalytic CO2RR.This study proposes a new strategy to design photocatalyst through bridging sites to adjust the selectivity of photocatalytic CO2RR.
KEYWORDS Quantum efficiency; Electronic structure; Steric interaction; Bridging sites; CO2 reduction
1 Introduction
Two of the largest research challenges confronting the world today are the ever-rising need for clean energy and the global crisis of climate change [1].Converting solar energy by means of the mild light-driven chemical reactions is of far-reaching importance for the development of green and sustainable energy sources [2].A wide variety of exciting products resulting from carbon dioxide (CO2) conversion are CH3OH, CH4, and other available organic compounds,which are stable, nontoxic substances with considerable market potential in various applications [3, 4].Unfortunately, CO2reduction reaction (CO2RR) frequently is difficult to carry out owing to CO2being thermodynamically stable, resulting in extraordinarily andante reaction kinetics during the photoreduction process.Beyond that, the conversion of CO2molecules competes with other side reactions,such as the common hydrogen (H2) evolution reaction (HER,2H++ 2e = H2), which memorably declines the production of reduced carbon products.For this reason, highly selective,stable and efficient catalysts are required to facilitate photocatalytic CO2RR, overcoming significant energy barriers and tuning the reaction pathways to the formation of CH3OH and CH4, as well CO [5].
Two-dimensional (2D) materials, especially transition metal dichalcogenides (TMDs, MX2) [M refers to a transition metal (Ta, Nb, Mo, and W, etc.), and X denotes as a chalcogen (S, Se, and Te, etc.)] have been extensively studied and applied in many fields for decades,because of their low cost, superior electronic, topological and mechanical properties, as well as their ultrathin low-dimensional nature.By now, the members of TMDs group, on account of their unique electronic and atomic structural behavior, have been widely considered to be an ideal alternative for photocatalytic and electrocatalytic CO2RR.Despite the emergence of many fascinating preponderances, inadequate intrinsic electrical transport and inactive substrate surfaces in the TMDs group severely impede their application in photocatalytic and electrocatalytic CO2RR, for instance, typical molybdenum sulfide(MoS2) and molybdenum selenide (MoSe2) materials[6].It is interesting to notice that molybdenum telluride(MoTe2) has recently attracted attention due to its metallic conductivity and outstanding electron transport capacity.The existence of different phases of MoTe2provides the feasibility of developing a wealth of novel structures and gadgets, including a semiconducting 2H-phase (prismatic trigonal structure; bandgap of about 1.0 eV), a topological semimetallic 1 T-phase (twisted octahedron; energy gap covered near the Fermi energy level (EF)), and a possible topological superconductingTd-phase, which facilitates the commercial application of MoTe2in the physical industry [7, 8].Despite this, the construction of catalytically active nano-heterojunctions with novel compositions and microscopic morphologies remains a major challenge requiring urgent breakthroughs due to the challenges of synthetic methods and design ideas.
Based on previously reported studies, designing double-shelled hollow structures of semiconductor nanomaterials is one of the most effective stratagems to for improving light utilization, tuning electronic structure and steric interaction of chemical bonds, accelerating interfacial contact, providing more catalytic reaction sites and promoting effective carrier separation and transfer.Given this, we strategically proposed a “doubleshelled nanoboxes” design for Sv-In2S3@2H-MoTe2catalysts, in which 2H-MoTe2was coated on Sv-In2S3single-shelled nanoboxes to form the Mo-S bonds of S-vacancies-rich junction structure.Assisted by the robust built-In electric field (IEF) and Mo-S bridging bonds of Sv-In2S3@2H-MoTe2(5), “S”-scheme charge separation is notably facilitated, resulting in an internal quantum efficiency (IQE) calculated via photocatalytic CO2RR of 94.01% (IQEcr) at 380 nm.Particularly, the Mo-S bridging bonds can reduce the adsorption energy barriers of *OCHO and *CHO species and effectively regulate the formation energy barriers of CO, H2, and CH4, thus enhancing the photocatalytic activity (Scheme 1).
2 Experimental Section
2.1 Materials
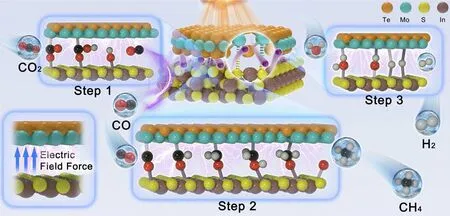
Scheme 1 Schematic illustration for modulating Mo-S bonds coupling step in CO2 reduction pathways over Sv-In2S3@2H-MoTe2(5)
Indium chloride (InCl3) and sodium hydroxide (NaOH)were purchased from Sinopharm Group Chemical Reagent Co., Ltd.Copper sulfate (CuSO4·5H2O) was purchased from Acros Organics with a purity of over 99.99%.Tellurium powder (Te, more than 200 mesh) was purchased from Shanghai Aladdin Biochemical Technology Co.,Ltd.Hydrazine hydrate (N2H4·H2O) was purchased from Sinopharm Group Chemical Reagent Co., Ltd.Sodium molybdate (Na2MoO4·2H2O) was supplied by Aladdin Reagent Co., Ltd.(Shanghai, China).Polyvinylpyrrolidone (PVP, Mw = 400,000) was provided by Shanghai Ryon Biotechnology Co., Ltd.(Shanghai, China).Sodium thiosulfate (Na2S2O3), with a purity of over 99.5%, was purchased from Shanghai Aladdin Biochemical Technology Co., Ltd.(Shanghai, China).Dimethyl sulfoxide(DMSO) and thioacetamide (C2H5NS) were purchased from Sigma with a purity of over 99.99%.All of the reagents used in our experiments were analytical purity and used without further purification.
2.2 Preparation of In2S3, Sv-In2S3, 2H-MoTe2 and Sv-In2S3@2H-MoTe2
2.2.1 Preparations of the In2S3 SSNBs
The as-prepared In(OH)3single-shelled nanoboxes(SSNBs) and 40 mg of C2H5NS were dispersed into 20 mL of ethanol.The solution was transferred into a Teflon-lined stainless autoclave and heated at 90 °C in an oven for 2 h.The precipitate was harvested by centrifugation, washed with DW and ethanol several times, and subsequently annealed in N2at 300 °C for 2 h to obtain the In2S3SSNBs.
2.2.2 Preparations of the Sv-In2S3 SSNBs
S-vacancies-rich In2S3SSNBs (Sv-In2S3SSNBs) were prepared via an N2H4·H2O-assisted hydrothermal method.Typically, the as-synthesized In2S3SSNBs (100 mg) were dispersed into 20 mL of deionized water for 1 h, and 5 mL N2H4·H2O was added into the mixing solution and stirred for another 30 min.Afterward, the mixture was transferred to a 50 mL autoclave and maintained at a 240 °C oven for 5 h.Finally, the precipitate was separated by centrifugation, washed with DW and ethanol several times, then dried at 60 °C for 10 h.
2.2.3 Sv-In2S3@2H-MoTe2 Double-Shelled Nanoboxes(DSNBs)
The Sv-In2S3@2H-MoTe2DSNBs were synthesized by a similar process to Sv-In2S3SSNBs, except that Na2MoO4·2H2O and Te powders were added to the mixture.The Sv-In2S3@2H-MoTe2DSNBs with a different mass ratio of 2H-MoTe2to Sv-In2S3(1.0%, 3.0%,5.0%, 7.0%, and 9.0%) were synthesized by adjusting the addition of Na2MoO4·2H2O and Te, and the synthesized samples were labeled as Sv-In2S3@2H-MoTe2(1),Sv-In2S3@2H-MoTe2(3), Sv-In2S3@2H-MoTe2(5),Sv-In2S3@2H-MoTe2(7), and Sv-In2S3@2H-MoTe2(9),respectively.For comparison, the pure 2H-MoTe2nanosheets (NSs) were prepared following the above steps without adding Sv-In2S3SSNBs.
2.3 Characterization
The crystal phase properties and morphologies for various samples were analyzed with an X-ray diffraction (XRD) and scanning electron microscopic (SEM) images, respectively.To further determine the morphology and crystal lattice structure of the materials, transmission electron microscopy(TEM) images were taken using a Hitachi H-7650 transmission electron microscope at an acceleration voltage of 100 kV.High-resolution TEM (HRTEM), high-angle annular dark-field scanning transmission electron microscopy(HAADF-STEM), and energy-dispersive X-ray spectroscope(EDX) mapping were carried out on a JEOL ARM-200F field-emission transmission electron microscope operating at 200 kV accelerating voltage.X-ray photoelectron spectroscopy (XPS, ESCALAB250) of Thermo was used to study the element combination and valence of the materials in this work.Temperature programmed desorption (TPD) profiles of the samples were recorded by a Micromeritics AutoChem II 2920 chemisorption analyzer with a thermal conductivity detector (TCD).The Brunauer-Emmett-Teller (BET) specific surface areas and porosity of the samples were determined using micromeritics (ASAP 2460 U.S.A.) surface area and porosity analyzer.The ultraviolet-visible diffuse reflectance spectra (DRS) were recorded using a UV-vis instrument (Japan).Steady-state photoluminescence (PL)and time-resolved photoluminescence (TRPL) spectra were collected on the F-7000 fluorescence spectrophotometer(Japan, Hitachi,λex= 319 nm,λem= 610 nm) and FLS920 fluorescence lifetime spectrophotometer (Edinburgh Instruments, UK), respectively.
2.4 Photocatalytic CO2RR Experiment
The photocatalytic CO2RR measurement was conducted by the Lab Solar-Ш AG system (Perfect light Limited, Beijing).A 300 W Xe lamp equipped with a UV cut-offfilter(λ > 400 nm) was adopted as the light source, calibrated by a CEL-NP2000 Optical Power Meter (Beijing China Education Au-light Co., Ltd.).The intensity of visible-light was 360 mW cm-2.The instrument was initially vacuumtreated 3 times and then pumped with high-purity CO2to reach atmospheric pressure.50 mL of KHCO3(0.5 M)was injected into this setup for further photocatalysis.Gas products were detected using a Barrier Discharge Ionization Detector (BID) detector with gas chromatography(Shimadzu, Nexis GC-2030).1H nuclear magnetic resonance (NMR) spectra were recorded on a Bruker DPX 400 spectrometer to detect the liquid products.
The specific operation for cycling experiments: at first, the cycling stability test was measured by repeating the above operations with a 20 mg sample every 5 h.During the light irradiation, the carbon-based gas products were qualitatively analyzed by Agilent GC7890B gas chromatograph by identifying the chromatographic peaks.Other gas products, such as O2, were analyzed by a thermal conductivity detector.The carrier gas was Ar with a flow rate of 20 mL min-1, and the column temperature was 393 K.All gas products were injected by an automatic online sampler with 1.0 mL gas.After the reaction, the liquid products were quantified by NMR spectroscopy, in which DMSO solution was used as the internal standard.The temperatures of the solutions were controlled at 298 ± 0.2 K by a recirculating cooling water system during visible-light irradiation [9].
2.5 Computational Details
First-principles computations based on the density functional theory (DFT) were implemented in the Vienna Ab initio simulation package (VASP) [10].The generalized gradient approximation (GGA) involving Perdew,Burke, and Ernzerhof (PBE) was used for calculating the exchange-correlation energy [11].A 400 eV of cut-offenergy was adopted for the plane-wave basis set in conjunction with the projector augmented wave (PAW) [12].The energy and force convergence were set to be 1 × 10⁻⁴and 5 × 10⁻²eV, respectively.Here, a vacuum layer of 12 Å is chosen in thezdirection to avoid interactions between periodically repeated slabs.The Brillouin zone was sampled using the Monkhorst-Pack scheme, K-points were generated by VASPkit [13], and the recommended value is 0.04 (2π× 0.04 Å-1).The van der Waals interaction was considered by using the DFT-D3 method [14].
The Gibbs free energy of the intermediates for HER and CO2RR process, that is, *CO2, *OCHO, OH*, CO*, CHO*,CH2O*, CH3O*, and *O, can be calculated as follows:
where ΔEDFT, ΔEZPE, and ΔSare the total energy change,zero-point energy change, and the entropy change (ΔS) of each adsorbed state were calculated according to the standard molar Gibbs energy of formation at 298.15 K.Sis the entropy,his the Planck constant,νis the computed vibrational frequencies,Θis the characteristic temperature of vibration,kis the Boltzmann constant, andRis the molar gas constant.Tis the temperature and is taken as 298.15 K.The entropy of other adsorbed states (TΔS) is calculated from the vibrational frequencies associated with the standard modes in the harmonic approximation [15].The contributions are listed (Tables S8 and S9).For adsorbates,EZPEandSare obtained from vibrational frequency calculations with harmonic approximation, and contributions from the slabs are neglected.In contrast, for molecules, these values are taken from NIST-JANAF thermochemical Tables [16].
3 Result and Discussion
3.1 Structural Characterization
The experimental sections and preparation procedure were provided in Supporting Information and Figs.S1-S3, including the synthesis of hollow In2S3using Cu2O NCs as a template and the subsequent hydrothermal synthesis Sv-In2S3and 2H-MoTe2.With regard to the electron paramagnetic resonance (EPR) spectrum,Sv-In2S3, and Sv-In2S3@2H-MoTe2(5) represent a clear signal atg= 2.076 (Fig.S4a), further reconfirming that Sv-In2S3@2H-MoTe2(5) and Sv-In2S3are rich in S-vacancies species [2, 17].Of great importance, the higher concentration of S-vacancies species in Sv-In2S3@2H-MoTe2(5)leads to significant changes in its electronic structure, steric interaction of chemical bonds and energy density distribution, thereby significantly enhancing its electrical conductivity, which is more beneficial for electrons transfer during photocatalytic CO2RR progress [18, 19].As a comparison, there is no obvious S-vacancies signal of In2S3in EPR spectrum.The XRD patterns of Sv-In2S3and In2S3are well indexed to the tetragonal phase of In2S3(JCPDS No.73-1366), indicating their high purity without any other crystal structure changes (Fig.2a).Interestingly, Sv-In2S3denote almost the same diffraction signals as the In2S3, and there are no other heterogeneous phases, which accounts for that the S-vacancies hardly affects original crystal phase structure of In2S3[20].Figure S5 exhibits that Sv-In2S3@2H-MoTe2(5)possesses a micro/mesoporous structure with the size at range of 0-250 nm, and the average pore diameter is about 4.51 nm (Table S3).Furtherly, Sv-In2S3@2H-MoTe2(5) has increased surface area that helps to increase contact with the reactants and shorten transmission path of the charge carrier[21].According to above analysis, Sv-In2S3@2H-MoTe2(5)has abundant catalytic active sites and porous structures,which is conducive to increase contact area with reactants,and facilitate escape of CH4, CO, and H2, thus improving photocatalytic CO2RR activity.
T h e m o r p h o l o g i c a l ch a r a c t e r i s t i c s o f Sv-In2S3@2H-MoTe2(5), Sv-In2S3, In2S3, and 2H-MoTe2were elaborately analyzed via SEM, TEM, HRTEM,HAADF-STEM, and HAADF-STEM-EDX elemental mapping images, respectively.As depicted in Fig.1, the basic morphology of Sv-In2S3@2H-MoTe2(5) is a doubleshelled nanoboxes composed of a large number of ultrathin nanosheets on the exterior, which facilitates the exposure of active surface and the scattering phenomenon (Mie scattering) [22].The EDX elemental mapping images of Sv-In2S3@2H-MoTe2(5) present that Mo and Te elements are obviously distributed on the outer surface of Sv-In2S3(Fig.1g), illustrating the successful formation of homogeneous nano-heterojunction structures between Sv-In2S3and 2H-MoTe2, which can be further proved that 2H-MoTe2was directly grown and attached to Sv-In2S3.Besides, it can be clearly seen that atomic data ratio of In/S and Mo/Te is about 1.00/1.48 and 1.00/2.05 (Table S1), which is extremely close to stoichiometric ratio in molecular formula of In2S3and 2H-MoTe2.Furtherly, HRTEM images,inverse fast Fourier transform (IFFT) patterns, and lattice fringe profile (LFP) manifest distinctly visible lattice fringes with spacing of 2.47 and 2.20 Å (Fig.1e), pointing precisely to (219) crystal plane of In2S3(JCPDS:73-1366) and(104) crystal plane of 2H-MoTe2(JCPDS:73-1650), respectively.The selected-area-electron-diffraction (SAED) pattern of Sv-In2S3@2H-MoTe2(5) reveals a ring-like pattern of Sv-In2S3and 2H-MoTe2, confirming the presence of S-vacancies and polycrystalline features of composites.

Fig.1 a, b SEM, c, d TEM, e HRTEM images, IFFT (top) and SAED patterns, f HAADF STEM, and g HAADF-STEM-EDS elemental mapping images of Sv-In2S3@2H-MoTe2(5), respectively
3.2 Electronic Structure Analysis
The chemical composition and atomic state information of samples were compared by XPS.The complete scanning spectrogram is shown in Fig.S4b-f, and the specific atomic ratio is displayed in Table S2.In the Mo 3dcore-level spectrum in Fig.S4e, the peaks of 3d5/2and 3d3/2appear on 225.7 and 229.0 eV, belonging to Mo-S bridging bonds in Sv-In2S3@2H-MoTe2(5) [23].The binding energies (B.E.)of Mo4+at 227.9 and 231.1 eV in 2H-MoTe2negatively shift to 225.7 and 228.9 eV in Sv-In2S3@2H-MoTe2(5).It is speculated that the uniform distribution of S-vacancies in Sv-In2S3regulates the coordination environment of 2H-MoTe2, leading to a change in d-band electronic state of Mo [24].The peaks at 159.1 and 161.6 eV in S 2pspectrum (Fig.S4f) represent S 2p3/2and S 2p1/2binding energies of S2-in Sv-In2S3@2H-MoTe2(5).The slight positive shift of S 2ppeak (by 1.47 eV) is also attributed to the interfacial charge transfer of Sv-In2S3and 2H-MoTe2[25,26].The negative shift of S 2pand positive shift of Mo4+indicate the charge transfer from 2H-MoTe2to Sv-In2S3at Sv-In2S3@2H-MoTe2(5) (Fig.S4c).The X-ray absorption fine structure spectroscopy (XAFS) of Mo K-edge and In K-edge was employed to provide in-depth insights into atomic and electronic structure between Sv-In2S3and 2H-MoTe2in Sv-In2S3@2H-MoTe2(5).Figure 2b reveals the X-ray absorption near-edge structure (XANES) spectrum at Mo K-edge of samples along with Mo metal foil and MoS2standard.In Mo and MoS2, Mo exit in 0 and + 4 oxidation states, respectively [27, 28].The absorption edge of samples lies between that of Mo metal foil and MoS2.The Mo K-edge XANES spectrum of Sv-In2S3@2H-MoTe2(5)demonstrates a negative shift in contrast with that of MoS2.The Mo valence of Mo-S bonds in Sv-In2S3@2H-MoTe2(5)discloses a slight increase, corresponding with XPS results.The In K-edge XANES spectra of Sv-In2S3@2H-MoTe2(5)and Sv-In2S3, showed the + 3 valence state of In element in Sv-In2S3@2H-MoTe2(5) and Sv-In2S3(Fig.2b).The In EXAFS spectra shows the dominant peaks at 1.67 and 1.77 Å, corresponding to In - S and In-In coordination(Fig.2c), respectively, which is consistent with XPS results(Fig.S12c).As observed in Figs.2d, f and S6a, b, the extended X-ray absorption fine structure (EXAFS) spectrum for Mo sites shows two prominent peaks contributed by Mo-S and Mo-Mo bonds at 1.99 and 2.85 Å, respectively, implying the existence of Mo-S bridging bonds in Sv-In2S3@2H-MoTe2(5) [29, 30].Furthermore, the Mo K-edge EXAFS spectrum of Sv-In2S3@2H-MoTe2(5) demonstrates a positive radial distance shift (0.13 Å) of Mo-S bonds compared to MoS2, further confirming the existence of Mo-S bridging bonds [31, 32].In 2D color patch image obtained after EXAFS signal via wavelet transformation(WT), a high energy signal (red area) appears at 8.5 Å for Sv-In2S3@2H-MoTe2(5) (Fig.2f) and MoS2(Fig.S6c),which corresponds to signal of Mo-Mo coordination bond[24, 33].
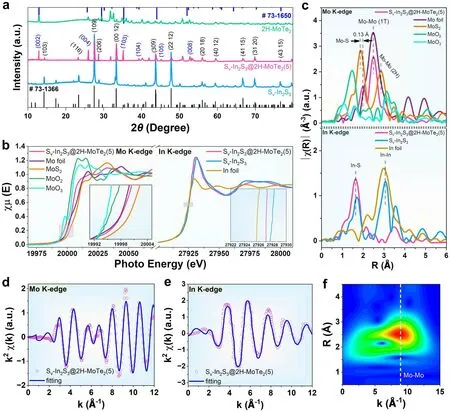
Fig.2 a XRD patterns of 2H-MoTe2, In2S3, Sv-In2S3, and Sv-In2S3@2H-MoTe2(5), respectively.b Comparison of Mo and In K-edge XANES spectra.c k3-weighted FT-EXAFS spectra of Mo and In at R space.d Mo K-edge EXAFS and e In K-edge EXAFS for Sv-In2S3@2H-MoTe2(5),shown in k2 weighted k-space.f WT for k3 weighted EXAFS contour plots of Sv-In2S3@2H-MoTe2(5)
The difference in charge density between Sv-In2S3and 2H-MoTe2can visually reflect the carrier transfer.In Fig.4h and Fig.S14d, 3D charge density difference of Sv-In2S3@2H-MoTe2(5) presented the existence of interfacial charge transfer between Sv-In2S3and 2H-MoTe2.It can be found from illustration that, the carriers are spontaneously transferred from Sv-In2S3to 2H-MoTe2through the boundary, whereas holes gather on the side of Sv-In2S3in Sv-In2S3@2H-MoTe2(5).Consequently, the charge accumulation occurred on 2H-MoTe2, whereas charge loss was observed on Sv-In2S3[34].Finally, a strong built-In electric field (IEF) of Mo-S bonds from Sv-In2S3to 2H-MoTe2is established on account of the redistribution of electrons after the contact between Sv-In2S3and 2H-MoTe2[35].The interfacial electrostatic interaction allows the electrons in conduction band (CB) of 2H-MoTe2to recombine with the holes in valence band (VB) of Sv-In2S3through Mo-S bridging bonds, resulting in effective retention of electrons in CB of Sv-In2S3.
3.3 Photocatalytic CO2RR Performance
CO2-TPD experiments were carried out on the photocatalyst to further explore the adsorption of CO2.Figure 3a presents CO2-TPD profiles of 2H-MoTe2, Sv-In2S3, and Sv-In2S3@2H-MoTe2(5), revealing the presence of prominent peaks in investigated temperature range and thus suggesting moderately primary CO2adsorption centers on the surface of photocatalyst.The hollow porous nature of Sv-In2S3@2H-MoTe2(5) (Fig.S5) enables high CO2capture capability (36.83 cm3g-1, Fig.3b), facilitating CO2RR on Sv-In2S3@2H-MoTe2(5).Herein, the higher CO2adsorption capacity of Sv-In2S3@2H-MoTe2(5) is due to its chemisorption for CO2through the stronger coordination interaction of CO2with Mo (+ 4) (Scheme 1, Mo-S bridging bonds).The photocatalytic CO2RR activity was evaluated via analyzing raw material and gas products produced at gas-solid interface in the absence of cocatalysts and photosensitizers(Fig.S7).The main products were examined by gas chromatography-mass spectra (GC-MS).During photocatalytic CO2RR process, the principal reduction products in system are CO, CH4, and H2, which is consistent with the previous reports in similar scenarios.The Sv-In2S3@2H-MoTe2(5),In2S3, and Sv-In2S3show relatively lower photocatalytic CO2RR activity, with CH4-evolution rates of 13.97, 1.53,and 2.32 μL h-1, respectively (Figs.3d, e and S8a), nevertheless, 2H-MoTe2can hardly photocatalytic CO2RR, in good accordance with above characterizations.In particular,the CO2-to-CH4conversion rate of Sv-In2S3@2H-MoTe2(5)reaches up to 70% (CH4selectivity: 79.6%) with an optimum apparent quantum efficiency (AQE) value of 16.5% at 420 nm (Fig.S8b), which is comparable to most reported CO2-to-CH4conversion rate at similar reaction conditions(Fig.S8c and Table S10).The remarkable CO2-to-CH4conversion efficiency of Sv-In2S3@2H-MoTe2(5) can mainly be due to the Mo-S bridging bonds and robust built-IEF.As depicted in Fig.S8d, the variation tendency of CO, H2, and CH4production are consistent with characteristic absorption spectrum of Sv-In2S3@2H-MoTe2(5), which strongly sustains that photocatalytic CO2RR is driven via the inter-band transition electrons of Sv-In2S3@2H-MoTe2(5).Moreover,the control experiments in different conditions (Fig.3c)confirm that the detected products are indeed derived from the reaction between CO2and H2O, catalyzed by the samples, which is further affirmed via the result of13CO2labeling experiment in Fig.S9.Compared with pristine In2S3,Sv-In2S3with rich S-vacancies exhibits superior performance and excellent long-term stability.The photocatalytic performance of Sv-In2S3@2H-MoTe2(5) was also tested in pure water.The production rate of CH4decreased in pure water as compared with those (Fig.S10).

Fig.3 a CO2-TPD spectra of Sv-In2S3, 2H-MoTe2, and Sv-In2S3@2H-MoTe2(5), respectively.b CO2 adsorption isotherms of samples at 298 K.c Control experiments in several conditions.d CO2 conversion and product selectivity.e Yields of CO, CH4, and H2 for photocatalysts (KHCO3 solution).f AQE, IQEcr, and absorption spectrum of Sv-In2S3@2H-MoTe2(5).g Stability test of with Sv-In2S3@2H-MoTe2(5) in 6 cycles,where each photocatalytic cycle lasted for 5 h (KHCO3 solution).All the experiments were repeated at least 3 times in parallel to obtain an average value
As displayed in Fig.3f, the calculated data present higher values for AQE analysis of Sv-In2S3@2H-MoTe2(5) at different wavelengths, compared with than that of 2H-MoTe2,In2S3, and Sv-In2S3(See Table S8 for details of the calculation results), further evaluating photocatalytic CO2RR activity.Moreover, Sv-In2S3@2H-MoTe2(5) displays the highest AQE (65.29%) at 380 nm, being higher than most reported values (Table S9).Assisted by the robust built-IEF and Mo-S bonds of Sv-In2S3@2H-MoTe2(5), “S”-scheme charge separation is notably facilitated, resulting in an IQE calculated via photocatalytic CO2RR of 94.01% (IQEcr)at 380 nm.This phenomenon proves the effective utilization of Mo-S bridging bonds and a breakthrough in IQE for Sv-In2S3@2H-MoTe2(5) (Table S7).More specifically,cycling stability is also an important index to assessed the performance of photocatalyst in practical commercial use.Therefore, the stability of Sv-In2S3@2H-MoTe2(5),Sv-In2S3, 2H-MoTe2, and In2S3was evaluated via cyclic stability tests in this work, respectively.As displayed in Fig.3g, there is no remarkable decrease in evolution of CH4, CO, and H2, after 6 cycles of reaction using Sv-In2S3@2H-MoTe2(5).According to the XRD patterns and TEM images (Fig.S11a-c) after 6 cycles test, the morphology and crystal structure of Sv-In2S3@2H-MoTe2(5)have not changed significantly.Especially, XPS and EXAFS measurement was further used to study the change in chemical composition and atomic state before and after CO2RR(Figs.S11d, e and S12).Noteworthily, there is no peak shift in Sv-In2S3@2H-MoTe2(5) after cyclic stability test.The above experimental results and analysis can prove outstanding morphology and structure of Sv-In2S3@2H-MoTe2(5).

Fig.4 a PL spectra of samples (excitation wavelength = 300 nm).Fs-TA spectra of b Sv-In2S3, c In2S3, d 2H-MoTe2, and e Sv-In2S3@2HMoTe2(5) measured at different delay times, respectively (320 nm excitation).f SPV spectra of samples.g Comparison of normalized exciton bleach signal decay between Sv-In2S3 and 2H-MoTe2 (the curves were fitting results using Equation S1 and S2).h Differential charge density map of Sv-In2S3@2H-MoTe2(5) (magenta area (positive value) and cyan area (negative value) represent accumulation and consumption of electrons, respectively).i IQEpc as a function of illumination photon energy for samples.j IQEpc as a function of multiples of bandgap (hυ/Eg) of samples for samples (mean values with error bars showing s.d.for 3 measurements)
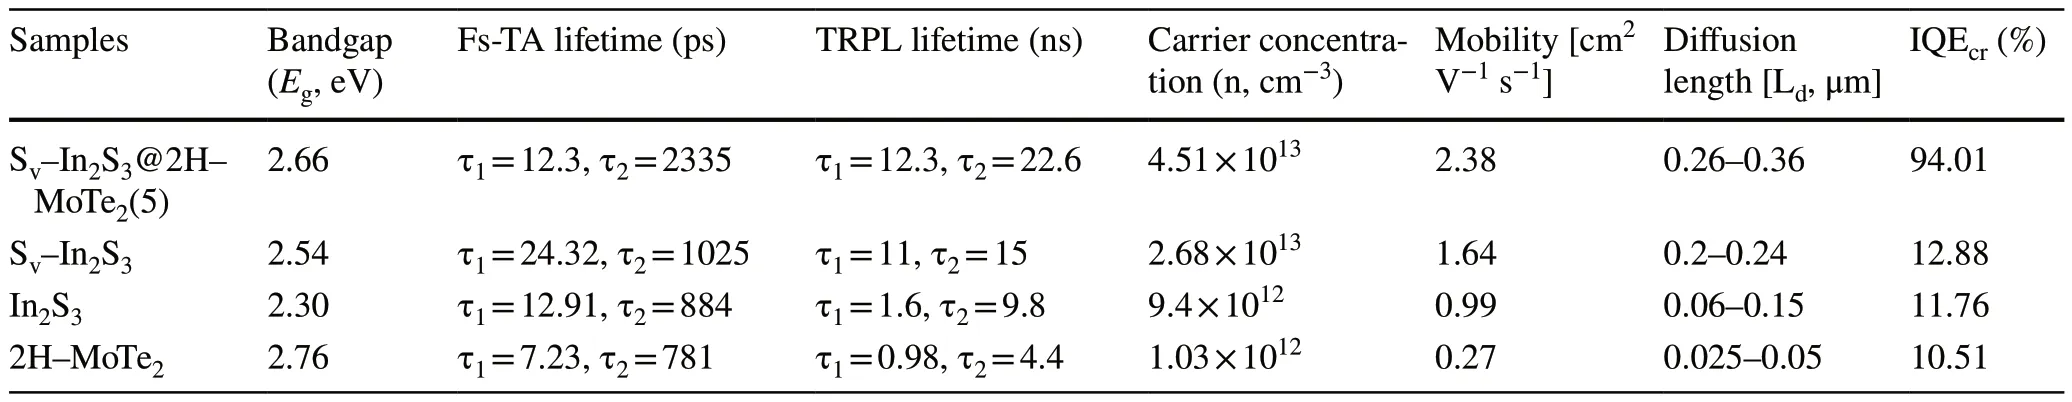
Table 1 Carrier transport characteristics of samples
3.4 Photoelectric Performance Analysis
We evaluate the recombination of charge carriers through steady-state PL, ultrafast femtosecond transient absorption(fs-TA) spectroscopy, and TRPL spectra to study photocatalytic CO2RR activity.Clearly, 2H-MoTe2exhibits strongest emission peak is corresponding to the rapid recombination of electrons-holes pairs (Fig.4a), suggesting enhanced electronic conductivity of Sv-In2S3@2H-MoTe2(5).Among them, Sv-In2S3@2H-MoTe2(5) illustrates the weakest emission peak, consistent with their optimal photocatalytic CO2RR performance [36].The fs-TA spectroscopic experiments were carried out on Sv-In2S3@2H-MoTe2(5) exited at λ = 320 nm in CO2atmosphere to further gain insight into electrons transfer dynamics during photocatalytic CO2RR process.For the purposes of comparison, we also recorded fs-TA spectra of Sv-In2S3, In2S3, and 2H-MoTe2under the same test condition.After excitation of Sv-In2S3, a bleaching peak was observed at 474 nm, and the peak strength decreased with increasing delay time, which indicated that the recombination of a fraction of electrons and holes occurred in Sv-In2S3with prolonged delay time (Fig.4b).Similar phenomenon is obtained for In2S3(Fig.4c), indicating that the relaxation process of Sv-In2S3@2H-MoTe2(5) and Sv-In2S3under bandgap excitation is similar.For 2H-MoTe2, the strong and broad photoinduced bleaching peaks are observed at 442 nm, which is attributed to the generation of photoexcited holes in VB of 2H-MoTe2[37, 38].As delay time increased to 3 ns, these peaks are not observed in 2H-MoTe2owning to the recombination of electrons and holes (Fig.4d).Noteworthily, when Sv-In2S3was introduced into 2H-MoTe2, the peak strength of Sv-In2S3at 475 ~ 550 nm increased with increasing delay time(Fig.4e, h), indicating that electrons transfer from 2H-MoTe2to Sv-In2S3[37], which is completely consistent with the analysis results in Figs.S13-S15a.More specifically, the energy band structure of Sv-In2S3is in good agreement with that of 2H-MoTe2, and can attain the thermodynamic conditions for the spontaneous photocatalytic CO2RR process.The analysis of recovery kinetics discloses that the best decay fitting provides a bi-exponential function with two-time constants ofτ1= 72.54 ps andτ2= 2335 ps for Sv-In2S3@2H-MoTe2(5)(Fig.4g).Theτ1andτ2are attributed to the electron dynamics related to different electronic trap states with energies lie within the bandgap of Sv-In2S3@2H-MoTe2(5).These two near-band edge trap states accumulate photogenerated electrons from bottom of CB in a bi-exponential relaxation (Fig.S15a) [39].The longer carrier lifetime and stronger positive absorption of Sv-In2S3@2H-MoTe2(5) are further evidenced via the Hall effect measurement.The Hall effect measurement at 300 K reveals that Sv-In2S3@2H-MoTe2(5) possesses a carrier concentration of 4.51×1013cm-3, an estimated carrier mobility of 2.38 cm2V-1s-1(Table 1).The TRPL spectra in Fig.S15b and Table S6 display that Sv-In2S3@2H-MoTe2(5)presents longer retention time (20.8 ns) of photoinduced carriers than that of Sv-In2S3(9.2 ns) due to the introduction of 2H-MoTe2(179 ns), which further demonstrates the effective restraining effect to electrons-holes recombination.The carrier diffusion lengths (Ld) are estimated to be in range of 0.26-0.36 μm for Sv-In2S3@2H-MoTe2(5), and 0.025-0.05 μm for 2H-MoTe2, respectively (Table 1).Besides,the surface photovoltage (SPV) spectra were also conducted to validate its carrier transfer mechanism, as shown in Fig.4f.It is noted that 2H-MoTe2present no SPV signals in whole wavelength, illustrating the poor photocarrier separation efficiency.That’s why 2H-MoTe2perform extremely poorly CO2RR activity.In comparison, a significant positive photovoltage response can be observed in SPV spectra of In2S3and Sv-In2S3, illustrating that the holes migrate to the surface of In2S3and Sv-In2S3, which is a typical trait of n-type semiconductors.Besides, in SPV spectra, unlike the positive photovoltage signal of 2H-MoTe2and Sv-In2S3, a negative and significantly enhanced photovoltage signal at 300-430 nm emerged in Sv-In2S3@2H-MoTe2(5), demonstrating that the photogenerated electrons of Sv-In2S3and holes of 2H-MoTe2, transferred to illumination side and backlight side, respectively, and the remained electrons of 2H-MoTe2recombined with holes of Sv-In2S3through a built-IEF, which further reveals the effi-cient interfacial charge transfer within the heterojunction via a“S”-scheme pathway.
The incident photon-to-current efficiency (IPCE)and corresponding IQEpcwere measured under different wavelengths of monochromatic light irradiation to investigate the photoelectric conversion efficiency of Sv-In2S3@2H-MoTe2(5) [40].The IPCE profiles of Sv-In2S3@2H-MoTe2(5) at different wavelengths are consistent with the above optical absorption results (Fig.S15c),verifying excellent carrier transfer and separation.The IQEpcwas assessed by normalizing the IPCE values to the measured absorption curve of Sv-In2S3@2H-MoTe2(5),Sv-IS SSNBs, In2S3, and 2H-MoTe2.The IQEpccurves of Sv-In2S3, In2S3, and 2H-MoTe2remain flat in total wavelength range (380-520 nm), while the IQEpccurves of Sv-In2S3@2H-MoTe2(5) show an upward trend when Sv-In2S3and 2H-MoTe2were combined to form Mo-S bridging bonds (Fig.4i, j).Intriguingly, the Sv-In2S3@2H-MoTe2(5) discloses the maximum IQEpcvalue of 91.1% at 320 nm, indicating enhanced exciton extraction force driven by a strong built-IEF at the interface between Sv-In2S3and 2H-MoTe2.To further validate our perception,the IQEpccurves vs.Egof Sv-In2S3@2H-MoTe2(5), Sv-In2S3,In2S3, and 2H-MoTe2are plotted to elucidate the photon absorption and conversion in Sv-In2S3@2H-MoTe2(5).The IQEpcof Sv-In2S3@2H-MoTe2(5) gradually increases when the incident photon energy exceeds 1.11 times theEgof 2H-MoTe2, significantly promoting charge transport and separation within Sv-In2S3@2H-MoTe2(5), which is mainly due to possibility of multiple exciton production in 2H-MoTe2[41].
3.5 Relationship Between Mo-S Bridging and CO2RR Activity
In situ diffuse reflectance-Infrared Fourier transform spectroscopy (DRIFTS) and in situ high-resolution XPS spectroscopy were performed to correlate surface characteristics to the efficiency of photocatalytic CO2RR progress.The analysis results are shown in Fig.5.From 0 to 60 min, new absorption peaks perceptibly appear with increasing light time and their intensity gradually increase.The observation of new infrared peak at 1127 cm-1gradually increases,which can be ascribed to the CH3O* intermediates (the asterisk denotes the catalytically active sites), while the peak at about 1040 cm-1can be assigned to the characteristic bands of CHO*.The peaks at 1560 and 1630 cm-1are attributed to the COOH*, which is generally regarded as the key intermediates of CO2photoreduction to CH4or CO, as well CH3OH [42, 43].The peaks at 1430 cm-1are corresponded to symmetric stretching of HCO3*, respectively.The formation of monodentate carbonate (m-CO32-) and bidentate carbonate (b-CO32-) are evidenced from infrared peaks of around 1368 and 1329 cm-1, respectively (Fig.5a) [44, 45].Similar phenomenon is obtained for Sv-In2S3(Fig.5b).The in situ XPS was used to study changes of hydrocarbons on the surface of Sv-In2S3@2H-MoTe2(5) during photocatalytic CO2RR process.In dark state, no peak of gas-phase CH4(286.9 eV) is observed (Fig.5c, d), illustrating that photoreduction of CO2-CH4is light-driven.In contrast, with the gradual increase of light, a peak of surface-CHxspecies appears at about 285.8 eV, further supporting the dissociation of generated CH4at the surface of catalyst to form H2,which is why we detected the presence of H2product in mixing products.
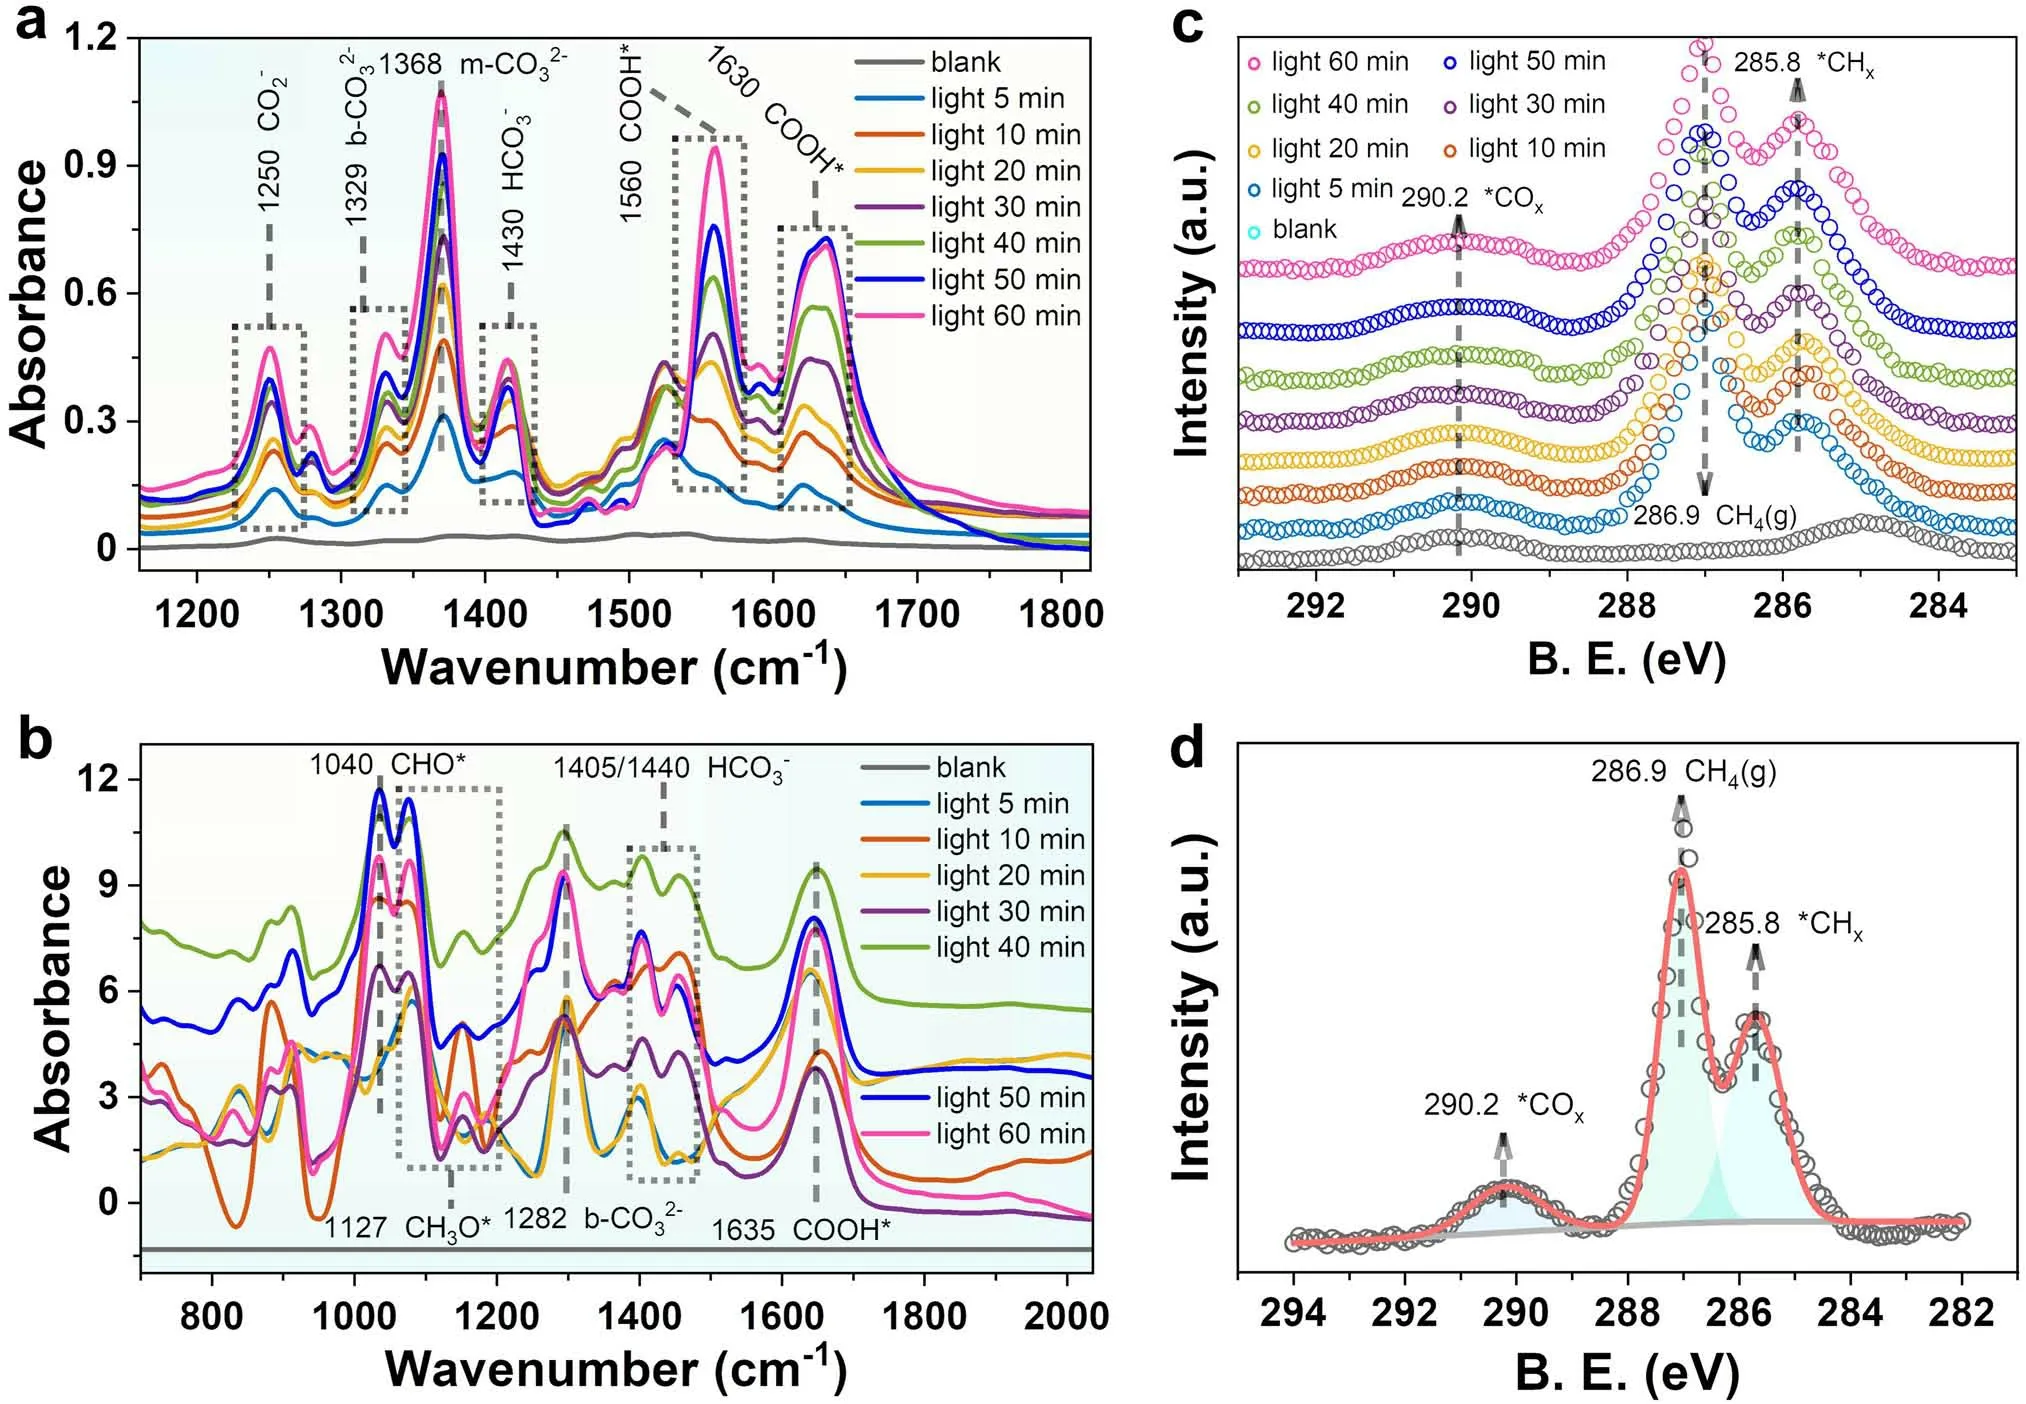
Fig.5 In situ DRIFTS spectra for photocatalytic CO2RR over a Sv-In2S3@2H-MoTe2(5) and b Sv-In2S3.c In situ high-resolution C 1s XPS spectra of Sv-In2S3@2H-MoTe2(5) with different light illumination time.d C 1s near ambient pressure XPS (NAP-XPS) collected for CH4 conversion over Sv-In2S3@2H-MoTe2(5) under light illumination at 5 min
In terms of the above analyses, the DFT simulations were performed to gain in-depth insights into Mo-S bridging bonds mechanism toward CO and CH4products on Sv-In2S3@2H-MoTe2(5).In this research, in order to more accurately explain thermodynamic process of photoreduction of CO2-CO, H2, and CH4, we introduced S-vacancies into structure of In2S3under visible-light irradiation and determined the most optimal position for S-vacancies to participate in photocatalytic reaction (Fig.S22).Initially, CO2will be gradually adsorbed on the surface of Sv-In2S3@2H-MoTe2(5), and H2O in solution will be concomitantly dissociated and produce hydroxide ions (OH¯)and H+.It is worth noting that path 1 is an endothermic during the reaction (ΔG> 0), so it is not considered here(Fig.S23).The Gibbs free energy analysis curves for photocatalytic CO2-to-CH4process (path 2) with the lowest energy pathway on the surface of Sv-In2S3@2H-MoTe2(5)was calculated in detail, as shown in Fig.6.During reaction process of photocatalytic CO2RR to form CO, H2, and CH4, seven intermediate products can be produced, which are *OCHO, OH*, CHO*, CH2O*, CO*, O*, and CH3O*,respectively.The other *CO on the surface diffuse toward S-vacancies and couple with those reaction intermediates to produce CH4(Fig.6a, b).The CH4free energy diagrams are summarized in Fig.6c, while the corresponding minimum energy reaction pathways are presented in Fig.6d.The diagram of free energy calculations illustrates that the reaction process of *OCHO-CO(g) and *OH is a potentially decisive step (ΔG= - 0.84 eV).Initially, the CO2energetically favor Mo-S bridging bonds sites from CO2-CO.When one H atom approaches the adsorbed CO2, it can form *OCHO[46].Noteworthily, the S-vacancies can promote activation of CO2, reduce energy barrier for the formation of *OCHO,and promote charge transfer to *OCHO, thereby promoting CO2RR to form CO [47].Furtherly, the formation of*OCHO is the step with the highest energy barrier in the formation of final CH4, and thus, the *OCHO will transition to OH*.The ΔG of CO* desorption is around - 0.51 eV lower than that of CHO* (Fig.6c and Fig.S18a), resulting in a mixture of final products with CO, H2, and CH4at Mo-S bridging bonds sites during CO2RR process.It should be emphasized that CO desorption on Sv-In2S3@2H-MoTe2(5)is an exothermic process.In contrast, the hydrogenation of CO*-CHO* is spontaneously exothermic, namely ΔG< 0,resulting in a better selectivity for photoreduction of CO2-CO, which perfectly accords with above results analysis of the CO2-TPD (Fig.3a).
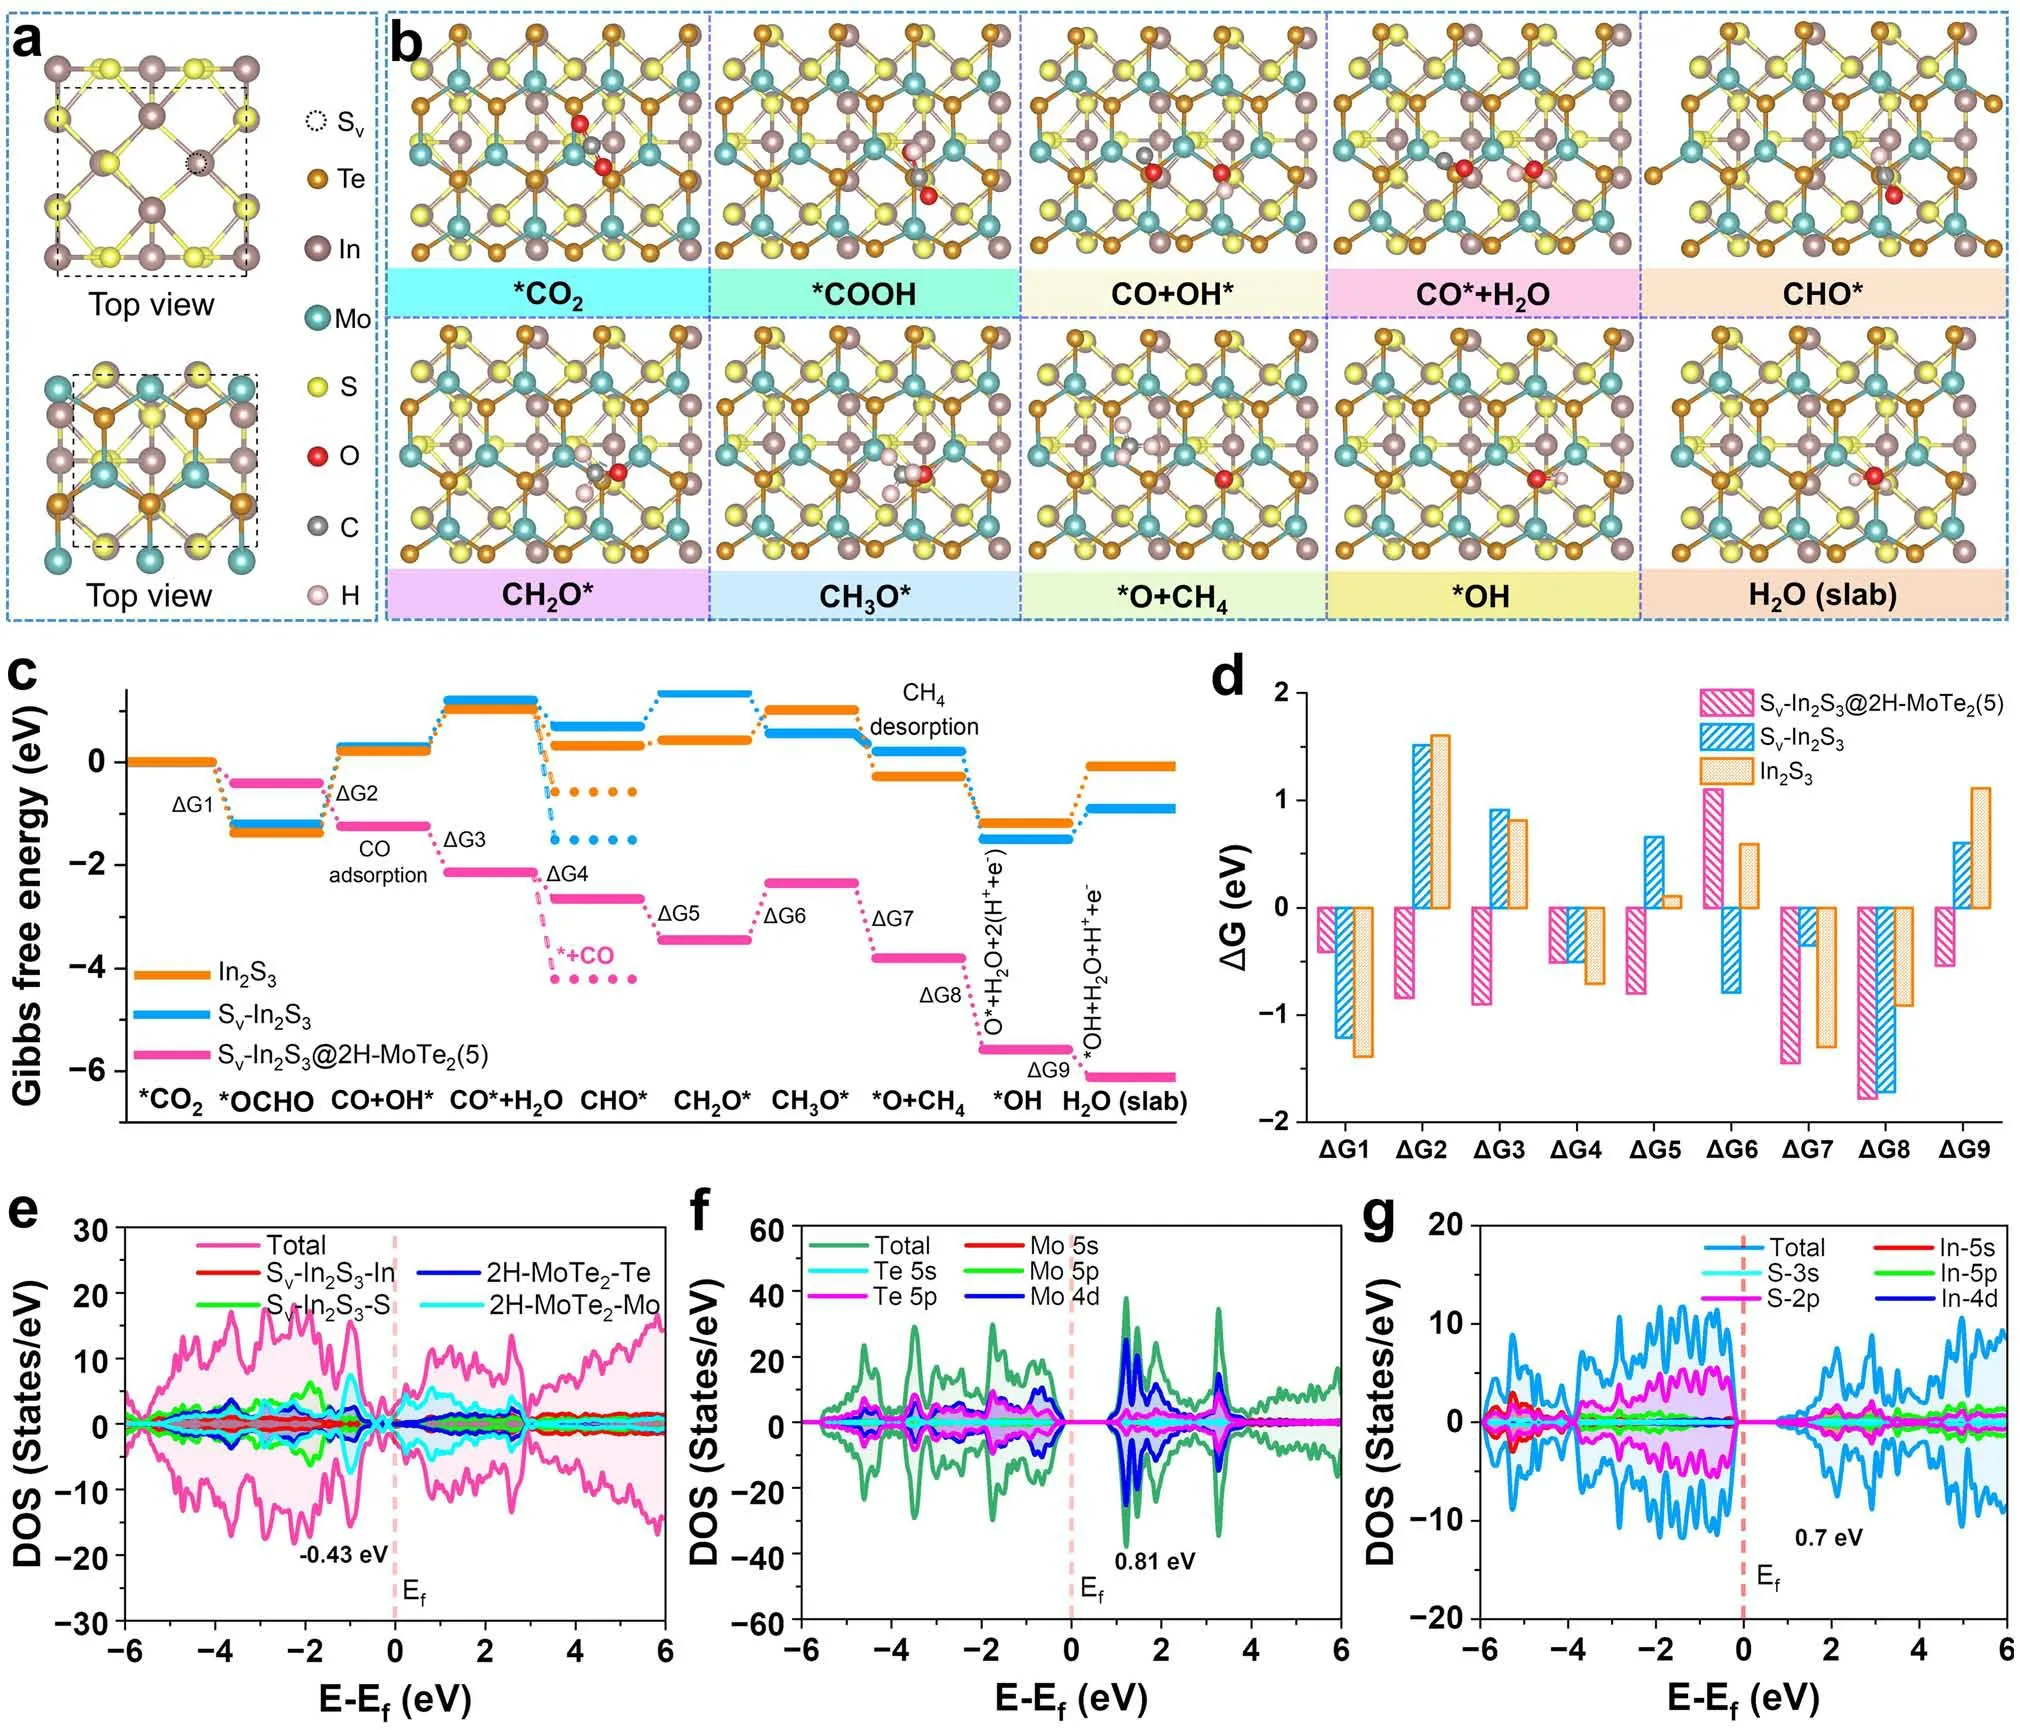
Fig.6 a Atomic models of Sv-In2S3@2H-MoTe2(5) in theoretical calculations.b Schematic illustration of adsorption atomic structures during CO2RR process on over Sv-In2S3@2H-MoTe2(5) interfaces.c Schematic Gibbs energy profiles and d energy changes for CO2RR pathway at 1.23 V on different active sites for Sv-In2S3@2H-MoTe2(5), Sv-In2S3, and In2S3, respectively.The calculated DOS of e Sv-In2S3@2HMoTe2(5), f 2H-MoTe2, and g Sv-In2S3
We also explored reaction energy barriers of Sv-In2S3@2H-MoTe2(5) for H2O splitting under alkaline conditions.As shown in Fig.S18a-c, we constructed the reaction path of alkaline HER, including previous water dissociation to the formation of H* (Volmer step)and H2generation (Tafel step or Heyrovsky step).The 2H-MoTe2shows the highest H-OH adsorption energy(ΔGads= 1.21 eV) andH* adsorption energy barrier(ΔGH*= 0.55 eV), suggesting that the strong H* adsorption energy of In2S3will hinder the evolution of H2, resulting in slow HER kinetics, which is consistent with the experimental results (Fig.3e).The d-band center position of catalysts is an important factor that determines the adsorption energy of intermediates.Significantly,the combined analysis of free energy and density of state(DOS) calculations and electrostatic potentials simulation present apparent evidence for step-by-step reactions of Sv-In2S3, In2S3, and Sv-In2S3@2H-MoTe2(5) promoted via modulation of active sites and electronic structures[48].An upshifted d-band center toward Fermi level reveals enhanced adsorption of intermediates.This is duo to the higher energy level of the d-band center allows for stronger interaction between photocatalyst and intermediates, leading to more efficient photocatalytic CO2RR [49].The Sv-In2S3@2H-MoTe2(5) has a significantly upshifted d-band center (-0.43 eV) compared to Sv-In2S3(0.70 eV)and 2H-MoTe2(0.81 eV) (Fig.6e - g), illustrating that Sv-In2S3@2H-MoTe2(5) should possess a stronger binding strength for CO2RR intermediates.Herein, we demonstrate that the introduction of Mo-S bridging bonds to construct heterogeneous structures tailors the d-band center,which in turn affects the adsorption capacities of different intermediates (Scheme 1) and ultimately optimizes CO2RR activity.The cyan and magenta regions indicate electron depletion and accumulation (Figs.4 h and S14d),respectively.This result can be derived from influence of S-vacancies on the electronic structure of enhanced damage prevention in Sv-In2S3@2H-MoTe2(5) interfaces.
4 Conclusion
In summary, inspired by the construction of a strong IEF that can elevate d-band center to Fermi level, we elaborately designed a double-shelled nanoboxes structure,an ultrathin 2H-MoTe2coated Sv-In2S3to form Mo-S bridging bonds sites for CO2RR.The in situ characterization and DFT calculations affirmed that a strong interfacial electric field of Sv-In2S3@2H-MoTe2(5) can reduce adsorption energy barriers of *OCHO and *CHO, and significantly enhance reaction rate of the rate-determining step on the surface of Mo-S bridging bonds.The S-vacancies can promote activation of CO2, reduce energy barrier for the formation of *OCHO, and promote charge transfer to *OCHO, thereby promoting CO2RR to form CO.Furthermore, the charge difference leads to the formation of polarization sites of Mo at the interface, which inhibits the electrostatic repulsion of adjacent intermediates and promotes formation of CO and CH4.This study reveals that the interfacial electric field in Sv-In2S3@2H-MoTe2(5) can obviously facilitate CO2RR via tuning the d-band center of Mo and adsorption of intermediates, which provides a guideline for future rational fabrication and construction of catalysts for CO2RR and other related reactions.
AcknowledgementsThis work is supported by the Natural Science Foundation of China (11922415, 12274471), Guangdong Basic and Applied Basic Research Foundation (2022A1515011168,2019A1515011718, 2019A1515011337), the Key Research and Development Program of Guangdong Province, China(2019B110209003).
FundingOpen access funding provided by Shanghai Jiao Tong University.
Declarations
Conflict of interestThe authors declare no interest conflict.They have no known competing financial interests or personal relationships that could have appeared to influence the work reported in this paper.
Open AccessThis article is licensed under a Creative Commons Attribution 4.0 International License, which permits use, sharing,adaptation, distribution and reproduction in any medium or format,as long as you give appropriate credit to the original author(s) and the source, provide a link to the Creative Commons licence, and indicate if changes were made.The images or other third party material in this article are included in the article’s Creative Commons licence, unless indicated otherwise in a credit line to the material.If material is not included in the article’s Creative Commons licence and your intended use is not permitted by statutory regulation or exceeds the permitted use, you will need to obtain permission directly from the copyright holder.To view a copy of this licence, visit http:// creat iveco mmons.org/ licen ses/ by/4.0/.
Supplementary InformationThe online version contains supplementary material available at https:// doi.org/ 10.1007/s40820- 023- 01221-3.

- Nano-Micro Letters的其它文章
- Multiphase Interfacial Regulation Based on Hierarchical Porous Molybdenum Selenide to Build Anticorrosive and Multiband Tailorable Absorbers
- Atomic Dispersed Hetero-Pairs for Enhanced Electrocatalytic CO2 Reduction
- Artificial Intelligence Meets Flexible Sensors:Emerging Smart Flexible Sensing Systems Driven by Machine Learning and Artificial Synapses
- Structural Isomers: Small Change with Big Difference in Anion Storage
- Engineering Strategies for Suppressing the Shuttle Effect in Lithium-Sulfur Batteries
- Intelligent Recognition Using Ultralight Multifunctional Nano-Layered Carbon Aerogel Sensors with Human-Like Tactile Perception