Climate-growth relationships of Pinus tabuliformis along an altitudinal gradient on Baiyunshan Mountain,Central China
Xiaoxu Wei · Jianfeng Peng,2 · Jinbao Li ·Jinkuan Li · Meng Peng · Xuan Li · Yameng Liu ·Jiaxin Li
Abstract A set of standard chronologies for tree-ring width (TRW),earlywood width (EWW) and latewood width (LWW) in Pinus tabuliformis Carr.along an altitudinal gradient (1450,1400,and 1350 m a.s.l.) on Baiyunshan Mountain,Central China to analyze the effect of varying temperature and precipitation on growth along the gradient.Correlation analyses showed that at all three altitudes and the TRW and EWW chronologies generally had significant negative correlations with mean and maximum temperatures in the current April and May and with minimum temperatures in the prior July and August,but significant positive correlations with precipitation in the current May.Correlations were generally significantly negative between LWW chronologies and all temperatures in the prior July and August,indicating that the prior summer temperature had a strong lag effect on the growth of P. tabuliformis that increased with altitude.The correlation with the standardized precipitation evapotranspiration index (SPEI) confirmed that wet conditions in the current May promoted growth of TR and EW at all altitudes.Significant altitudinal differences were also found;at 1400 m,there were significant positive correlations between EWW chronologies and SPEI in the current April and significant negative correlations between LWW chronologies and SPEI in the current September,but these correlations were not significant at 1450 m.At 1350 m,there were also significant negative correlations between the TRW and the EWW chronologies and SPEI in the prior October and the current July and between LWW chronology and SPEI in the current August,but these correlations were not significant at 1400 m.Moving correlation results showed a stable response of EWW in relation to the SPEI in the current May at all three altitudes and of LWW to maximum temperature in the prior July–August at 1400 m from 2002 to 2018.The EWW chronology at 1400 m and the LWW chronology at 1450 m were identified as more suitable for climate reconstruction.These results provide a strong scientific basis for forest management decisions and climate reconstructions in Central China.
Keywords Tree rings · Climate response · Altitudinal gradient · Baiyunshan Mountain · Pinus tabuliformis Carr
Introduction
Tree rings can provide accurate dating and annual resolution for the study of past climate change in most regions of the world (Shao 1997;Cook et al.2010).Many tree-rings have been used to analyze tree growth responses to climate change and for climate reconstructions in Northwest China,Northeast China,and the Qinghai-Tibet Plateau (Liu et al.2002,2009;McGregor et al.2010;Song et al.2014;Yang et al.2014;Gao et al.2020;Yang et al.2021a,b).Most of the previous studies have been based on the width of the whole ring,which is often unable to reveal climatic signals in regions with complex climatic conditions.Because earlywood (EW) and latewood (LW) form in different seasons and may contain seasonal climatic signals,they have the potential to show stronger or different climate signals than the whole ring can (Zhao et al.2017a,2017b,2019).Therefore,the usefulness of EW and LW width chronologies is worth exploring for the study climate-growth relationships and to reconstruct past climates.
Tree-ring formation is not only influenced by climatic factors and tree genetic characteristics,but also closely related to the microenvironment of the tree (Wu 1990).The terrain(e.g.,altitude,aspect) regulates the regional climate through variations in light,temperature and precipitation,creating different microenvironments in the same area (Wu 1990).Altitude greatly influences the microenvironment and thus tree growth in the mountains (Shi et al.2012;Wang et al.2015;Peng et al.2019;Rai et al.2020;Yu and Liu 2020;Wu et al.2023) because of vertical variations in hydrothermal conditions and topographic effects on precipitation (Fritts 1976;Cai et al.2020).Similarly,the growth of EW and LW in response to climate can also differ in an area due to varying terrain (Torbenson et al.2016).For instance,Zhao et al.(2017a) found a significant difference in the response of LW ofTsuga longibracteatato summer moisture at different sites,whereby tree growth was positively responsive to precipitation and negatively responsive to temperature at sites with good drainage and sufficient sunlight,but only positively correlated with temperature at sites with a high water-holding capacity.Therefore,the impacts of altitude on tree radial growth response to climate must be understood in order for tree rings to be used for climate reconstruction.
The Qinling Mountains,the north–south climatic transition zone in China,have complex forest ecosystems and climate conditions.It has become a hot spot for tree-ring studies because the trees in this region are highly sensitive to various climatic factors (Qin et al.2022).Pinus tabuliformisCarr.(Pinaceae),a warm-temperate southern boundary tree,is widely distributed at 1000–1200 m a.s.l.in the Qinling Mountains (Liu 2015),is sensitive to climate factors in this transitional area (Yang et al.2022),and has been extensively used for tree-ring studies (Cai et al.2008,2012;Tian et al.2009;Liu et al.2015).For example,Cai et al(2012) established a 113-year tree-ring width chronology ofP.tabuliformisto reconstruct the winter-spring minimum temperature in the Taibai Mountains.In the eastern Qinling Mountains,studies on tree-ring width ofP.tabuliformiswere mainly carried out in the Funiu Mountains (Tian et al.2009;Shi et al.2012;Wang et al.2016;Zhao et al.2019;Peng et al.2020;Cui et al.2021;Yang et al.2021a,b;Li et al.2022;Peng et al.2022).They either analyzed relationships between tree growth and climate factors (Wang et al.2016;Cui et al.2021;Li et al.2022;Peng et al.2022)or reconstructed temperatures (Tian et al.2009;Yang et al.2021a,b) using tree-ring width chronologies.One exception is that Zhao et al.(2019) studied climate-growth responses by separately analyzing EW and LW in tree rings.They found that early-summer hydroclimatic signals were captured well in EW in the Funiu Mountains and reconstructed the May–July self-calibrated palmer drought severity index(scPDSI) using the EW chronology.However,tree growth response to climate with altitude in the Funiu Mountains has only been investigated using whole tree rings ofP.armandii(Peng et al.2018),and no study has analyzed the response of EW and LW to climate at different altitudes.
In the present study,P.tabuliformissamples were collected along an altitudinal gradient on the north slope of Baiyunshan Mountain in the Funiu Mountains.Tree-ring width (TRW),earlywood width (EWW) and latewood width(LWW) chronologies were determined to analyze their growth in response to climatic conditions and altitude and determine the stability of the climate-growth relationships.Finally,we assessed the adaptability ofP.tabuliformisto environmental factors on Baiyunshan Mountain,which will inform local forest management and climate reconstruction in the future.
Materials and methods
Study area
The Baiyunshan National Nature Reserve is in the Funiu Mountains on the eastern edge of the Qinling Mountains,with the highest peak 2216 m a.s.l.This reserve is rich in plant species,and the forest coverage rate is more than 95% (Bi et al.2018).The annual mean temperature in the reserve is 13.5 °C,with the highest temperature in July and lowest in January.The annual total precipitation is about 850 mm,mainly concentrated in July to August,and the relative humidity is typically 70–78%.The main tree species in the mixed forests areQuercus alienavar.acuteserrata,P.armandii,P.tabuliformis,Metasequoia glyptostroboides,andLarix kaempferi(Peng et al.2018).Typical soil types include mountain brown soil,yellow brown soil,dark brown and mountain brown soil,and brown-dark brown soil (Wang et al.2020).
Tree-ring sampling and chronology development
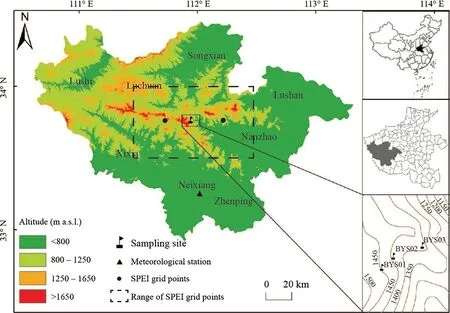
In October 2021,a ridge was selected on the north slope of Baiyunshan Mountain in the Funiu Mountains,and along the ridge,a sampling site was laid out at 1450,1400,and 1350 m a.s.l.(Fig.1): BYS01 (33° 40′ 5.75″ N,111° 52′0.74″ E,1450 m a.s.l.),BYS02 (33° 39′ 59.27″ N,111° 51′46.29″ E,1400 m a.s.l.),and BYS03 (33° 40′ 2.62″ N,111°51′ 50.39″ E,1350 m a.s.l.).Trees ofP.tabuliformis(Nehrbass-Ahles et al.2014;Klesse et al.2018) along the elevation gradient were randomly selected and sampled following standard methods of dendrochronology (Fritts 1976) by removing two cores generally from each tree at breast height(1.2 m above ground) in different directions with an increment borer.In total,161 cores were collected from the three sites: 70 cores from 31 trees at from BYS01,52 cores from 26 trees at BYS02,and 39 cores from 22 trees at BYS03.

Fig.1 Location of the tree-ring sampling sites,meteorological station and the range of SPEI grid points
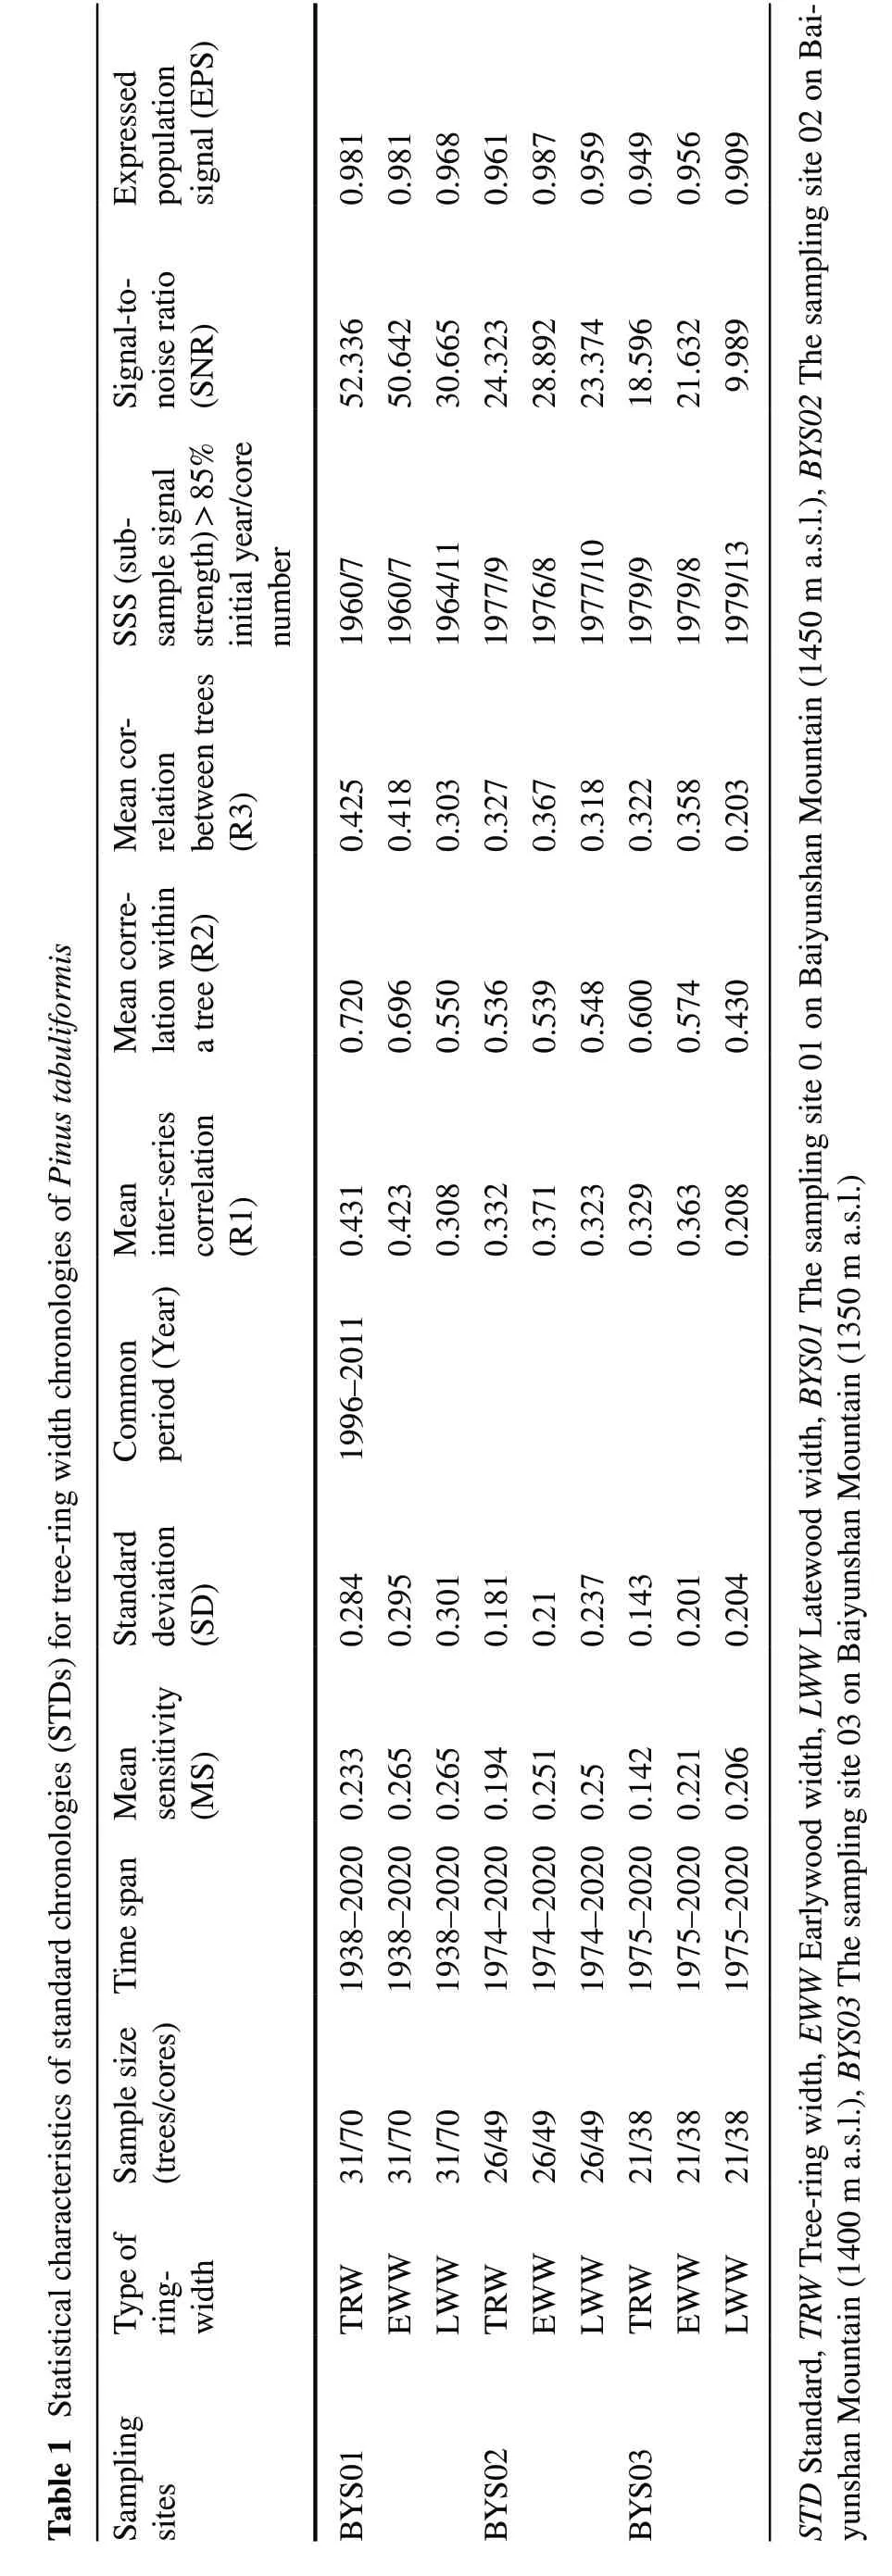
In the laboratory,all samples were mounted,air dried,and sanded until the cells in the EW and LW were clearly seen with a light microscope.The boundary between EW and LW was using the method proposed by Stahle et al.(2009);EW and LW can be distinguished by sudden changes in cell size,lumen size and color.If these traits for the wood cells change gradually,the midline of the transition area between the end of the EW and the beginning of the LW is taken as their boundary.A Velmex measuring system with a 0.001-mm precision was used to measure EWW and LWW,which were combined to produce the TRW series.Visual crossdating and measurement accuracy were checked with the COFECHA program (Holmes 1994).Eventually,157 cores from 78 trees were retained from the three sites (Table 1).The biological trend for the raw series was fitted by linear or negative exponential functions using the ARSTAN program(Cook 1985),and the detrended series was averaged with the bi-weight robust mean method after standardization (Peng et al.2013).The standard chronologies (STD) for the TRW,EWW and LWW ofP.tabuliformisfrom three altitudes in the Baiyunshan Mountain were then established for the following study (Fig.2).


Fig.2 Tree-ring width chronologies (tree-ring width index) for Pinus tabuliformis and corresponding sample depths at different altitudes.a:High altitude BYS01 (1450 m a.s.l.);b: mid altitude BYS02 (1400 m a.s.l.);and c: low altitude BYS03 (1350 m a.s.l.);BYS01–BYS03:three sampling sites on Baiyunshan Mountain;TRW: tree-ring width;EWW: earlywood width;LWW: latewood width
Climatic data
The monthly climatic data for monthly mean (Tmean),minimum (Tmin),maximum (Tmax) temperatures and monthly total precipitation (P) from 1979 to 2018 were obtained from the Neixiang Meteorological Station (33° 09′ N,111° 50′ E)near Baiyunshan Mountain.As shown in Fig.3,the monthly Tmeanwas above 0 °C year round,and the precipitation was mainly concentrated in July and August.

Fig.3 Monthly mean (Tmean),maximum (Tmax),and minimum (Tmin)temperatures and month total precipitation (P) recorded at the Neixiang Meteorological Station during 1979–2018
Data for the 1-month standardized precipitation evapotranspiration index (SPEI,Beguería et al.2014) were averaged from grid points between 33.5°–34° N and 111.5°–112.5° E and used in this study.The SPEI data have a spatial resolution of 0.5° × 0.5° and cover 1979–2018 and are provided by the Royal Netherlands Institute for Climate Research (http:// clime xp.knmi.nl).
Statistical methods
The DendroClim2002 program (Biondi 2000) was used to calculate Pearson’s correlation coefficients between TRW,EWW and LWW standard chronologies and climatic factors (Tmean,Tmax,Tminand P) and SPEI.Considering the lag effects of climatic factors on tree growth,we selected a total of 19 months from the prior May to current November as the period of correlation analysis to analyze the climatic response of TRW,EWW and LWW chronologies and any differences in the respective chronologies among altitudes.We further used the Evolutionary and Moving Response and Correlation in DendroClim2002 with a window length of 24 years to investigate the temporal and altitudinal stability between tree radial growth and its limiting factors during 1979–2018.
Results
Growth discrepancies of trees at different altitudes
The statistical characteristics of the TRW,EWW and LWW standard chronologies at each altitude showed that the mean sensitivity (MS) of the TRW chronologies at BYS02 and BYS03 were below 0.2,while the MS of the other chronologies were above 0.2 (Table 1).The expressed population signals (EPS) of the chronologies were all above 0.95,indicating the high quality of the established chronologies.The signal-to-noise ratio (SNR) of TRW,EWW and LWW chronologies were high except for the LWW chronology at BYS03.In addition,the MS,EPS,SNR and standard deviation (SD) of TRW,EWW and LWW chronologies all increased with altitude.
Relationships among chronologies along the altitudinal gradient
At every altitude,the correlations between TRW and EWW chronologies were the most significant,with correlation coefficients of 0.957,0.915,and 0.881 (p<0.01),respectively (Table 2).As for the correlations between TRW or EWW chronologies at different altitudes,the correlation was commonly greater between 1400 and 1350 m a.s.l.than between 1450 and 1400 m,and it was the lowest between 1450 and 1350 m.The correlations of the EWW chronologies between different altitudes were more significant than the correlations of TRW chronologies,and the correlations were low between EWW and LWW chronologies at each altitude,indicating EWW and LWW chronologies may represent different climatic conditions.
Relationships between chronologies and climatic factors along the altitudinal gradient
Figure 4 showed that the LWW chronologies at BYS01,BYS02 and BYS03 generally had significant negative correlations with temperatures (including Tmean,Tmaxand Tmin)in the prior July and August,and the correlations increased with altitude.Almost all EWW chronologies at BYS01,BYS02 and BYS03 had significant negative correlations with Tmeanand Tmaxin the current April and May,and the correlations in May increased with altitude.In addition,the TRW,EWW,and LWW chronologies at BYS01,BYS02 and BYS03 had only significant negative correlations with Tminin the prior July and August at 1450 m and 1400 m a.s.l.,and the correlations increased with altitude.Meanwhile,TRW and EWW chronologies at the three altitudes had significant positive correlations with precipitation in the current May.The EWW chronologies at 1400 m and 1350 m also had significant positive correlations with precipitation in the current April (Fig.4).

Fig.4 Correlation results of the standard chronologies (STDs) with mean (Tmean),maximum (Tmax),and minimum (Tmin) temperatures and month total precipitation (P) at the Neixiang Meteorological Station during 1979–2018.a Tmean;b Tmax;c Tmin;and d P;TRW Treering width,EWW Earlywood width,LWW Latewood width,BYS01 The sampling site 01 on Baiyunshan Mountain (1450 m a.s.l.),BYS02 The sampling site 02 on Baiyunshan Mountain (1400 m a.s.l.),BYS03 The sampling site 03 on Baiyunshan Mountain (1350 m a.s.l.),p Piror year,c Current year.Boxes outlined in black: correlations significant at p <0.05
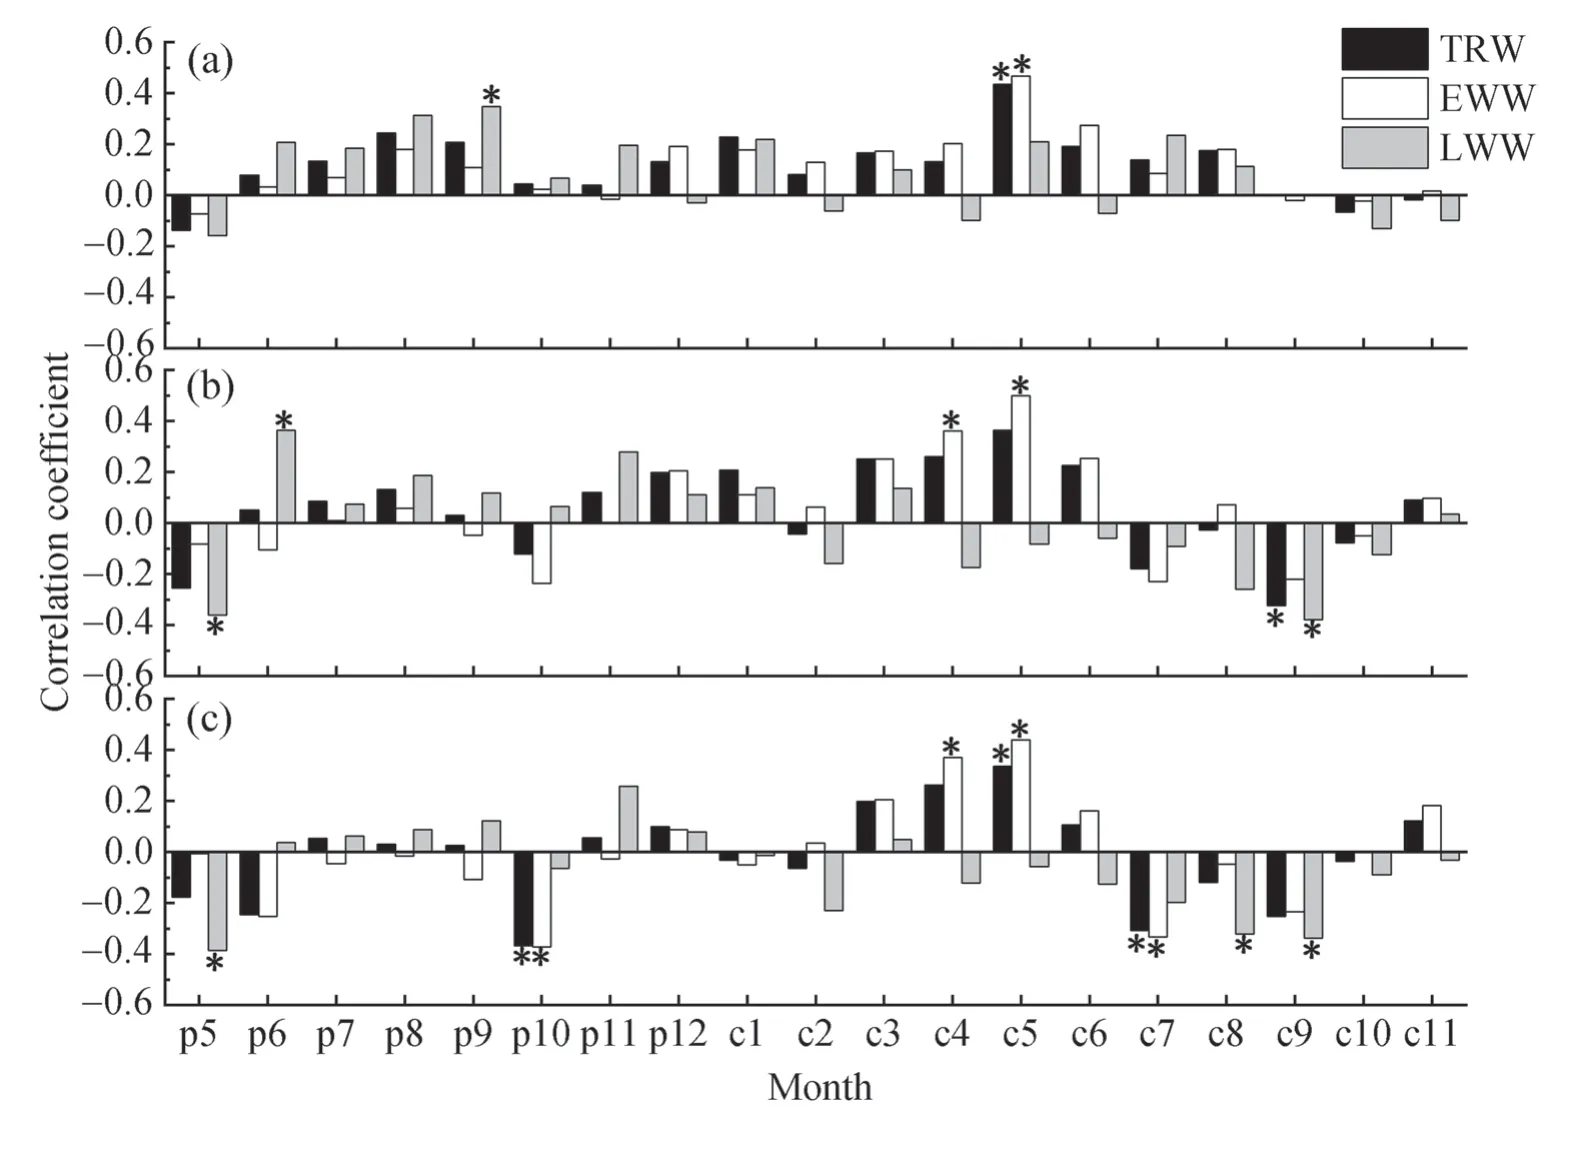
To verify the impacts of the hydrothermal factors on tree growth,we further analyzed the correlations of the 1-month SPEI with tree-ring chronologies (Fig.5).The results showed that at each altitude,the TRW and EWW chronologies had significant positive correlations with the SPEI in the current May,and the correlations generally increased with altitude.At 1400 m a.s.l.,there were significant positive correlations between the EWW chronologies and the SPEI in the current April,and significant negative correlations between the LWW chronologies and the SPEI in the current September,but these correlations were not significant at 1450 m.In addition,there were significant negative correlations between the TRW and EWW chronologies and the SPEI in the current July,and between the LWW chronologies and the SPEI in the current August at 1350 m,but these correlations were not significant at 1400 m.Therefore,the relationship between tree growth and hydrothermal factors is more complicated at 1350 m than at 1400 m a.s.l.

Fig.5 Correlation coefficients for the analyses between the standard chronologies (STDs)and standardized precipitation evapotranspiration index(SPEI) at different altitudes during 1979–2018.a High altitude BYS01 (1450 m a.s.l.);b mid altitude BYS02 (1400 m a.s.l.);and c low altitude BYS03(1350 m a.s.l.);BYS01–BYS03 Three sampling sites on Baiyunshan Mountain,TRW Tree-ring width,EWW Earlywood width,LWW Latewood width,p Piror year,c Current year.*Correlations significant at p <0.05
Moving correlations between chronologies and climatic factors at different altitudes
Moving correlation results showed that there were significant positive correlations between the EWW and TRW chronologies and the SPEI in the current May at all altitudes during 2002–2018,and the correlations were most significant for the EWW chronology at 1400 m a.s.l.(Fig.6).There were significant negative correlations between the LWW chronologies and the Tmaxin the prior July–August at 1400 m,and the correlations were most significant for LWW chronology at 1450 m.Therefore,the EWW chronology at mid altitude and LWW chronology at high altitude were most sensitive to certain climate factor,and might be more suitable for climate reconstruction.

Fig.6 Moving correlations,a between standard chronologies (STDs)and standardized precipitation evapotranspiration index (SPEI) in the current May,and b between STD chronologies and maximum temperature in the prior July–August during 2002–2018.TRW Tree-ring width,EWW Earlywood width,LWW Latewood width,BYS01 The sampling site 01 on Baiyunshan Mountain (1450 m a.s.l.),BYS02 The sampling site 02 on Baiyunshan Mountain (1400 m a.s.l.),BYS03 The sampling site 03 on Baiyunshan Mountain (1350 m a.s.l.).Black dots denote correlations significant at p <0.05
Discussion
Climate-growth relationships at different altitudes
The Baiyunshan region of the Funiu Mountains at the southern boundary ofP.tabuliformisin China has a continental monsoon climate,and the monsoon rainfall is concentrated in July and August (Fig.3).The monsoon rains did not arrive in April and May,and rainfall was relative low and temperatures abnormally high temperature,thus enhancing evapotranspiration,causing a severe water shortage for tree growth (Liu et al.2002,2015;Cai et al.2008;Tian et al.2009;Shi et al.2012;Song et al.2014;Peng et al.2020).Precipitation in April and May supplies needed water for tree growth.Therefore,TRW and EWW growth at the different altitudes were restricted by the hydrothermal constraints early in the growing season.This water stress onP.tabuliformisgrowth in the early growing season was also reported elsewhere in its distribution (Liu et al.2002;Hou et al.2007;Fang et al.2012;Song et al.2014;Peng et al.2020).
As mentioned,the limiting effect of temperature of July to August lagged significantly on Baiyunshan Mountain,and the effect of the heat stress showed a lag effect was founded in the eastern Qinling Mountains (Sun and Liu 2016;Zhao et al.2019).Although the lag effect of precipitation is generally stronger than temperature (Chen et al.2008),temperature can directly or indirectly influence physiological activities related to nutrient synthesis and accumulation in trees during the growing season (Chen et al.2008).The lag effect of Tmaxon tree growth increased with altitude in this study,because trees are more sensitive to temperature at high altitude where precipitation is abundant,and the shorter growing season at high altitude leads to a change in growth strategy in trees that allows them to accumulate as many nutrients as possible during the short season (Mainali et al.2015).In addition,the effect of Tmaxon tree growth was weaker than that of the drought stress,consistent with the relationship between conifer species and climatic factors at low altitudes in the Qinling Mountains (Bao et al.2021).
SPEI-growth relationships at different altitudes
Generally,with increasing altitude,mountain temperature decreases and precipitation increases.With less precipitation and higher temperature at mid-low altitudes,tree growth generally has been more susceptible to drought stress in the current May,and the growth increase with altitude was connected to the increase in precipitation.In the study of Shi et al.(2012),the most significant negative correlations betweenP.tabuliformisgrowth and Tmaxin the current May occurred at altitudes at 1340 m to 1400 m a.s.l.and 1630 m to 1720 m a.s.l.,not at 1200 m to 1300 m a.s.l.or 1850 m to 1950 m a.s.l..At high altitude,there is less evapotranspiration due to the lower temperature and greater cloud cover;however,the canopy is more open and solar radiation higher,so evapotranspiration is higher and less water is available.Thus,tree growth is likely more influenced by microclimate at high altitude than moderately low altitudes (Fritts 1976;Peng et al.2019).The extreme climate conditions at high altitude will inhibit tree growth in response to climate,which is supported by the positive relationship between the EWW chronology and the current April SPEI at mid-low altitudes.In addition,soil water could still be frozen from the low winter temperatures at high altitude,as temperature and evapotranspiration increase in April,the enhanced water availability will enhance tree growth.Therefore,growth of trees at high altitude had no significant correlation to SPEI in April,but growth responded significantly in May to the continuous heat.The tree-ring study of Peng et al.(2019) indicated that the humid climate for half the year in winter,which may be good for soil water storage in the form of snow,is beneficial for tree growth in early spring in the Funiu Mountains.
After the southward retreat of the monsoon rain,precipitation and water vapor in September decreases greatly.Although temperature is low at high altitude,the soil moisture is not high due to high wind speed.However,owing to terrain effects,water accumulation from precipitation is more likely to reduce the temperature effect at low altitude under weak evapotranspiration,and tree photosynthesis would be limited when the temperature drops to a certain point.The same relationship appeared in July and August at low altitude,indicating that trees at low altitude are more sensitive to soil moisture,especially late in the growing season.Similar results were reported by Jiao et al.(2016) and Shi et al.(2012) found thatP.tabuliformisgrowth was positively correlated with precipitation in September at 1340 m to 1400 m a.s.l.,in contrast to our finding.The difference is likely caused by the difference in the altitudes of tree growth and the microenvironments.
The SPEI is designed to account for both precipitation and potential evapotranspiration in determining drought.For instance,significant negative correlations of tree growth at low altitude with the SPEI in August and September were attributed to the abundant rainfall or humidity causing lower temperatures and less photosynthesis,which restricted LWW growth.
Stability of climate-growth responses at different altitudes
The moving correlation results indicated that drought stress in May influenced radial growth of the EWW at all altitudes,while growth of the LWW was more sensitive to temperature in the prior July–August at high altitude.Similarly,the prior year temperature had a great influence onP.taiwanensisgrowth at high altitude in the Dabie Mountains (Cai et al.2020).However,our results differed from those reported by Peng et al.(2019),who found that since the 2000s,theP.armandiigrowth response to current May hydrothermal factors (Tmean,Tmax,P) have been stable at high and low altitudes in the Funiu Mountains.The reason for the strong signal of May SPEI at mid altitude in our study may be that temperatures were higher and precipitation lower than at other altitudes.Moreover,our results suggest that the EWW chronology at the mid altitude is more suitable for reconstructing the SPEI in the current May and the LWW chronology at the high altitude is better suitable for reconstructing Tmaxin the prior July–August.
Conclusion
Using tree-ring samples from trees ofP.tabuliformisat three altitudes in the Baiyunshan Mountain,central China,we establised standard TRW,EWW and LWW chronologies for all three altitudes.Climate-growth analyses showed that TR and EW growth were mainly limited by drought stress in the current May,and LW growth was mainly constrained by Tmaxin the prior July to August;drought stress and Tmaxlag effect increased with increasing altitude.There were significant correlations and strong temporal stabilities between the EWW chronologies and the SPEI in the current May at the three altitudes.Along the altitudinal gradient,there were strong common climate-growth relationships,but growth in relation to SPEI differed,indicating that the drought response of trees to high evapotranspiration was more significant at low altitude.These results provide crucial scientific information for forest management and cultivation and will guide the selection of tree species and sampling sites for climate reconstructions in Central China.
AcknowledgementsWe thank the National Field Scientific Observation and Research Station of Forest Ecosystem in Dabie Mountains,Henan Province and Baiyunshan National Nature Reserve Bureau for the help with fieldwork.
Open AccessThis article is licensed under a Creative Commons Attribution 4.0 International License,which permits use,sharing,adaptation,distribution and reproduction in any medium or format,as long as you give appropriate credit to the original author(s) and the source,provide a link to the Creative Commons licence,and indicate if changes were made.The images or other third party material in this article are included in the article’s Creative Commons licence,unless indicated otherwise in a credit line to the material.If material is not included in the article’s Creative Commons licence and your intended use is not permitted by statutory regulation or exceeds the permitted use,you will need to obtain permission directly from the copyright holder.To view a copy of this licence,visit http://creativecommons.org/licenses/by/4.0/.
 Journal of Forestry Research2024年1期
- Journal of Forestry Research的其它文章
- New indices to balance α-diversity against tree size inequality
- Nitrogen mineralization in the oldest climax communities in the eastern Mediterranean region
- Physiological and psychological responses to tended plant communities with varying color characteristics
- Impact of cattle density on the structure and natural regeneration of a turkey oak stand on an agrosilvopastoral farm in central Italy
- Peat properties of a tropical forest reserve adjacent to a fire-break canal
- Plant growth and metabolism of exotic and native Crotalaria species for mine land rehabilitation in the Amazon
