Clinical study of different prediction models in predicting diabetic nephropathy in patients with type 2 diabetes mellitus
Sha-Sha Cai,Teng-Ye Zheng,Kang-Yao Wang,Hui-Ping Zhu
Abstract BACKGROUND Among older adults,type 2 diabetes mellitus (T2DM) is widely recognized as one of the most prevalent diseases.Diabetic nephropathy (DN) is a frequent complication of DM,mainly characterized by renal microvascular damage.Early detection,aggressive prevention,and cure of DN are key to improving prognosis.Establishing a diagnostic and predictive model for DN is crucial in auxiliary diagnosis.AIM To investigate the factors that impact T2DM complicated with DN and utilize this information to develop a predictive model.METHODS The clinical data of 210 patients diagnosed with T2DM and admitted to the First People’s Hospital of Wenling between August 2019 and August 2022 were retrospectively analyzed.According to whether the patients had DN,they were divided into the DN group (complicated with DN) and the non-DN group (without DN).Multivariate logistic regression analysis was used to explore factors affecting DN in patients with T2DM.The data were randomly split into a training set (n=147) and a test set (n=63) in a 7:3 ratio using a random function.The training set was used to construct the nomogram,decision tree,and random forest models,and the test set was used to evaluate the prediction performance of the model by comparing the sensitivity,specificity,accuracy,recall,precision,and area under the receiver operating characteristic curve.RESULTS Among the 210 patients with T2DM,74 (35.34%) had DN.The validation dataset showed that the accuracies of the nomogram,decision tree,and random forest models in predicting DN in patients with T2DM were 0.746,0.714,and 0.730,respectively.The sensitivities were 0.710,0.710,and 0.806,respectively;the specificities were 0.844,0.875,and 0.844,respectively;the area under the receiver operating characteristic curve (AUC) of the patients were 0.811,0.735,and 0.850,respectively.The Delong test results revealed that the AUC values of the decision tree model were lower than those of the random forest and nomogram models (P < 0.05),whereas the difference in AUC values of the random forest and column-line graph models was not statistically significant (P > 0.05).CONCLUSION Among the three prediction models,random forest performs best and can help identify patients with T2DM at high risk of DN.
Key Words: Type 2 diabetes mellitus;Diabetic nephropathy;Random forest;Decision-making tree;Nomogram;Forecast
INTRODUCTION
Type 2 diabetes mellitus (T2DM) is one of the most common diseases affecting the older population.However,its incidence among children,adolescents,and young adults is increasing because of obesity,physical inactivity,and poor dietary habits.According to the International Diabetes Federation,approximately 537 million people (20-79 years old) worldwide currently have diabetes,with more than 90% of cases being T2DM[1].Approximately 4.2 million people died of diabetes and its complications in 2019.Diabetic nephropathy (DN) is a chronic kidney disease induced by DM and a frequent microvascular complication of DM[2].Relevant research data show that approximately 1/100 patients with diabetes develop end-stage renal disease yearly,and approximately 3/50 patients with massive albuminuria eventually develop end-stage renal disease yearly[3].Patients with DN have a higher risk of death than those with diabetes alone or without comorbid DN.However,recent studies have shown that the prevalence of DN in patients with T2DM ranges between 20% and 40%[4,5].To reduce the death rate of patients,early identification,prevention,and slowing down the development of DN are important.However,random urine measurement of the urinary albumin/creatinine ratio and 24 h urinary albumin quantification have shortcomings in the diagnosis of DN.Renal biopsy is the gold standard for the diagnosis of DN,but the acceptance of the examination is often low,and the economic cost is high[6].Therefore,constructing a diagnostic and predictive model of DN plays a significant role in auxiliary diagnosis.At present,machine learning has been widely used in medical prediction models.Logistic regression (nomogram),decision tree,and random forest models are three important techniques in machine learning,all of which can quickly mine effective information from data;However,their application effects differ for different data types[7].Little research has compared the predictive efficacies of the three models for DN in patients with T2DM.Therefore,this study established a prediction model for DN in patients with T2DM based on a nomogram,decision tree,and random forest and compared the prediction efficacy of the three models,providing a basis for the clinical identification of high-risk populations.
MATERIALS AND METHODS
Data sources
First,this was a retrospective study.A total of 210 patients admitted to the First People’s Hospital of Wenling with a clear diagnosis of T2DM between August 2019 and August 2022 were selected for this study.According to the diagnostic information,74 of the 210 patients with T2DM complicated by DN were defined as the DN group,and the remaining 136 patients with T2DM without concurrent DN were defined as the non-DN group.The inclusion criteria were as follows: (1) Age 18 to 75 years;(2) T2DM diagnosed according to the diagnostic criteria;and (3) Complete clinical data,including demographic data and laboratory test results.The exclusion criteria were as follows: (1) Definite diagnosis of primary kidney disease or secondary kidney disease of the immune system,blood system,or drug;(2) Complication with severe primary diseases of the digestive,respiratory,cardiovascular,hematological,and nervous systems,accompanied by more than one malignant tumor;and (3) Rapidly progressive hypertension or diseases other than cerebrovascular diseases within the last 3 mo.
Diagnostic criteria
Standards criteria for DM: Based on “Standards for the Diagnosis and Treatment of Diabetes (2023 Edition)” of ADA[8] and “Guidelines for the Diagnosis,Prevention and Treatment of Type 2 Diabetes”[9].Diagnostic standards were developed as follows: (1) Common symptoms of diabetes such as polydipsia,polyuria,polyphagia,unexplained weight loss,and random blood sugar ≥ 11.1 mmol/L;(2) Fasting blood sugar ≥ 7.0 mmol/L;or (3) Blood glucose ≥ 11.1 mmol/L 2 h after dextrose load.Patients with no typical symptoms of diabetes need to be reexamined on another day to confirm.The fasting state refers to not eating any calories for > 8 h;random blood glucose levels were measured at any time of the day,regardless of the time of the last meal.
Diagnostic criteria for DN: The diagnostic criteria were established based on the ADA “Standards for the Diagnosis and Treatment of Diabetes (2023 Edition)”,Guidelines for the Diagnosis,Prevention and Treatment of Type 2 Diabetes”,and “Guidelines for primary management of diabetic kidney disease in China”[10].That is,patients with diabetes with renal impairment and urinary microalbumin/creatinine ratio (ACR) ≥ 30 mg/g (or ≥ 3 mg/mmol) or glomerular filtration rate < 60 mL/min/1.73 m2for a total duration of > 3 mo can be diagnosed with DN.
Indicators of observation
General information: Age,sex,body mass index (kg/m2),diabetes duration,and history of high blood pressure,diabetic retinopathy (DR),and coronary heart disease.Laboratory indicators (collected within 24 h after admission): Fasting blood glucose (FBG,mmol/L),serum creatinine (Scr,μmol/L),glycosylated hemoglobin (HbAlc,%,7%=53 mmol/mol),blood urea nitrogen (BUN,mmol/L),total cholesterol (mmol/L),triglyceride (mmol/L),high-density lipoprotein cholesterol (mmol/L),and low-density lipoprotein cholesterol (mmol/L).
Statistical analysis
Data were analyzed and processed using the SPSS software (version 23.0).Quantitative data in accordance with the normal distribution were expressed as mean ± SD,and thet-test was used for comparison among groups.Count data were expressed as (%),and theχ2test was used for comparison among groups.The DN and non-DN groups were subjected to univariate analysis,and variables with statistically significant variances were incorporated into a multifactor logistic regression analysis model to screen for highly relevant predictive variables.The prediction model was constructed using R language,and the data were randomly split into training and validation sets at a ratio of 7:3 for model construction and validation,respectively.A nomogram model was constructed using the “rms” package;in this model,multiple predictors were integrated,and line segments with a certain scale were drawn on the same plane to express the relationship between variables.A decision tree was constructed using the “rpart” package.In the construction of the decision tree,the Gini coefficient minimization criterion was adopted to select features,and a binary tree including root,internal,and leaf nodes was generated.The estimation error identification complexity parameter of cross-validation was automatically calculated,and the dataset was classified through multiple conditional discrimination processes to finally obtain the required results.A random forest was constructed using the “Random Forest” package,which is used to construct multiple decision trees.When a certain sample needs to be predicted,the predicted results of each tree in the forest are counted,and then the final result is selected from these predicted results by voting method.The sensitivity,specificity,accuracy,recall,precision,and area under the receiver operating characteristic curve (AUC) were used to compare the effectiveness of the models,and the best prediction effect of the model was selected.The DeLong test was used for AUC comparisons.Differences were considered statistically significant atP< 0.05.
RESULTS
Concurrent DN condition
A total of 210 patients with T2DM were included in this study,of whom 87 were men and 123 were women.Seventy-four patients had T2DM complicated with DN,and the incidence of DN was 35.24%.There were 74 patients in the DN group,with a mean age of 56.01 ± 9.41 years.There were 136 patients in the non-DN group,with a mean age of 57.42 ± 8.15 years.
Univariate analysis of DN in patients with T2DM
The clinical data of the patients in the DN and non-DN groups were compared.The duration of diabetes,FBG,Scr,HbAlc,and BUN levels were higher in the DN group than in the non-DN group,and the proportion of patients with DR was also higher in the DN group than in the non-DN group (P< 0.05).More details are shown in Table 1.
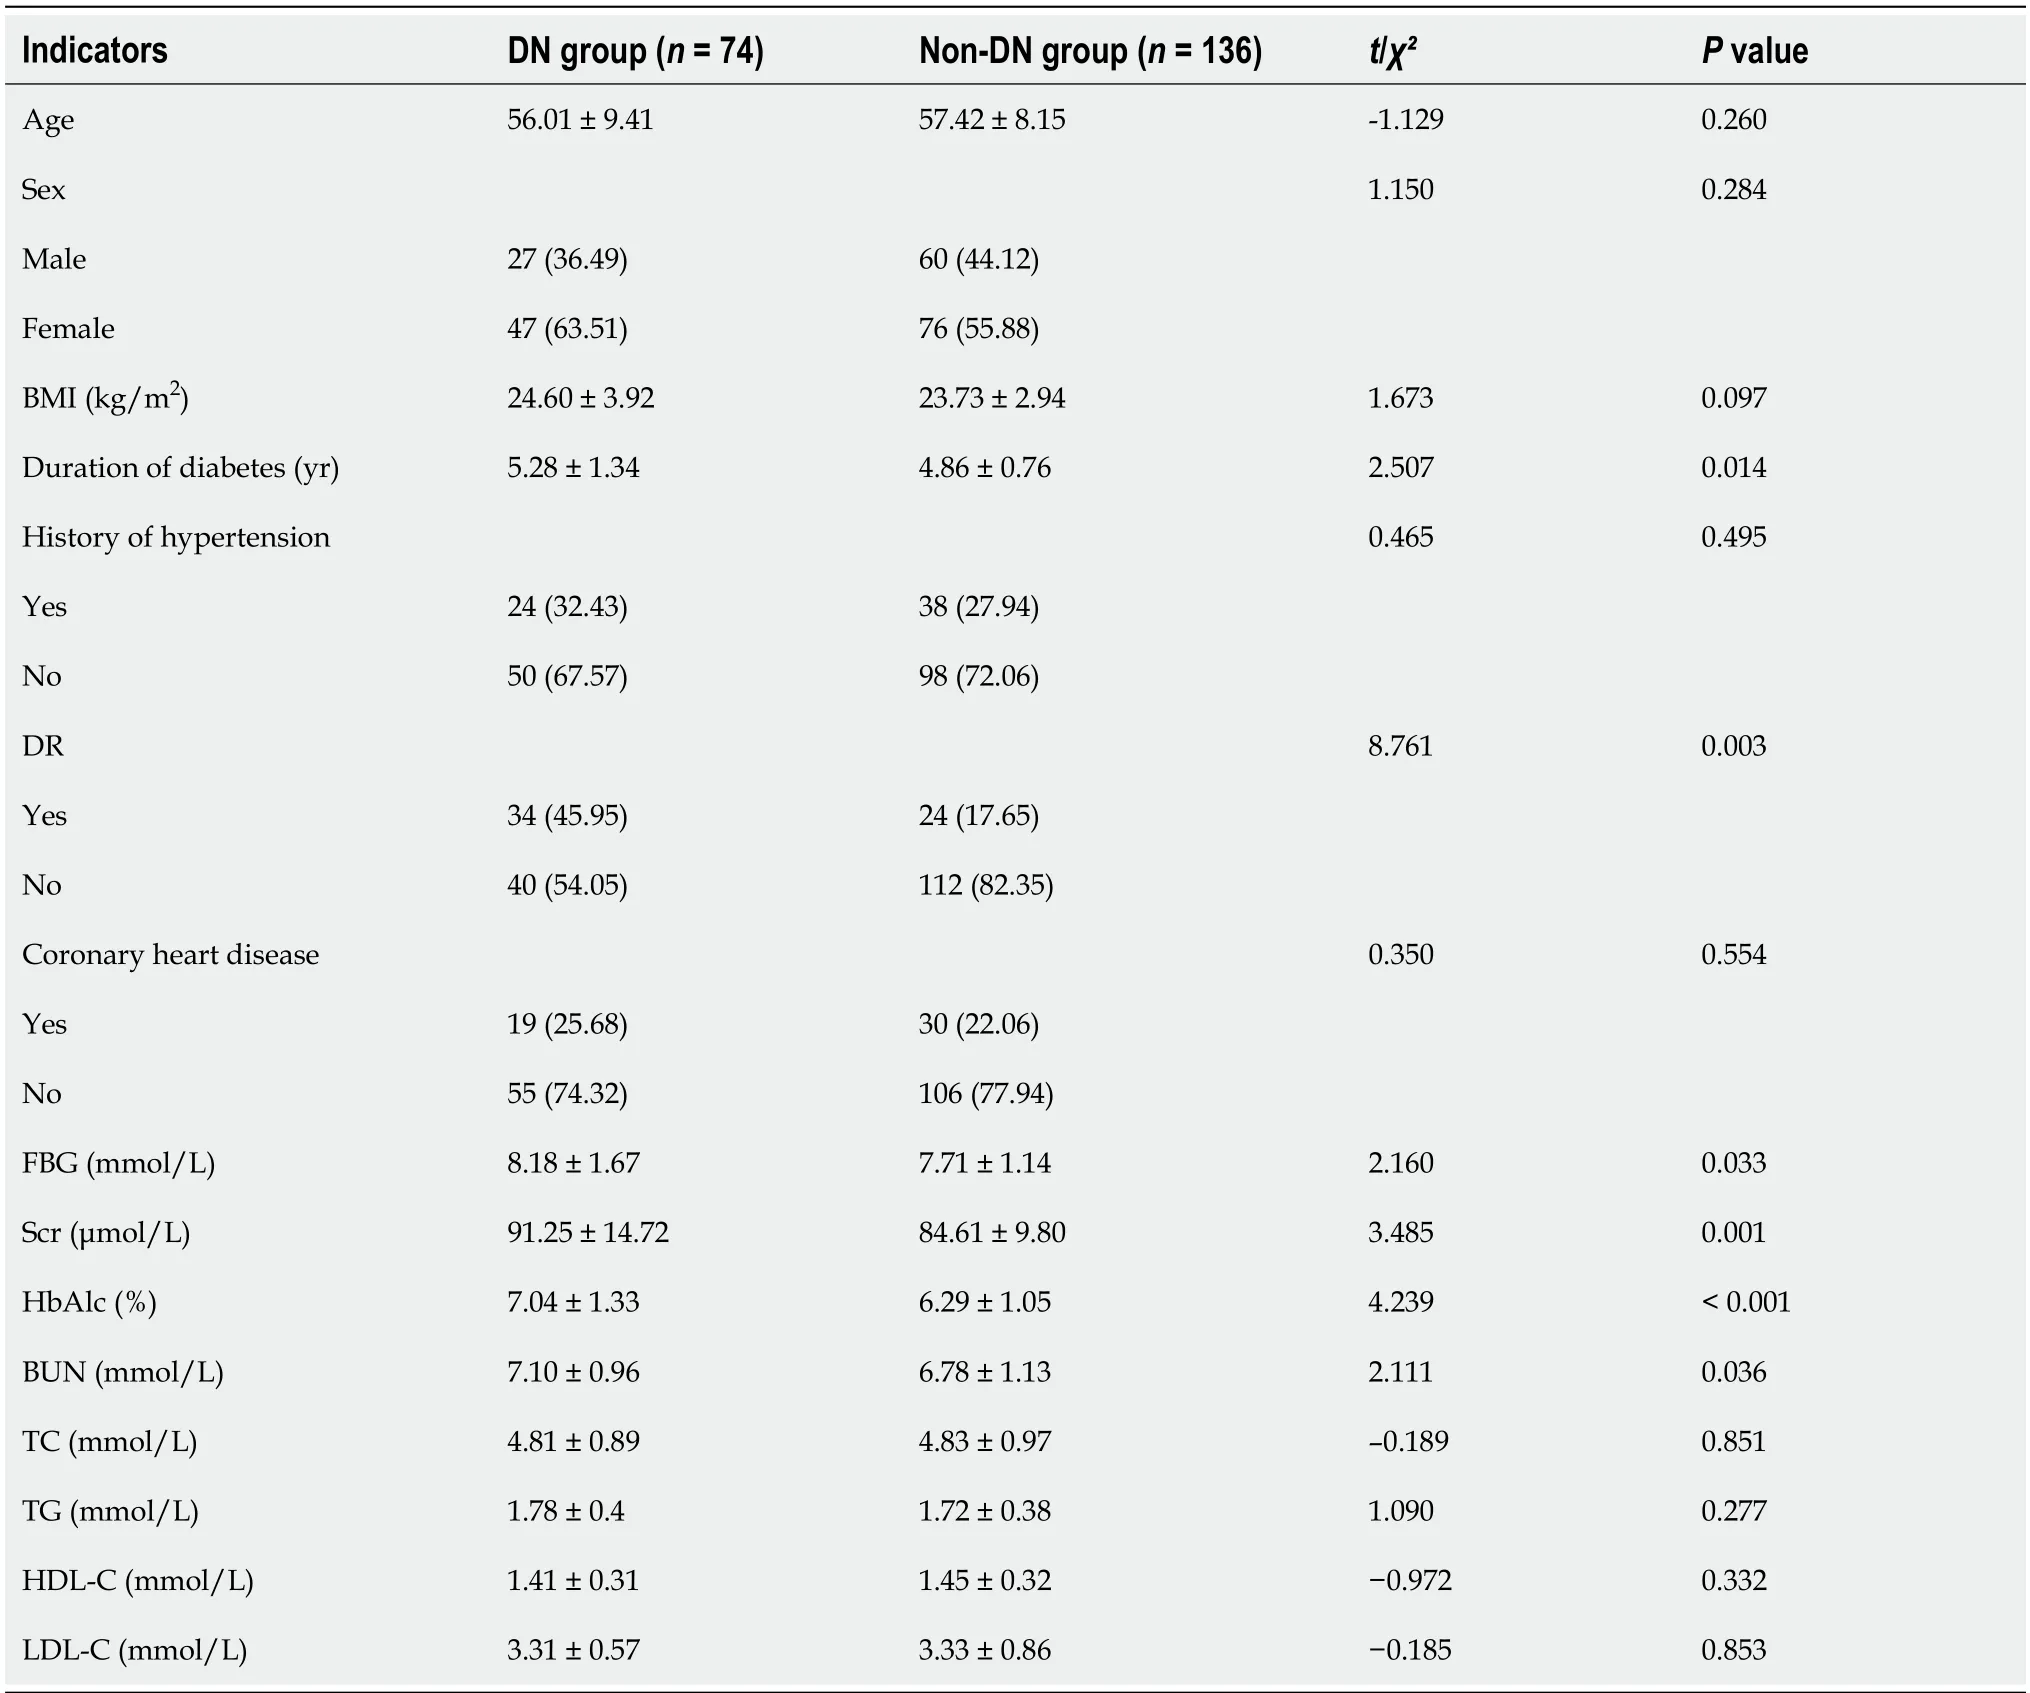
Table 1 Results of univariate analysis of diabetic nephropathy in patients with type 2 diabetes [n (%)/mean ± SD]

Table 2 Variable assignment

Table 3 Results of multivariate analysis of diabetic nephropathy in patients with type 2 diabetes
Multivariate analysis of DN in patients with T2DM
Regression analysis was performed by taking the patients with T2DM complicated with DN to be the dependent variables and taking the duration of diabetes,FBG,Scr,HbAlc,BUN,and DR as the independent variables (there was no collinearity problem between the diagnosed variables),as shown in Tables 2 and 3.Multivariate analysis showed that the duration of diabetes,FBG,Scr,HbAlc,and DR were factors influencing DN in patients with T2DM (P< 0.05).
Nomogram model
Based on the results of the multifactor logistic regression analysis,the obtained independent predictors (FBG,Scr,HbAlc,DR,and duration of diabetes) were used to construct a nomogram model for predicting DN in patients with T2DM (Figure 1).
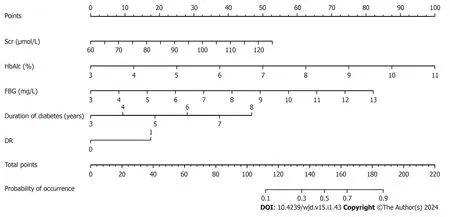
Figure 1 Nomogram prediction model for diabetic nephropathy in patients with type 2 diabetes mellitus. Scr: Serum creatinine;HbAlc: Glycosylated hemoglobin;DR: Diabetic retinopathy;FBG: Fasting blood glucose.
Decision tree model
A decision-tree prediction model of DN in patients with T2DM was constructed,and four explanatory variables were screened: FBG,HbAlc,Scr,and duration of diabetes.The results showed that the duration of diabetes was the first factor influencing DN in patients with T2DM.The model identified six judgment rules,of which three judged concurrent DN and three judged no concurrent DN.The incidence of DN in patients with T2DM with duration of diabetes ≥ 7 years was 6%.The incidence of DN in patients with T2DM with duration of diabetes < 7 years,HbAlc ≥ 7.6%,and Scr ≥ 89 μmol/L was 5%.The incidence of DN in patients with T2DM with duration of diabetes < 7 years,HbAlc < 7.6%,FBG ≥ 7.5 mmol/L,and Scr ≥ 98 umol/L was 5% (Figure 2).
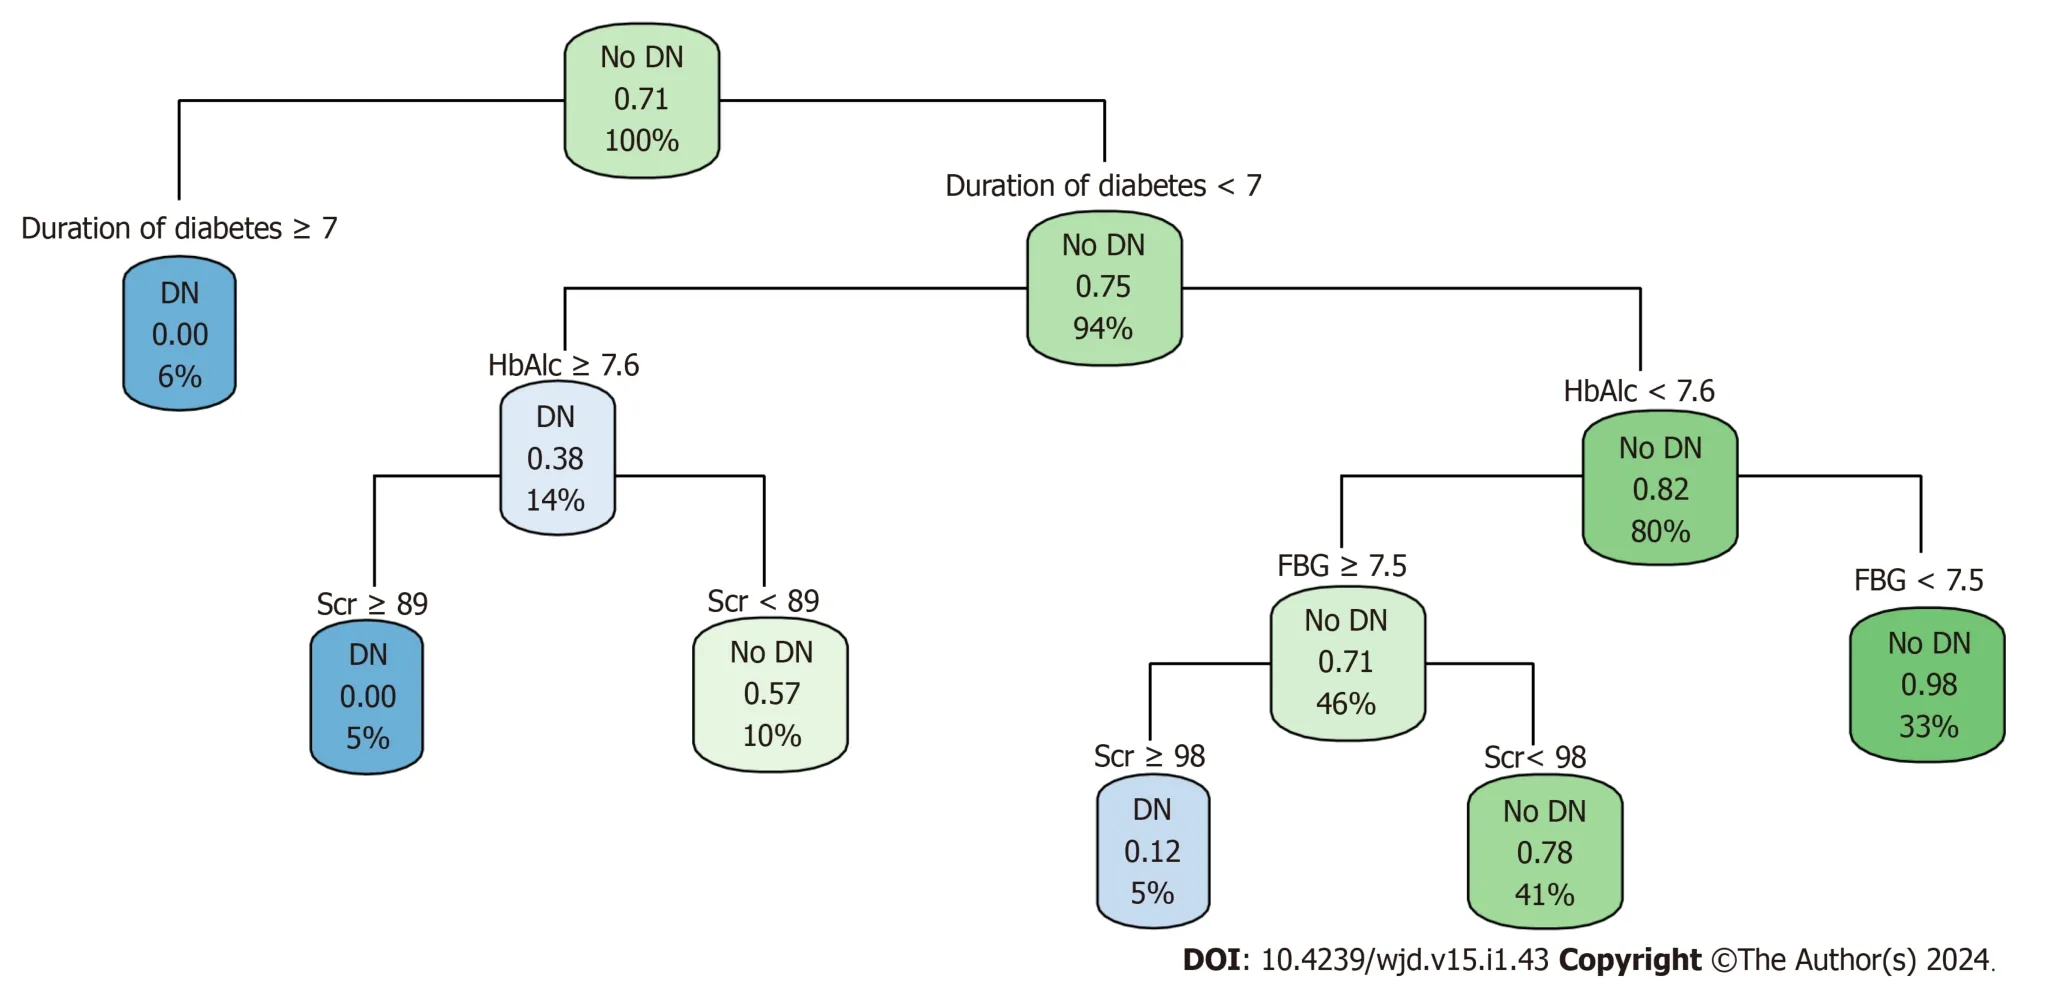
Figure 2 Decision tree model of diabetic nephropathy in patients type 2 diabetes. Scr: Serum creatinine;HbAlc: Glycosylated hemoglobin;FBG: Fasting blood glucose.
Random forest model
Based on the overall change in the prediction precision of the constructed random forest model,the variables affecting DN in patients with T2DM were HbAlc,Scr,FBG,duration of diabetes,and DR (Figure 3).
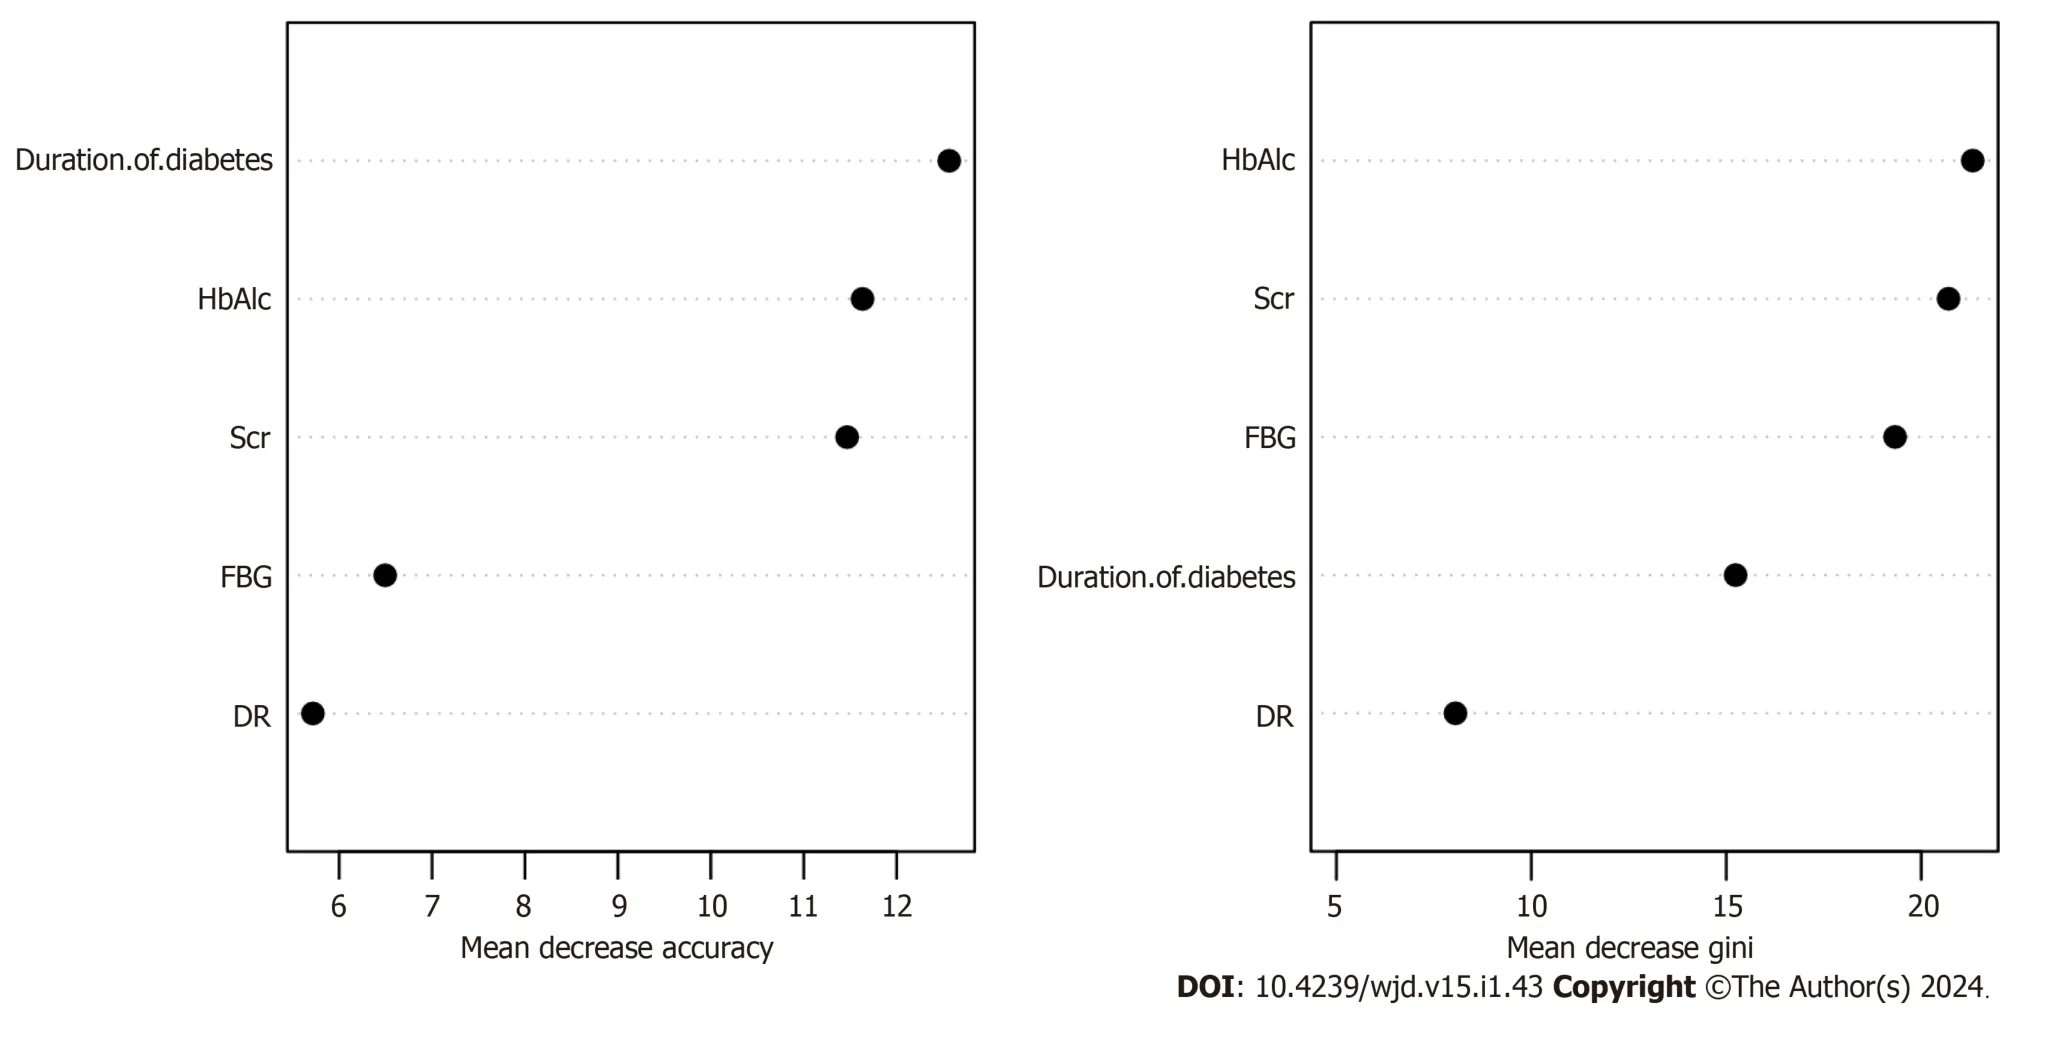
Figure 3 Random forest model of diabetic nephropathy in patients with type 2 diabetes. Scr: Serum creatinine;HbAlc: Glycosylated hemoglobin;DR: Diabetic retinopathy;FBG: Fasting blood glucose.
Evaluation of prediction effect of three models
In the validation set,the overall evaluation of the efficacy of the nomogram in predicting concurrent DN in patients with T2DM was not significantly different from that of the random forest model.In contrast,the overall efficacy of the decision tree model was significantly lower than that of the nomogram and random forest model,with significant differences (allP> 0.05) (Table 4 and Figure 4).
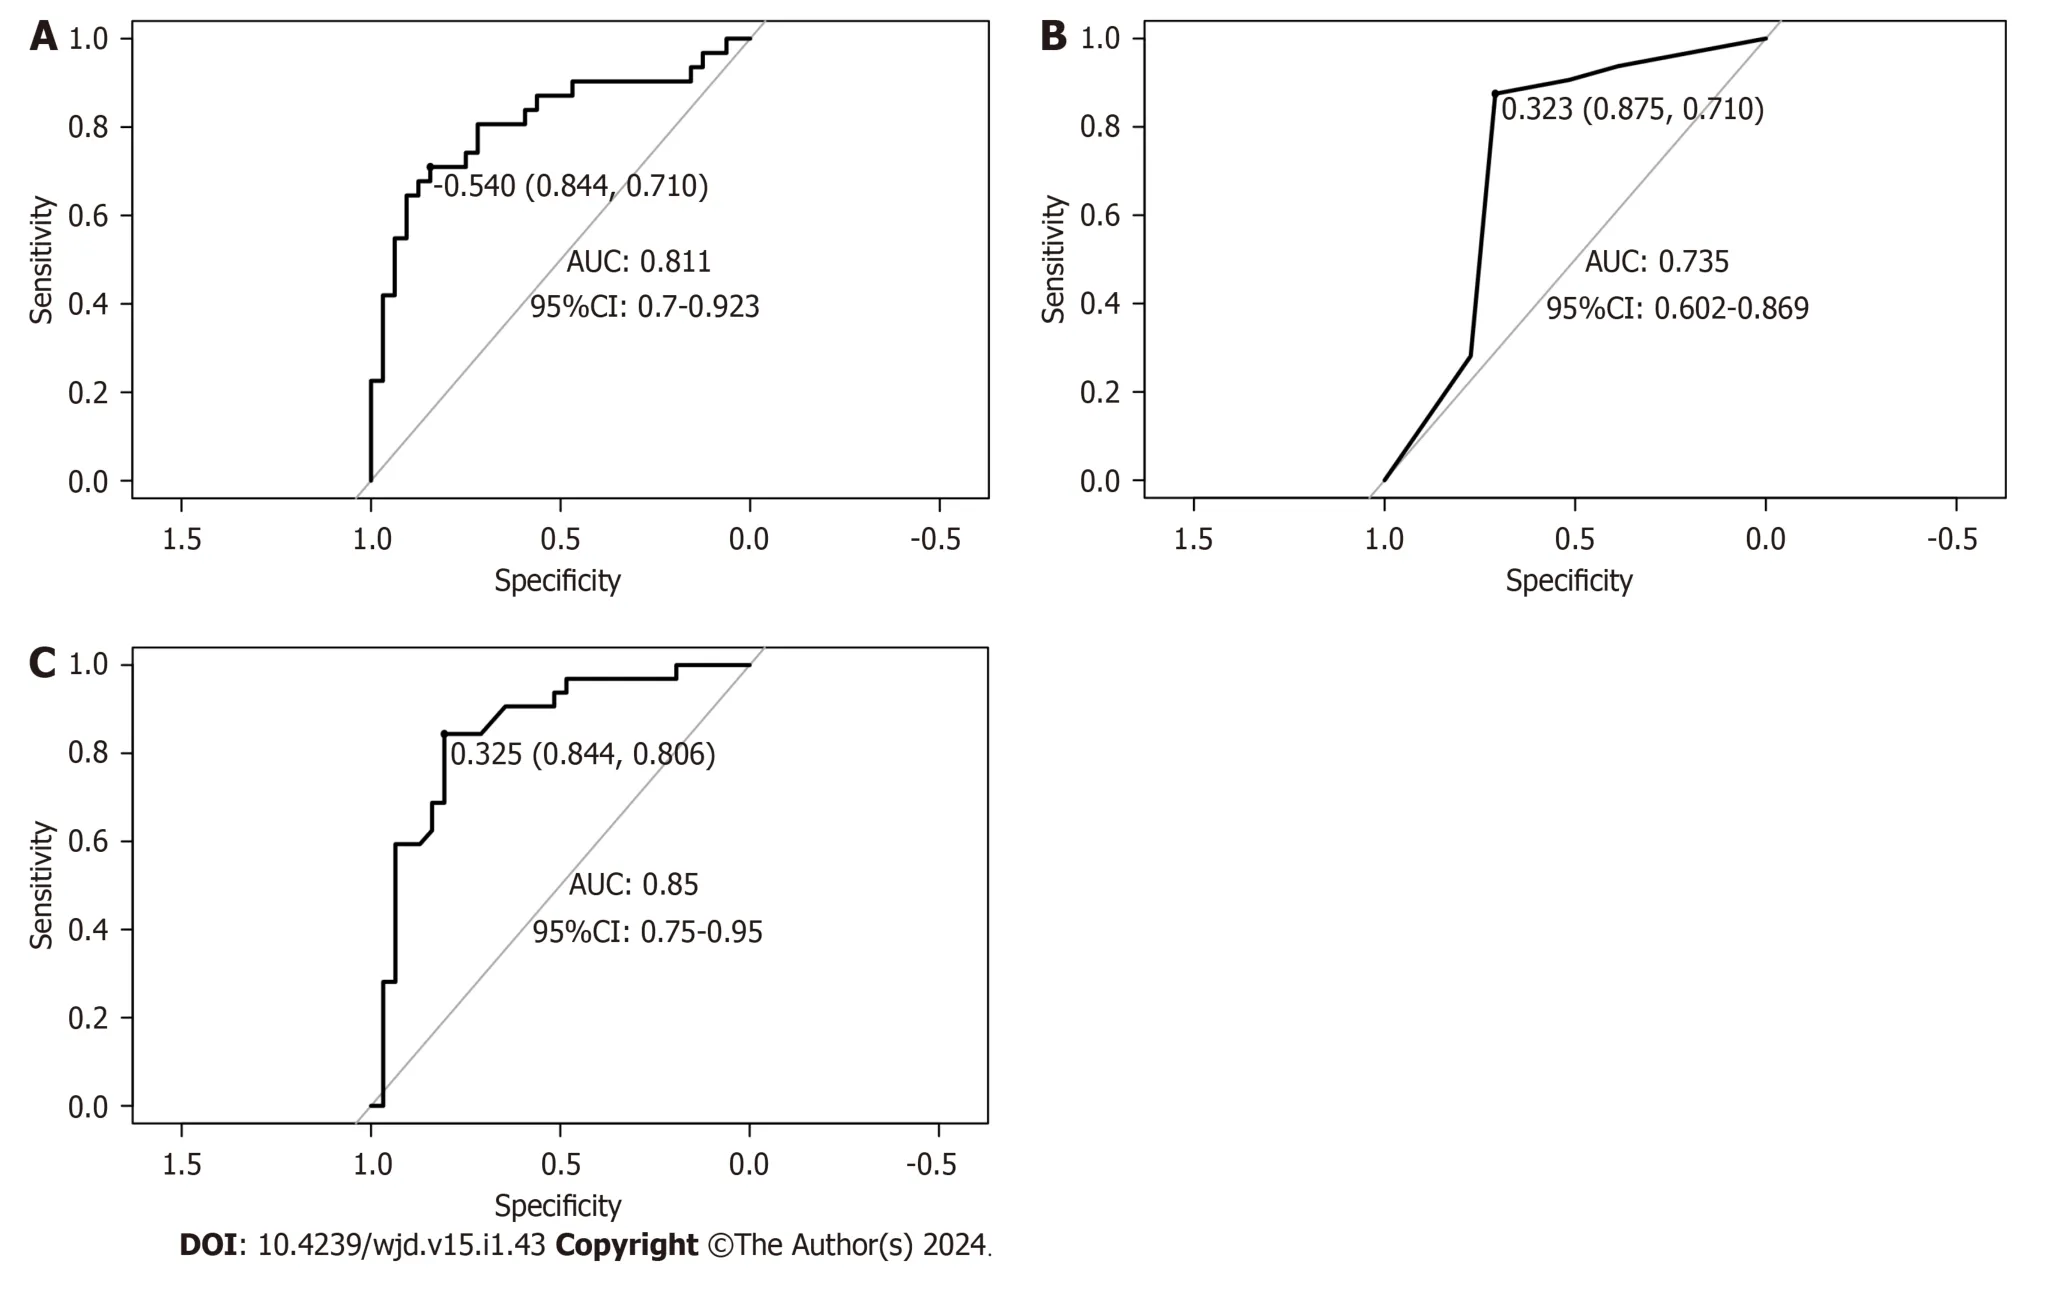
Figure 4 Receiver operating characteristic curves for the validation sets of the three models. A: Nomogram;B: Decision-making tree;C: Random forest.AUC: Area under the receiver operating characteristic curve;CI: Confidence interval.

Table 4 Efficacy of three model validation sets in predicting concurrent diabetic nephropathy in patients with type 2 diabetes
DISCUSSION
According to the National Kidney Foundation,persistent proteinuria is the primary indicator of kidney injury.ACR > 30 μg/mg in random urine samples was defined as renal injury,of which 30-300 μg/mg was the microalbuminuria stage,suggesting that the kidney had increased capillary permeability,which was the earliest sign of renal injury in patients with diabetes.In patients with T2DM,abnormal blood glucose levels frequently exist prior to diagnosis,and patients with T2DM may already have microalbuminuria (or clinical albuminuria) at the time of initial diagnosis[11,12].Nephropathy is one of the most frequent complications of diabetes,and its insidious characteristics provide an intervention node for studying DN.Interventions for early detection,early detection diagnosis,and treatment can prevent the occurrence of DN and reduce or delay the occurrence of end-stage renal disease[13].Therefore,identifying and intervening in clinically modifiable factors for the occurrence and progression of DN remains the primary strategy for its prevention and cure of DN.
The incidence of DN complications in patients with T2DM in this study was 35.24%.Wagnewet al[14] revealed that the incidence of DN was 35.3%,which is consistent with the results of this study.However,Zhanget al[15] revealed that the incidence of DN was only 21.8%,which was significantly lower than that reported in the present study.The incidence of DN varies greatly among studies and may be related to factors such as population characteristics and regions.The findings of this study revealed that FBG,Scr,HbAlc,DR,and duration of diabetes were factors affecting DN in patients with T2DM.The levels of FBG,Scr,HbAlc,and duration of diabetes in the DN group were higher than those in the non-DN group,and the proportion of DR was higher than that in the non-DN group,which was similar to the results of previous studies[16-18].This suggests that patients with DN have worse glycemic control and poorer renal function[19,20].Moreover,compared with patients with T2DM without DR,patients with DR are more likely to develop DN.
Nagelet al[21] followed high-risk populations for > 20 years and found that fasting hyperglycemia was a predictor of high albumin leakage rate.Hyperglycemia causes renal damage through the activation of multiple pathways,including the formation of glycosylated complexes by the interaction of glucose with proteins outside the cell,metabolism to sorbitol through the polyol pathway,and metabolism to glucosamine through the hexosamine biosynthesis process,thereby mediating hyperglucose-induced renal damage.HbAlc can cause microvascular damage.In a tissue environmentwith high glucose levels,the non-enzymatic catalytic process of the glycation reaction is accelerated,manifesting as a continuous increase in HbAlc.After glycation,abnormal hemoglobin levels cause chronic damage to the microcirculation vessels,damaging the basement membrane charge barrier and urine proteins.This indicates that microvascular damage to diabetic kidney tissues is a risk factor for microvascular or macrovascular lesions in patients with diabetes[22].This study also confirmed that high blood glucose and HbAlc levels are associated with DN.Since Scr is mainly excreted in urineviaglomerular filtration from the blood and is almost not reabsorbed by renal tubules,the output of creatinine is constant when renal function is normal or slightly damaged,and an increase in Scr indicates that renal function is damaged[23].Diabetes duration is the main risk factor for various complications in patients with T2DM,especially the primary risk factor for renal complications.If the duration of diabetes is > 5 years,microalbuminuria can occur.Without active intervention,it can progress to DN[24].Studies have shown that DN and DR have the same risk factors,such as diabetes course and FBG[25].Diabetic retinal abnormalities are associated with glomerular injury.Studies have shown that changes in retinal arteriole and venule diameter are associated with renal histological changes,such as basement membrane thickness and mesangial matrix volume increase[26].In patients with diabetes with macroalbuminuria,retinopathy is rare;Therefore,DR combined with macroalbuminuria is more likely to be diagnosed as DN.For patients with DR,early intervention of risk factors and renal pathology examination should be performed to control the risk of DN.
Nomograms,decision trees,and random forest prediction models were established based on the above indicators.The results showed that the random forest model performed better than the nomogram and decision tree models in terms of AUC,sensitivity,and other evaluation indicators.In contrast,the overall evaluation indicators of the nomogram model were better than those of the decision tree model.The statistical difference between the AUC of the random forest and nomogram model was not significant;However,the statistical difference between the AUC of the decision tree and nomogram and the random forest model was significant.In general,the comprehensive predictive abilities of the three prediction models for concurrent DN in patients with T2DM constructed in this study were as follows: Decision tree < nomogram < random forest.This may be because the decision tree model prefers variables with higher values;however,these variables are not necessarily the best predictive variables,which reduces the predictive ability of the decision tree model.In addition,eliminating some candidate variables in the pruning process of the decision-tree model reduces its predictive ability to a certain extent[27].A nomogram is a model that integrates multiple related factors to predict the probability of an event;it is intuitive,visual,and has good accuracy[28].However,owing to its easy form (very much like a linear model),it is difficult to capture complex relationships and handle the problem of data imbalance and is sensitive to multicollinear data.Therefore,the prediction efficiency was slightly lower than that of the random forest model.However,random forest integrates the output of an individual decision tree to produce the final prediction result,which has the characteristics of robust operation.It is not easily affected by collinearity between variables and has a significant effect on reducing the variance of the model[29].Tsenget al[30] found that the nomogram and random forest models outperformed the decision tree model in the diagnosis of postoperative cardiac patients with acute kidney injury.Huet al[31] showed that the random forest model has better predictive power than the nomogram model and can effectively predict the risk of cognitive impairment in older adults.These results further demonstrate that the random forest model has a strong comprehensive prediction ability.As this was a retrospective study,all data were obtained from the same hospital,and the sample representation was limited.
CONCLUSION
This study established nomogram,random forest,and decision tree prediction models for T2DM complicated by DN using a machine learning algorithm.The result showed that the random forest model had good prediction and stability,thus providing a reference for the clinical identification of T2DM complicated by DN.Future studies need to further validate the model through prospective multi-center data and include more variables and samples to further improve the predictive ability of the model to better guide clinical practice.
ARTICLE HIGHLIGHTS
Research background
Hyperglycemia is the main pathophysiological feature of diabetes,and its complications are the key factors of death and disability in patients with diabetes.Diabetic nephropathy (DN) is a microvascular complication and is one of the main complications of diabetes.The initial prediction of DN is beneficial for taking measures to prevent and delay the occurrence and progression of corresponding complications.Machine learning has been widely used to construct predictive models for diabetic complications.
Research motivation
Patients with type 2 diabetes mellitus (T2DM) complicated by DN are at high risk of mortality.We explored the factors affecting the complications of DN to establish three prediction models commonly used in medicine,compared the prediction effects,and selected the optimal model to provide a basis for clinical identification of patients with T2DM complicated with DN.
Research objectives
This study aimed to explore the factors influencing T2DM complicated with DN and use these factors to construct a prediction model for DN.The prediction effect of random forest is the best among the three models of nomogram,decision tree,and random forest and may become a useful tool for the early recognition of the risk of DN.
Research methods
We retrospectively analyzed the clinical data of 210 patients with T2DM treated at our hospital between August 2019 and August 2022.Factors influencing DN were analyzed,and nomograms,decision trees,and random forest prediction models were established to compare their prediction efficiency.These three prediction methods are widely used in the medical field and have advantages and limitations.At the same time,through research,we can select a more suitable model to predict the complication risk of DN.
Research results
Fasting blood glucose,serum creatinine,glycosylated hemoglobin,diabetic retinopathy,and the duration of diabetes were independent factors influencing DN.Among the established nomograms,decision trees,and random forest prediction models,random forest has the best predictive ability and can be applied to the prevention and early screening of DN.Future studies should validate the model using prospective and multi-center data and include more samples and variables to further improve the prediction ability of the model.In addition,existing algorithms should be further improved,and a combination of multiple algorithms should be considered to improve the prediction accuracy.
Research conclusions
In this study,the predictive performances of three models were compared.The random forest model performed best in predicting the risk of DN in patients with T2DM and may be a useful alternative tool for diagnosing T2DM.
Research perspectives
Future studies should include larger and more comprehensive samples,conduct multi-center studies,further improve existing algorithms,and consider the combination of multiple algorithms to construct a more complete and accurate prediction model.
FOOTNOTES
Author contributions:Cai SS contributed to the conception and design of this study;Zheng TY and Wang KY participated in the administrative support;Zhu HP took part in the provision of study materials or patients;and all authors approved the final manuscript.
Institutional review board statement:The study was reviewed and approved by the First People’s Hospital of Wenling (Approval No.KY-2023-2034-01).
Informed consent statement:Approved exemption for informed consent.
Conflict-of-interest statement:All the authors report no relevant conflicts of interest for this article.
Data sharing statement:The clinical data for research can be obtained from the corresponding author.
Open-Access:This article is an open-access article that was selected by an in-house editor and fully peer-reviewed by external reviewers.It is distributed in accordance with the Creative Commons Attribution NonCommercial (CC BY-NC 4.0) license,which permits others to distribute,remix,adapt,build upon this work non-commercially,and license their derivative works on different terms,provided the original work is properly cited and the use is non-commercial.See: https://creativecommons.org/Licenses/by-nc/4.0/
Country/Territory of origin:China
ORCID number:Sha-Sha Cai 0000-0002-3297-4702;Teng-Ye Zheng 0009-0008-8444-9054;Kang-Yao Wang 0009-0003-3898-2388;Hui-Ping Zhu 0009-0000-9631-1951.
S-Editor:Wang JJ
L-Editor:A
P-Editor:Xu ZH
 World Journal of Diabetes2024年1期
- World Journal of Diabetes的其它文章
- Effects of Tai Chi in diabetes patients: Insights from recent research
- Management of monogenic diabetes in pregnancy: A narrative review
- Prediabetes: An overlooked risk factor for major adverse cardiac and cerebrovascular events in atrial fibrillation patients
- Predictive value of bilirubin and serum γ-glutamyltranspeptidase levels in type-2 diabetes mellitus patients with acute coronary syndrome
- Heterogeneously elevated branched-chain/aromatic amino acids among new-onset type-2 diabetes mellitus patients are potentially skewed diabetes predictors
- Investigating the relationship between intracranial atherosclerotic plaque remodelling and diabetes using high-resolution vessel wall imaging
