Effects of coal mining and tunnel excavation on groundwater flow system in karst areas by modeling: A case study in Zhongliang Mountain,Chongqing, Southwest China
Qing-shan Li, Xiao-bing Kang, Mo Xu, Bang-yan Mao
1 Sichuan Tianshengyuan Environmental Service Co., Ltd, Chengdu 610036, China.2 State Key Laboratory of Geohazard Prevention and Geoenvironment Protection, Chengdu University of Technology, Chengdu 610059,China.3 China Railway Eryuan Engineering Group Co., Ltd., Chengdu 610031, China.
Abstract: A karst groundwater system ranks among the most sensitive and vulnerable types of groundwater systems.Coal mining and tunnel excavation can greatly change the natural hydrogeological flow system,groundwater-dependent vegetation, soil, as well as hydrology of surface water systems.Abandoned coal mine caves and proposed highway tunnels may have significant influences on groundwater systems.This study employs MODFLOW, a 3D finite-difference groundwater model software, to simulate the groundwater system's response to coal mining and tunnel excavation impact in Zhongliang Mountain, Chongqing,from 1948 to 2035.The results show a regional decline in groundwater levels within the study area following mining and tunnel construction.The groundwater flow system in the study area evolves from the Jialing River groundwater flow system to encompass the Jialing River, Moxinpo highway tunnel, Moxinpo,and the Liujiagou coal mine cave groundwater flow systems between 1948 and 2025.With the completion of tunnel construction, the groundwater level at the top of the tunnel is gradually restored to the water level in the natural state.The model also predicts groundwater level variations between 2025 and 2035.The groundwater level will rise further initially, however, it may take about 10 years for the system to stabilize and reach a new equilibrium.In light of these findings, it is advised that changes in groundwater flow systems caused by tunnel construction should be modeled prior to the practical construction.This approach is crucial for evaluating potential engineering and environmental implications.
Keywords: Human activities; Aquifer system; Evolution of groundwater system; Numerical modeling
Introduction
Mining and tunnel construction activities have been carried out in various high mountain regions across the world due to the growing demand for energy and urban transportation development.In Chongqing, China, more than 70 tunnels and 60 coal mines have been constructed in four mountain regions: Zhongliang Mountain, Mingyue Mountain, Tongluo Mountain and Huaying Mountain (Kang et al.2015).The number of planned tunnels in these areas is expected to double in the next 20 years to 30 years, while abandoned coal mine caves that have not been remediated will remain in a state of drainage.These activities have significantly altered the natural environment of the these mountain areas, particularly in the karst basin, and have caused severe impacts on the delicate karstic aquifers (Liu et al.2019).Coal mining and tunnel excavation can disrupt the natural karst hydrological processes and alter runoff patterns,leading to groundwater drainage, underground river cut-off, and changes in the natural hydrogeological flow system.This also affects groundwaterdependent vegetation, soil, as well as hydrology of surface water systems (Fu, 2019; Li et al.2021;Liu et al.2019; Hou et al.2019; Gong et al.2018).
Regional groundwater systems typically discharge into the rivers and subterranean streams (Ren et al.2021), constituting their ultimate discharge zone.However, coal mining and large-scale tunnel construction can profoundly reshape the regional groundwater regime by reducing the groundwater discharge in the rivers and subterranean streams while augmenting the flow path of groundwater towards the surface (Jiang et al.2009; To´th,1963).In karst areas, the activities of coal mining and underground tunnel construction often lead to the formation of flood discharge channels for underground water.These channels frequently represent zones of the most vigorous groundwater flow and eventually become permeable hollow channel.Consequently, this transformation disrupts the natural regional groundwater flow system and disturbs the dynamic interaction that normally occurs among groundwater, underground river, and surface water.
As coal extraction operations go deeper into the earth, the challenge of mine water inrush from highpressure confined karst water becomes increasingly significant (Sun et al.2015).Groundwater intrusion and its subsequent effects on drainage,such as regional groundwater table lowering, overlapping cones of depression, subsidence, and water quality degradation present environmental concerns that pose risks to both mining operations and human safety.Mine drainage disrupts the equilibrium conditions of groundwater dynamic and devising effective solutions to these issues is of utmost importance.Various methods have been developed and employed to predict flows from surrounding strata and groundwater levels during different stages of mining (Zhang et al.2018).Analytical solutions and numerical modelling have been utilized to evaluate groundwater inflow into mines (Hanna et al.1994; Rani and Chen, 2010;Zhang et al.2018).To investigate the impact of coal mining on groundwater, researchers have applied mathematical analysis and numerical modelling techniques.They explore how groundwater enters the coal mine cave, how the groundwater level changes in the mining area, how groundwater discharge alters, and how groundwater regimes reshape the hydrogeological environment(Bahrami et al.2014; Dafny et al.2010; Hanna et al.1994; Lin and Lin, 2019; Naidu et al.2013;Rani and Chen, 2010; Surinaidu et al.2014; Wang et al.2019; Zhang, 2013).
Tunnelling activities in karst areas can have a significant impact on the local karst water system.The alterations in the groundwater flow field,water cycle processes, and their spatial and temporal distribution are the primary outcomes of these activities (Li et al.2021).Given that tunnels are typically excavated below the groundwater table,especially in karst terrains, groundwater tends to ingress into and subsequently egress from theses tunnels, leading to a decline in groundwater table.This phenomenon has the potential to disrupt the natural hydrogeological flow system, consequently impacting the vegetation, soil, and hydrology of surface water systems, including springs,wells, streams, lakes, wetlands, and associated aquatic ecosystems (Ford and Williams, 2007; Lv et al.2020; Vincenzi et al.2009) present in karst landscapes.
Apart from drainage concerns, tunnel excavation can trigger substantial alterations in the local hydrogeology, thereby leading to enhanced internal erosion, development of sinkholes, and subsequent formation of karst collapse.Ground subsidence, settlement, and karst collapse are among the most prevalent changes observed (Gutiérrez et al.2014).The process of tunnel excavation within karst areas has the potential to modify the physical and chemical properties of soil, potentially accelerating soil erosion.Tunnel drainage can also cause surface water to dry up, and induce a drawdown of groundwater levels, thereby disrupting the intricate interactions between surface water, groundwater, and soil water in the vadose zone.As a result,there is a deline in soil moisture, which in turn affects the composition and functions of soil microbial communities (Lv et al.2020).Moreover,the growth and development of plants can be negatively impacted due to the reduced soil water availability, thereby impacting critical aspects such as rooting, sprouting, flowering, and fruiting of vegetation.
Recent studies focusing on hydrological modeling in karst basins with tunnels have predominantly concentrated on predicting tunnel water inrush.These investigations aim to simulate the underground water flow patterns or seepage fields influenced by tunnels, address associated engineering geological hazards such as karst collapse, and evaluate the environmental impacts of tunneling in karst regions.To achieve these goals, researchers commonly employ modelling tools such as MODFLOW and FEFLOW (Nguyen, 2021; Li et al.2021; Wang et al.2019).Additionally, classical hydrological modelling software, like Systeme Hydrologique Europeen (SHE) and SWAT models, are frequently used for hydrological simulations and predictions in karst areas (Li et al.2021).
Most studies on the impacts of mining have focused on its effects on groundwater runoff patterns or the consequences of tunnel drainage on the groundwater system, groundwater-dependent vegetation, soil, and the hydrology of surface water systems.Typically, these studies emphasize the excavation phase exclusively.However, there are only a limited number of case studies examining the effects of coal mining and tunnel excavation on actual aquifer systems across historical, current,and future perspectives, utilizing regional numerical models (Zhang et al.2015).
Based on previous data analysis, it was observed that prior to 1956, a comprehensive survey of the study area documented approximately 195 springs,collectively yielding a flow of 286 L/s.In contrast,by the year 2016, only 12 springs remained, contributing a total flow of 2.855 L/s, which represents a 99.9% reduction in the total flow, mainly caused by the decline in groundwater levels due to coal mining.
This study analyzes the karst aquifer system and its hydrogeological characteristics within Zhongliang Mountain, situated in Chongqing, Southwest China.Using 3D groundwater modeling approach,it comprehensively examines the impacts of historical, ongoing, and prospective coal mining and tunnel excavation activities on groundwater flow systems within the Chongqing Zhongliang Mountain.The findings from this research are expected to offer valuable guidance for the planning, design,and maintenance of sustainable development strategies within an urbanized mountainous area (Hu and Jiao, 2010).This study not only holds theoretical significance, but also carries practical implications.
1 Study area
1.1 Study area
Chongqing has a humid subtropical monsoon climate characterized by a mean annual rainfall of approximately 1,122 mm, while the average annual evaporation stands at 1,050 mm.The study area is located in the north of Jialing River and south of Wulipo in Beibei District of Chongqing.It falls in the Zhongliang Mountain barrier structure anticline area, encompassing an area of approximately 143 km2.The elevation in this region ranges from 750 m at the hill top to 150 m along the course of Jialing River (Fig.1).
The terrain within the study area exhibits an undulating character, with valleys crisscrossing and low mountains and hills alternating in their presence.The mountains are in the form of narrow strips and spread mostly along the NNE direction,forming a parallel ridge valley landscape.The development of landforms is dominated by regional geological structure and stratigraphic lithology (Zhong et al.2018).Anticlines develop into mountains and synclines into valleys.The extension of the topography roughly aligns with the orientation of the regional structure line.
1.2 Geology and hydrogeology
The study area is mainly composed of Permian,Triassic, and Jurassic strata, located in the Guanyinxia anticline of the Huayingshan broom-shaped fold bundle within the New Cathaysian System.Three notable anticlines: Longwangdong, Wentangxia, and Guanyinxia, have developed in the study area.The Guanyinxia anticline is characterized by mountainous terrain with a tightly compressed core, and asymmetrical east and west wings.The western side is steep with a degree of approximately 76°, while the eastern side is gentler with slopes ranging from 39° to 53°.Furthermore,the Yuelai syncline and Beibei syncline are present on the east and west wings, respectively (Zhao et al.2015).
Based on the lithology and water-bearing characteristics of the strata in the study area, four types of water-bearing characteristics have been identified: Rich water-bearing, medium water-bearing,low water-bearing, and impermeable.These correspond to four distinct aquifer groups: Carbonate aquifer group, carbonate with clastic aquifer group,clastic aquifer group, and impermeable aquifer, respectively.The groundwater types encompass carbonate fractured cave water, clastic with carbonate fractured cave water, clastic pore-fracture water,and confined water.
Combined with the physical water barrier present in the study area, namely the contact surface between soluble and non-soluble rock and a waterblocking fault, the aquifer system is divided into three distinct systems: The NW wing of the Guanyinxia anticline aquifer system (GNW aquifer system), the core of the Guanyinxia anticline aquifer system (GC aquifer system), and the SE wing of the Guanyinxia anticline aquifer system(GSE aquifer system) (refer to Fig.2 and Table 1).The GNW and GSE aquifer systems (Li, 2017)comprise the Carbonate aquifer group (T1j, T2l,T1f3) and the Clastic aquifer group (T3xj), whereas the GC aquifer system comprises the Carbonate with Clastic aquifer group (T1f1, T1f2, P2c, P2l,P1m).

Fig.1 Simplified geologic map and location of the study area in Chongqing Zhongliang Mountain
2 Materials and methods
2.1 Materials
2.1.1 Conceptual model
The structural belts in the study area are all arched structures in the southeast bulge, with an axial direction of North-East 20° to 28°, which is consistent with the strike of stratigraphy.The Moxinpo highway tunnel, Moxinpo coal mine cave, and Liujiagou coal mine cave extend roughly perpendicular to the strata's strike.The above factors are considered to simplify the calculation of insignificant models.The northeast 24° is selected as the Yaxis direction of the model.The length of the model is 18 km along the direction of Y-axis,while the width of the model is 8 km along the Xaxis.The southern boundary of the model is defined by the Chongqing Ring Expressway, while the northern boundary extends to Wulipo-Wuliba,marking the surface watershed.The model is bounded by Wenjiagou-Dongyang Township in the west, and by Qiyi Village-Hexi Village in the east.The entire model domain is 144 km2(Fig.1).
To simplify the modeling process, the entire system is treated as a porous system.The northern and southern boundaries are approximated as noflow boundaries due to the presence of watershed.Similarly, the east and west boundaries are treated as a no-flow boundary due to the existence of an impermeable aquifer, which includes the Jurassic sand and mudstone formations (Table 1).
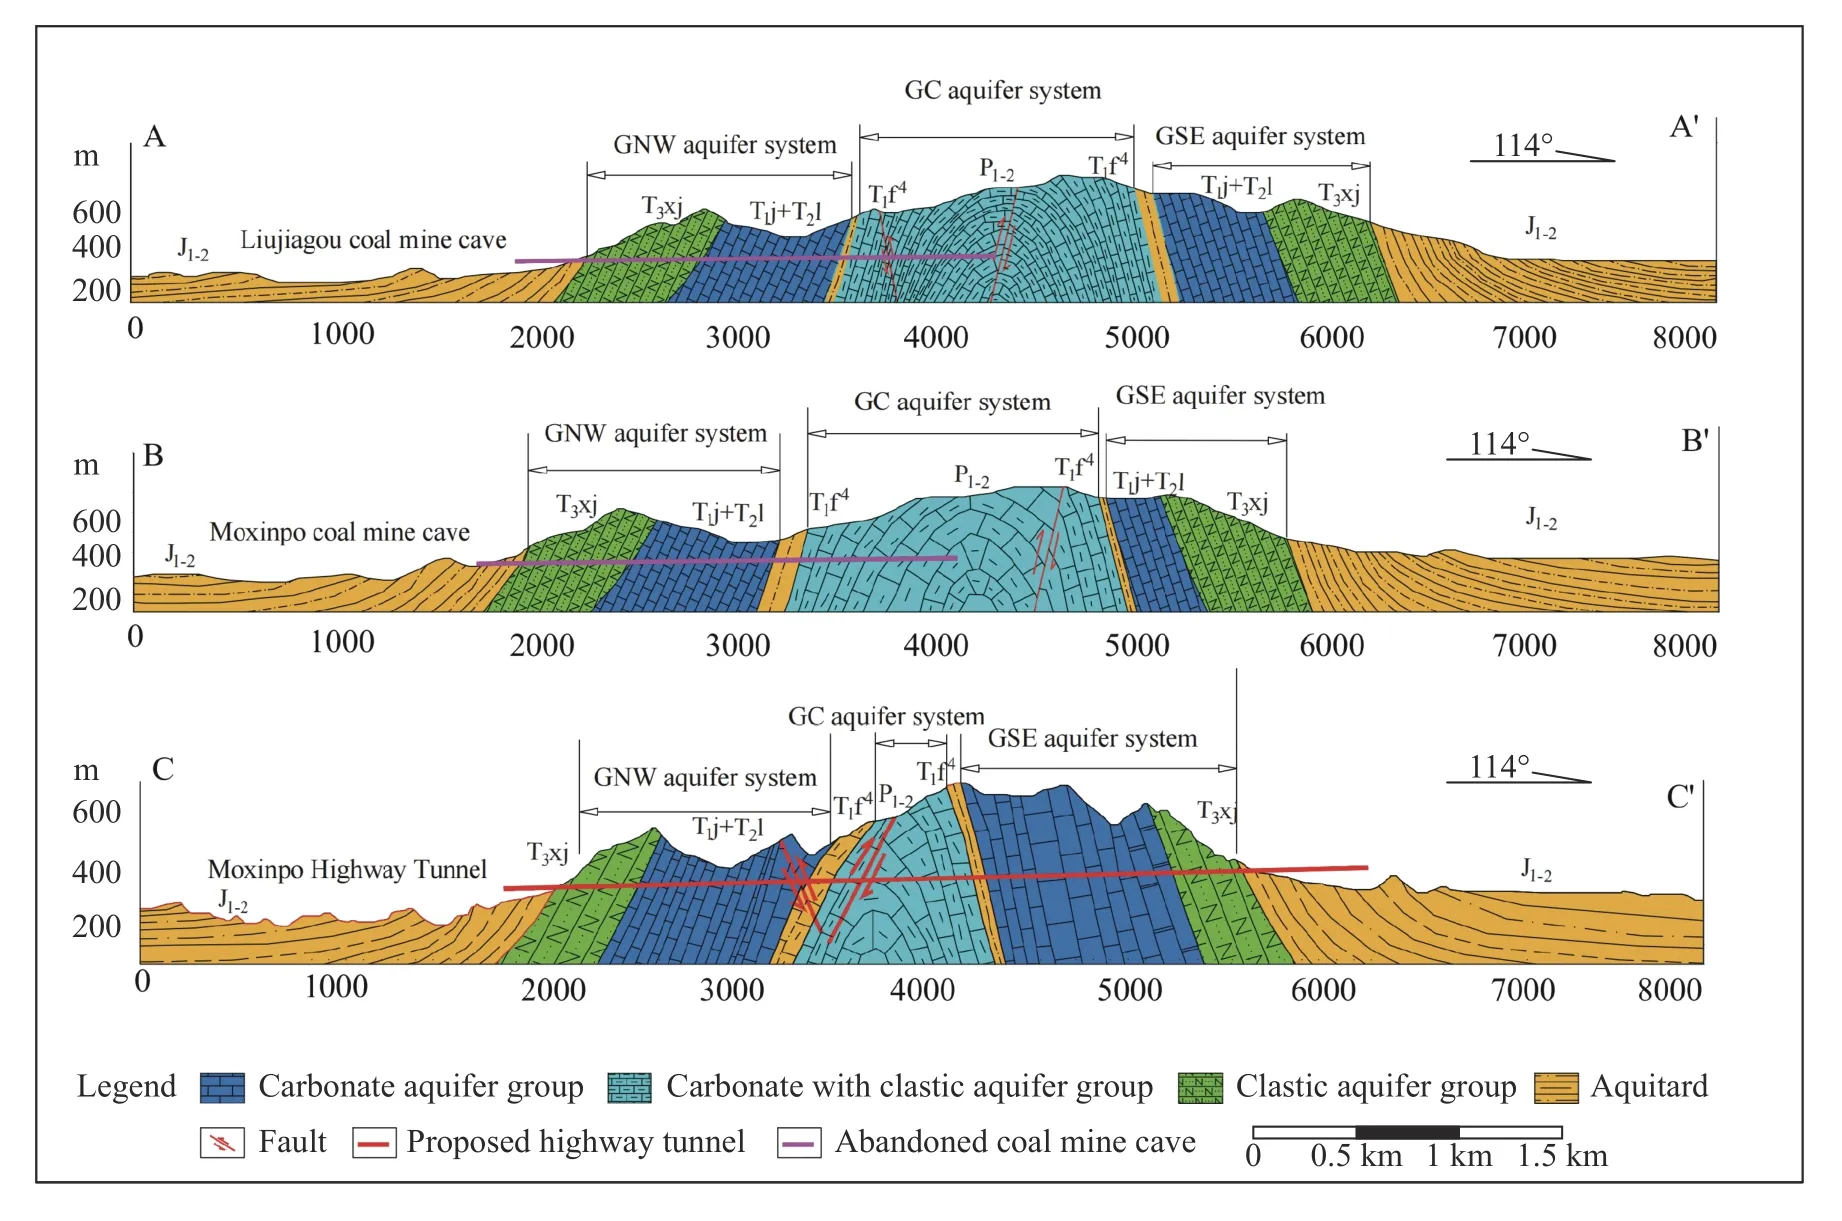
Fig.2 Hydrogeological cross-sectional: A-A' passes through Liujiagou coal mine, B-B' passes through Moxinpo coal mine, and C-C' passes through Moxinpo highway tunnel
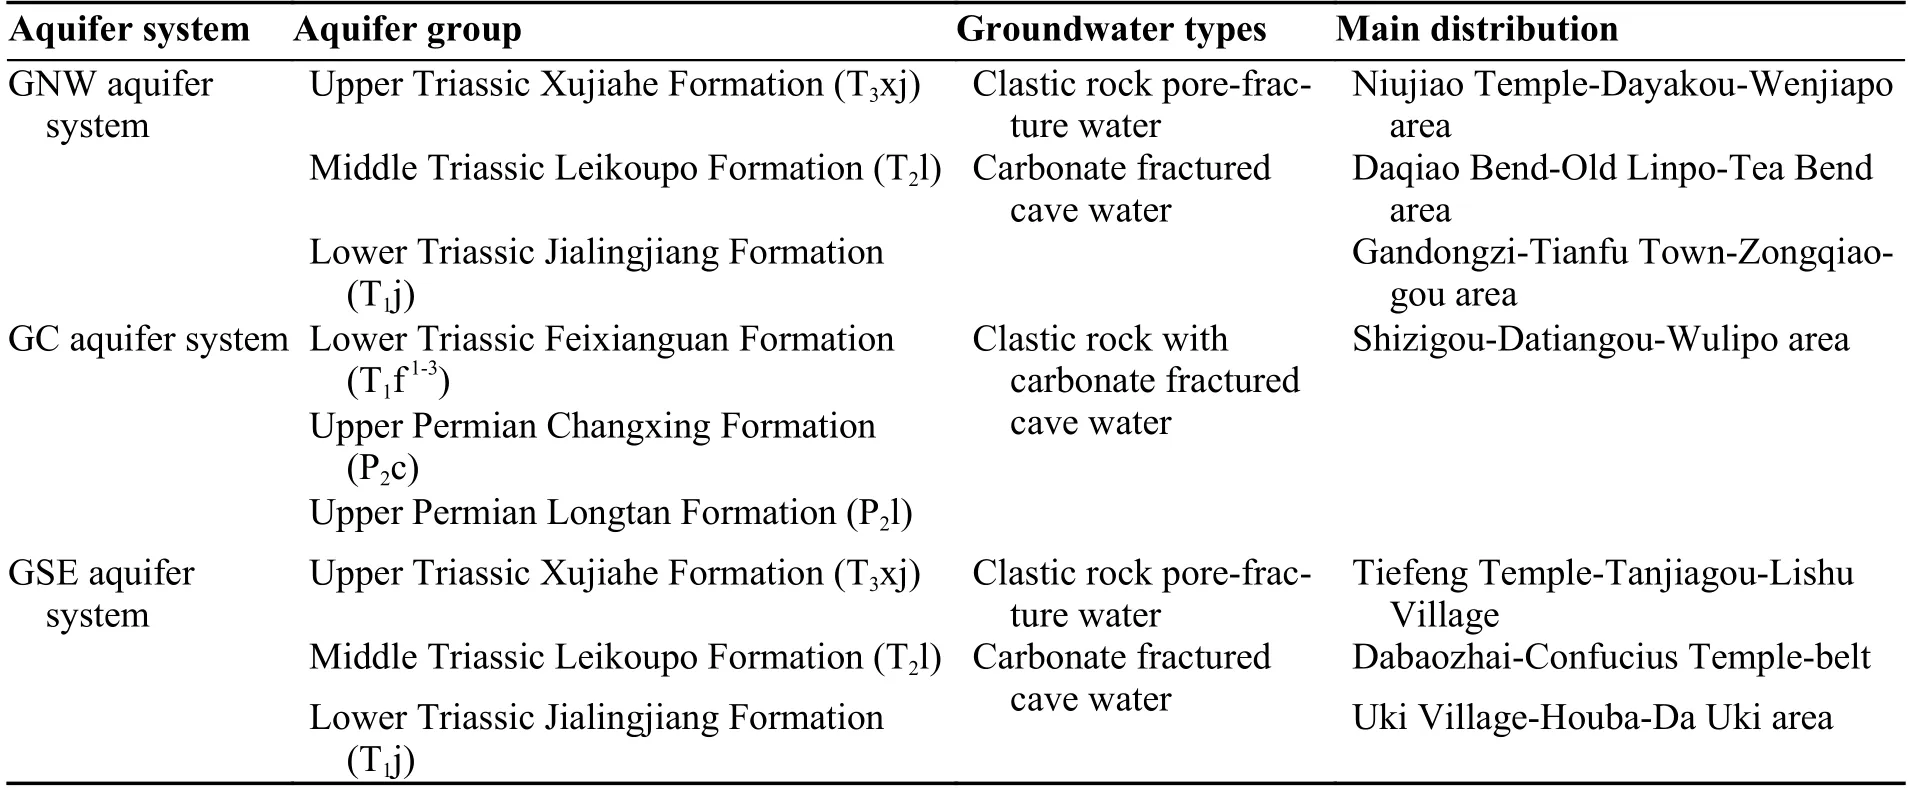
Table 1 Division and distribution of aquifer system in the study area
The model is divided into 17 layers, 133 rows,125 columns, yielding a total of 282,625 grid cells(Fig.4).In the range of coordinates 1,500-6,000 m along the X direction, the model is divided with a uniform length of 50 m, while in the remaining range, a uniform length of 100 m is applied, resulting in a total of 125 columns.The Y direction is divided into key areas and non-key areas based on the significance of the simulated areas.Key areas include the Moxinpo tunnel area, Moxinpo, and Liujiagou coal mine cave area, while the remainder is classified as non-key areas.Grids within the key area are divided with a length of 50 m, while the remaining areas or non-key areas are divided with a length of 200 m.In the Z direction, the surface elevation of the simulation area varies from 170 m to 900 m, and the bottom of the model is represented as a flat plane with an elevation ofz=100 m.The thickness of each layer is assigned based on the tunnel project and the elevation of the coal mine cave.The elevation of the Moxinpo tunnel ranges from 261.4 to 284.2 m, the elevation of the Moxinpo coal mine cave is 230 m, and the elevation of the Liujiagou coal mine cave is 285 m.Therefore, the elevation range of 230 m to 285 m is finely divided vertically into layers with a uniform thickness of 25 m, while the upper and lower layers are assigned a uniform thickness of 50 m.Elements within the model affected by the terrain are automatically designated as thin layers with a thickness of 1 m in Visual MODFLOW, and these thin cells are set as inactive in the calculation.
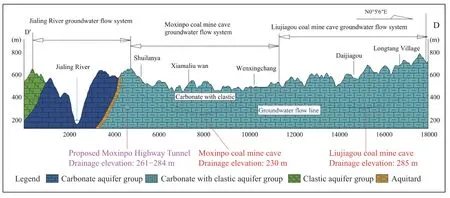
Fig.3 Longitudinal section plan of D-D'
Exposed strata within the model area includes P2c, T1f, T1j, T2l, T3xj, J1z, J1-2z, J2x, J2s.Based on the classification of water-bearing capacity, T1f3,T1j, T2l constitute strong rich water-bearing soluble rocks, while T1f1, T1f2, P2c, P2l, and P1m are categorized as rich-medium water-bearing soluble rocks.T3xj represents medium-low water-bearing rocks, and strata such as J1z and J1-2z, function as relatively aquitard.
2.1.2 Boundary conditions
(1) Recharge boundary
The study area primarily receives recharge from atmospheric rainfall, with an annual precipitation of approximately 1,140 mm.The abundant rainfall serves as the primary source of groundwater replenishment.The area is divided into soluble and non-soluble rock areas based on lithology.Within the non-soluble rock zone, most of the rainfall flow along the surface streams and gullies, eventually discharging into the Jialing River due to relatively low hydraulic conductivity (K) and infiltration coefficient.Only a minor portion of rainfall infiltrates into the ground.In contrast, the soluble rock area displays a well-developed karst landscape within the karst trough area.Numerous depressions, sinkholes, and karst funnels are distributed in a linear patter from south to north.This region is crucial for supplying recharge to the karst area.Rainwater flows down through the vertical karst pipes and fissures and occurs in the karst pipes in the stratum.
The multiyear average annual precipitation of 1,140 mm is allocated to various zones based on surface infiltration coefficient.The model's infiltration area is divided into four sections according to stratum lithology and topographic slope of the study area.Area (1) predominantly comprises T1f3-1and P2-3limestone intercalated with clastic rocks,with slopes ranging from 33° to 70°.The infiltration coefficient for this zone is set at a comprehensive value of 0.3.Area (2) is characterized by T1j limestone and slopes between 0° and 23°, with an infiltration coefficient of 0.4.Area (3) encompasses T1j sandstone and slopes ranging from 33°to 70°, with an infiltration coefficient of 0.1 assigned.Lastly, Area (4) features T1j sand and mudstone, with slopes between 0° and 33°.The infiltration coefficient of this zone is set as 0.05.Notably,regions marked by karst development in soluble rock formations should be assigned with higher infiltration coefficients, while regions dominated by non-soluble rock formations should have relatively lower coefficients.
(2) Natural drainage boundary
The drainage boundary of the model mainly includes the natural outlets, Jialing River, and surface evaporation.The natural outlets consist of the subterranean stream in the eastern karst trough valley with densely distributed depressions, sinkholes,and karst funnels.The springs are dispersed along the surface of the subterranean stream in the western karst trough valley.The Jialing River has the lowest drainage elevation in the entire model with a water level of 170 m.It spans a width of 200-400 m, and extends for approximately 9 km in length.Meanwhile, the drainage elevation of the subterranean stream in the eastern karst trough valley is also 170 m.It is recharged by surface water, extends over a distance of approximately 3 km and yields an annual discharge of roughly 40 L/s.In comparison, the drainage elevation of the subterranean stream in western karst trough valley reaches 215 m.It is also recharged by is surface water along 6 km in length.It contributes an annual discharge of around 40 L/s.The mean annual evaporation rate in the model is 1,250 mm.
(3) Artificial drainage boundary
In this model, three artificial drainage boundaries have been set up: The Moxinpo highway tunnel,the Moxinpo coal mine cave, and the Liujiagou coal mine cave.These boundaries are applied to provide a primary drainage pathways for groundwater.The groundwater system in the core of the Guanyinxia anticline and the groundwater system in the northwestern wing of the Guanyinxia anticline are subdivided into several groundwater units due to the existence of these new drainage channels.
Located in the Xinqiao Village-Xinyan area, the Moxinpo coal mine cave maintains a drainage elevation of 230 m, generating a flow rate of 2,100-6,362 m3/d.Conversely, situated in the Wulipo-Wuliba area, the Liujiagou coal mine cave has a drainage elevation of 285 m, contributing to a flow rate of 1,992-12,960 m3/d.The Moxinpo highway tunnel is located in the Wuji Village-Shuilanya area, with the elevation of 261-284.2 m and a length of 4.79 km.The maximum burial depth of this tunnel of 340 m.In this model, groundwater extraction and low-yield springs have been omitted due to the absence of detailed information.
2.2 Numerical modelling approach
To comprehensively investigate the impact of coal mining and highway tunnels on the groundwater flow system in the study area, a 3D hydrogeological model was established using MODFLOW, on the platform of Visual MODFLOW.MODFLOW,initially developed by the US Geological Survey during the 1980s, is a 3D finite-difference numerical simulation software for groundwater flow analysis.Over the years, MODFLOW has been widely used to simulate the effects of well flow, rivers,drainage, evaporation, and recharge on water flow systems with heterogeneous and complex boundary conditions.The discretized methodology employed within MODFLOW allows for simplification of hydrogeological system, while its modular program structure facilitates diverse solution techniques.Notably, groundwater flow simulation utilizes mathematical model with 3D distributed parameters and block homogeneity and anisotropy,which has the capacity for both steady state and transient simulations.
2.2.1 Model scenarios
The model is first run in a steady state to provide the initial water levels for the transient flow at the beginning of 1948.In the steady-state model, the infiltration rate is determined based on the average daily rainfall of 1947 in Chongqing, China.
In accordance with the dynamic evolution of groundwater within the simulation area under the influence of human engineering activities, four modeling scenarios have been defined, namely, the natural state scenario, scenario of coal mining,scenario of tunnel excavation combined with coal mine cave, and scenario of with tunnel construction with coal mine cave.The boundary conditions,simulated flow patterns, and simulation duration are provided in detail (Table 2).
2.2.2 Model parameters
Considering the hydrogeological conditions and hydraulic properties of the simulation area, the primary groundwater flow direction in the model aligns with the Y-axis.Consequently, the anisotropy ratio of the hydraulic conductivity in each layer is set asKx:Ky:Kz=1:2:1, while the anisotropy ratio along the is established asKx:Ky:Kz=1:2:2.Combined with the regional hydrogeological survey report and previous research results(Zhao et al.2015) in other areas of Zhongliang Mountain, the initial values of hydraulic conductivity for each layer in the model are determined.A trial and error method has been used to adjust the parameter values (e.g.hydraulic conductivities and storage coefficients of the aquifer) in the sequential model run to fit the simulated heads to the calibration targets.The calibrated parameter values are shown in Table 3.
2.2.3 Model calibration
The initial heads for the steady state model were derived from the field-measured spring elevations in 1947.Groundwater level data from 16 groundwater observation springs (Fig.1) were provided by Chongqing Geological Environment Monitoring Agency.A steady-state flow model was developed and calibrated to the average groundwater levels from the 16 monitoring points for the period from 1948 to 1958.This was followed by a transient flow model with a calibration period of 1958-2035.A trial and error method was used to adjust the parameter values (e.g.hydraulic conductivities and storage coefficients of the aquifers) in the sequential model run to fit the simulated heads to the calibration targets.Statistical analysis of model results was conducted to evaluate the model.The calculated overall mean error for groundwater levels at the 16 observation spring locations is 0.35 m, the mean absolute error is 0.55 m, and the root mean square error is 0.99 m (Fig.5).This indicates a good fit between the simulated heads and the observed groundwater levels in the model domain.The calibrated values of the hydraulic properties used in the model, such as horizontal and vertical hydraulic conductivities (Kx,Ky, andKz), specific storage (Ss), and specific yield (Sy), are listed in Table 3.
3 Model results
3.1 Simulation of natural state (MXP-1)
To investigate the alteration in groundwater dynamics before and after coal mining and tunnel excavation, a simulation, represented by the firstmodelling scenario (MXP-1), was conducted to depict the natural state of groundwater flow in the study area.The natural groundwater flow field was obtained from this model.

Table 2 List of four modeling scenarios

Table 3 Hydraulic conductivity values of each strata
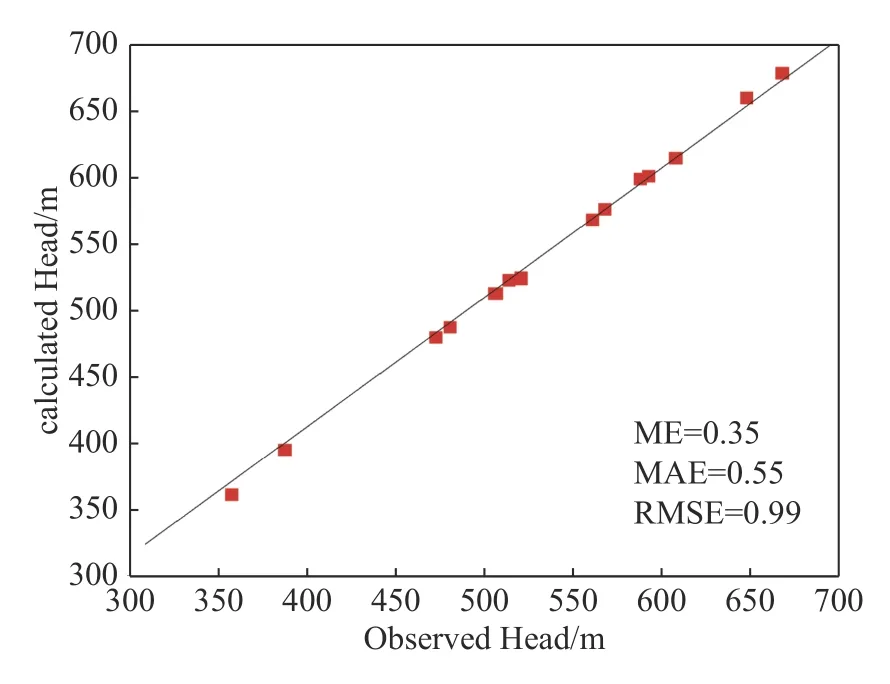
Fig.5 Comparison between observed and simulated groundwater levels at the 16 observation springs in the calibrated steady-state flow model
In the natural state, the modelled groundwater level ranges from 170 m to 768.9 m.Fig.6 shows the groundwater level distribution at the vertical elevation of 200 m, 300 m, 400 m, and 500 m.The groundwater levels are lower towards the eastern and western extents and higher in the central region.This pattern aligns consistently with the topography in the study area with mountains extending from north to south.When viewed longitudinally from north to south, the area with elevated water level is located in the middle of the model(Fig.6a), which corresponds with the inferred groundwater ridge identified through previous hydrogeological surveys.In conclusion, the regional groundwater level distribution is strongly dominated by the topography and spatial distribution of lithology.

Fig.6 Groundwater seepage field under natural state
Fig.6b presents the contour map of groundwater levels for the section encompassing the Moxinpo tunnel, Moxinpo, and Liujiagou coal mine caves in a natural state.The groundwater levels exhibit a lower elevation on two sides and a higher elevation in the middle, which aligns consistently with the local topography.A significant portion of this section are saturated with groundwater.The density of the groundwater level contours reflects the influence of the permeability and heterogeneity of the medium on the groundwater seepage field.Notably, areas dominated by soluble rock formations (such as limestone) display higher permeability, and the water level is sparse.Conversely, regions with non-soluble rock formations(such as sand and mudstone) exhibit denser water levels.
3.2 Simulation with coal mining (MXP-2)
Under the second modeling scenario (MXP-2) in Table 3, numerical simulation was conducted to account for coal mining, and the modelled groundwater level distribution is presented in Fig.7a.The groundwater drawdowns under the two scenarios can be obtained through the comparative analysis of the modelled groundwater levels in the natural state and the simulation with coal mining.
In the MXP-2 scenario, the result heads range from 170 m to 667.1 m.The influence of the mining activities of the two coal mines on groundwater levels affect the groundwater level throughout the simulation area, particularly abovez=200 m, is evident when comparing the groundwater level distribution maps in Fig.6a and Fig.7a.Notably, a significant drop in groundwater level occurs at 200 m (Fig.7c), primarily attributed to the drainage of groundwater from the upper region of the coal mine cave, leading to the depressurization of aquifer below the coal mine cave.
Fig.7b demonstrates that a substantial portion of the proposed highway tunnels remains saturated,and noteworthy changes in groundwater flow characteristics are observed in the cross section of the two coal mines compared to the natural state.The groundwater level contours are parallel to the top and bottom of the coal mine cave and are denser in the non-soluble rock areas with poor permeability.This alteration arises from the establishment of a predominant channel for groundwater drainage within the excavation area of the coal mine cave,resulting in an aggressive groundwater inflow into the coal mine cave and the significantly increased hydraulic gradient.
3.3 Simulation with tunnel excavation and coal mine cave (MXP-3)
In line with the third modeling scenario (MXP-3)in Table 3, a numerical simulation was executed to incorporate tunnel excavation and coal mine cave,groundwater level distribution was obtained for this scenario.The groundwater drawdowns under the two scenarios (MXP-3 and MXP-2) can be obtained through the comparative analysis of the result groundwater levels in these two scenarios.
Under the MXP-3 scenario, the groundwater levels in the simulation area range from 170 m to 689.1 m.By comparing the groundwater level distribution maps in Fig.7a and Fig.8a, it is evident that the overall groundwater level has experienced a decline.The excavation of the Moxinpo tunnel has further expanded the drainage area, especially in the upper region of the Moxinpo tunnel.This is depicted in Fig.8a (Z≥ 300 m), where a distinct drainage area is formed.This phenomenon can be attributed to the establishment of a new regional groundwater discharge boundary (Moxinpo tunnel).
As shown in Fig.8b, the region above the top of the tunnel has been completely drained due to the creation of a preferred channel for groundwater drainage in the excavation zone of the highway tunnel.The consequential effect of a substantial influx of groundwater into the highway tunnel leads to an increased groundwater discharge rate,ultimately resulting in the convergence of groundwater flow lines.Consequently, the groundwater table has experienced a significant drop when compared with the second scenario.The drawdown contour presented in Fig.8c illustrates that the groundwater level in the coal mine cave and tunnel excavation area has significantly dropped.The maximum drawdown of 348.3 m is observed in the vicinity of the tunnel excavation area.
3.4 Simulation with tunnel built and coal mine cave (MXP-4)
In accordance with the fourth modeling scenario(MXP-4) in Table 3, a numerical simulation was conducted involving the presence of a built tunnel and a coal mine cave.The modelled groundwater level distribution was obtained.The word of "built tunnel" indicates that the underground water drainage channel in the tunnel is blocked after completion of the tunnel.The groundwater drawdowns under the third and fourth scenarios can be derived by comparing the modelled groundwater levels in these two scenarios.

Fig.7 The groundwater flow simulation with coal mine cave
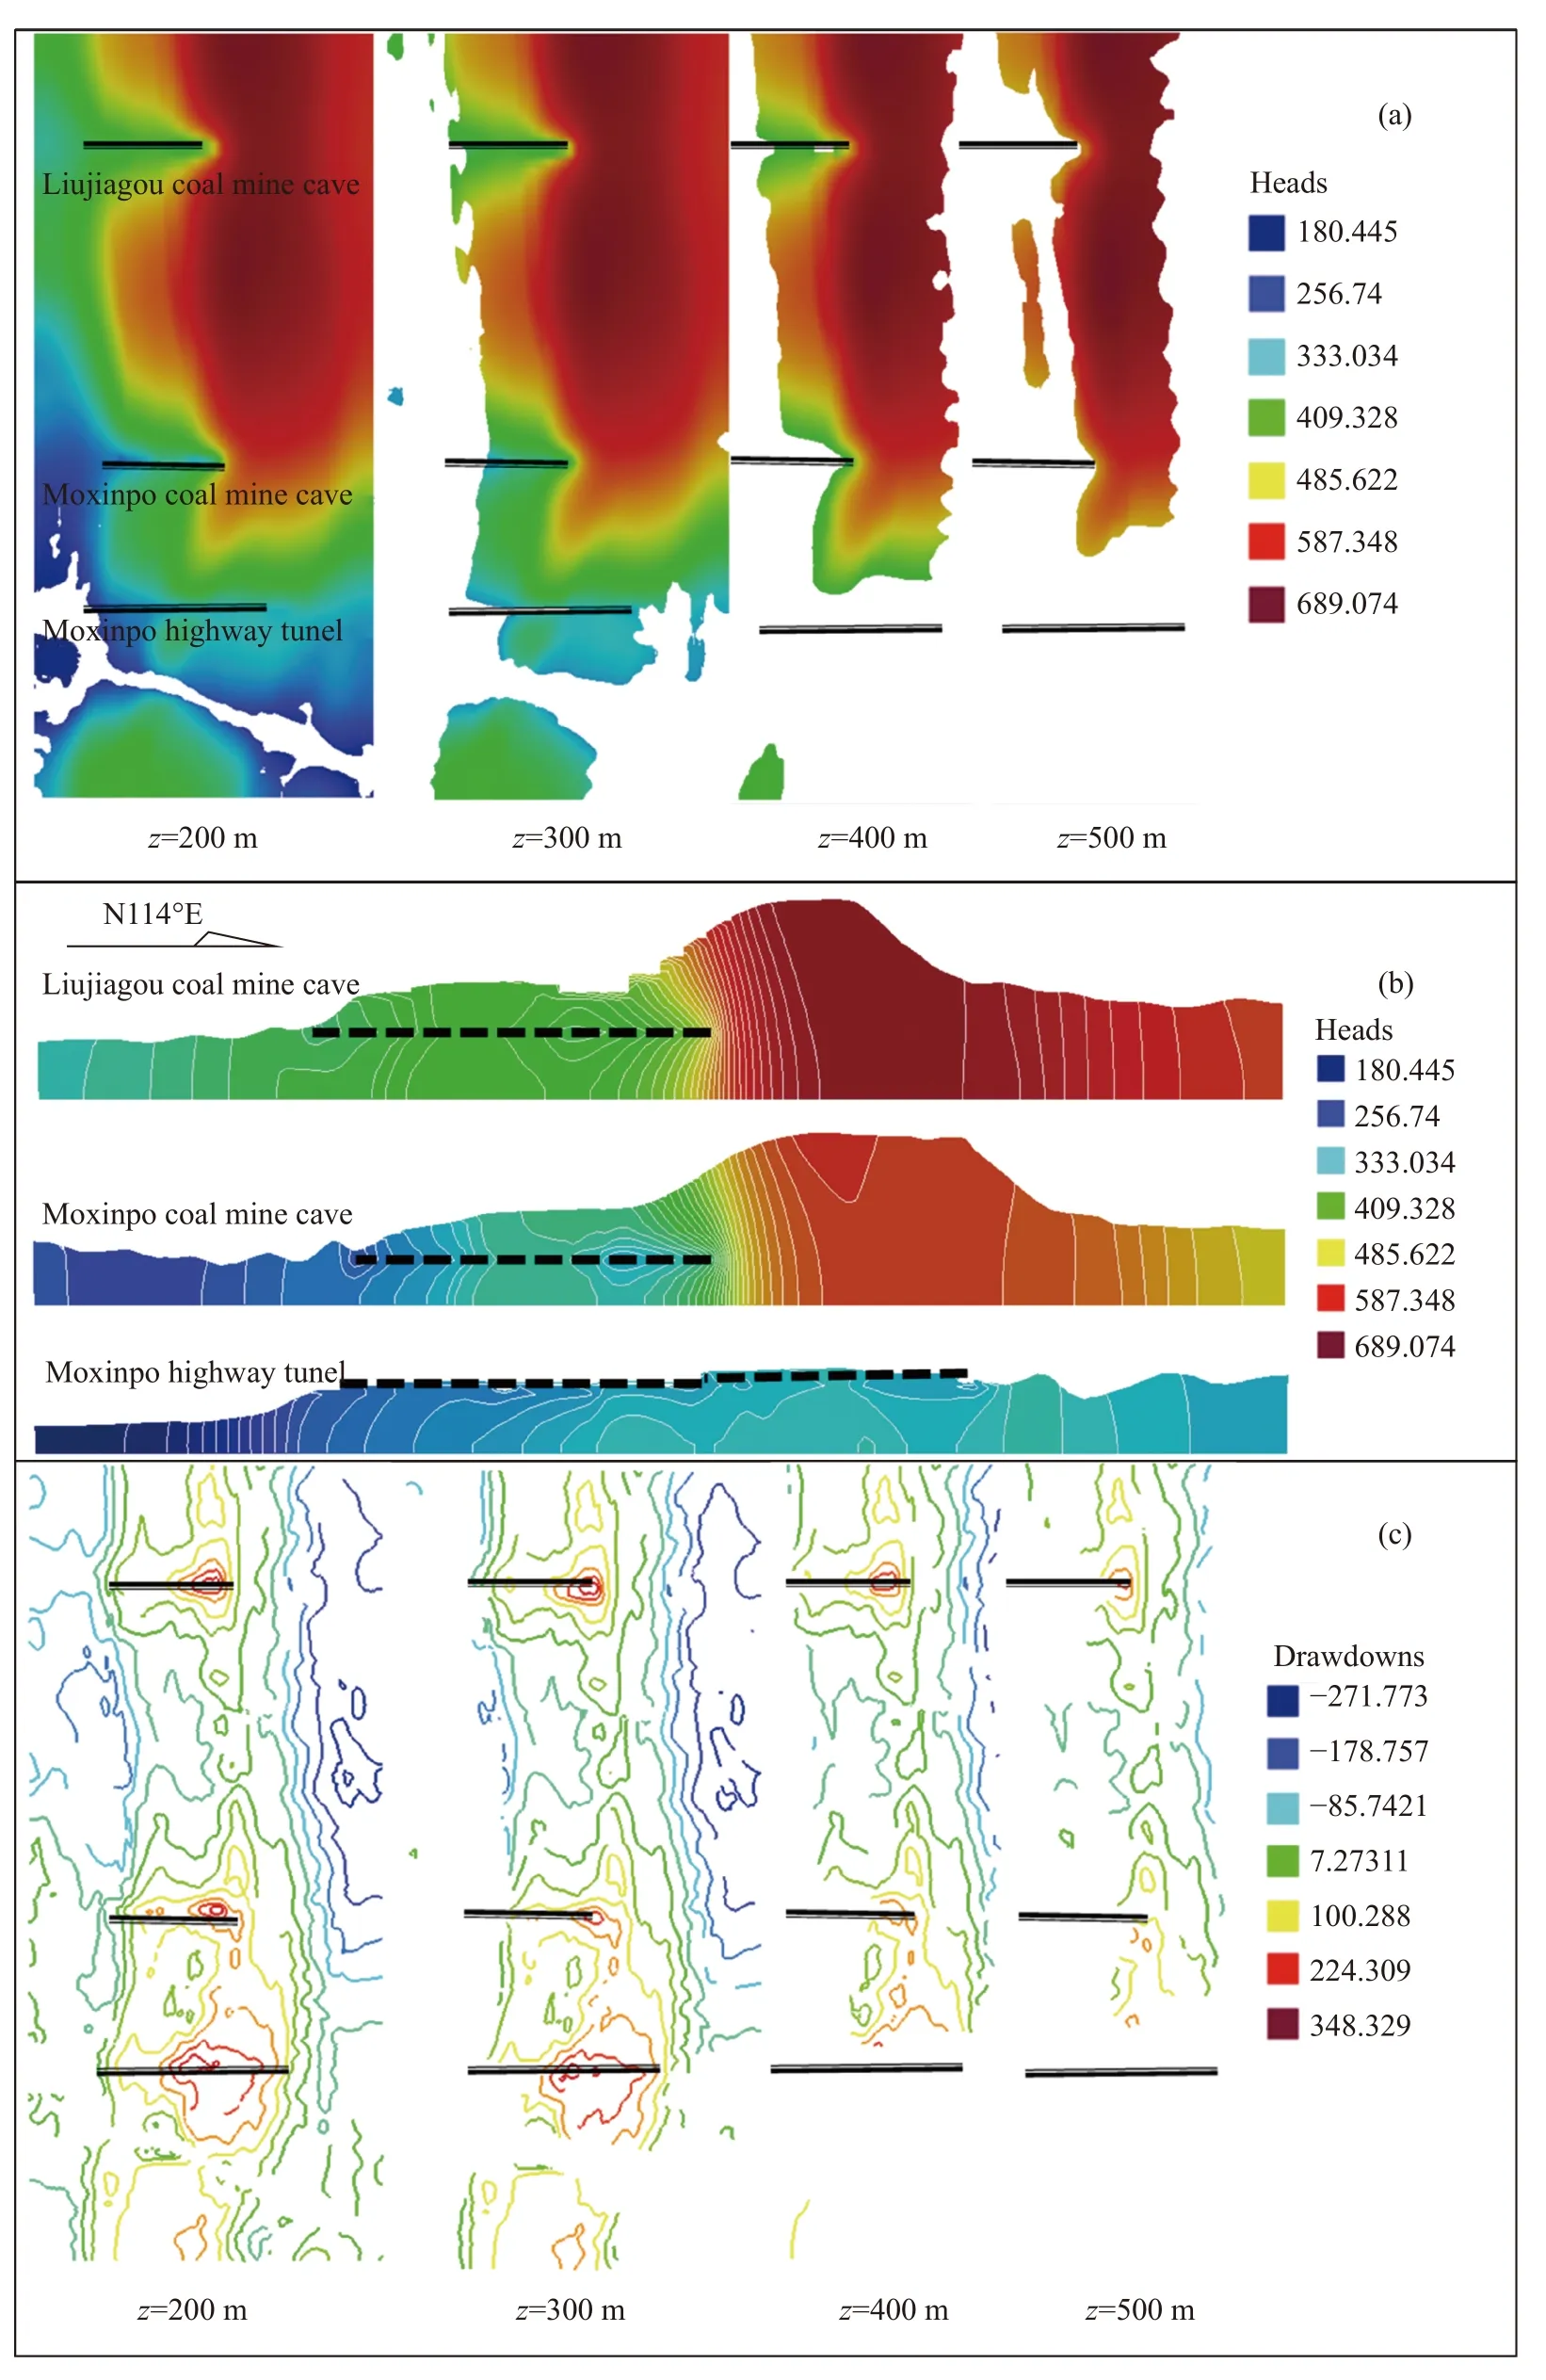
Fig.8 The groundwater flow simulation with coal mine cave
In the MXP-4 scenario, the modelled groundwater levels in the simulation area range from 170 m to 663.3 m.Notably, the groundwater level has rebounded, particularly in the vicinity of the tunnel area by comparing the groundwater level distribution maps in Fig.8a and Fig.9a.However, minimal changes are observed around the region of the coal mine cave.As shown in Fig.9b, the groundwater levels have recovered to a state similar to the second modeling scenario (MXP-2).Furthermore,Fig.9c indicates that the groundwater level in the upper region of the tunnel blockage has increased by 116 m.
4 Discussion
The primary focus of this study is the analysis of the groundwater flow field on the left bank of the Jialing River, while the flow field on the right bank is not discussed.The objective is to examine the impact of various human engineering activities on the groundwater flow system to minimize the interference of natural drainage boundary conditions,such as subterranean streams, with artificial boundary conditions (Jiang et al.2009; To´th, 1963).This paper mainly discusses the evolution of the groundwater flow system in the GC aquifer system, specifically focusing on the influence of human engineering activities.The GNW and GSE aquifer systems are not discussed in detail.
As depicted in Fig.10a, the Jialing River acts as the predominant drainage boundary of the GC aquifer system.Groundwater flows from the northwest side of the model's watershed towards the Jialing River.In addition to the shallow partial groundwater flow system, a distinct groundwater flow system associated with the Jialing River is identified.The simulation results align with realworld conditions, particularly those existing before 1948.
From 1948 to 2020, the Moxinpo and Liujiagou coal mines underwent mining operations and eventual closure.These coal mines were left without proper closure measures, leading them to integrate into the regional groundwater drainage boundary.During this period, the groundwater flow system within the study area transformed from solely relying on the Jialing River groundwater flow system to encompass the additional Moxinpo, and Liujiagou coal mine cave groundwater flow systems.The mining activities exacerbated groundwater discharge, resulting in the depletion of shallow groundwater and giving rise to various environmental and geological issues, such as water resources degradation, leakage of surface water and groundwater, landslides, mudslides, karst collapse,desertification, and rocky desertification (Lv et al.2020).
This article provides an in-depth examination of the simulation of the groundwater flow field in the study area, especially considering the construction of the Moxinpo highway tunnel and the coal mine caves over the time span of 2020-2025.As depicted in Fig.10c, the Moxinpo tunnel, Moxinpo,and Liujiagou coal mine caves now serve as the boundaries of the regional groundwater drainage system.During this period, the evolution of the groundwater flow system in the study area has once again expanded, this time incorporating the Moxinpo tunnel groundwater flow system, in addition to the previously existing Jialing River groundwater system, as well as the Moxinpo and Liujiagou coal mine cave groundwater flow systems.This development has led to an even more significant discharge of groundwater, exacerbating the area's environmental and geological challenges.Upon the completion of the tunnel construction,the drainage pathway within the tunnel is entirely obstructed, leading to a gradual recovery of the groundwater level at the upper section of the tunnel.As shown in Fig.10d, the groundwater flow system reverts to its previous state, as observed in in Fig.10b.
As depicted in Fig.11, the groundwater levels in the vicinity of the two coal mines exhibited a gradual decline towards the upper sections of the coal mine from 1948 to 1968.Subsequently, a state of dynamic equilibrium was achieved for the nearby groundwater regime, with temporary declines observed around the tunnel after coal mining activities, followed by a gradual return to a new equilibrium.Notably, between 2020 and 2025, the groundwater level experienced a significant drop to the level of the tunnel, resulting in the drainage of most of the groundwater above it following the excavation of the tunnel.With the completion of as the tunnel construction (from 2025 to 2035), the groundwater level within the tunnel gradually reverted to its original state.These fluctuations in groundwater levels across different engineering stages, are indicative of changes in the groundwater flow field, such as the evolution of the groundwater system.
According to the previous analysis, the evolution of groundwater flow system within the GNW aquifer system is similar to that of the GC aquifer system.However, notable variations occur in the groundwater flow system within the GSE aquifer,particularly in the area of the Moxinpo tunnel.Conversely, the groundwater flow system remains unchanged in other regions where the Moxinpo and Liujiagou coal mines do not overlap with their respective aquifers, extending to the GNW aquifer system.
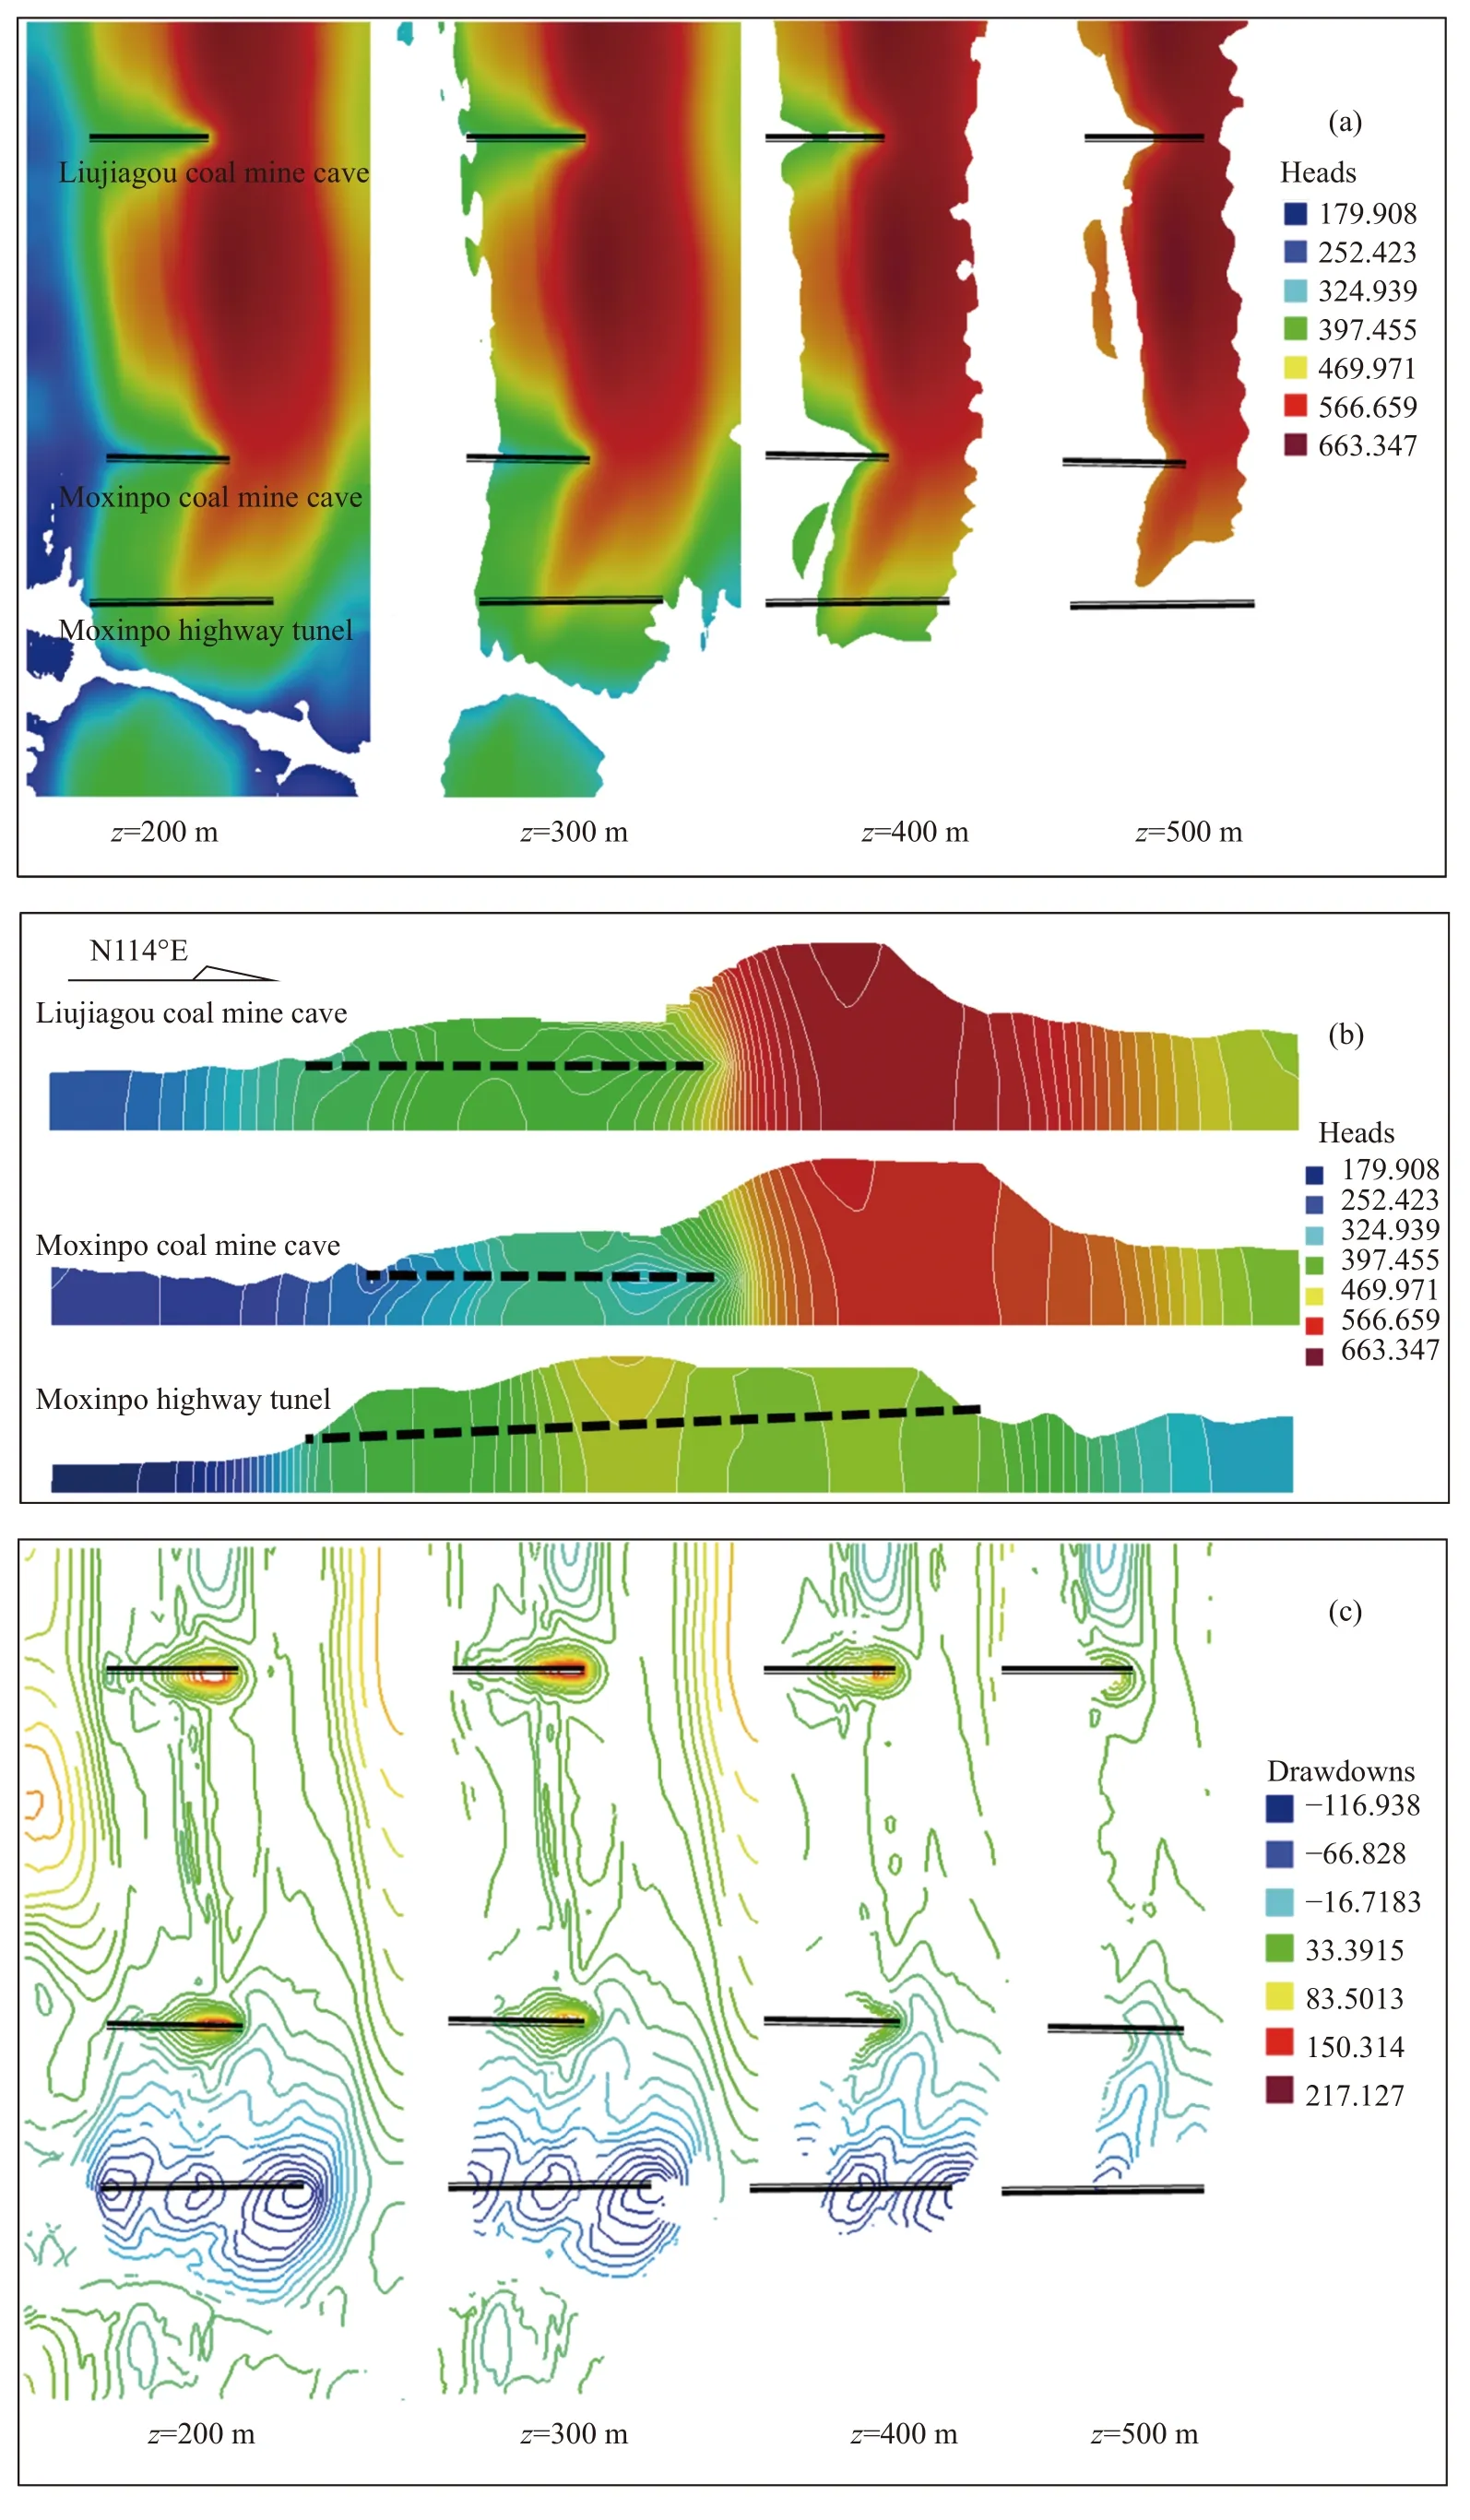
Fig.9 The groundwater flow simulation with coal mine cave
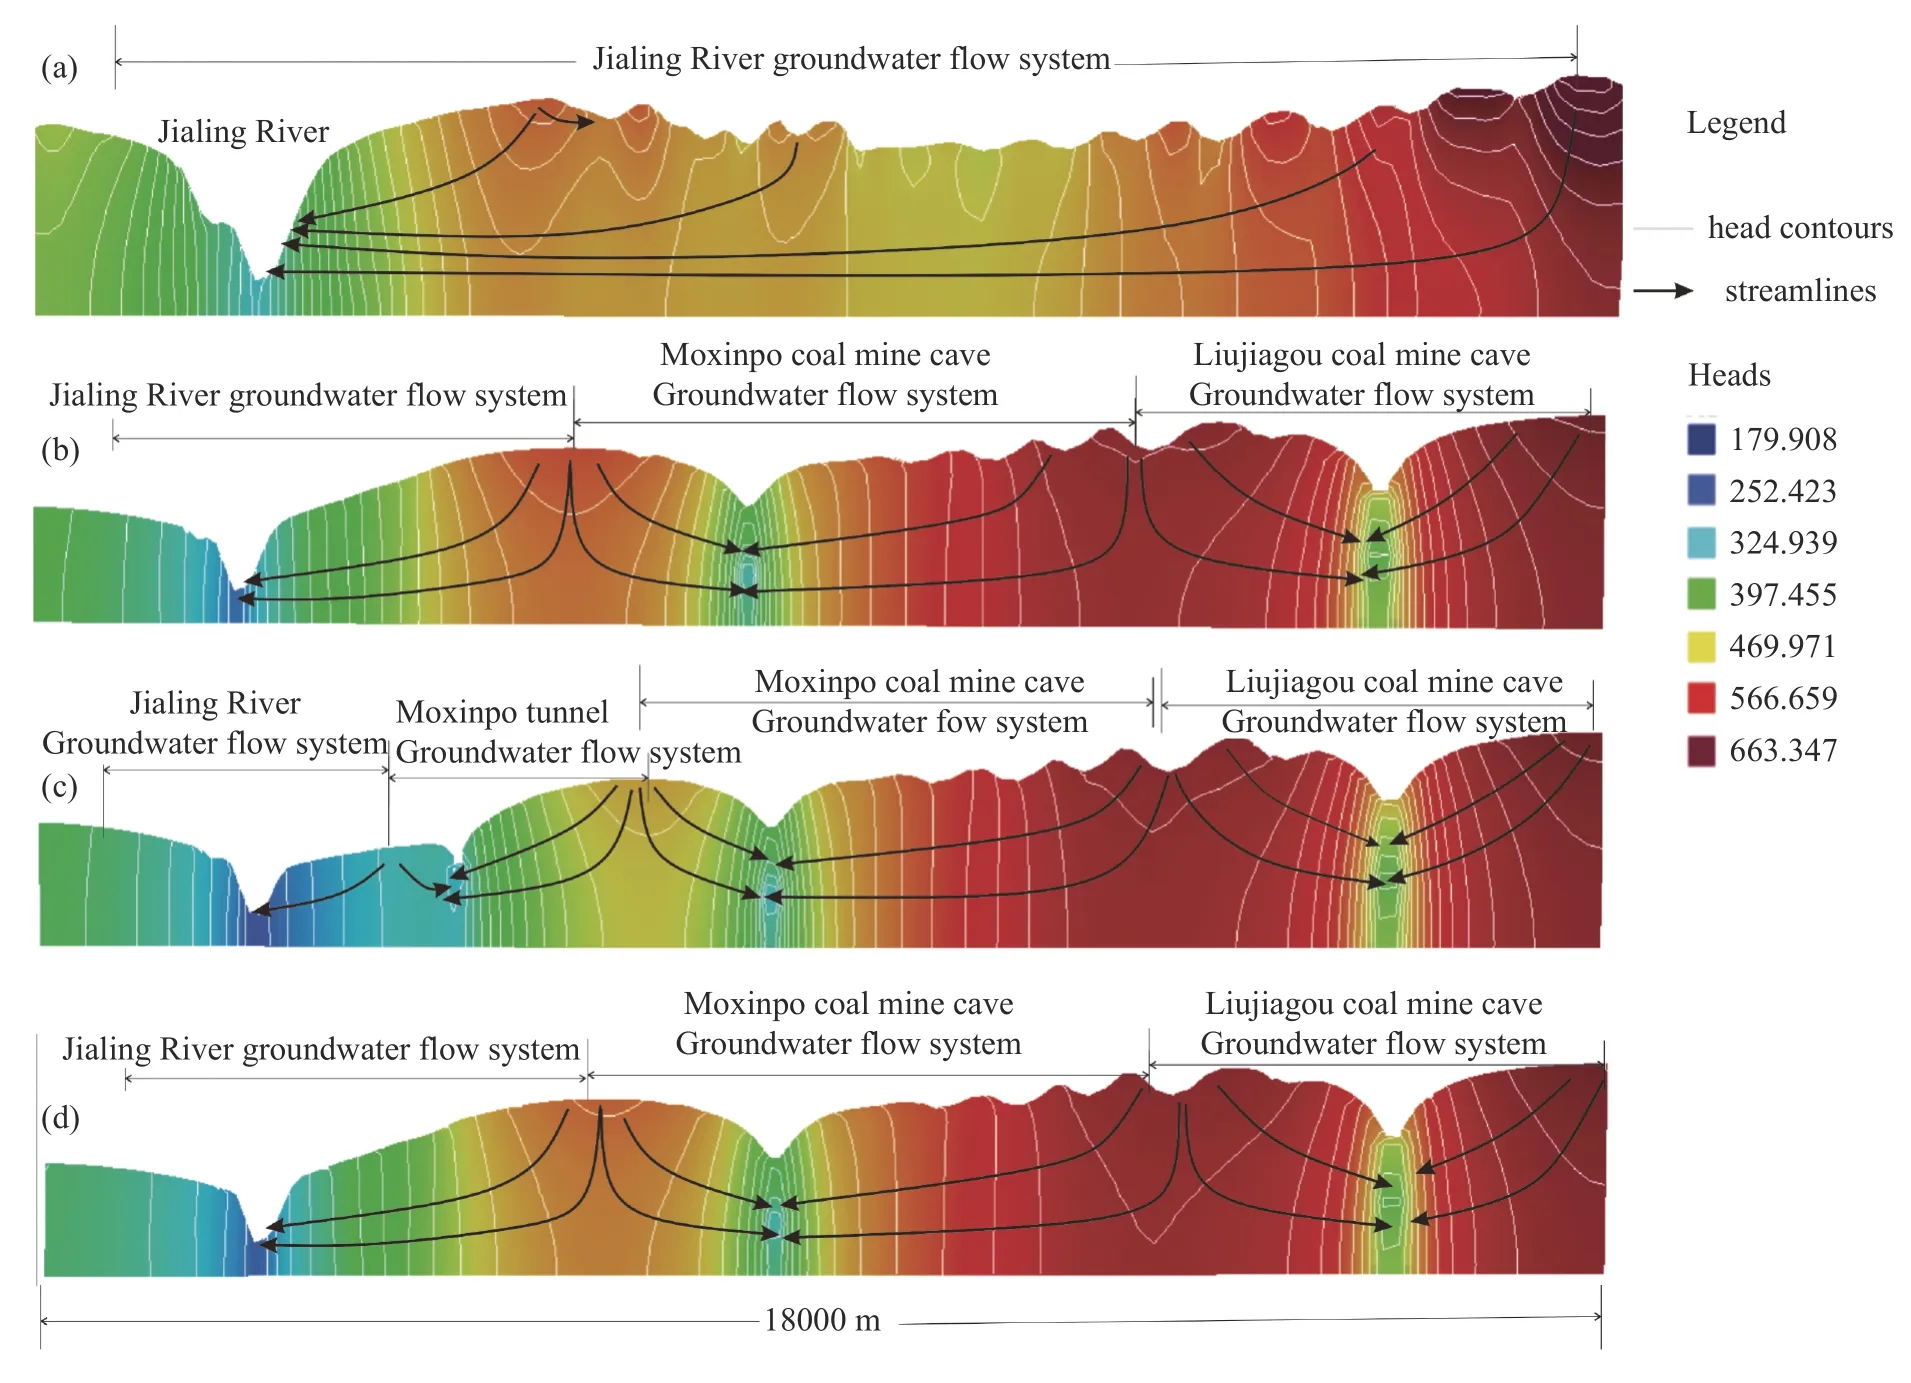
Fig.10 D-D' cross-section (Fig.1) view of modeled hydraulic heads and flow paths in the four scenarios
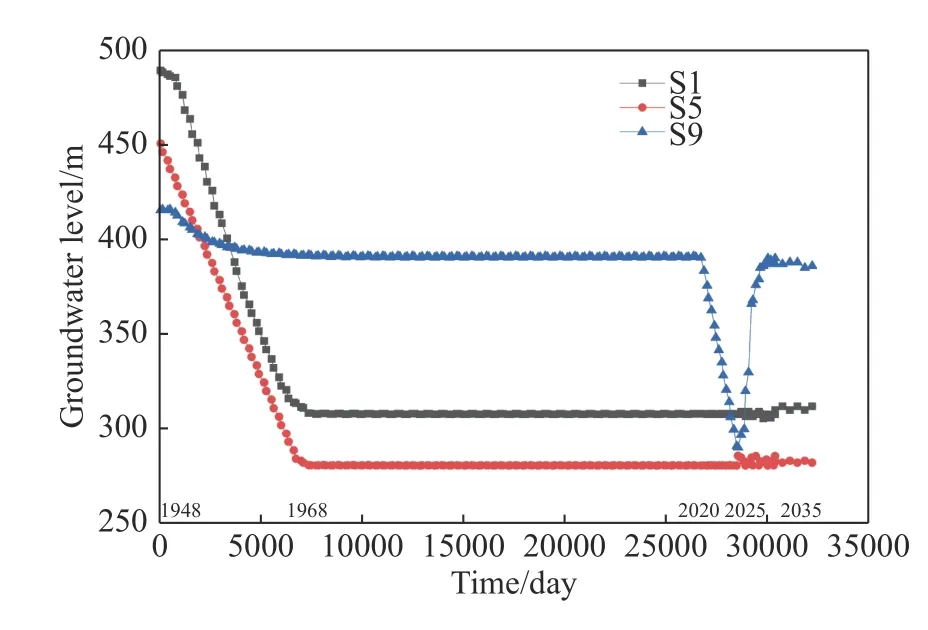
Fig.11 The simulated groundwater level variation from 1948 to 2035Notes: S1 - the Liujiagou coal mine cave; S5 - the Mxinpo coal mine cave; S9 - the Mxinpo tunnel
5 Conclusions and suggestions
The numerical simulations conducted for various scenarios demonstrate that coal mining and tunnel construction significantly modify the groundwater system, including the evolution of the groundwater flow system, shifts in groundwater divide locations, alteration in flow patterns, decreasing water levels, and adjustments to groundwater discharge into the Jialing River.The simulation results reveal that the groundwater level at the top of the tunnel is gradually restored to its natural state due to the completion of tunnel construction.The modification is a transient and gradual process, suggesting that the groundwater system may require an additional decade to reach a new equilibrium state.
Numerical simulation is capable of replicating the impact of ongoing engineering activities, such as coal mining and tunnel construction, on the groundwater system.It also has the capability to predict the potential effects of future engineering.As shown in the model results, these activities can greatly lower groundwater levels, causing significant changes in the groundwater system.These transformations consequently give rise to a variety of hydrogeological, environmental geological, and engineering geological issues.
These models have some distinct limitations.For instance, the absence of observation points such as groundwater boreholes, with all water level observations sourced from springs, has yielded a weaker model calibration.Furthermore, the model neglects factors such as density variations and the exploitation of surface springs.Consequently, it is imperative to conduct groundwater level monitoring before and after tunnel construction, as well as a comprehensive assessment of the impact stemming from abandoned coal mine caves and tunnel construction on groundwater flow systems.Prior to the commencement of any large-scale coal mining and tunnel construction, a meticulous investigation of long-term changes in the flow system and a comprehensive assessment of potential engineering and environmental consequences should be conducted.
Acknowledgments
This research was supported by the State Key Laboratory of Geohazard Prevention and Geoenvironment Protection Independent Research Project(SKLGP2018Z018), and the Research Project of China Railway Eryuan Engineering Group Co.,Ltd.(KDNQ203005).
- 地下水科学与工程(英文版)的其它文章
- Influence of water conservancy project on runoff in the source region of the Yellow River and wetland changes in the Lakeside Zone, China
- Factors driving surface deformations in plain area of eastern Zhengzhou City, China
- Analytical solution for Non-Darcian effect on transient confined-unconfined flow in a confined aquifer
- Electrical geophysical evaluation of susceptibility to flooding in University of Nigeria, Nsukka main campus and its environs, Southeastern Nigeria
- Using geospatial technologies to delineate Ground Water Potential Zones(GWPZ) in Mberengwa and Zvishavane District, Zimbabwe
- Simulation of thermal breakthrough factors affecting carbonate geothermalto-well systems

