Phylogeny and Geographical Derivation of Genus Hildenbrandia Based on Morphological and Molecular Evidence
NAN Fangru, ZHAO Huiying, LI Juan, LIU Xudong, LIU Qi, LV Junping, FENG Jia,and XIE Shulian
Phylogeny and Geographical Derivation of GenusBased on Morphological and Molecular Evidence
NAN Fangru, ZHAO Huiying, LI Juan, LIU Xudong, LIU Qi, LV Junping, FENG Jia,and XIE Shulian*
,,030006,
The marine and freshwatersamples were collected from diverse locations of China and Japan, and mor- phological characterization and molecular phylogenetic analysis were conducted on these samples. Morphological measurements of freshwater specimens were consistent with the results of,whereascell dimensions of marine specimens were slightly larger than those of widely distributedand. Phylogenetic trees based onL,A and UPA sequences were consistent. Freshwater specimens collected in this study formed an independent clade withsupported by high values. Species attribution was confirmed further by the similar ITS2 secondary structures among the samples of.It was found that the intraspecific divergence ofL gene inwas smaller than other two freshwater speciesand. Phylogenetic trees showed that marine specimens in this study grouped together withsamples of North America, and were different with thesamples of Europe. Combining the comparison results of CBC numbers in ITS2 secondary structure, we propose the marine samples collected in this study to be a new speciessp. nov. The separation of the marine and freshwater specimens was supported by theL, UPA andA phylogeny as well as ITS2 se- condary structure inference. Biogeographical reconstruction showed the ancestor of freshwatermight derive from South America and dispersed from North America to Europe and then to Asian countries, which needs to be verified further with more sam- ples and molecular evidences from South America.
; morphology; molecular phylogeny; ITS secondary structure; biogeography
1 Introduction
Genusbelongs to Hildenbrandiophycidae, the earliest diverged subclass within the Florideophyceae, Rhodophyta, and the estimated divergence time of Hilden-brandiophycida was 781 (95% HPD: 681–879) MYA (Yang., 2016). The morphology of this genus was characte- rized by simple crustose thallus construction with a single basal layer and a derived vertical cell files (Bird and Mcla- chlan, 1992). It inhabits in both freshwater and marine en- vironments, which are distinguished by means of reproduc- tion with freshwater species reproduced by stolon, fragmen- tation or gemmae, and marine species reproduced by tetra- sporangia (Nichols, 1965; Irvine and Pueschel, 1994). Mor- phology ofwas rather simple and varies with environmental factors and life of the alga, thus diagnostic features among species were few (Sherwood and Sheath, 2000).
Currently, seven taxonomically accepted species that in- habited in freshwater environment have been described in AlgaeBase, including(Liebmann) Agardh (1851: 379),Welwitsch ex West & West (1897: 3),Nan & Xie (2017: 245),C. W. Vieira, Yi S. Kim & M. Zubia (2021: 611),(Hansgirg) Caisová & J. Kopecký (2008: 413, 414),Zeller (1873: 192), andKhan (1974:238) (Guiry and Guiry, 2022). Molecular sequences are ac-cessible for,,andwas only reported in Bur- ma andwas described from India based on morphological observation, whereas their taxonomic identity is unclear due to lack of molecular evidences and the unavailability of the type materials (Zeller, 1873; Kahn, 1974). Traditionally, the freshwater species were discrimi- nated by cell dimensions, basal layer height and thallus height (Sherwood and Sheath, 2003). However, thallus thick- ness has been known to vary with the age of thallus and cell dimensions are variable in different parts of the thallus (Star- mach, 1969). Marine species includeJ. Agardh (1851: 495),(Ardré) Hollenberg (1971: 286),Dickie (1874: 357),Setchell & N. L. Gardner (1937: 91),(Askenasy) Y.M. Chamberlain (1962: 372),Hariot (1887: 74),Setchell (1917: 393),Dickinson (1937: 356),H. B. S. Womersley (1996: 357),(Sommerfelt) Meneghini (1841: 426) andHollenberg (1970: 164) (Guiry and Guiry, 2022). Up to now, molecular sequences are available for,,,andThe marine species are mainly separated by di- vision pattern of tetrasporangia (Sherwood and Sheath, 2003). Although the reproductive means between marine and freshwater populations were different, there was over- lap in the ranges of cell diameter and length among popu- lations of,and(Sheath., 1993). Moreover, molecular phylogenetic analysisshowed that the traditional species,andwere paraphyletic, while species includ- ingandwere monophyle- tic (Sherwood and Sheath, 2003; Nan., 2017, 2019). Phylogenetic relationship of species inwas still unresolved due to limited taxon sampling and insuffi- cient molecular evidence.
was globally distributed, among which specimens ofwere reported inEurope, Carib- bean Islands, South America, Africa, and Asia.was distributed in North America, Africa, and Pacific Islands (Sherwood and Sheath, 2003). Another freshwater specieswas endemic toChina and Ja- pan (Nan., 2017, 2019; Vieira., 2021). Based on morphometric analysis on the samples of freshwaterandworldwide and type specimens of these two species, biogeographic trends were found that samples collected from North America were distinct from those of Europe (Sherwood and Sheath, 2003). The marinerepresentativewas globally distributed, which has been reported from diverse European locations, North Ame- rica, South America, Asia, Atlantic Islands, Arctic, Carib- bean Islands, and Pacific Islands. It was found that the re- lationships among samples offrom different con- tinental coastlines were closer than those from the samecoastline, while no biogeographical trend was found (Sher- wood and Sheath, 2003).
Molecular phylogenetic analysis has been widely usedfor species identification and relationship reconstruction in genus(Sherwood and Sheath, 1999, 2000; Sherwood., 2002; Sherwood and Sheath, 2003; Nan., 2017, 2019; Vieira., 2021). The molecular evi- dences showed some species in genuswere actually comprised of a number of morphologically simi- lar yet evolutionarily distinct lineages. Incongruency in spe- cies grouping was observed between morphological and molecular analysis. Data from more taxa worldwide and the use of additional molecular markers are needed to clarify the phylogenetic relationship of(Sherwood and Sheath, 2003). Threespecies, including,and,were report- ed from China, with the former two based on morphologi- cal characterization, and molecular data was accessible only for the third species (Jao, 1941; Xia., 2004; Nan., 2017). The morphological and molecular investigation onspecimens were executed in this study to determine their taxonomic attribution and provide more clues for the phylogenetic relationship of this genus.
2 Materials and Methods
2.1 Sample Collection, Pretreatment, and Morphological Observations
Freshwater and marine specimens of genuswere collected from five provinces of China and three sampling sites of Japan (Table 1). Small stones from dif- ferent locations with epilithicalgae were transferred to the laboratory as soon as possible for mole- cular analyses. Samples were scraped from their substratum with a razor blade and fixed in centrifuge tube with 4% for- malin solution for morphological observation. Morpholo- gical characters of the specimens were observed under a BX-51 Olympus microscope equipped with a charge-coupled camera and cellSensStandard software for photographing (DP72; Olympus, Tokyo, Japan). The thalli morphology was analyzed by measuring cell size and filament height.

Table 1 Sampling information of specimens in this study
Notes: *L sequence of YZJP has been published in our previous study (Nan., 2019), and only sequences of UPA andA were added in this study.
2.2 DNA Amplification and Sequencing
Total DNA was extracted from the fresh thalli follow- ing the protocol described by Saunders (1993) with modi- fications following Vis and Sheath (1997). Primers used for polymerase chain reaction (PCR) amplifications were in Ta- ble 2. PCR amplifications were conducted in 20μL volumes containing 12.5μL ddH2O, 2.0μL 10×buffer, 2.0μL 2.5m molL−1dNTPs, 0.2μL Taq DNA polymerase (all from San-gon Biotech Co., Ltd., China), 2.0μL of each primer (10mmolL−1), and 1.0μL of genomic DNA. Typical thermal cycling conditions forL included an initial denaturation step at 95℃ for 3min, 35 cycles at 94℃ for 1min, 48℃ for 1min, 72℃ for 2min, and a final extension at 72℃ for 2min. ForA, the conditions for the run were an initial denaturation step at 94℃ for 3min, 35 cycles at 94℃ for 30s, 47℃ for 30s, 72℃ for 50s, and a final extension at72℃ for 7min. For UPA, the conditions for the run were an initial denaturation step at 94℃ for 2min, 35 cycles at 94℃ for 20s, 53℃ for 30s, 72℃ for 30s, and a final ex- tension at 72℃ for 6min. For ITS, the conditions for the run were an initial denaturation step at 94℃ for 2min, 35 cycles at 94℃ for 30s, 55℃ for 30s, 72℃ for 25s, and a final extension at 72℃ for 7min. PCR products were ana- lyzed with electrophoresis on 2% agarose gels, and success- ful amplification products were purified using a SanPrep column DNA gel purification kit (Sangon, China). The se- quencing was performed on an ABI 3730XL sequencer us- ing both amplifying primers. The DNA sequence data gene- rated from this study have been deposited in GenBank un- der accession numbers (OQ301674-OQ301687, OQ304688, OQ305077-OQ305081, OQ255713-OQ255719).
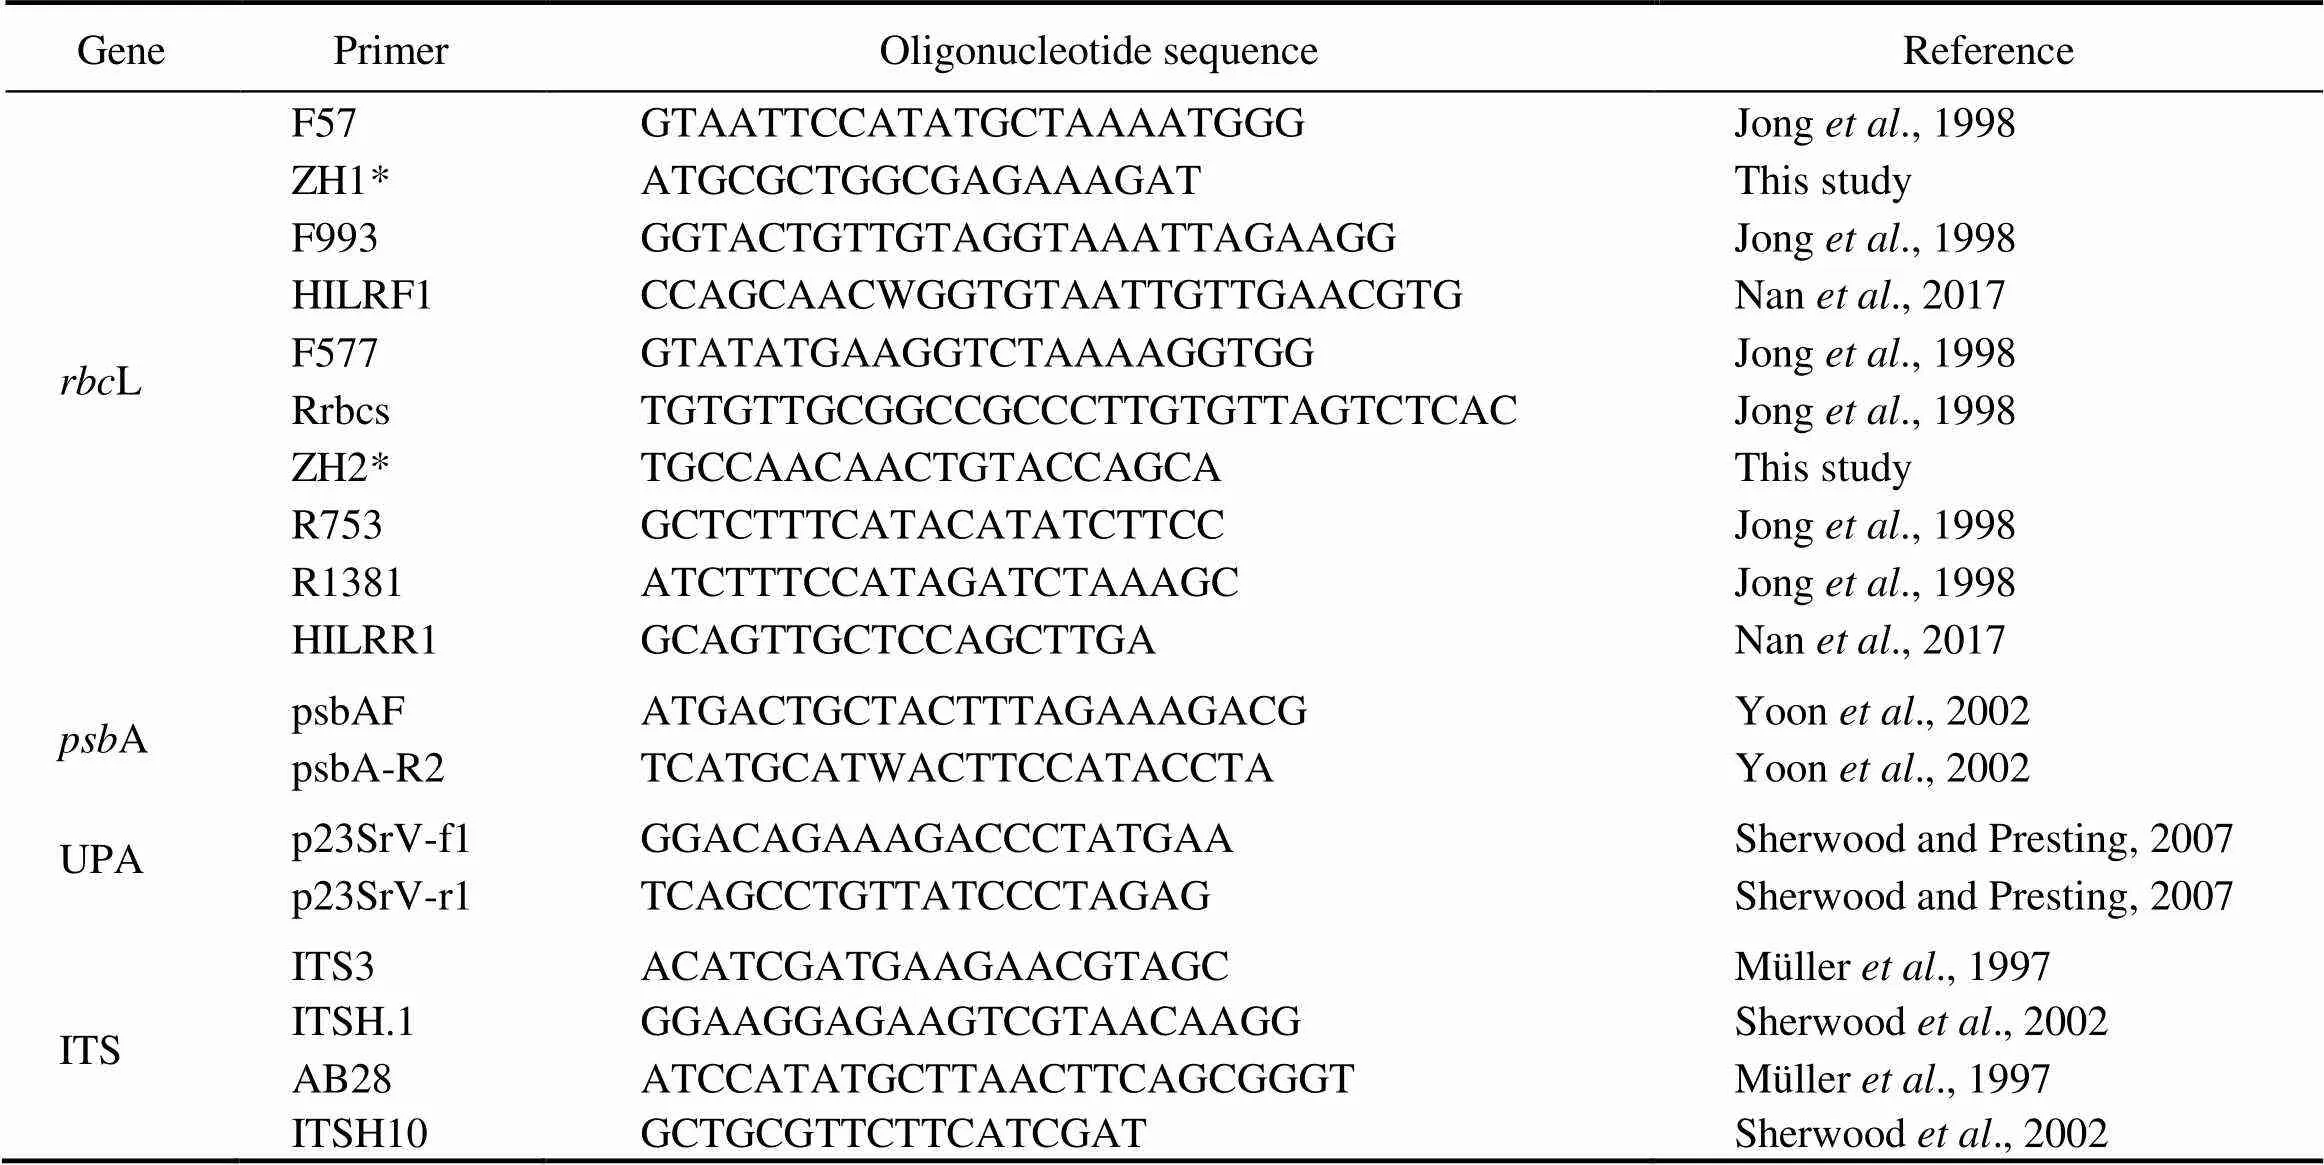
Table 2 Primers for polymerase chain reaction amplifications used in this study
Note: * denotes primers designed in this study.
2.3 Sequence Alignment and Phylogenetic Analysis
Sequences obtained in this study and sequence data for generaand(used as outgroup) downloaded from GenBank (https://www.ncbi.nlm.nih. gov/genbank/) were assembled in Clustal-X 2.0 (Thomp- son., 1997). Pair-wise distances of each sequence were calculated in MEGA 5.0 (Tamura., 2011). The align- ed datasets were used to construct phylogenetic trees. Mo- deltest software was used to evaluate the optimal substitu- tion model for each gene sequence (Posada and Buckley, 2004). MEGA 5.0 was used to construct the Neighbor-join- ing tree with 1000 bootstrap repetitions (Tamura., 2011). PHYML software was used to construct maximum likeli- hood trees (Felsenstein, 1981; Guindon and Gascuel, 2003). Bayesian inferences were developed in MrBayes version 3.1.2 (Ronquist and Huelsenbeck, 2003). A Markov chain Monte Carlo (MCMC) was initiated in the Bayesian infe- rence and run for 5000000 generations, while the trees weresampled every 1000 generations. A consensus tree was sum- marized after 1000 trees of burn-in. The resulting phyloge- netic trees were edited using Figtree1.4.2 (http://tree.bio. ed.ac.uk/software/figtree/). The secondary structures of ITS sequence were folded using the RNAfold Web Server by choosing the minimum free energy algorithm and the op- tion to avoid isolated base pairs (Gruber., 2008). The predicted secondary structures were visualized using theprogram RNAviz (De Rijk., 2003). The compensatory base change (CBC) was calculated by software CBCanaly- zer (Wolf., 2005).
2.4 Ancestral Geographical Origin of the Genus Hildenbrandia Inferred from RASP Result
The ancestral geographical origin of the genuswas constructed based on the final tree using a Sta- tistical Dispersal Vicariance Analysis implemented in the RASP (Reconstruct Ancestral State in Phylogenies) soft- ware (Yu., 2010, 2013). Only phylogenetic trees based onL were used to reconstruct the ancestral geography. Distribution ranges were divided into nine areas: A, China; B, Japan; C, Philippines; D, North America; E, South Ame-rica; F, South Europe; G, North Europe; H, Middle Europe; I, west Europe. To account for the phylogenetic uncertain- ty, we used 10000 trees from the phyML output files and discarded the first 1000 trees as the burn-in. All other op- tions remained as default.
3 Results
3.1 Morphological Observation
Morphological characters of each specimen were in Fig.1. The cell dimensions and filament heights were measured and listed in Table 3. The specimens collected from fresh- water were rose-red to brown-red, forming crustose thalli on the surface of rocks in flowing water. The thalli are thickin center and thin in margin, consisting of thin basal layers and short erect filaments. Erect filaments are regularly and densely arranged, consisted of 6–10 cells. The basal cells were nearly square and a single chromatoplast was parie- tal. Cell diameters of freshwater specimens were (3.6–8.0)×(5.6–6.9)μm and thallus heights were 359–598μm. Re- productive organs were not found in the freshwater speci- mens. Vegetative morphological characters of thallus collected from marine environment were similar with the fresh- water specimens, except that the cell diameters were (3.8–6.4)×(3.0–3.9)μm and conceptacles with tetrasporangia were observed.
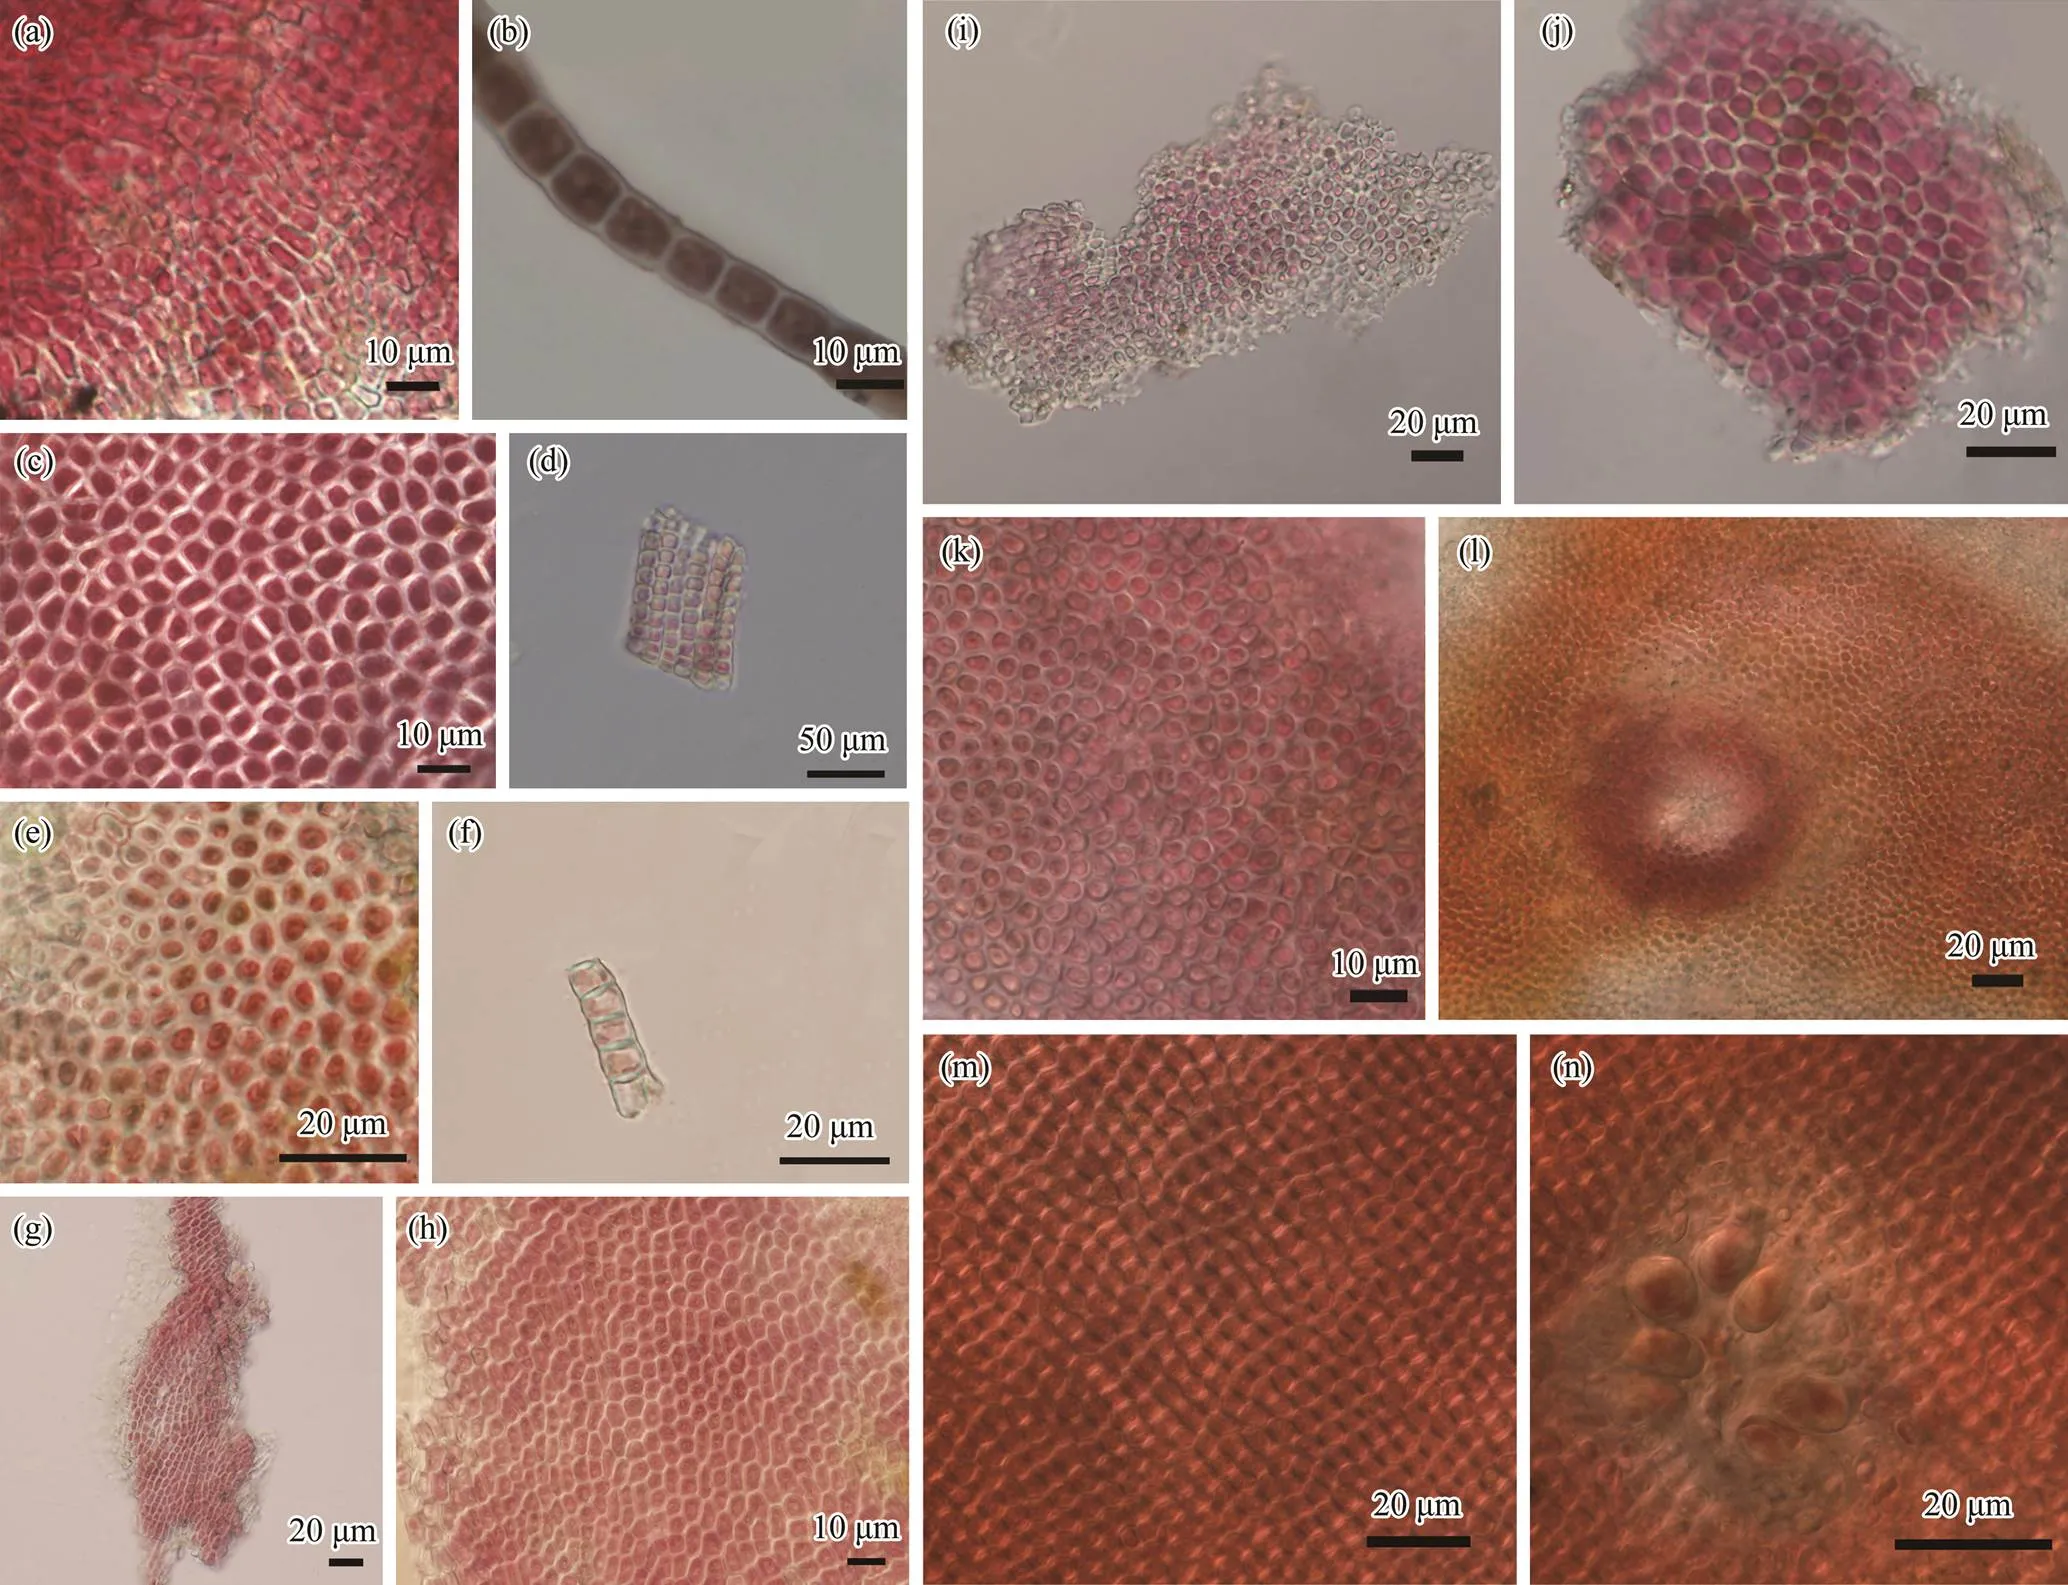
Fig.1 Morphological structures of specimens collected in this study. a–b, basal cell layer and single longitudinal cell column of thallus from sample YZGX; c–d, transection surface of thallus and multiserial cells arranged in vertical from sample YZXIAXIAN; e–f, transection surface of thallus and disconnected part of alga from sample YZLUOTIAN; g–h, dense basal cell layer and single chromoplast is parietal in cell from sample YZHB; i–j, basal cell layer and transverse view of the cross section of the thallus from sample YZMINO; k–l, transection surface of thallus and thallus with a conceptacle from sample YZAWAJI; m–n, transection surface of thallus and thallus with a conceptacle and tetrasporangia from sample YZQD.

Table 3 Morphological characters of specimens in this study
3.2 Genetic Distance Calculation
Pair-wise distance ofL sequence between specimens collected in this study (YZXIAXIAN, YZHB, YZLUO- TIAN, YZGX, YZMINO) and other specimens ofwas 0–0.016. The values between speci- mens collected in this study and other freshwater species (,) and marine specimens were 0.033–0.193, 0.141–0.176, respectively. In the freshwater clade, intraspecific genetic distances of,andwere 0.007 (range: 0–0.016),0.010 (range: 0–0.049) and 0.145 (range: 0–0.228) respec- tively. The mean interspecific genetic distances were 0.040betweenand; 0.124 be- tweenand;and 0.119 be- tweenand, respectively. In the marine clade, specimens ofclustered into two in-dependent clades (a and b). Genetic distances between ma- rine specimens collected in this study (YZAWAJI, YZQD) and clades a and b were 0.155–0.174, 0.034–0.091, respec- tively. Genetic distance between clade a and b was 0.155−0.183. The genetic distance between freshwater and marine group was 0.137–0.212.
3.3 Phylogenetic Analysis
The tree topologies based on three methods including Ma-ximum likelihood, Neighbor-joining and Bayesian inference were similar. The ML trees constructed fromL,Aand UPA were shown in Figs.2–4 with all the supportingvalues included on the nodes. The freshwater specimens col- lected in this study (YZXIAXIAN, YZHB, YZLUOTIAN, YZGX, YZMINO) formed an independent branch with otherspecimens and were supported by high values (100/1/100). Another freshwater speciesformed an independent clade with full support values(97/1/99).andformed sistergroup whereas supported by low values (77/0.72/52). Spe- cimens ofwere paraphyletic and basal to theother two freshwater species. The marine specimens did not form independent clade. The marine specimen(AF534407) was basal to the freshwater branch, and thisclade can be grouped with marine clade a (consisted of two specimens ofand five specimens of). Marine specimens collected in this study (YZAWAJI, YZQD) were grouped together with five specimens ofandwere supported by full values (100/1/100), which was noted as the marine clade b. The specimens collected in this study group together with a sample with accession number AF19 7813 by high supporting values (100/1/98), whereas their grouping with the sister clade was not supported (66/-/-). Marine clade b was basal in the phylogenetic tree.
Only 5A sequences ofwere accessi- ble in GenBank database. The freshwater specimens (YZ LUOTIAN, YZJP, YZMINO, YZHB, YZXIAXIAN) col- lected in this study formed an independent branch withwith full support values by three methodsThemarine specimens in this study (YZAWAJI, YZQD) grouped together with the freshwater clade. Another two specimens offormed sister group with each other and was basal in the phylogenetic tree. Nine UPA sequences ofwere accessible in GenBank database. The freshwater specimens (YZLUOTIAN, YZJP, YZMINO, YZHB, YZXIAXIAN) collected in this study formed an in- dependent branch with another two specimens ofsupported byMaximum Likelihood and Bayesian inferenceMarine specimens in this study (YZQD, YZA- WAJI) clustered with other specimens ofwith low supporting values.
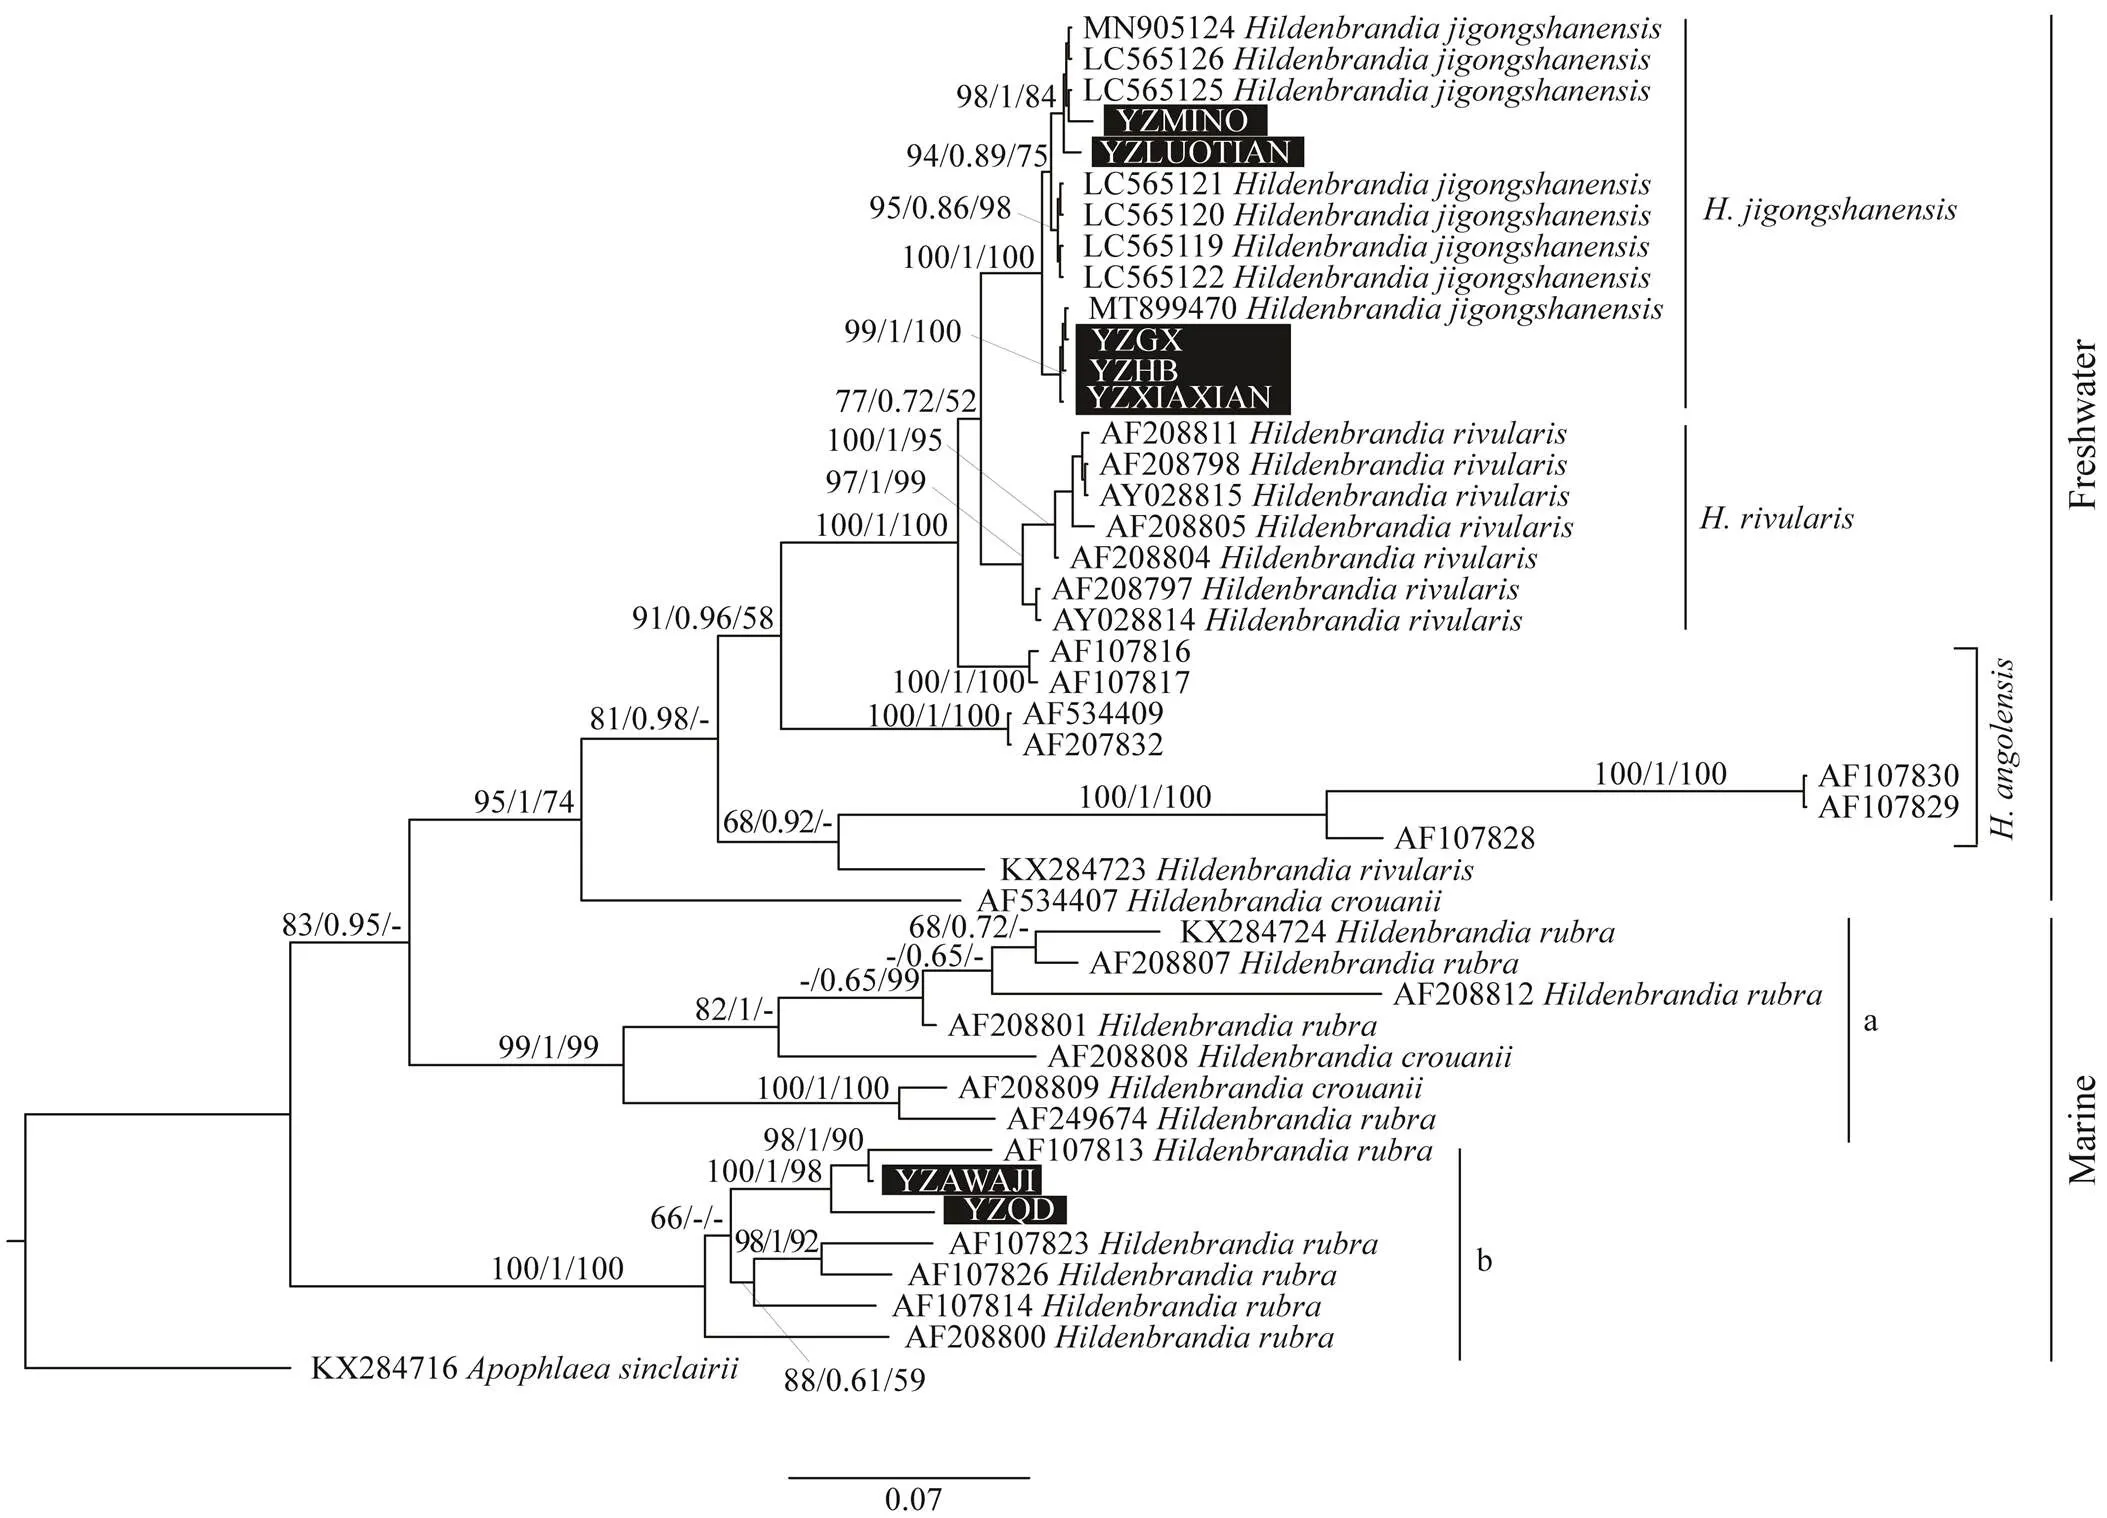
Fig.2 Phylogenetic tree based on rbcL gene sequence. Support values for all analyses are noted as: ML supporting values/ Bayesian posterior probabilities/NJ distance bootstrap values, ‘-’ denotes supporting values lower than 50%. Samples collected in this study were noted in black rectangle.
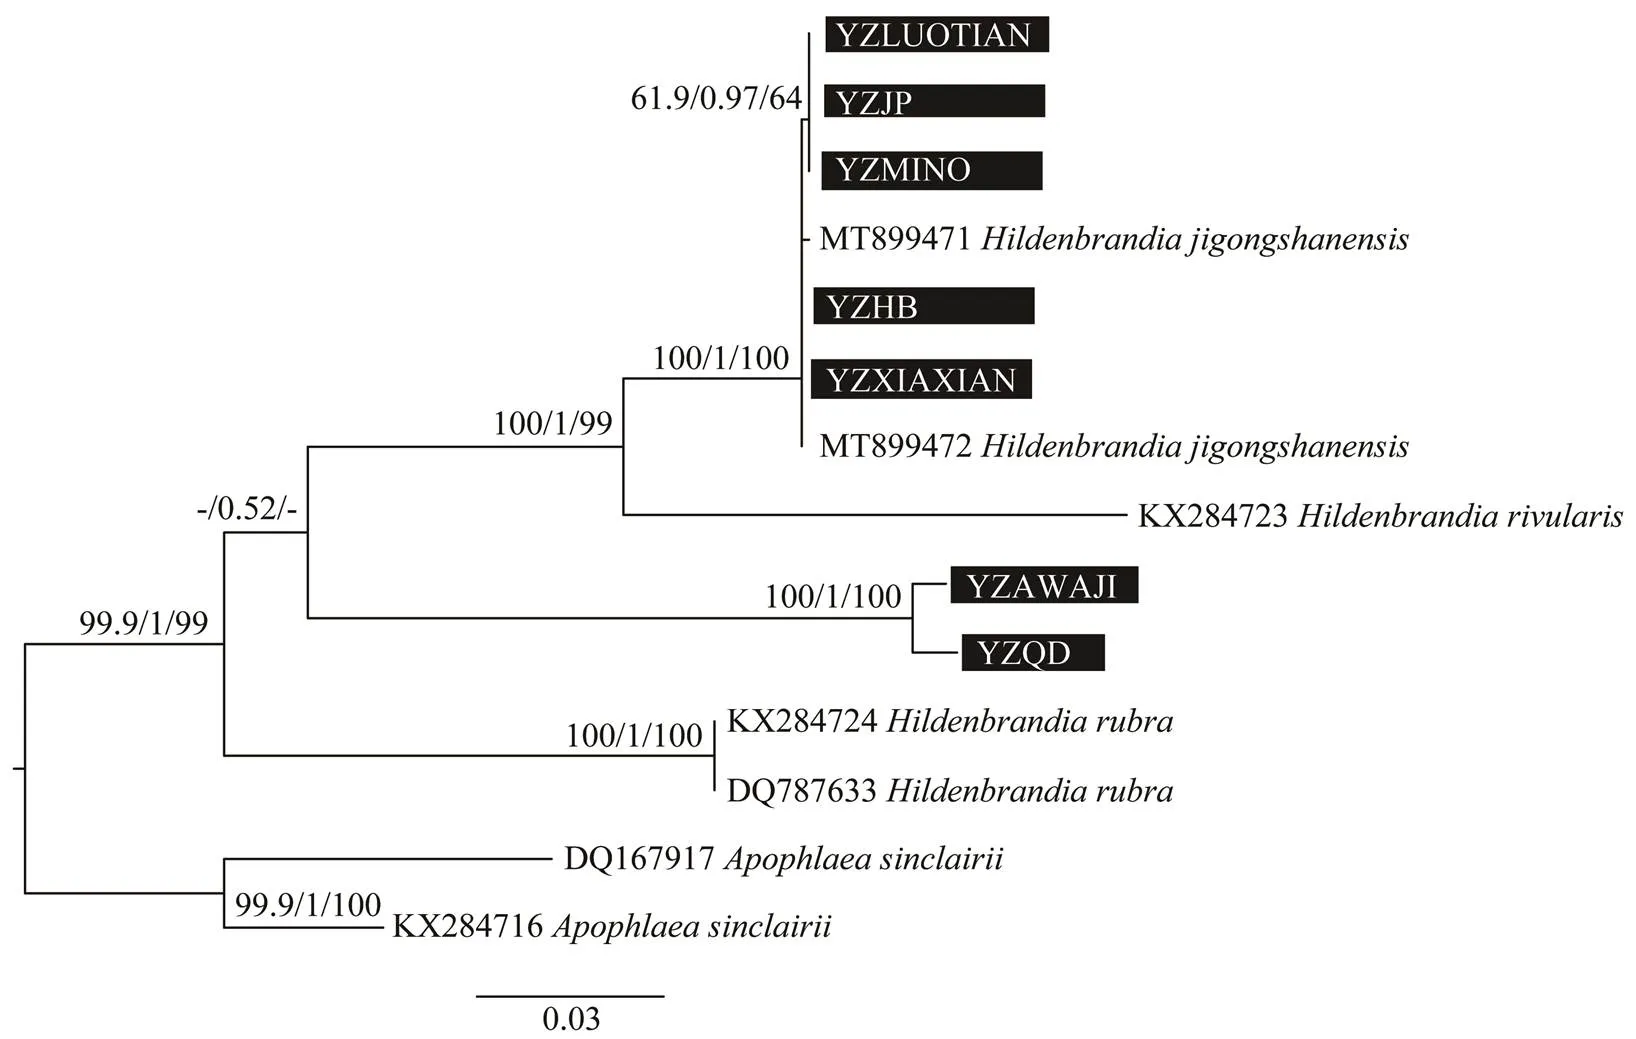
Fig.3 Phylogenetic tree based on psbA gene sequence. Support values for all analyses are noted as: ML supporting values/Bayesian posterior probabilities/NJ distance bootstrap values, ‘-’ denotes supporting values lower than 50%. Samples collected in this study were noted in black rectangle.
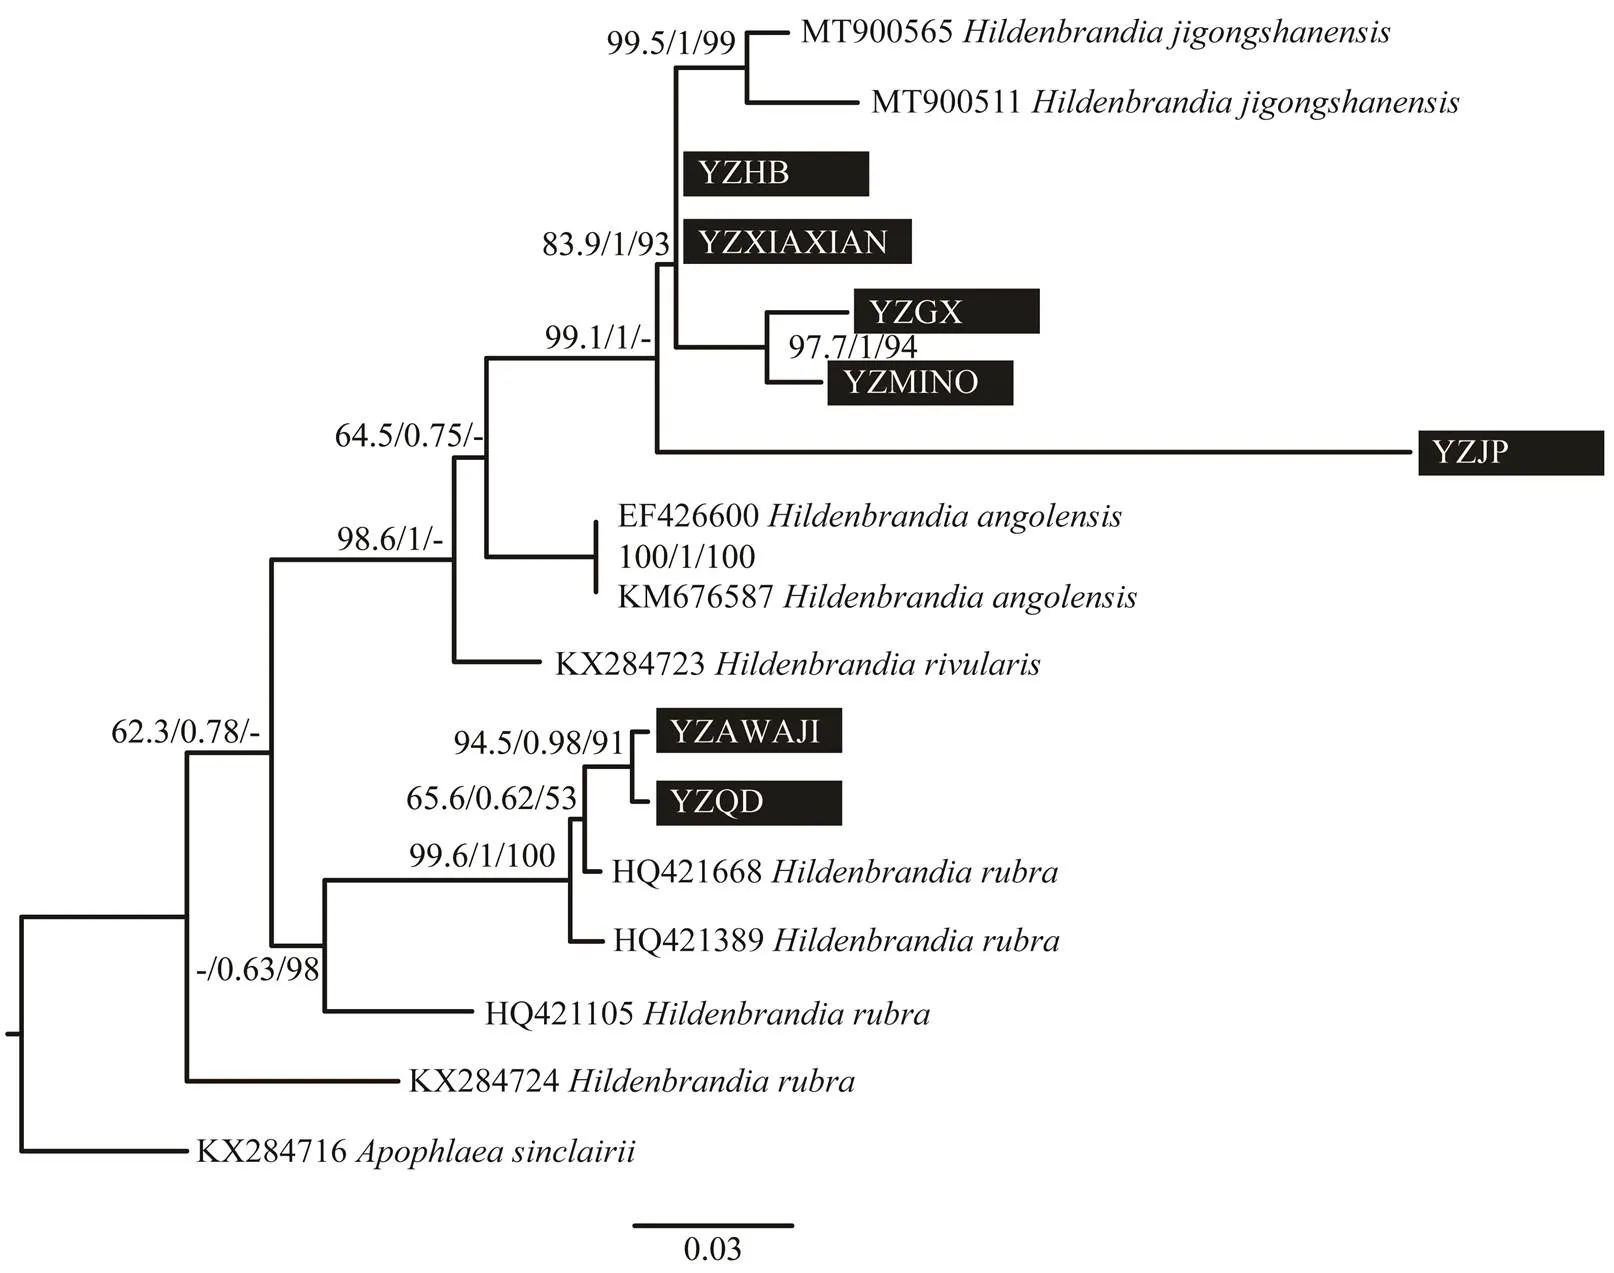
Fig.4 Phylogenetic tree based on UPA gene sequence. Support values for all analyses are noted as: ML supporting values/Bayesian posterior probabilities/NJ distance bootstrap values, ‘-’ denotes supporting values lower than 50%. Samples collected in this study were noted in black rectangle.
The ITS2 secondary structures of specimens ofwere similar, thus only the representing fi- gure was illustrated in Fig.5a. The representing structures of(accession number AY028819), group a (acces- sion number AY028839), group b ofwere Fig.5b, Fig.5c and Fig.5d, respectively. The freshwater specimens ofwere paraphyletic and variations of ITS2 sequences were large, thus the secondary structure of this species was not inferred. The ITS2 second structures of ge- nusconsist of a longer helix together with three relatively short helices radiating from a central ring. The freshwater speciesandwere more similar compared with marine species, and there were more similarities between marine groups a and b. CBC numbers were 1, 2, 3 and 4 betweenand, group a and group b of,and group a,and group b, respectively.
3.4 Ancestral Geographical Origin Inference
The ancestral geographical origin of genuswas traced back to the West Europe (node 86, I: 81.04%) (Fig.6), and the freshwater species were traced back to Ame- rican plate (node 71, 43.0% in Latin America, 39.7% in North America). The freshwaterwas endemic to China and Japan, and the ancestral geographi- cal origin of this species was China (node 56: 75.2% in Chi- na). The freshwaterwas primarily distributed in Europe and the ancestral geographical origin of this spe- cies was Central Europe (node 62: 83.4% in Central Euro- pe). The freshwaterwas distributed in Ame- rican plate and Philippines, and the ancestral distribution was more likely in Latin America. The ancestral origin of marine groups a and b were both West Europe, which werenode 78 (94.5% in West Europe) and 85 (81.2% in West Eu- rope) respectively.
4 Discussion
Morphologically, the cell diameters of the freshwater spe- cimens collected in this study were slightly larger thanandreported in previous report andsmaller than those of, andfilament heightswere similar with, which wereconsiderable larger than those ofand(Sherwood and Sheath, 2003; Nan., 2017). Spe- cimens collected from Japan have enlarge the cell dimen- sion ranges of, while the measurementsof specimens in this study fall within the range (Vieira.,2021). Therefore, morphological measurements of freshwa- ter specimens collected in this study were consistent with the description ofThe intraspecific mor- phological variation ofwere obvious, which might be caused by different life stages or environ- mental factors (Denizot, 1968; Vieira., 2021). The cell dimensions ofandwere (3.0–4.2)×(2.4–3.6)μm and (3.1–3.7)×(2.6–3.4)μm respectively (Sherwood and Sheath, 2000). The cell dimensions of ma- rine specimens collected in this study were slightly larger than those values. Although conceptacles with tetrasporan- gia were observed in the marine specimens in this study,the tetrasporangial division details were not observed. It hasbeen proposed that some characters traditionally used to dis- tinguish species of, such as tetrasporangial division pattern, are not useful in some cases (Sherwood and Sheath, 2000). Reliability of the tetrasporangial divi- sion pattern for species discrimination needs to be clarified in further studies.
Molecular evidences showed the genetic distances be- tween specimens collected in this study andwere smaller than those with other two freshwater spe- ciesand,inferring its attribution toTheintraspecific divergence ofLgene inwas smaller than other two fresh- water speciesandIntraspecific divergence ofL gene inobtained in thisstudy was similar than that in previous study (Sherwood andSheath, 2000). The freshwaterwasan‘un- natural’ grouping and should not be interpreted as species level (Sherwood and Sheath, 2003). The maximum intra-specific divergence ofL gene in freshwaterspecies should be 2.0%. The interspecific divergence ofL in freshwaterwas 3.3%–4.9%, which was smaller than the values in other red algal genus (5.3%–7.0% forand 2.6%–11.5% for) (Necchi., 2019; Puckree-Padua., 2020). Combining freshwater and marine species together, a ma- ximum value of 21.2% forL gene divergence was ob- served in this study, which was consistent with previous proposal that there were high sequence divergence values forL gene ofcompared to other red al- gal genera (Sherwood and Sheath, 2000). The exceptional highL divergence inmay result from asexual reproduction and long evolutionary history (Sher- wood and Sheath, 1999).
The chloroplastL gene has been widely used as mole- cular tool for species identification and phylogenetic ana- lysis in genus(Sherwood and Sheath, 2000,2003; Nan., 2017, 2019; Vieira., 2021). The fresh- water speciesandhave beenproved monophyletic in previous studies (Sherwood and Sheath, 2000; Sherwood., 2002). The freshwater spe- cimens collected in this study were in theclade, which is supported by full values, implying their species attribution.was firstly report- ed from Henan province, China, and later it was also found in Shanxi and Yunnan provinces, China (Nan., 2017, 2019, 2021). It was also reported in multiple locations in Japan (Vieira., 2021). The collections in this study ex- tend the geographical distribution of, which wasendemic to Asia up to date. The monophyly ofandwere robustly support- ed in this study and these two freshwater species formedsister group, which was consistent with previous studies (Nan., 2017; Vieira., 2021). The specimen (ac- cession number KX284723) noted as ‘’ was ba- sal to the freshwater clade, thus we infer the identification of this specimen needs to be confirmed in further study. Ano- ther freshwater specieswas paraphyleticand basal to the freshwater clade, and all freshwater samples were separated from the marine specimens. Phylogenetic analysis based onL sequence ofsamples collected from North America showed the freshwater spe- cimens were paraphyletic with respectto the marine sam- ples (Sherwood and Sheath, 1999). After adding more ma- rine and freshwater specimens offrom Eu- rope, South America and Africa, the marine and freshwa- ter specimens were separated and the freshwater samples forming a well supported monophyletic clade based onL gene (Sherwood and Sheath, 2000, 2003). With more sam- ples worldwide adding into the molecular phylogenetic ana- lysis, the relationship among species will be more explicit. The separation of the marine and freshwater specimens was also supported by the UPA andAphylogeny as well as ITS2 secondary structure inference in this study. The ma- rine samplewas basal to the freshwater clade, supporting the idea that the freshwater species derived from a single invasion from marine habitats (Sherwood and Sheath, 2000, 2003). Molecular sequences of the type spe- cimens ofandwere not available, whe-reas cluster dendrogram based on morphological characters of the type specimens showed the close relationship ofwith the samples whose accession numbers are AF- 208812, AF208807), andwith the samples whose accession numbers are AF208808, AF208809 (Sher- wood and Sheath, 2003). The samples with close relation- ship to type specimens ofandwereall clustered into clade a in this study. The collecting sites of type specimens ofandwere both in Europe (Meneghini, 1841; Agardh, 1851), similar with the geographical distributions of the specimens in clade a. Neithernorwas monophyletic in the phylogenetic tree, which was also reported in previous study (Sherwood and Sheath, 2003). Traditional morphological characters used to distinguish marine species ofmay not be useful and the forms intermediate betweenandhave been reported (Irvine and Pueschel, 1994). The separation of these two species were doubted and some forms of them give rise to the freshwa- ter lineages. The marine specimens collected in this studywere in a group evidently separated from the ‘andclade’, implying their distinctness in species at- tribution. Additionally, the CBC number in the ITS2 se- condary structure was more than that betweenand(2. 1). The ITS2-CBC can be used as a tool for species identification and it has been pro-posed that two organisms that differed by a CBC in ITS2 have a 93% probability of being a distinct species (Müller., 2007). Therefore, we propose the marine specimens YZQD and YZAWAJI collected in this study are new spe- cies. Considering the robust supported grouping between these two specimens and the sample (accession number AF107813) collected from Canada in a previous research (Sherwood and Sheath, 1999), we propose this clade is a new species and it is named asTaxono- mic changes of other samples in clade b needs more evi- dences in further studies.
5 Taxonomic Results
F. NAN, H. ZHAO, J. LI, X. LIU, Q. LIU, J. LV, J. FENG & S. XIE, sp. nov. (Figs. 1k–n)
Etymology: The species epithet refers to the Holotype lo- cality (Qingdao, China).
Diagnosis: Marine alga, bright red, forming crustose thal- li on the surface of rocks. This species is characterized by cell dimensions of (3.8–6.4)×(3.0–3.9)μm (Figs.1k–n). Molecular-assisted identification is necessary for identifi- cation of this species.
Type: China, Shandong Province (36.11˚N, 120.55˚E): growing on the rocks in the intertidal zone, July 13, 2018, Xu-Dong Liu (Holotype: SXU-SD18009; Paratype: SXU- SD18010). The specimens were deposited in Herbarium of Shanxi University (SXU), Shanxi University, Taiyuan, Shan- xi Province, China.
Authentic strain:–SXU-SD18009, Herbarium of Shanxi University (SXU), Shanxi University.
The biogeographical analysis showed genuswas derived from West Europe and then dispersed to other areas in Europe, America and Asia. The grouping of marine samples from different continents showed the ma- rine samples are uncorrelated with geography. The hypo- thesis of trans-Arctic interchange ofwas proposedbased on molecular divergence analysis on the Alaskan and Newfoundland samples (Sherwood and Sheath, 1999). Thesingle clade of freshwaterpopulations sug-gests that the collections from America, Europe and Asia have a common biogeographic origin.Freshwatersamples from North America were mainlyand exhibited larger genetic variation (Sherwood and Sheath, 1999). Freshwater samples from Europe were gene- tically homogenous (Sherwood and Sheath, 2000), whereasthe grouping was not corresponded to the geographical lo- cations. Freshwater samples from China and Japan show- ed high genetic similarities (Nan., 2017, 2019; Vieira., 2021), and they grouped corresponding to geographi-cal locations (except one sample YZLUOTIAN). It suggests the dispersal path of freshwatermight be from North America to Europe and then to Asia. The an- cestral geographical origin of freshwaterwastraced back to South America in this study, which needs to be further explored by adding more samples and mole- cular evidences from this region.
Acknowledgements
Sincere thanks are to Drs. H. Su, K. P. Fang, and N. N. Cui, for collecting samples. We are grateful to the National Natural Science Foundation of China (Nos. 41871037, 3180 0172, 32170204), and the Fund for Shanxi ‘1331 Project’.
Agardh, J. G., 1851.CWK Gleerup, Lund, 576pp.
Bird, C. J., 1992.. Biopress, Bristol, 177pp.
Denizot, M., 1968.. Museum National d'Histoire Naturelle, Paris, 310pp.
De Rijk, P., Wuyts, J., and De Wachter, R., 2003. RnaViz 2: Animproved representation of RNA secondary structure., 19: 299-300.
Felsenstein, J., 1981. Evolutionary trees from DNA sequences: A maximum likelihood approach., 17: 368-376.
Gruber, A. R., Lorenz, R., Bernhart, S. H., Neubock, R., and Ho- facker, I. L., 2008. The Vienna RNA websuite., 36: 70-74.
Guindon, S., and Gascuel, O., 2003. A simple, fast, and accurate algorithm to estimate large phylogenies by maximum likelihood., 52: 696-704.
Guiry, M., and Guiry, G., 2022. AlgaeBase. World-wide electro- nic publication. National University of Ireland. Galway, https:// www.algaebase.org.
Irvine, L. M., and Pueschel, C. M., 1994. Hildenbrandiales. In:. Irvine, L. M., and Chamberlain, Y. M., eds., The Natural History Museum, London, 235-241.
Jao, C. C., 1941. Studies on the freshwater algae of China. VIII. A preliminary account of the Chinese freshwater Rhodophyceae., 12: 245-290.
Jong, Y. D., Wurff, A. V. D., Stam, W. T., and Olsen, J. L., 1998. Studies on Dasyaceae. 3. Towards a phylogeny of the Dasyaceae (Ceramiales, Rhodophyta), based on comparativeL gene se- quences and morphology., 33: 187-201.
Khan, M., 1974. On a freshwaterNardo from In- dia., 44: 237-240.
Meneghini, G., 1841.Algologia dalmatica. Sezione di botanica, e fisiologia vegetabile. Adunanza del dì 16 Settembre 1841. In:. Savi, P., ed., Galileiana, Firenze, 417-436.
Müller, K. M., Vis, M. L., Chiasson, W. B., Whittick, A., and Sheath, R. G., 1997. Phenology of apopu- lation in a boreal pond and its implications for the systematics of section(Batrachospermales, Rhodophyta)., 36: 68-75.
Müller, T., Philippi, N., Dandekar, T., Schultz, J., and Wolf, M., 2007. Distinguishing species., 13: 1469-1472.
Nan, F. R., Feng, J., Lv, J. P., Liu, Q., and Xie, S. L., 2017.(Hildenbrandiaceae, Rhodophyta), a new freshwater species described from Jigongshan Mountain, China., 292: 243-252.
Nan, F. R., Han, J. F., Feng, J., Lv, J. P., Liu, Q., Liu, X. D.,., 2019.Morphological and molecular investigation of freshwa- ter(Hildenbrandiales, Rhodophyta) with a new species reported from Japan., 423: 68-74.
Nan, F. R., Li, J., Liu, X. D., Feng, J., Liu, Q., Lv, J. P.,.,2021. Morphology and molecular phylogenetic analysis of fresh- waterin China., 45: 1341-1350.
Necchi Jr., O., Garcia Fo, A. S., Paiano, M. O., and Vis, M. L., 2019.Revision ofsection(Batracho- spermales, Rhodophyta) with the establishment of the new ge- nus., 58: 582-591.
Nichols, H. W., 1965.Culture and development offrom Denmark and North America., 52: 9-15.
Posada, D., and Buckley, T. R., 2004.Model selection and mo- del averaging in phylogenetics: Advantages of Akaike informa- tion criterion and Bayesian approaches over likelihood ratio tests., 53: 793-808.
Puckree-Padua, C. A., Gabrielson, P. W., Hughey, J. R., and Ma- neveldt, G. W., 2020.DNA sequencing of type material revealscomb. nov. from South Africa andcomb. nov. (Chamberlainoideae, Corallinales, Rho- dophyta) from Argentina., 56: 1625-1641.
Rijk, P. D., Wuyts, J., and Wachter, R. D., 2003.Rna Viz 2: An improved representation of RNA secondary structure., 19: 299-300.
Ronquist, F., and Huelsenbeck, J. P., 2003.MrBayes 3: Bayesian phylogenetic inference under mixed models., 19: 1572-1574.
Saunders, G. W., 1993.Gel purification of red algal genomic DNA: An inexpensive and rapid method for the isolation of polyme- rase chain reaction-friendly DNA., 29: 251-254.
Sheath, R. G., Kaczmarczyk, D., and Cole, K. M., 1993. Distri- bution and systematics of freshwater(Rhodo- phyta, Hildenbrandiales) in North America., 28: 115-121.
Sherwood, A. R., and Presting, G. G., 2007.Universal primers amplify a 23S rDNA plastid marker in eukaryotic algae and cyanobacteria., 43: 605-608.
Sherwood, A. R., and Sheath, R. G., 1999. Biogeography and sys- tematics of(Rhodophyta, Hildenbrandiales) in North America: Inferences from morphometrics andL and 18S rRNA gene sequence analyses., 34: 523-532.
Sherwood, A. R., and Sheath, R. G., 2000. Biogeography and sys- tematics of(Rhodophyta, Hildenbrandiales) in Europe: Inferences from morphometrics andL and 18S rRNA gene sequence analyses., 35: 143-152.
Sherwood, A. R., and Sheath, R. G., 2000. Systematic evaluation of the genus(Rhodophyta): A synthesis of tech- niques., 36: 62-63.
Sherwood, A. R., and Sheath, R. G., 2003.Systematics of the Hildenbrandiales (Rhodophyta): Gene sequence and morpho- metric analyses of global collections., 39: 409-422.
Sherwood, A. R., Shea, T. B., and Sheath, R. G., 2002.European freshwater(Hildenbrandiales, Rhodophyta) hasnot been derived from multiple invasions from marine habitats., 41: 87-95.
Starmach, K., 1969.Growth of thalli and reproduction of the red alga(Liebm.) J. Ag., 38: 523-533.
Tamura, K., Peterson, D., Peterson, N., Stecher, G., Nei, M., and Kumar, S., 2011.MEGA5: Molecular evolutionary genetics ana-lysis using maximum likelihood, evolutionary distance, and ma- ximum parsimony methods.,28: 2731-2739.
Thompson, J. D., Gibson, T. J., Plewniak, F., Jeanmougin, F., and Higgins, D. G., 1997.The CLUSTAL_X windows interface: Flexible strategies for multiple sequence alignment aided by quality analysis tools., 25: 4876-4882.
Vieira, C., Akita, S., Kim, Y. S., Shimada, S., Kawai, H., and Zu- bia, M., 2021.First record of the genus(Flo- rideophyceae: Hildenbrandiales) from French Polynesia and de- scription ofsp. nov., 14: 607-612.
Vis, M. L., and Sheath, R. G., 1997. Biogeography of(Batrachospermales, Rhodophyta) in North America based on molecular and morphological data., 33: 520-526.
Wolf, M., Friedrich, J., Dandekar, T., and Müller, T., 2005. CBCAnalyzer: Inferring phylogenies based on compensatory base changes in RNA secondary structures., 5: 291-294.
Xia, B. M., Wang, Y. Q., Xia, E. Z., Li, W. X., and Ding, Z. F., 2004.. Sci- ence Press, Beijing, 204pp.
Yang, E. C., Boo, S. M., Bhattacharya, D., Saunders, G. W., Knoll, A. H., Fredericq, S.,., 2016.Divergence time estimates and the evolution of major lineages in the florideophyte red algae., 6: 1-11.
Yoon, H. S., Hackett, J. D., and Bhattacharya, D., 2002. A single origin of the peridinin-and fucoxanthin-containing plastids in dinoflagellates through tertiary endosymbiosis., 99: 11724-11729.
Yu, Y., Harris, A., and He, X., 2013.RASP (reconstruct ancestral state in phylogenies) 2.0 beta. Available: http://mnh.scu.edu.cn/ soft/blog/RASP.
Yu, Y., Harris, A., and He, X., 2010.S-DIVA (Statistical Disper- sal-Vicariance Analysis): A tool for inferring biogeographic histories., 56: 848-850.
Zeller, G., 1873. Algae collected by Mr. S. Kurz in Arracan and British Burma, determined and systematically arranged by Dr. G. Zeller., 42: 175-193.
(December 12, 2022;
January 29, 2023;
May 9, 2023)
© Ocean University of China, Science Press and Springer-Verlag GmbH Germany 2023
.Tel: 0086-351-7018121
E-mail: xiesl@sxu.edu.cn
(Edited by Qiu Yantao)
 Journal of Ocean University of China2023年6期
- Journal of Ocean University of China的其它文章
- Effects of 5-Azacytidine (AZA) on the Growth, Antioxidant Activities and Germination of Pellicle Cystsof Scrippsiella acuminata (Diophyceae)
- Improving Yolo5 for Real-Time Detection of Small Targets in Side Scan Sonar Images
- Wave Radiation by a Floating Body in Water of Finite Depth Using an Exact DtN Boundary Condition
- Underwater Acoustic Signal Noise Reduction Based on a Fully Convolutional Encoder-Decoder Neural Network
- Revisiting the Seasonal Evolution of the Indian Ocean Dipole from the Perspective of Process-Based Decomposition
- Assessment of Storm Surge and Flood Inundation in Chittagong City of Bangladesh Based on ADCIRC and GIS
