Design and calibration of an elliptical crystal spectrometer for the diagnosis of proton-induced x-ray emission(PIXE)
Yanlyu Fang(方言律), Dongyu Li(李东彧), Hao Cheng(程浩), Yuan Gao(高原), Ze-Qing Shen(申泽清),Tong Yang(杨童), Yu-Ze Li(李昱泽), Ya-Dong Xia(夏亚东), Yang Yan(晏炀), Sha Yan(颜莎),Chen Lin(林晨),3,†, and Xue-Qing Yan(颜学庆),3
1State Key Laboratory of Nuclear Physics and Technology and CAPT,Peking University,Beijing 100871,China
2Beijing Laser Acceleration Innovation Center,Beijing 101400,China
3Institute of Guangdong Laser Plasma Technology,Guangzhou 510540,China
Keywords: elliptical crystal spectrometer, proton-induced x-ray emission, applications of laser ion acceleration
1.Introduction
Proton-induced x-ray emission (PIXE),[1]an ion beam analysis technique, uses a proton beam to irradiate a sample and stimulate characteristic x-rays of the sample atoms.The energy and intensity of these characteristic x-rays are measured to analyze the species and quantity of elements in the sample.PIXE is a non-destructive analysis technique with high sensitivity, and is widely used in materials analysis,archaeological research,environmental pollution monitoring, and many other fields.In 1980, Fudan University built a PIXE analysis system and applied it to study the 2500-year-old sword of Goujian,providing strong and authentic evidence for the archaeological study of ancient Chinese metallurgy.[2]In 1982,Calicut University used PIXE to study the trace element content in human hair.[3]In 2011, the Atomic Energy Commission in Damascus measured trace elements in sediments of the Orontes River, and this work could provide an effective guide for pollution reduction measures.[4]The elemental composition of Gymnema inodorum Lour was analyzed using PIXE in 2019 by Chiang Mai University.The plant has a very powerful medical value and the elemental analysis of the plant can determine the dosage of the medicine.[5]In the same year,the Department of Archaeology of the University of Tehran used PIXE to study the differences in elemental content in the currency minted in the Seleucid dynasties,providing valuable information on the changes in the monetary system.[6]
The above PIXE analysis is based on traditional tandem accelerators.One of the disadvantages is the huge volume of the device and the complexity of the operation.In recent decades,laser plasma accelerator has become an increasingly active research field due to its ultrahigh acceleration gradient,which is expected to be a future compact accelerator.[7,8]When an ultra-intense laser pulse interacts with a solid-density plasma, the hot electrons will be driven out of the target due to the ponderomotive force of the laser,forming a sheath field with a gradient up to TV/m; the ion beam (mainly protons)will be accelerated to high energy on the scale of tens to hundreds micrometers under the action of this filed.Because the acceleration occurs in an ultra-short transient process,the laser-driven proton beam has the characteristics of high short pulse duration (ps–ns),[9]high peak current,[10]low normalized emittance(down to about 10-3mm·mrad),[11]and broad energy spread (almost 100%).[8]These characteristics determine that the beam detection, transmission, and utilization are different from those of traditional accelerators.Recently,laser-accelerated proton beams have been considered for PIXE analysis.[12–17]In 2017, Barberioet al.proposed a scheme for laser-PIXE and completed validation experiments.[12]In 2021,Miraniet al.presented the first quantitative laser-driven PIXE and energy-dispersive x-ray(EDX)experimental investigation and showed quantitative information about the sample structure using only laser-PIXE.[16]In 2022,Boivinet al.demonstrated the feasibility of quantitative analysis for elemental composition in solid samples using laser-based x-ray fluorescence (XRF) and PIXE.[17]The advantages of laseraccelerated proton beams are that the whole system is more compact and miniaturized, and the broad-spectrum proton beam can achieve laminar scans of samples in the depth direction in a single shot,[6]showing great potential for applications in areas such as cultural heritage.It’s worth mentioning that scholars have regularly used x-ray single photon CCDs[15–17]for the measurement of laser-PIXE signals.From the detection results,the width of the spectral lines is up to several hundred eV, and the noise may swamp the weaker spectral line signals.Besides, some factors affecting signal qualities such as the peak-to-Compton ratio and resolution, are highly dependent on the quality of the CCD fabrication process.
PIXE experiments on conventional accelerators are usually conducted with semiconductor detectors, such as silicon drift detectors (SDDs).Compared with other semiconductor detectors like silicon PIN devices,SDDs have the advantages of being small,inexpensive,maintaining a high counting rate,and having good energy resolution(better than 200 eV).However, conventional semiconductor detectors have a limitation of the electronic response time (ns scale), so they cannot respond to laser-driven particle beams,whose pulse width is ultrashort (initially ps scale).[9]In such a case, there will be a build-up or loss of x-ray signals.In addition, the interaction between the ultra-intense laser and the target generates strong electromagnetic pulse(EMP)signals[18]that interfere with the electronics circuitry.Therefore, conventional semiconductor detectors may not be suitable for laser-PIXE signal acquisition.It is crucial to design a detector suitable for laser-driven PIXE experiments.
Here,we have designed and calibrated a reflective elliptical crystal spectrometer(ECS)to diagnose laser-PIXE,which can potentially solve the above problems.ECS is commonly used as an essential instrument for the diagnosis of plasma,and can often be seen in inertial confinement fusion (ICF)experiments.[19–22]By virtue of its high spatial and temporal resolution, ECS can be used to detect ultrashort pulse-width x-rays.However,most of the studies have been conducted on improving the detector resolution, sensitivity, etc.,[19,23]but lack the detailed calibration process for the detector.Here we provide a complete and detailed calibration procedure and enable giving a specific beam current indicator in experiments based on the calibration results,which is highly informative.
Different from the delicate detection of line shifts in plasma environments,this ECS is designed to detect the characteristic x-rays of solid matter.By using three curved crystals we made it possible to cover a wide energy range of 1 keV–11 keV, suitable for identifying dozens of major elements in nature.We have carried out the calibration experiment of ECS on the electrostatic accelerator of Peking University using samples of Al, Ti, Cu, and ancient ceramic artifacts.The experiment results show that the ECS has better energy spectrum resolution than SDD and is conducive to fine element analysis.And the detection efficiency of ECS was obtained in the order of 10-9,providing detection thresholds for experiments.It also indicates that a proton beam with a large accumulated charge or detector with a signal multiplication function is required to obtain clear signals.We will continue to improve it in the subsequent experiments.
2.Design of elliptical crystal spectrometer
The x-ray optical system was designed by elliptical geometry, as shown in Fig.1.[20]The x-ray source, produced by laser-accelerated proton beams on the sample,is located at the one focal point of the ellipse.The proton-induced x-rays diffracted by the crystal are focused at the other focal point of the ellipse(crossover focus).The x-ray detector behind the second focus point is applied to measure the x-ray spectra by recording location information.

Fig.1.Schematic of the locations of the elliptical crystal segment and detector surface relative to the x-ray source and diagnostic space.

Table 1.Main characteristics of the described elliptical crystal spectrometer.
The geometry of the elliptical crystal spectrometer is defined by the ellipse eccentricityε,the focal length 2f(distance of x-ray source to crossover)and the inclination angleηof the semimajor axis with respect to the source-diagnostic port center line.The ellipse parameters and location of the detector are optimized by maximizing the spectrum to cover a large x-ray energy range and keeping a high spectral resolution within the physical constraints of the system.As shown in Table 1, the final ellipse parameters areε=0.9849,2f=295.46 mm andη=3.38◦.
The x-rays will be diffracted by the crystal when they arrive at the crystal plane.All crystal spectrometers are based on Bragg’s law
wheredis interplanar spacing of the crystal,θis the Bragg angle,which is the angle of the ray with respect to a particular set of diffracting planes,nis the diffraction order andλis the x-ray wavelength.The x-rays with different photon energies(different wavelengths) are diffracted by the crystal to different spatial positions.[24]The application-driven spectral coverage requirement of roughly 1 keV–11 keV was achieved using three different crystals: mica(002),SiO2(100),and SiO2(110) with 2dlattice spacings of 1.984 nm, 0.8512 nm, and 0.6687 nm, respectively.The crystals (55 mm in length and 14 mm in width) are bent along the surface of the ellipse but remain flat in the direction perpendicular to the plane of the ellipse.The x-ray spectral range covered by three channels is shown in Table 1.A Fuji BAS-MS image plate (IP) is used as the x-ray detection medium, which locates 50 mm behind the focusing crossover.The operating principle of IP for x-ray detection is the photo-stimulated luminescence(PSL)effect of the fluorescent layer.[25]Figure 2 shows the internal structure diagram of ECS.
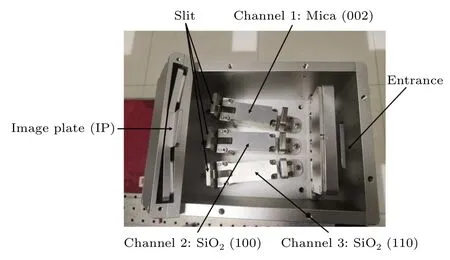
Fig.2.Internal structure photo of ECS.
3.Calibration experiment
3.1.Experimental setup
The detection efficiency of ECS was calibrated using the 4.5 MV electrostatic accelerator at Peking University.The experimental setup is shown in Fig.3.In the experiment, the monoenergetic proton beam generated by the electrostatic accelerator was a continuous beam, which was incident vertically on the sample surface through a collimated hole with a diameter of 6 mm.The samples used in this experiment were 100µm thick aluminum,titanium,and copper foils,and a 15 mm×5 mm fragment of ceramic from the Site of Xanadu(dating from about 1300 AD).The ECS was placed in front of the target at the angle of 45◦,detecting the x-ray energy spectrum induced by the proton beam on the sample.At the same time, an SDD produced by Amptek company was used as a contrast for x-ray detection to verify the validity of ECS and was placed on the other 45◦side of the target.The entrance to ECS was used to locate the x-ray source by installing a component shaped like a needle,the position of which corresponds to a focal point of the ellipse.The x-ray can be detected after removing the needle.
The incident proton beam energy was 1 MeV, and its intensity could be measured by HD-V2 radiochromic films(RCF).[26]The incident protons ionized the active material in the RCF,causing it to polymerize,and the film color changed from light green to dark blue.The deposition dose can be calculated according to the degree of color change,so as to obtain the accumulated proton beam charge.The RCFs and the irradiated samples are installed on a vacuum stepper motor to realize the conversion of proton beams measurement and PIXE signals measurement, as shown in Fig.3.To give an example,when the irradiation time was 45 minutes,the total proton charge accumulated on the RCF was calculated to be 540µC.Therefore,the proton beam intensity was 0.2µA.
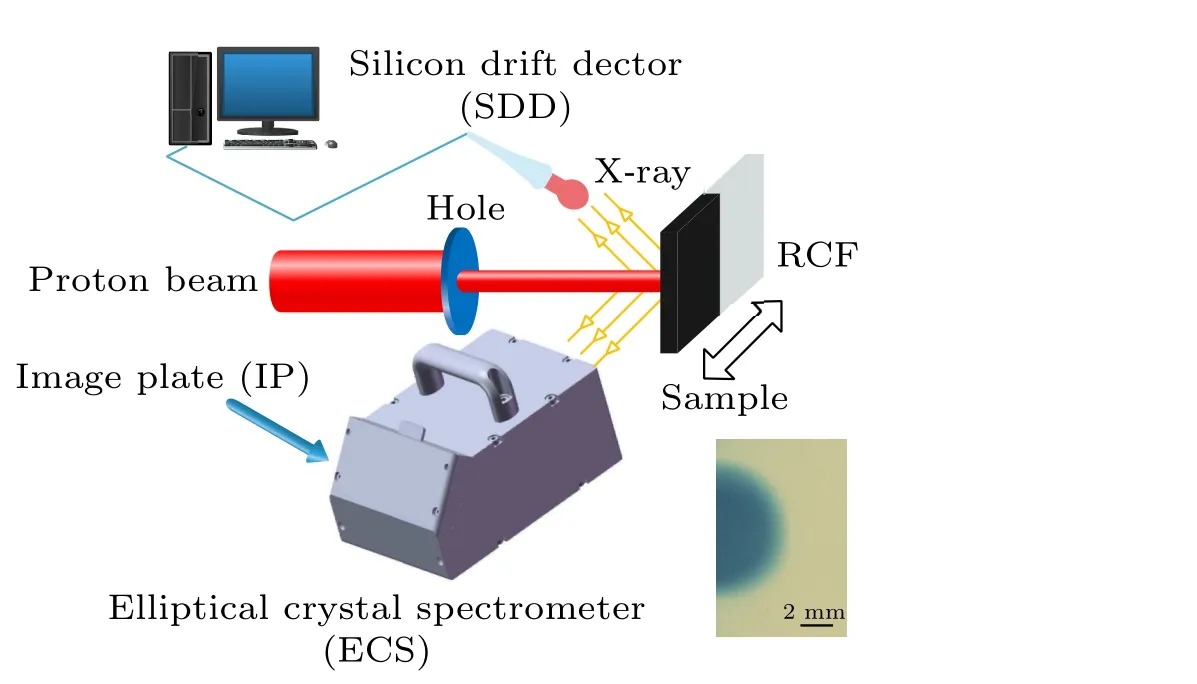
Fig.3.Calibration experiment setup.A continuous proton beam with an energy of 1 MeV is incident vertically on the sample from the left side.The ECS and SDD are placed at 45◦on each side of the sample for the measurements.The RCF is fixed on the step motor for beam intensity measurements.The bottom right graph shows the beam spot distribution of protons on the RCF after 10 seconds of irradiation.
3.2.Calibration process
Since theKαcharacteristic x-rays of Al, Ti, and Cu are 1.49 keV,4.51 keV,and 8.05 keV,respectively, we calibrated the detection efficiency of three channels of ECS using these three elements.Figure 3 shows the grayscale map of the original characteristic x-ray signals obtained by scanning the IP of channel 2 when the sample was a 100µm Ti foil.The image from left to right corresponds to x-rays’ energy from low to high.The two vertical dark lines observed in Fig.4(a)represent theKαandKβcharacteristic x-rays of Ti,from which we can obtain the relationship between the grayscale value and the spatial position of lines on the IP.And since different positions on the IP correspond to different x-rays energies, the original grayscale image of the IP can be converted into an x-ray energy spectrum.Figures 4(b)–4(d)show the x-ray energy spectra of the three samples measured by three channels of ECS and SDD, respectively.The detection results of ECS are in full agreement with those of the SDD,demonstrating the validity and reliability of ECS for x-ray diagnosis.
We measured the energy resolution of a detector with the FWHM of the spectral lines in the x-ray energy spectrum.For theKαcharacteristic x-rays of Al,Ti,and Cu,the energy resolution of the SDD was 130 eV, 117 eV, and 157 eV at the corresponding energies,while it was 38 eV,50 eV,and 117 eV with ECS.It shows that compared with the conventional SDD,the ECS has better energy resolution.

Fig.4.(a)Schematic of image plate.(b)–(d)Comparison of characteristic x-ray spectra of Al,Ti,and Cu of SDD and ECS.
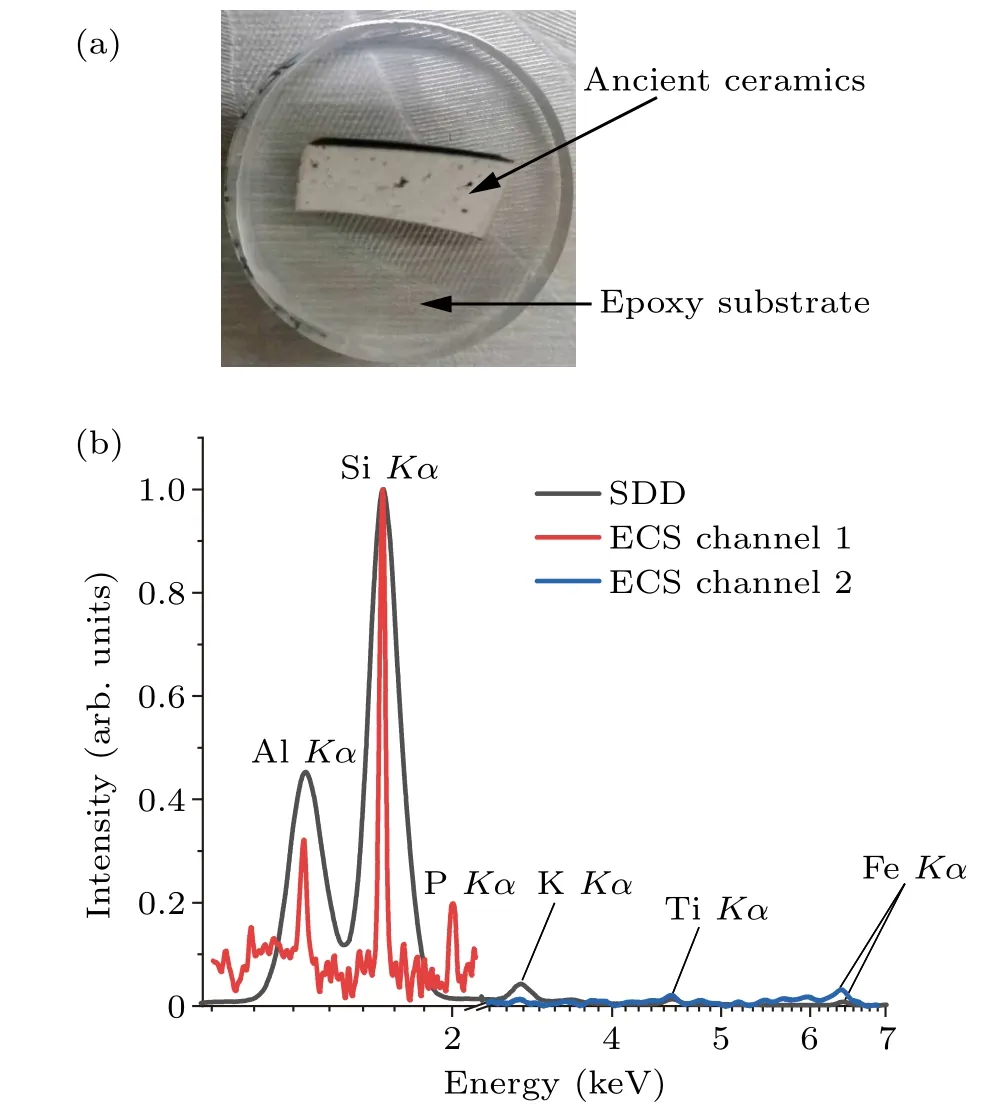
Fig.5.(a) Sample of the ancient ceramic artifact.(b) Comparison of characteristic x-ray spectra of SDD and ECS.
In addition to single-element samples,we also tested a ceramic artifact fragment from the Site of Xanadu.Figure 5(a)shows the physical image of the artifact sample.Figure 5(b)shows the normalized characteristic x-ray spectra detected by SDD and ECS.In the spectrum detected by SDD,several characteristic x-ray peaks indicate that the ceramic sample contains elements of Al,Si,K,Ti,and Fe.In contrast,the spectra detected by ECS have better energy resolution for channel 1 measuring low-energy x-rays.The spectra of ECS show that it can detect almost the same elements as SDD, and identify the element phosphorus.That means the ECS is capable of analyzing multi-element samples.
Then we need to calculate the detection efficiency of the ECS.The detection efficiencyεcan be expressed as
whereNIPis the number of characteristic x-ray photons received by the IP, andN0is the total number of characteristic x-ray photons produced by samples.It is firstly necessary to quantify the number of characteristic x-ray photons received by IPs based on the grayscale image.We use the photostimulated luminescence(PSL)value to quantify the number of photons received by IPs,and their relationship can be expressed as
whereηis the energy absorption rate of the image plate for xrays,and for the BAS-MS type,ηis 100%when x-rays are at energy 1 keV–10 keV.[25]ψjis the response function of each x-ray photon absorbed by the image plate in mPSL.The linear fit ofψjafter calibration is expressed as
whereEis the x-ray energy,mjandcjare linear coefficients.The linear coefficients of different photon energies can be obtained according to the literature.[27]Based on theKαcharacteristic x-rays of the elements Al, Ti, and Cu, theψjis calculated to be 1.0843 mPSL, 4.305 mPSL, and 6.831 mPSL,respectively.
And the PSL value mentioned in Eq.(3)can be calculated according to scanning parameters of the IP readout instrument FLA-7000:[28]
whereGis the grayscale value of the original signal obtained from scanning the IP.Rµmis the spatial resolution of the scanner in µm, i.e., the actual size of each pixel, generally set to 25 µm.h(V) is the sensitivity of the readout system, which can be obtained from the calibration results in the literature,[28]andVis the readout voltage of the photomultiplier tube in the FLA-7000 machine.Lis the dynamic range of the scanner,which is generally set to 5 in experiments.
The grayscale values of the characteristic x-ray spectral lines are obtained from the grayscale image after subtracting the background noise,and can be converted to PSL values according to Eq.(5).The PSL values of all pixels in a spectral line are summed up to get the total PSL value corresponding to each recorded characteristic x-ray.Combining Eqs.(3)–(5),we can obtainNIPvalues,for instance,NIPis 2.65±0.93×10⁴for Al sample.
As forN0,we use the LibCPIXE program to calculate.[29]The incident proton energy is set to 1 MeV and the charge is 540 µC, which equals to 3.375×10¹⁵protons.The protons are incident vertically on Al, Ti, and Cu samples of 100 µm thickness.Approximately every 102–104protons can stimulate one photon, and the exact value varies depending on the element.The stereo angle of the detector is 0.026 sr and the detection angle is 45◦in front of the target.Therefore,N0can be obtained from simulations, for example,N0is equivalent to 3.8×10¹³for Al sample.The detection efficiencyεof the ECS three channels can thus be obtained in the order of 10-10to 10-9,as shown in Fig.6.This means that the proton beam irradiated samples produces 109Kαcharacteristic x-ray photons in the 4πspace,and only 1Kαphoton is received on the image plate of the ECS.
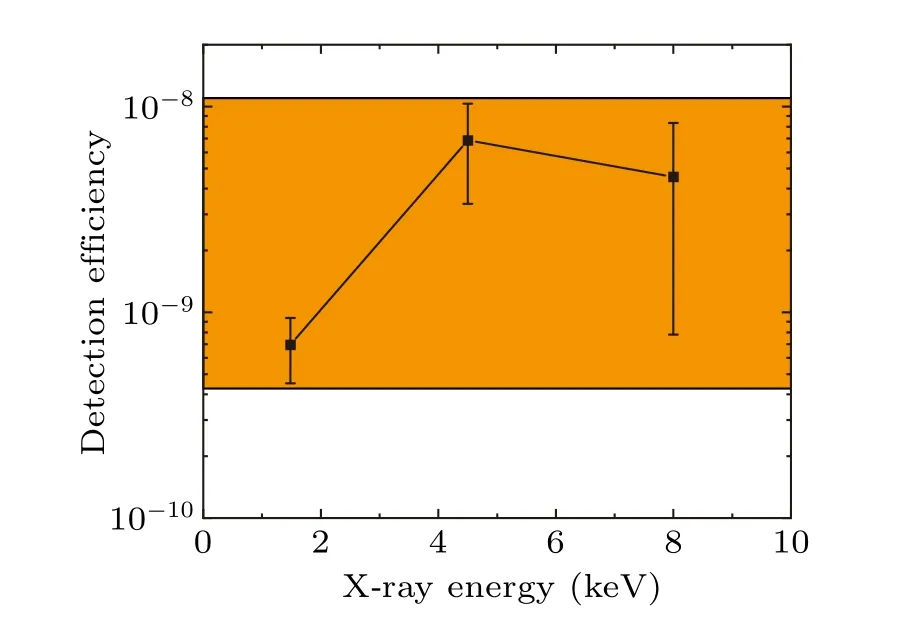
Fig.6.The detection efficiency of ECS.
4.Discussion
We have demonstrated the feasibility of this elliptical crystal spectrometer, and the next step is to carry out experiments on the platform of a laser accelerator.It is necessary to note that the PIXE analysis system with laser-accelerated proton beams must be well shielded.In addition to a large number of protons,the interaction between ultra-intense laser and targets will also produce strong x-rays and electrons.The xrays and bremsstrahlung radiation produced by electrons could affect the image plate to receive the characteristic x-rays by means of reducing the signal-to-noise ratio.For this reason,when the experiment is conducted in the chamber, as shown in Fig.7(a),we should add a lead shielding box to the ECS in the experiment and also use a magnet to remove electrons if necessary.
When it is conducted in the beamline, as shown in Fig.7(b), we can quickly produce the mono-energetic proton beam with different energies.[30]Moreover,since the sample is far away from the chamber,the effect of the radiation from the laser-target interaction can be attenuated.So there is no need to worry about the characteristic x-rays signals being flooded.
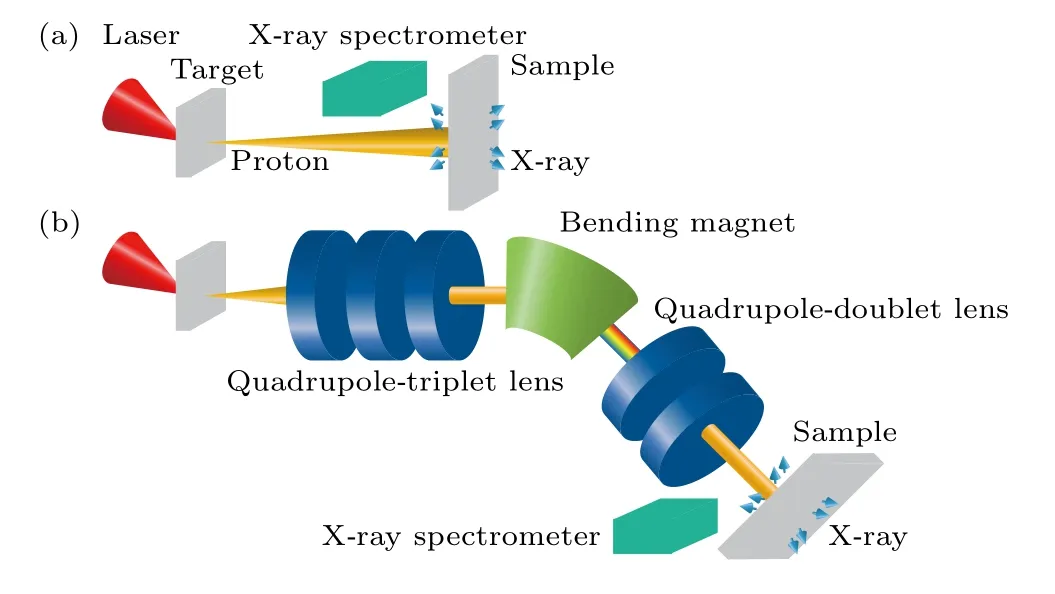
Fig.7.(a)Experiment setup in the chamber.(b)Experiment setup in the beam line.
However,from the calibration results in the previous Section 3,the detection efficiency of ECS is relatively low.Afterward, we may try some measures to solve the problem, such as increasing the detector collecting angle or changing the detection medium from IPs to photomultiplier tubes,etc.
5.Conclusion
The elliptical crystal spectrometer is designed to detect x-rays produced in laser-driven PIXE experiments and can detect x-rays in the energy band from about 1 keV to 11 keV.Compared to conventional semiconductor detectors, it works by optical imaging, is suitable for particle beams with ultrashort pulse widths driven by laser accelerators,and has better resolution.We have completed calibration experiments on a 4.5 MV electrostatic accelerator at Peking University to obtain the detection efficiency of the ECS three channels,based on which the detection thresholds are given directly.Also,we provide an experimental scheme for laser-PIXE on the laser acceleration platform.The design and calibration of the elliptical crystal spectrometer lay a foundation for the realization of a laser-driven PIXE system.
Acknowledgments
Project supported by the National Natural Science Foundation of China (Grant Nos.11975037 and 11921006),and the National Grand Instrument Project of China (Grant Nos.2019YFF01014400 and 2019YFF01014404).The authors would like to thank Prof.Q.L.Ma from Shandong University and Dr.B.Y.Zhou from the University of Science and Technology Beijing for providing ancient artifacts.
- Chinese Physics B的其它文章
- Optimal zero-crossing group selection method of the absolute gravimeter based on improved auto-regressive moving average model
- Deterministic remote preparation of multi-qubit equatorial states through dissipative channels
- Direct measurement of nonlocal quantum states without approximation
- Fast and perfect state transfer in superconducting circuit with tunable coupler
- A discrete Boltzmann model with symmetric velocity discretization for compressible flow
- Dynamic modelling and chaos control for a thin plate oscillator using Bubnov–Galerkin integral method

