Impact of clay particle reattachment on suffusion of sand-clay mixtures
Jongmuk Won, Yongjoon Choe, Yerim Yng, Hngseok Choi,*
a Department of Civil and Environmental Engineering, University of Ulsan, Daehak-ro 93, Nam-gu, Ulsan, 680-749, South Korea
b School of Civil, Environmental and Architectural Engineering, Anam-dong 5-ga, Korea University, Seoul,136-713, South Korea
Keywords:
ABSTRACT The detached clay particles directly filtrated through the sand-clay mixture lead to suffusion;however,if the detached clay particles are subjected to reattachment,the degree of suffusion may be less significant.This study investigates the impact of clay particle reattachment on suffusion of sand-clay mixtures through laboratory soil-column experiments.The observed breakthrough curves (BTCs) of kaolinite,illite,and montmorillonite for 5 different column lengths(3 in,6 in,9 in,12 in,and 18 in;1 in=2.54 cm)indicated that a higher breakthrough concentration was observed as the column length(L)decreased for kaolinite and illite, whereas a reverse trend was observed for montmorillonite.In addition, the increase in the fraction of filtrated clay particles (Me) with an increase in L (Me = 10.42% for L = 3 in and Me=3.59%for L=18 in)for the sand-illite mixture indicated that the reattachment effect became more significant as the travel length of detached clay particles increased.The observed BTCs,retention profiles after injection, and fraction of filtrated clay presented herein suggest the need to incorporate the reattachment effect when assessing the suffusion of clay-containing soils.
1.Introduction
Suffusion can be defined as the loss of relatively small particles under seepage flow, with no volume change in the soil matrix(Indraratna et al., 2011; Benamar et al., 2019; Kodieh et al., 2020).Suffusion is one of the four primary categories of internal erosion(the other three categories are concentrated leak erosion,backward erosion,and dispersion),which causes the failure of earth dams or deteriorates the performance of earth structures (e.g.dikes and levees) subjected to internal seepage flow.The greater hydrodynamic forces applied to particles cause the detachment of small particles;such particles are filtered out of the soil matrix if they are not subjected to reattachment.Significant suffusion leads to an increase in the pore space and potentially causes volume contraction in coarse-grained soil (Seghir et al., 2014; Hu et al., 2019).Suffusion with volume contraction and rearrangement of coarsegrained soil is also sometimes referred to as suffosion (Fannin and Slangen, 2014; Fannin et al., 2015; Jiang et al., 2017; Zhou et al., 2020).
Extensive studies have been conducted to investigate the vulnerability of soil to suffusion owing to its importance in the stability of earthen structures and the lack of comprehensive understanding on this topic.In particular, several studies have demonstrated that the critical hydraulic gradient (hydraulic gradient for triggering suffusion) obtained from experimental setups provides vital insights into hydraulic-induced suffusion at a wide range of relative densities (Israr and Indraratna, 2019), flow directions(Xiong et al.,2021),sizes of the experimental specimens(Zhong et al., 2018), vertical and horizontal flows (Ahlinhan and Achmus, 2010; Liang et al., 2017), hydraulic loading histories(Rochim et al.,2017),ratios between deviatoric and mean effective stresses (Luo et al., 2019), and stress conditions (isotropic, anisotropic,compression,and extension)(Chang and Zhang,2013;Liang et al., 2019).The aforementioned studies encompass (although certain cases still require further investigation) almost all the possible factors affecting the hydraulic aspect of the suffusion process.
In the field of colloidal particle transport, several studies have investigated the impact of ionic strength on the retention and transport of latex colloidal particles in sand media (Roy and Dzombak, 1996; Saiers and Lenhart, 2003; Bradford et al., 2007;Torkzaban et al.,2008; Torkzaban and Bradford, 2016) for applications in contaminant transport.These studies involved a soilcolumn experiment to obtain retention profiles and breakthrough curves (BTCs) and back-calculated the rate of retention and detachment in the advection-dispersion formulation.As latex colloidal particles may not necessarily represent fine particles(particularly, clay particles) owing to their varying chemical compositions and aggregation behavior depending on the ionic strength (Berka and Rice, 2005; Heidmann et al., 2005; Palomino and Santamarina, 2005; Reddi et al., 2005; Won et al., 2021),certain studies utilized fine particles in their experiments (e.g.silt or clay) (Compère et al., 2001; Hajra et al., 2002; Mesticou et al.,2014, 2016; Won and Burns, 2017; Won et al., 2020).These studies revealed that the significant retention (or clogging) of fine particles with an increase in the ionic strength is caused by the increased attraction between the fine particles and sand grains.This can also be theoretically demonstrated by Derjaguin-Landau-Verwey-Overbeek(DLVO) theory,according to which an increased ionic strength reduces the double-layer repulsion energy.
Particle transport studies provide insights into hydraulic conditions and water chemistry for a comprehensive understanding of suffusion.These studies indicate that a decrease in ionic strength leads to a higher probability of fine particle detachment.However,the experiments included in the abovementioned particle transport studies were performed under conditions involving the injection of fine or colloidal particles into a clean sand medium.This process may not accurately simulate the suffusion process because the threshold ionic strengths for the retention and detachment of fine particles are not identical.Furthermore,most previous studies have investigated the hydraulic aspects of suffusion based on the concept of the critical hydraulic gradient (Rochim et al., 2017;Zhong et al., 2018; Israr and Indraratna, 2019) for gap-graded coarse-grained soils.An increase in the hydraulic gradient can be the most dominant factor inducing suffusion; however, an alteration in the pore fluid chemistry may also occasionally lead to suffusion,particularly in sand-clay mixtures,owing to the relatively high probability of clay particle detachment, which can be attributed to the decreased attraction between the sand and clay particles.Therefore, assessing the impact of the pore fluid chemistry(e.g.ionic strength and pH)on the suffusion of sand-clay mixtures under given hydraulic conditions is crucial (Benamar, 2014; Choe et al., 2022; Won,2022; Won et al., 2022).
The reattachment of detached clay particles can occur when the clay particles are deposited to the pore throats or the attraction energy between sand grains and clay particles are higher than the hydrodynamic forces applied to the clay particles.In addition, the ionic-concentration-induced suffusion of sand-clay mixtures can be initiated by the detachment of clay particles.When the detached clay particles are not subjected to reattachment owing to pore size restrictions or high attraction energy,such clay particles should be filtered out,leading to suffusion.Therefore,no reattachment leads to the overestimation of suffusion.Nguyen et al.(2017) documented the reattachment effect of gap-graded coarse-grained soils using optical techniques.In addition, Deng and Wang (2022)visualized the reattachment of detached particles in gap-graded coarse-grained soils.Chaney et al.(2000) reported the importance of reattachment for explaining the surface erosion of a sandkaolinite mixture (kaolinite content of 30%) using the flow pump test.The preceding studies only remarked the importance of the reattachment effect on the suffusion of sand-clay mixtures without detailed supporting evidence.Therefore,the objective of this study is to experimentally investigate the impact of reattachment on the ionic-concentration-induced suffusion of sand-clay mixtures.The reattachment effect of detached clay particles was examined by performing the soil-column experiments using five different lengths of columns.From the observed BTCs, the reattachment effect as a function of column length (travel path of detached clay particles), type of clay, and clay content was discussed.
2.Materials and methods
2.1.Materials
In this study,saturated sand-clay mixtures were prepared in the column to investigate the reattachment effect through soil-column tests.Three types of clay samples and silica sand(K3)were selected to prepare saturated sand-clay mixtures to investigate the impact of clay mineralogy.The specific gravity(Gs),median grain size(d50),minimum void ratio (emin), and maximum void ratio (emax) of the sand and clay samples were determined based on the corresponding ASTM standards (give the reference), and the results are summarized in Table 1.In addition, the particle size distributions(PSDs) of the sand and clay samples were evaluated via the sieve analysis and the hydrometer test (ASTM D422, 2007).The results revealed that the K3 sand used in this study was relatively uniform(Cu= 1.45, where Cudenotes the coefficient of uniformity).The PSDs and images of the sand and clay samples are presented in Figs.1 and 2, respectively.
The mineralogical and chemical compositions of the samples used in this study were characterized using the X-ray diffraction(XRD; step size (2θ) = 0.017, X-ray voltage = 40 kV, and X-ray current=30 mA)and X-ray fluorescence(XRF),as shown in Fig.3 and Table 2.The XRD results revealed that each clay sample was predominantly composed of kaolinite, illite, and montmorillonite.In addition,the XRF results indicated that the K3 sand was mainly composed of silica.
2.2.Sample preparation and experimental setup
Five rigid-wall acrylic columns with an inner diameter of 2 in(1 in = 2.54 cm) and heights of 3 in, 6 in, 9 in,12 in, and 18 in were designed to investigate the impact of the traveling length of detached clay particles on their reattachment and suffusion.A perforated aluminum disc was installed at the top and bottom of the column to distribute the water flow throughout the crosssection of the column, and a plastic mesh with an opening size of 74 μm was installed at the bottom of the column to retain sand grains during injection.
Before mixing with clay, the sand specimen was cleaned by washing it for 1 h before placing it in a sonicator bath(frequency = 40 kHz) until the turbidity of the water became less than 10 NTU.The sand was oven-dried for more than 48 h after washing;this was followed by mixing an appropriate mass of sand and clay in an airtight container by shaking for 0.5 h.The saturated sand-clay mixture was placed in the acrylic column by applying the wet pluviation method with a gradual increase (0.1 in/min) in the water level to prevent segregation during sample preparation.The semi-homogenous condition of the sand-clay mixture was validated by determining the clay content through sampling at 0.5-inintervals along the sand-clay mixture.The measured clay content was almost identical to the target clay content throughout the column (data not presented).In addition, the weight of the saturated sand-clay mixture ensured almost perfect saturated conditions (the weights of sand, clay, and water for the saturated condition could be calculated).
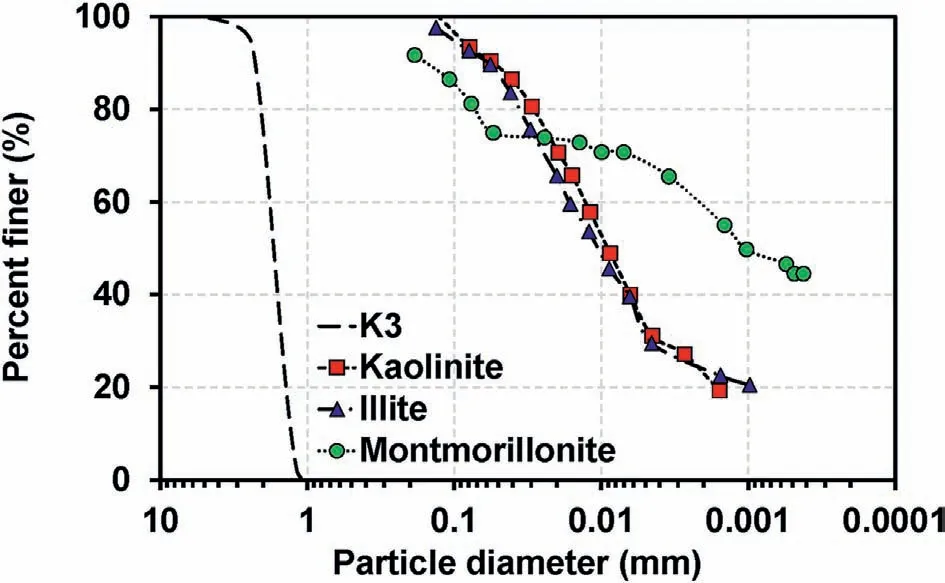
Fig.1.PSDs of sand and clay samples used in column experiments.Note that percent finer = 100%and low percent finer values for clay samples are missing because of the rapid settlement of clay particles at t ~0 and the termination time of the hydrometer test for kaolinite, illite, and montmorillonite at 2878 min, 2635 min, and 17,280 min,respectively.
All sand-clay mixtures with a clay content of 3%were prepared by placing the mass of sand corresponding to the relative density of 70%.Because of the low clay content,the weighed mass of sand was placed in the column,allowing the clay particles to be located at the pore space of the sand medium without losing sand-sand contacts.In contrast, for the 10% kaolinite-sand mixture, the dry sand and kaolinite particles were first mixed in the container, followed by weighing the remaining mass in the container after placing it in the column to determine the porosity of the 10% kaolinite-sand mixture (Table 3).The pore volume (PV) of the prepared sandclay mixture was determined by multiplying the volume of column by the porosity.
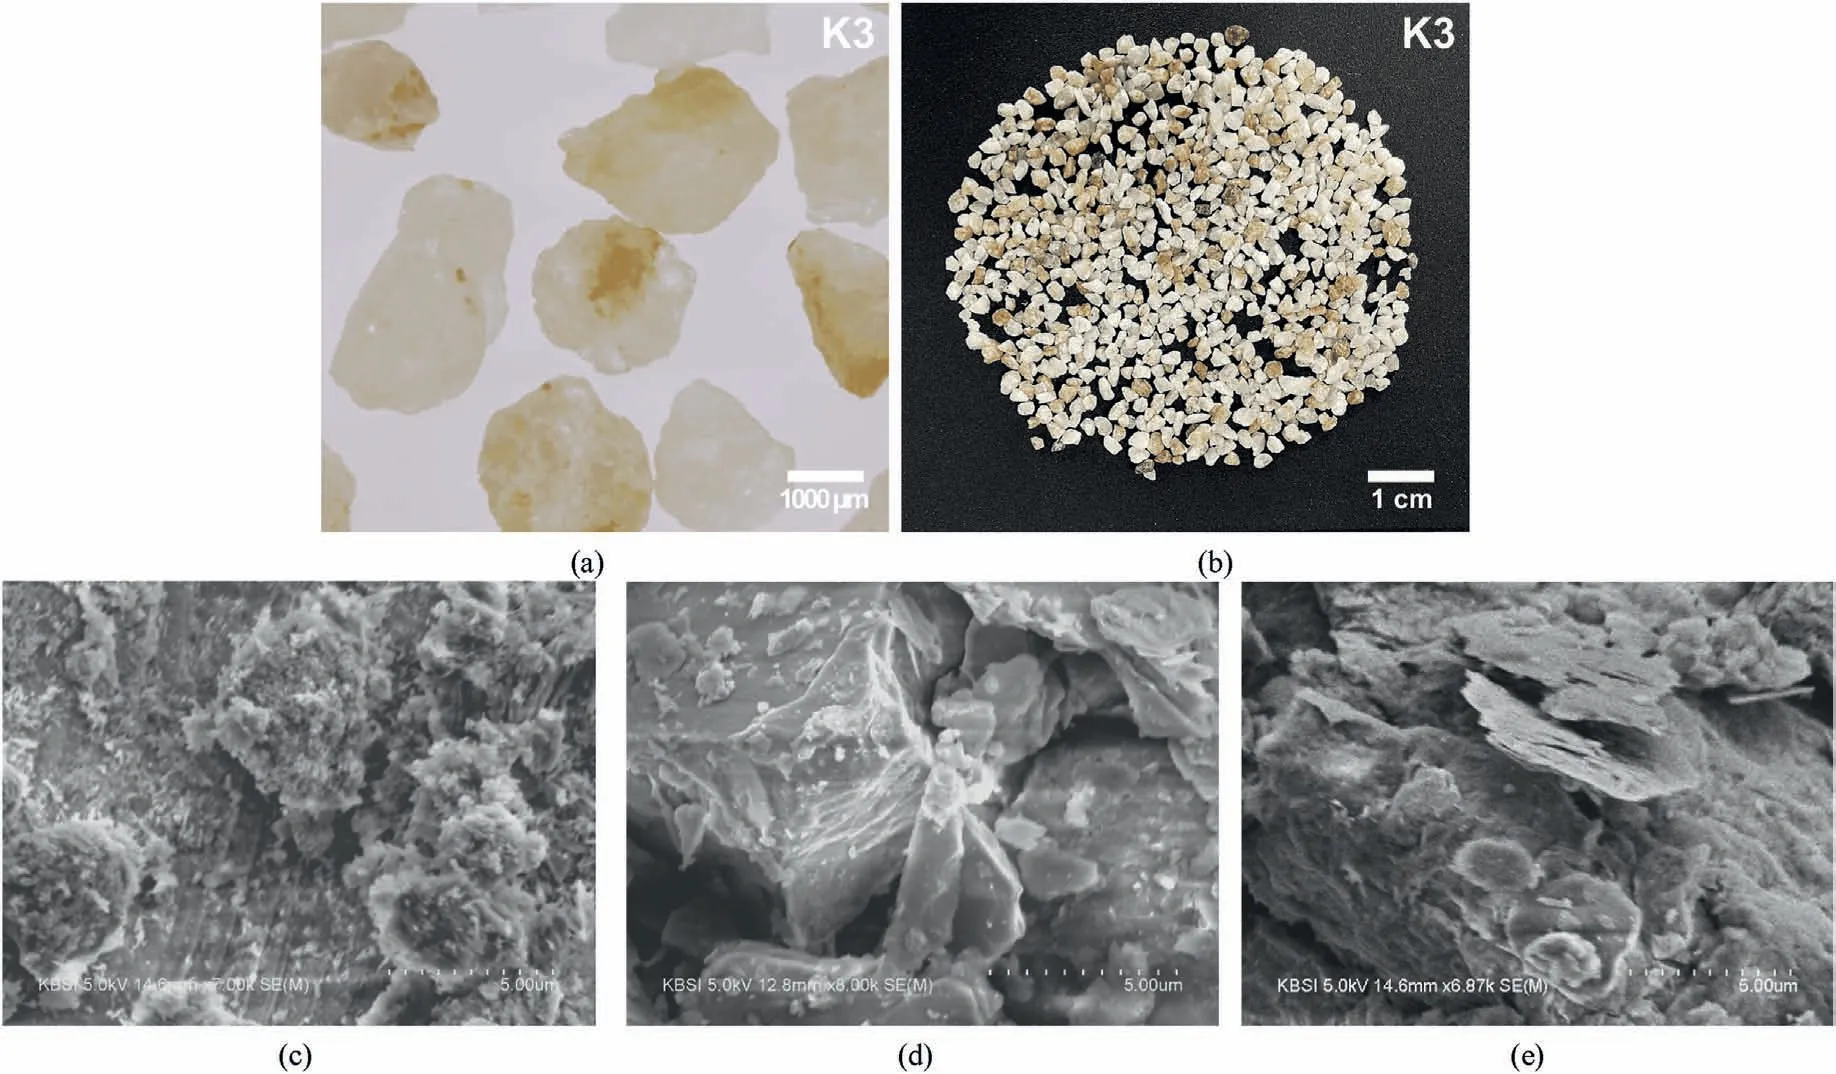
Fig.2.(a) and (b): Microscopic images of sand and scanning electron microscope (SEM) images of (c) Kaolinite; (d) Illite and (e) Montmorillonite.

Fig.3.XRD patterns of (a) Kaolinite; (b) Illite; and (c) Montmorillonite used in this study (analyzed by the Korea Basic Science Institute).
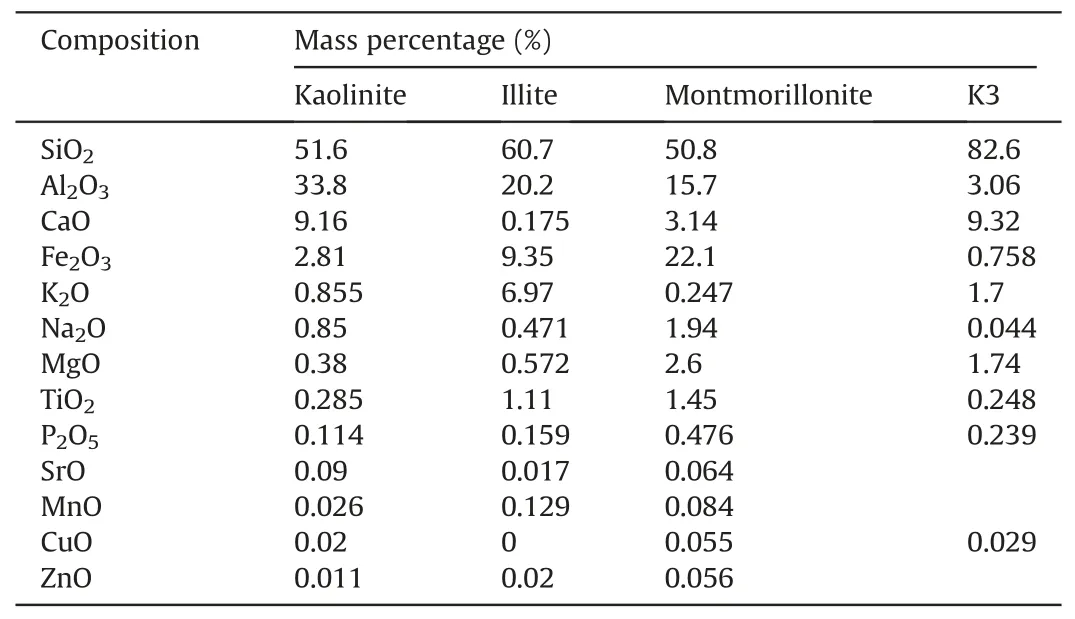
Table 2 XRF results of kaolinite,illite,and montmorillonite and sand(K3)used in this study(analyzed by the Korea Basic Science Institute).
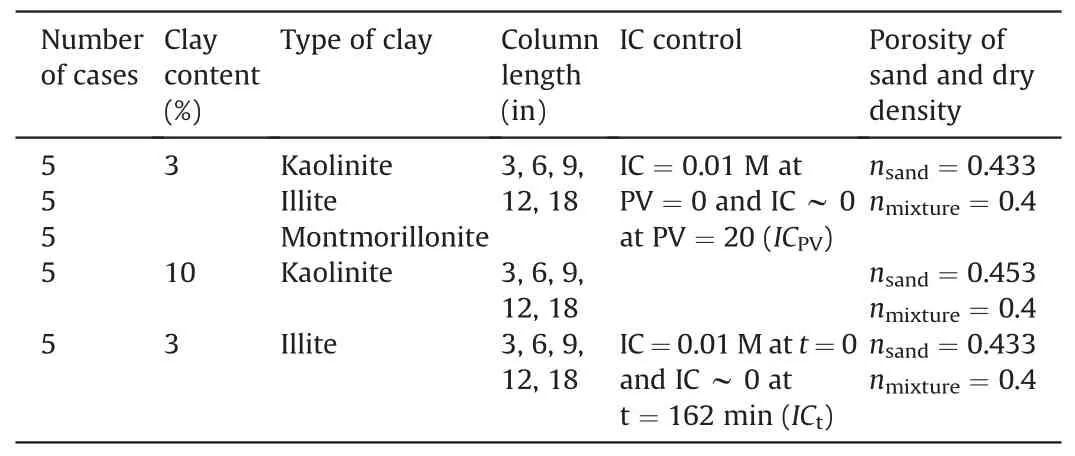
Table 3 Experimental conditions.
After preparing the saturated sand-clay mixture,a solution with an ionic concentration(IC)=0.01 M was injected until the turbidity of the sample obtained through the fractional collector was less than 5 NTU.Following this, the IC of the injecting solution was gradually decreased at a constant flow rate(15 mL/min)for 20 PVs to induce the suffusion of clay.After the injection was terminated,the quantity of clay retained throughout the sand medium was measured at 12 equal depth intervals(e.g.sampling at 1-in intervals along the sand-clay mixture for length of the column(L)=12 in)to assess the movement of clay particles in the column.The mass of the retained clay was evaluated from the measured turbidity of the suspension under vigorous stirring of the sampled sand medium being soaked in 1 L of deionized water.Note that deionized water with an electrical resistivity >18 MΩ cm and oxygen concentration<10 ppb was used in all the experiments, and NaCl was used to control the IC.
A fractional collector was placed at the outlet of the column to measure the concentration of clay eluded by the decrease in IC.Samples were procured from the fractional collector every 30 mL for the 3-in column, every 45 mL for the 6-in and 9-in columns,every 60 mL for the 12-in column, and every 75 mL for the 18-in column.After obtaining the BTCs, the fraction of filtrated clay particles (Me) was evaluated by integrating the BTCs using the trapezoidal method to quantitatively represent the observed BTCs.
As an almost perfect linear relationship between the measured turbidities and the clay concentrations was observed for kaolinite,illite, and montmorillonite (Fig.4b), the clay concentration of the collected samples was determined using a turbidimeter (measurement of 0-1000 NTU with an accuracy of 0.5%).Differential pressure transducers (with an operating range of 0-1 psi and an accuracy of 0.25%) were installed at the top and bottom of the column to estimate the hydraulic conductivity during the injection.Furthermore, a dampener was installed between the peristaltic pump and soil column to decrease the IC to the desired level(based on the initial volume) and minimize the pulsation effect of the peristaltic pump(Fig.5).
2.3.Experimental conditions
Twenty-five column experiments were performed, and the corresponding conditions are summarized in Table 3.Three types of experiments were adopted:IC=0.01 M at PV=0 and IC=0 M at PV = 20 (ICPV) with a clay content of 3% (Fig.6a), ICPVwith a clay content of 10%, and a IC = 0.01 M at t = 0 (PV = 0) and IC ~0 at t=162 min(ICt)with a clay content of 3%(Table 3).For the clay content of 3%,sand-clay mixtures with a relative density of 70%(the corresponding weight of sand was calculated from emaxand eminin Table 1) were prepared because the clay content of 3% was not expected to impede the formation of contacts between sand grains (all the clay particles occupy the pore space in the sand medium).
The low clay content of 3% was selected in this study to investigate the suffusion caused by detachment only at the sand-clay interface.In addition, 10% of kaolinite content was selected to investigate the suffusion caused by detachment at the sand-clay and clay-clay interfaces.On the evidence of the relatively low applied maximum effective stress ranging from 0.395(for 3% illite content) to 10.917 kPa (for 3% montmorillonite content) and the slight reduction in void ratio less than 0.005 after the injection for all experimental conditions, some phenomena and properties observable in soil subjected to water flow e.g.fluidization(Alsaydalani and Clayton, 2014), compressibility (Monkul and Ozden, 2007; Cabalar and Hasan, 2013), shear strength(Thevanayagam, 1998; Cabalar and Mustafa, 2015; Cabalar and Demir, 2019) reported in the literature may not affect the suffusion of sand-clay mixtures in this study.
The final PVs for ICtdecreased as the L increased,as illustrated in Fig.6b.The testing condition of ICtwas selected to investigate the impact of the traveling length of detached clay particles on suffusion under an identical IC gradient.
The volume in the dampener (V) required to obtain a gradual decrease in IC from 0.01 M to ~0 at the desired elapsed time can be calculated as follows:
where t (min) is time, C is the IC of the solution in the dampener(C=0.01 M at t=0),Cinis the inlet concentration of the dampener(Cin=0 M in this study for a gradual decrease in IC),and Q(mL/min)denotes the flow rate (Q = 15 mL/min).In this study, V = 267 mL,534 mL, 801 mL,1068 mL and 1602 mL for the following column lengths:3 in,6 in,9 in,12 in,and 18 in,respectively.Fig.7 illustrates that the measured inlet concentration in the column with a height of 6 in demonstrates almost perfect agreement with that in the analytical solution corresponding to V = 534 mL.
3.Results and discussions
3.1.Impact of column length on suffusion for clay content of 3%(ICPV)
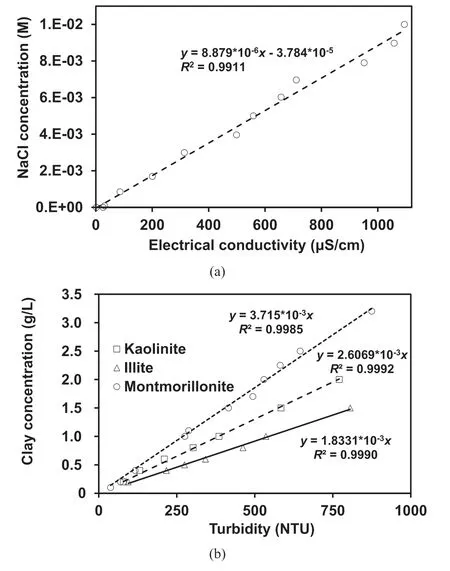
Fig.4.Calibration results of (a) Electrical conductivity vs.NaCl molar concentration and (b) Turbidity vs.concentration of clay suspension.
Fig.8 illustrates the observed BTCs and Mevalues at L=3 in,6 in,9 in,12 in,and 18 in(Fig.8a for kaolinite,Fig.8b for illite,and Fig.8c for montmorillonite) under the ICPVcondition (Fig.6a).As presented in Fig.8,the breakthrough PVs(initiation of suffusion)of filtrated kaolinite,illite,and montmorillonite are similar for the five L values (15 PVs,10 PVs, and 3 PVs for kaolinite, illite, and montmorillonite,respectively).In addition,for kaolinite and illite(Fig.8a and b), a similar increasing trend in the BTC can be observed regardless of L,except for L=3 in and 6 in for kaolinite(Fig.8a)and L=3 in for illite(Fig.8b),which is also represented by the similar Mevalues.The higher breakthrough concentrations at L=3 in and 6 in for kaolinite and at L = 3 in for illite indicate that the reattachment effect is not significant at this relatively low value of L,probably owing to the short flow path for the detached clay particles under such conditions.The low probability of reattachment,which is caused by the short flow path, leads to a high breakthrough concentration at the outlet.Furthermore, similar breakthrough behavior can be observed at L >9 in for kaolinite(Fig.8a),indicating the presence of a threshold length of the flow path(flow paths are likely proportional to L) at which the impact of reattachment becomes similar.It can be anticipated that only a small fraction of the detached kaolinite particles was filtrated out of the column owing to the significant reattachment effect at L >9 in.The observed BTCs illustrated in Fig.8a and b can verify the presence of the critical salt concentration (boundary IC for almost no detachment under nearly constant hydraulic gradients(Khilar et al.,1990;Blume et al.,2005;Seghir et al.,2014)for kaolinite-and illite-sand mixtures.From the observed BTCs (Fig.8a and b), the critical salt concentration for 3% kaolinite and illite contents were approximately 2 ×10⁻⁴and 1 ×10⁻³M, respectively.Therefore, it can be inferred that the concept of critical salt concentration along with the reattachment effect can be applied to understand the suffusion of non-swelling clay-sand mixtures.
In contrast,the suffusion in the montmorillonite-sand mixtures was most significant (highest breakthrough concentration) at L = 18 in (Fig.8c).In addition, the breakthrough concentration range for montmorillonite (<0.8 g/L) was lower than that for kaolinite and illite (<2 g/L).This indicates that the less significant suffusion of montmorillonite-sand mixtures can be attributed to the swelling characteristics of montmorillonite, which may block the pore space in the sand medium,even at a low montmorillonite content of 3%.Thus, at a given flow rate, a higher probability of water flow through the preferential flow path for montmorillonite would be anticipated compared with that for kaolinite or illite.As the detachment of montmorillonite primarily occurs along the preferential flow path, the highest Mevalues at L = 18 in for montmorillonite(Fig.8c)indicate that the highest number of flow paths may be formed at L=18 in,which lead to the most significant detachment and suffusion effects.The highest breakthrough concentration was observed at L=18 in,as illustrated in Fig.8c,for the montmorillonite-sand mixture, indicating that the formation of a preferential flow can be a more critical factor than reattachment for developing suffusion in swelling clay-sand mixtures.Note that the formation of preferential flow was also found in the literature for gap-graded coarse-grained soils (Nguyen et al., 2019) and wellgraded coarse-fine mixture with a fine content >10% (Sato and Kuwano, 2015; Liu et al., 2020).
The formation of preferential flow paths in the montmorillonite-sand mixture was observed at the cross-section of the sample after injection, as indicated in Fig.9.In addition, the evidence of forming a preferential flow in the montmorillonitesand mixture was also observed in the measured retention profiles (Fig.10) and relative hydraulic conductivity (Fig.11).As illustrated in Fig.10, the retained clay content higher than 3% at the bottom of the column for kaolinite (Fig.10a) and illite (Fig.10b)indicated that the reattachment of kaolinite and illite occurred during injection.In contrast, the relatively uniform distribution of the retained clay content of 3% for montmorillonite (Fig.10c)indicated that the detached montmorillonite particles seldom reattached, which were most likely filtrated through the preferential flow paths.Note that the unexpectedly high illite content at normalized depth=0.2-0.5 for L=9 in(Fig.10b)can be attributed to the slightly denser initial state of the sand medium,which led to significant reattachment in such depth range.
An increase in the relative hydraulic conductivity for L=9 in,12 in, and 18 in, presented in Fig.11c, can also be attributed to the formation of a preferential flow during injection.In contrast, a slight decrease in the relative hydraulic conductivity during the injection of kaolinite(Fig.11a)and illite(Fig.11b)similarly indicates that almost no preferential flow paths were formed during injection.Note that the decrease in the relative hydraulic conductivity,presented in Fig.11a and b,can be explained by the nonuniformity in the retention profiles (Fig.10a and b); this is because the hydraulic conductivity of sand-clay mixtures is governed by the sand layer with the highest clay content (i.e.lowest hydraulic conductivity) (Won and Burns, 2017).The slight reduction in the porosity of the sand-clay mixture during injection could be another factor influencing the reduction in the hydraulic conductivity.
3.2.Impact of column length on suffusion for kaolinite(content = 10% (ICPV))
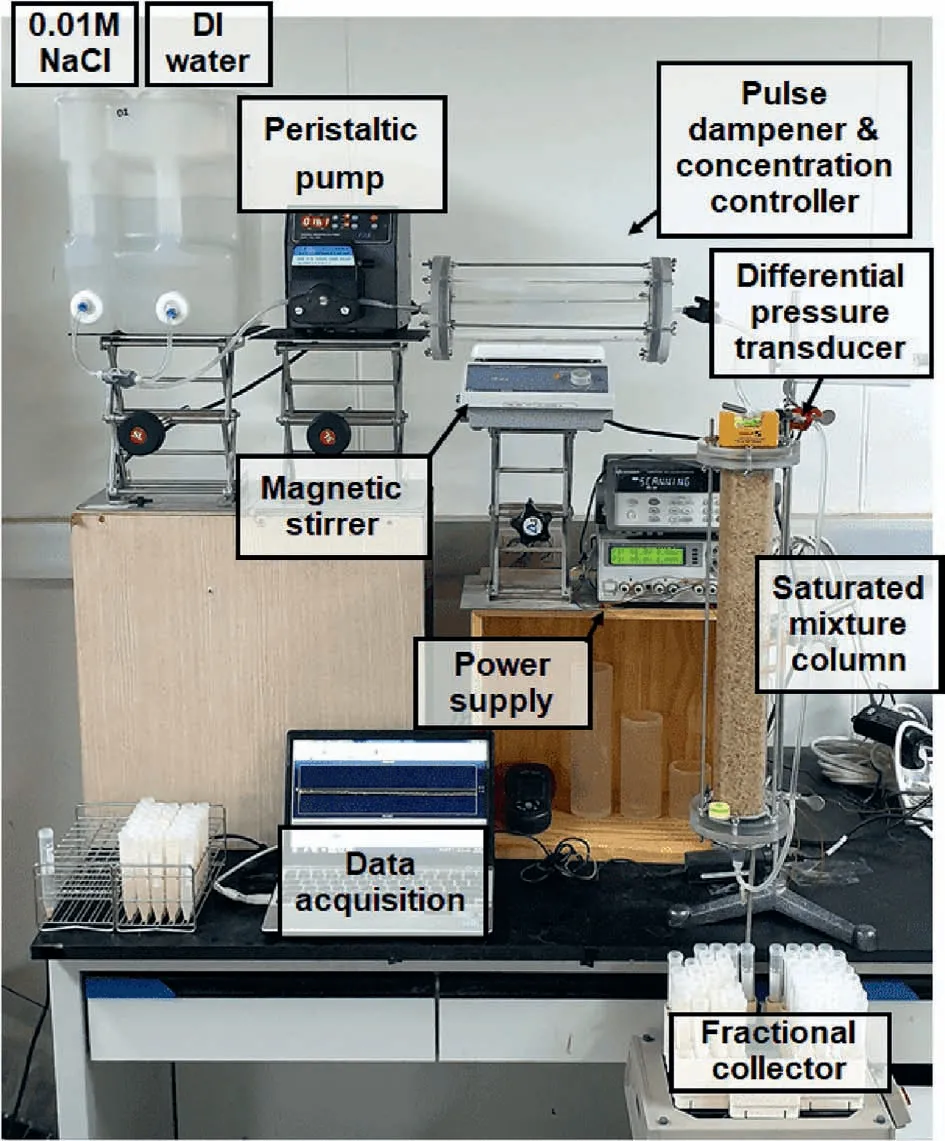
Fig.5.Photograph of experimental setup.
Fig.12a illustrates the observed BTCs for the 10%kaolinite-sand mixture at L=3 in,6 in,9 in,12 in,and 18 in and the corresponding Mevalues.As presented in Fig.12a,the breakthrough concentration of kaolinite increases as the L value increases.The Mevalues indicate an abrupt increase in the filtrated kaolinite content when L increases from 12 in (Me= 10.49%) to 18 in (Me= 21.74%).The increase in Mevalues with an increase in L indicates the occurrence of more significant suffusion as the traveling length of detached kaolinite particles increases at the high kaolinite content of 10%.
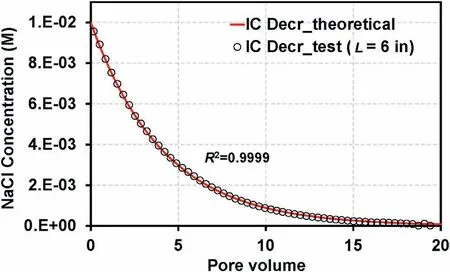
Fig.7.Theoretical and measured NaCl concentrations in the inlet of the column with a height of 6 in.
Fig.12b illustrates a comparison between the BTCs for the kaolinite contents of 10% and 3%, in the selected range of concentration from 0 g/L to 3 g/L.The higher breakthrough concentration and Mevalues(representing a fraction of filtrated clay particles)for the kaolinite content of 10%(Me=4.86%-21.74%)than those for 3%(Me= 1.02%-3.48%) indicate an increase in the susceptibility to suffusion as the kaolinite content increases.Furthermore,an earlier initiation of suffusion can be observed for the kaolinite content of 10% (11 PV) than for 3% (15 PV), indicating that the IC-induced suffusion for the non-swelling clay-sand mixture can be a function of the clay content.
The detachment of kaolinite or illite particles for the clay content of 3%, resulting from the decrease in IC, is induced when the attraction energy between the sand and clay particles becomes lower than the hydrodynamic forces applied to the attached clay particles(corresponding to a kaolinite content of 3%in Fig.13c).The detached clay particles are then filtrated out, unless they are subjected to reattachment, primarily owing to pore size restriction.However, as the 10% kaolinite content (Table 3) inhibits the formation of sand-sand contacts (a relative density of 70% was not achievable for the 10% kaolinite content (Table 3)), water flows between the clay particles (or clusters) as the hydraulic conductivity of the sand-clay mixture at a high clay content(>7%)should be governed by clay itself(Park and Santamarina,2017).Therefore,the detachment of clay particles corresponding to the 10% clay content occurs not only at the sand-clay interface but also at the clay-clay interface (the clay-clay interface is also subjected to hydrodynamic forces) (Fig.13).This indicates the formation of a preferential flow for the 10%kaolinite-sand mixture at a flow rate of 15 mL/min.Despite the high Mevalues for the kaolinite content of 10%, the increase in the relative hydraulic conductivity corresponding to the observed BTCs in Fig.12a is not significant, as illustrated in Fig.14.This is qualitatively consistent with the results reported by Marot et al.(2009) (suffusion does not always lead to an increase in hydraulic conductivity).Note that the initial hydraulic gradient for the 3% and 10% kaolinite mixtures were not insignificantly different for the constant flow rate (hydraulic gradient for 3%kaolinite mixture=0.45,hydraulic gradient for 10%kaolinite mixture= 0.41).
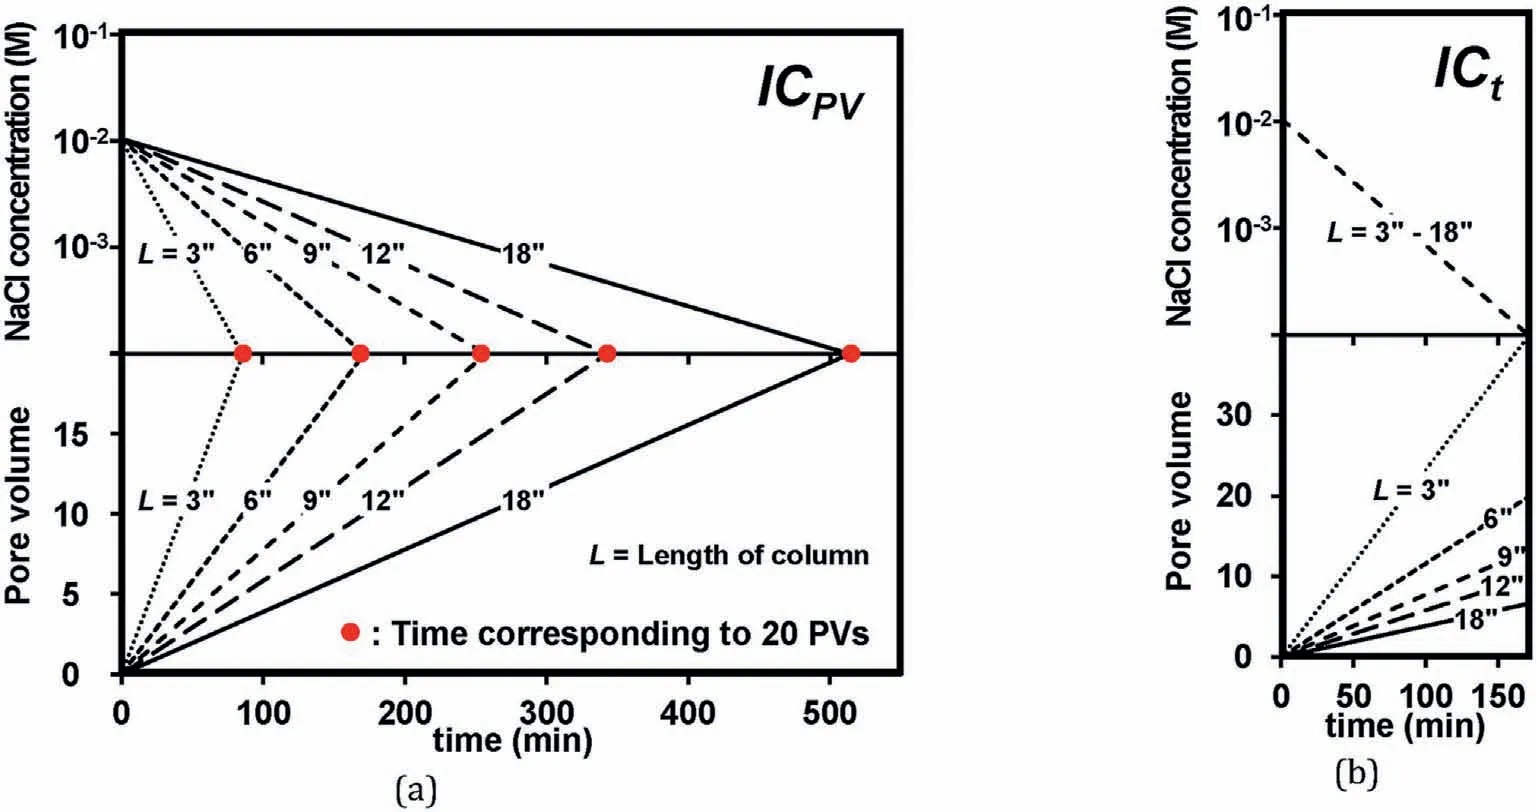
Fig.6.Two IC decrease scenarios in experiment:(a)IC=0.01 M at PV=0 and IC ~0 at PV=20(ICPV)and(b)IC=0.01 M at t=0(PV=0)and IC ~0 at t=162 min(ICt).Note that the termination time of 162 min in (b) corresponds to the 20 PVs of the 6-in column.
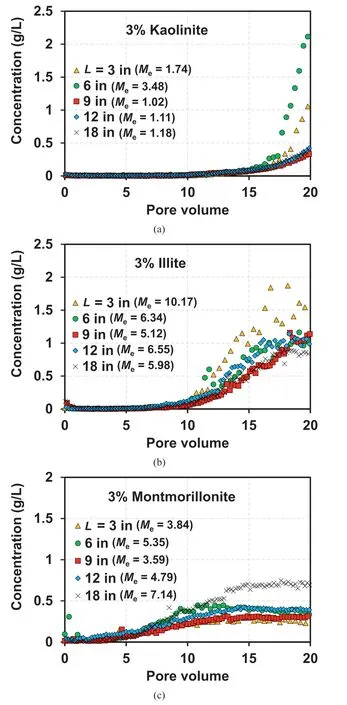
Fig.8.Observed BTCs for 3% clay-sand mixtures: (a) Kaolinite; (b) Illite; and (c)Montmorillonite.
Generally, a lower number of flow paths gradually leads to a larger cross-sectional area per preferential flow path at a given flow rate.In addition,the cross-sectional areas of preferential flow paths at a high clay content are likely larger than those of the flow paths passing through sand grains at a low clay content.Therefore, the detached clay particles(or clusters)at a high clay content exhibit a high probability of filtration through relatively large flow paths in the absence of significant reattachment; however, the detached clay particles may be subjected to reattachment at a low clay content owing to the relatively small flow paths.This leads to almost no reattachment effect at a kaolinite content of 10%(Fig.12a)and also results in a higher Mevalue with an increase in L.The contradictory trend followed by the observed BTCs between the kaolinite contents of 3% (Figs.8a) and 10% (Fig.12a) indicates the presence of a threshold kaolinite content between 3% and 10%at which the reattachment effect becomes insignificant.At a given flow rate,as the number of flow paths(or cross-sectional area of the flow path) can also vary depending on the flow rate, clay mineralogy, and shape of sand particles, further comprehensive experimental studies are required to evaluate the threshold clay content.
3.3.Suffusion of 3% illite-sand mixture under ICt
Fig.15a illustrates the observed BTCs for the 3% illite-sand mixture under the ICtcondition (Table 3).As presented in Fig.15a, a higher breakthrough concentration is observed with an increase in L.This is primarily owing to the greater mass of illite at the longer L(the column with L=18 in contains the mass of illite six times greater than the column with L = 3 in).However, when the cumulative filtrated mass of illite(Wcum)is normalized by the initial mass of illite in the column (Winitial), a larger Wcum/Winitialcan be observed with a decrease in L.This is consistent with the trend observed for the Mevalues, as presented in Fig.15a.
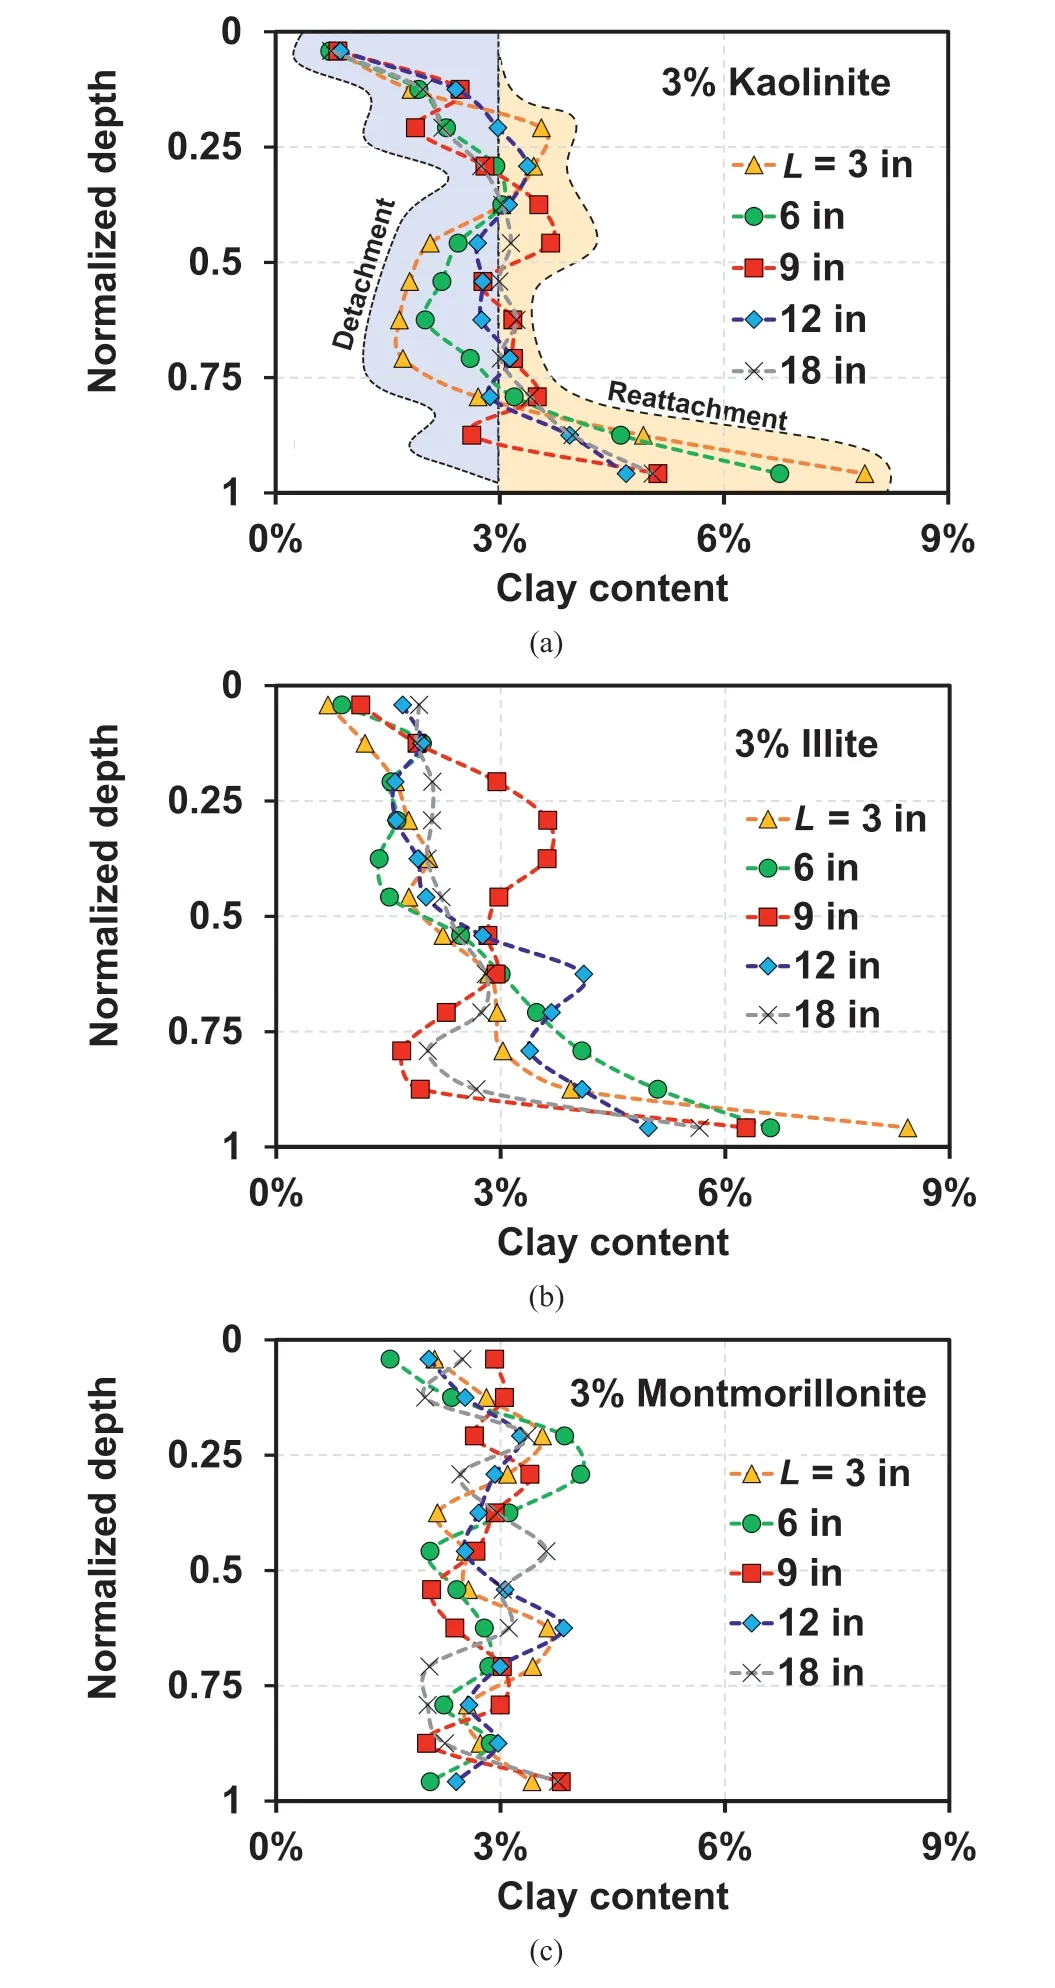
Fig.10.Observed retention profiles after injection for 3% clay-sand mixtures: (a)Kaolinite, (b) Illite, and (c) Montmorillonite.
Based on the DLVO theory,the reduction in the attraction energy between sand and clay is caused by a decrease in IC (Won, 2022).Therefore, the IC profile throughout the column can be a major factor in initiating suffusion.As illustrated in Fig.16, the ICs at the middle(Fig.16a)and bottom of the column(Fig.16b)indicate that longer columns demonstrate a delayed decrease in IC, which indicates less significant detachment with an increase in L,based on the DLVO theory.Additionally, a more substantial reattachment effect and less suffusion can be anticipated as L increases.However,although the slightly delayed initiation of suffusion can be observed as L increases(Fig.15a),the occurrence of more significant suffusion with an increase in L is more or less counterintuitive.Given that the reattachment is not significant at L=3 in,the initiation of suffusion occurs at ~70 min (corresponding to a PV of 17), indicating that detachment occurs at an IC ~0.002 M throughout the column.Therefore, the counterintuitive result presented in Fig.15a can be attributed to the similar initiation of detachment throughout the column at an IC ~0.002 M; this is because the difference in IC becomes insignificant after t ~70 min (Fig.16).Thus, the mass of illite (or volume of the sand-illite mixture) is a critical factor affecting suffusion for ICt.The highest Mevalue was observed for L=3 in;the lower values of Mewith increasing L(Fig.15b)indicate a significant reattachment effect at greater L values, which is consistent with the reattachment effect observed in the ICPVcondition(Fig.6a).However,a lower breakthrough concentration was observed at L=18 in for ICPV(Fig.8b)(the elapsed time of 162 min corresponds to 6.67 PVs for L = 18 in).
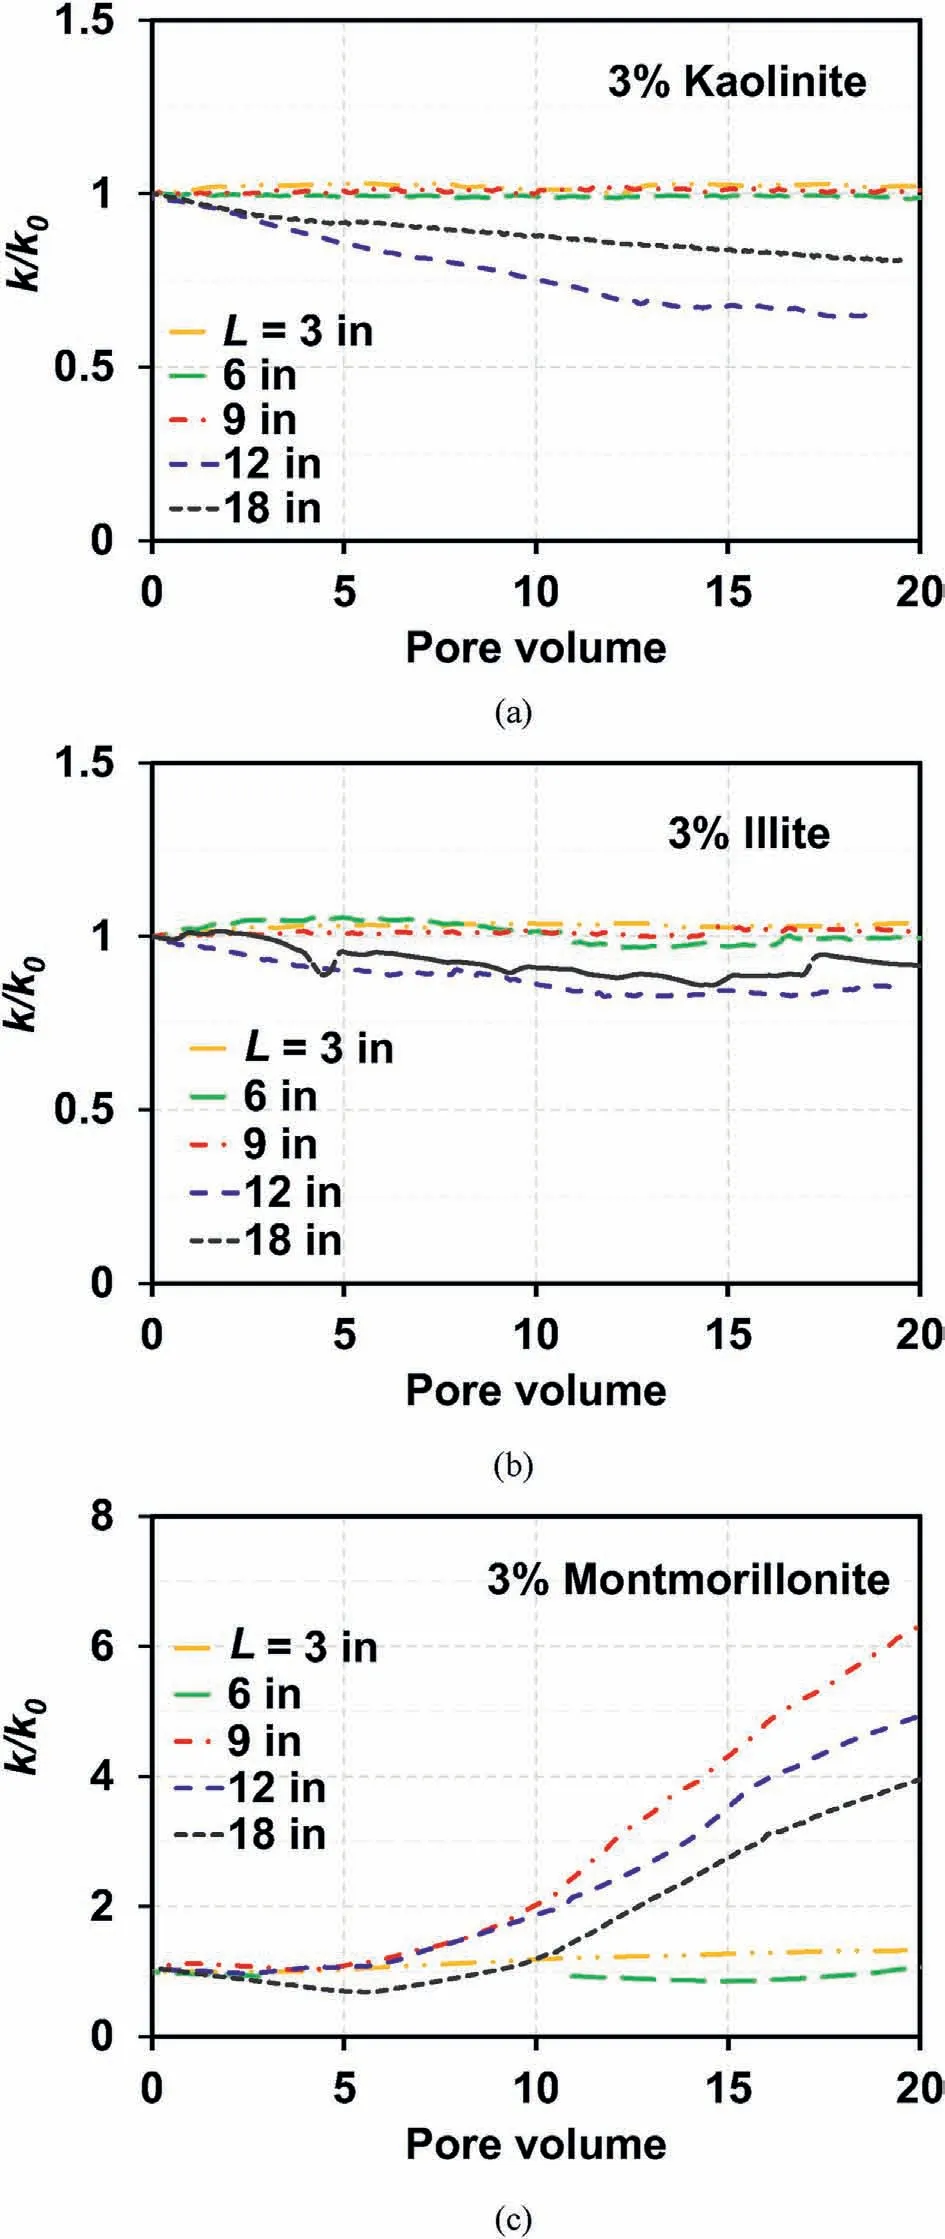
Fig.11.Relative hydraulic conductivity (k/k0) profiles for 3% clay-sand mixtures: (a)Kaolinite, (b) Illite, and (c) Montmorillonite.

Fig.12.(a) Observed BTCs for 10% kaolinite-sand mixture and (b) comparison of BTCs for kaolinite contents of 10% and 3% in concentration range from 0 to 3 g/L.
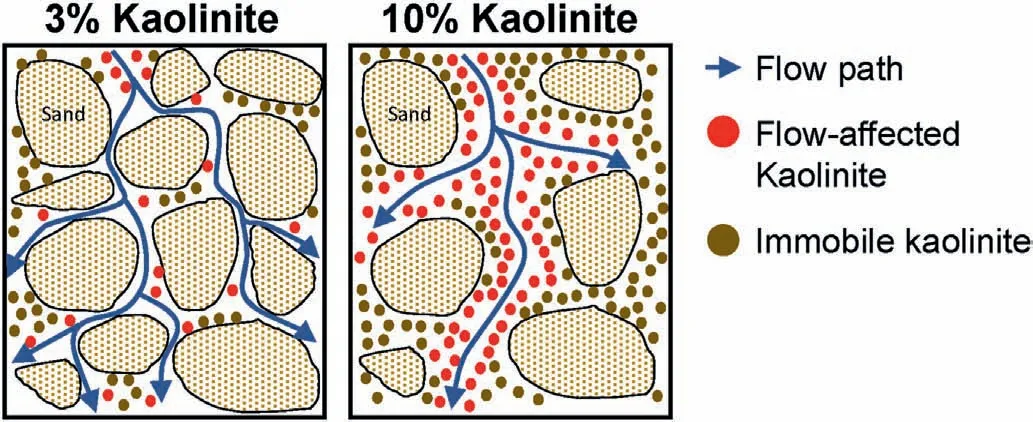
Fig.13.Schematic of kaolinite-sand mixture subjected to hydrodynamic forces at kaolinite contents of 3% and 10%.
4.Conclusions
This study investigated the impact of clay particle reattachment on the suffusion of sand-clay mixtures via soil-column experiments.Three types of clay samples were mixed with sand in columns with five different lengths(3 in,6 in,9 in,12 in,and 18 in)to investigate the reattachment effect of swelling and non-swelling clays.Based on the observed BTCs, relative hydraulic conductivity,retention profiles, and fraction of filtrated clay particles (Me), the following conclusions were drawn.
1) Higher breakthrough concentrations of kaolinite and illite were
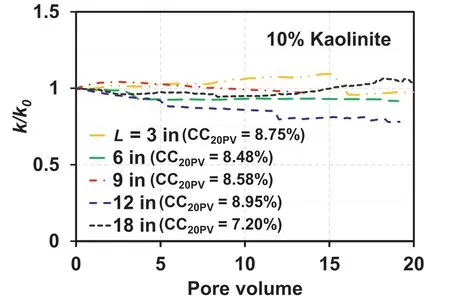
Fig.14.Relative hydraulic conductivity (k/k0) profiles of 10% kaolinite-sand mixture.
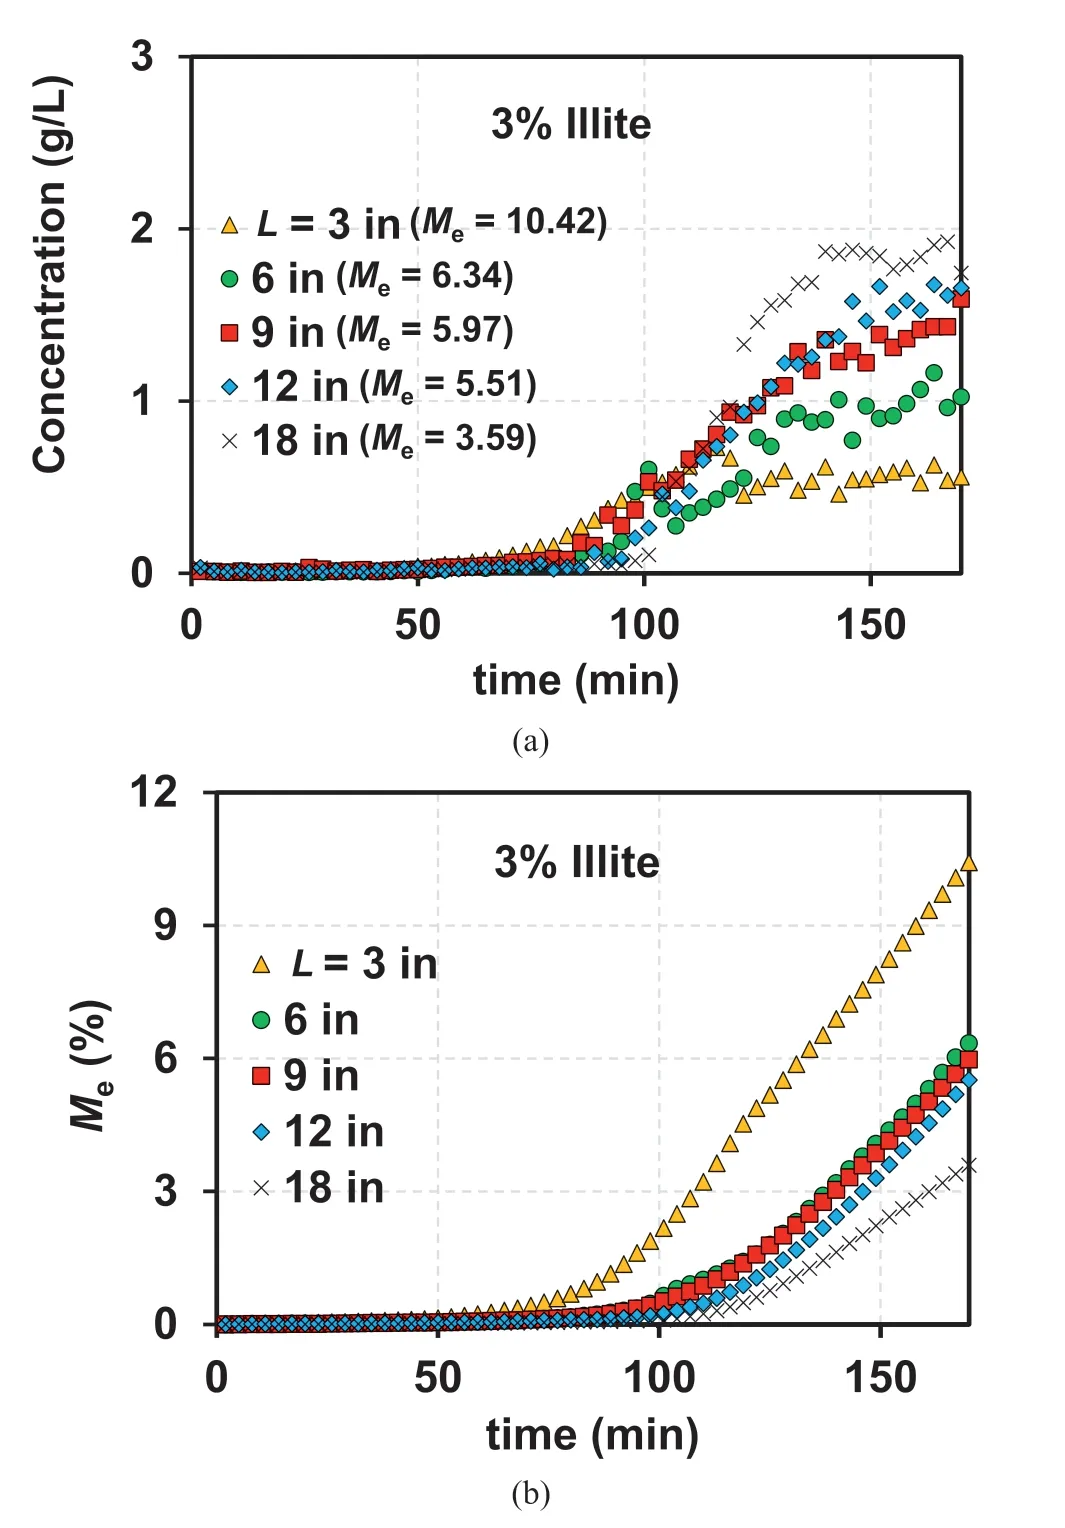
Fig.15.(a) Observed BTCs and (b) Cumulative Me values for 3% illite-sand mixture under ICt.
observed with a decrease in L, which indicated a more significant reattachment effect as the travel paths of the detached clay particles became longer.
2) A lower breakthrough concentration was observed with an increase in L for the sand-montmorillonite mixture(Me=7.14%for L = 18 in and Me= 3.84% for L = 3 in), which indicated the formation of a preferential flow, and the reattachment effect became less significant for the sand-montmorillonite mixture.
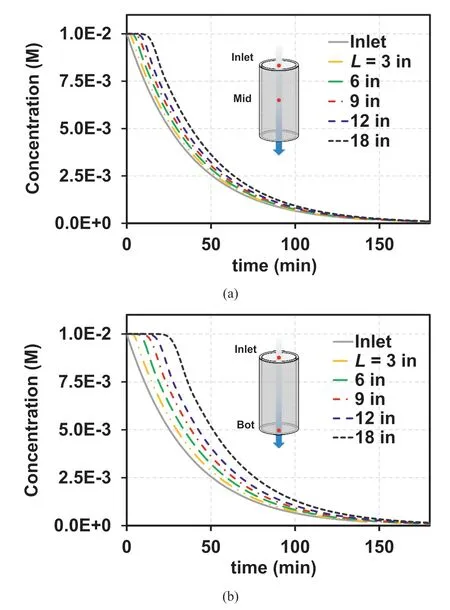
Fig.16.Calculated IC at (a) Middle and (b) Bottom of the column.
3) The critical salt concentrations of 2 × 10⁻⁴M and 1 ×10⁻³M were evaluated from the observed BTCs of kaolinite and illite(3%).The critical salt concentration combined with the reattachment effect can explain quantitatively the suffusion phenomenon of non-swelling clay-sand mixtures.
4) The observed values of Me(4.86%, 7.98%, 9.45%, 10.49%, and 21.74% at L = 3 in, 6 in, 9 in, 12 in, and 18 in) for a kaolinite content of 10%indicated the formation of a preferential flow in the 10% kaolinite-sand mixture.The contradictory trend from the observed BTCs between kaolinite contents of 3% and 10%indicated the presence of a threshold kaolinite content between 3% and 10% at which the reattachment effect became insignificant.
5) An increase in the breakthrough concentration with increasing L for the 3% illite-sand mixture under the ICtcondition indicated the presence of an IC value at which the detachment of clay particles was initiated.
Declaration of competing interest
The authors declare that they have no known competing financial interests or personal relationships that could have appeared to influence the work reported in this paper.
Acknowledgments
We would like to thank Editage(www.editage.co.kr)for English language editing.This work was supported by National Research Foundation of Korea (NRF) grants funded by the Korean government (MSIT) (Grant.Nos.2019R1A2C2086647 and 2022R1C1C1007296).
 Journal of Rock Mechanics and Geotechnical Engineering2023年10期
- Journal of Rock Mechanics and Geotechnical Engineering的其它文章
- Analytical solutions for the restraint effect of isolation piles against tunneling-induced vertical ground displacements
- Characterizing large-scale weak interlayer shear zones using conditional random field theory
- Displacement-based back analysis of mitigating the effects of displacement loss in underground engineering
- Investigation of long-wavelength elastic wave propagation through wet bentonite-filled rock joints
- Mechanical properties of a clay soil reinforced with rice husk under drained and undrained conditions
- Evaluation of soil fabric using elastic waves during load-unload
