Rapid metabolic fingerprinting with the aid of chemometric models to identify authenticity of natural medicines: Turmeric, Ocimum,and Withania somnifera study
Samrn Khan ,Ahishk Kumar Rai ,Anjali Sinh ,Sauan Sinh ,c ,Basant Kumar Duy ,Raj Kishori Lal ,Arvin Sinh Ni ,Nicholas Birs ,Praoh Kumar Trivi c,,Christophr T.Elliott ,Ratnaskhar Ch a,c,,,*
a Metabolomics Lab,Council of Scientific and Industrial Research(CSIR)-Central Institute of Medicinal and Aromatic Plants(CIMAP),Lucknow,226015,India
b Department of Crop Production & Protection,Council of Scientific and Industrial Research (CSIR)-Central Institute of Medicinal and Aromatic Plants(CIMAP),Lucknow,226015,India
c Academy of Council of Scientific and Industrial Research (ACSIR),Ghaziabad,201002,India
d Department of Biotechnology,Council of Scientific and Industrial Research (CSIR)-Central Institute of Medicinal and Aromatic Plants (CIMAP),Lucknow,226015,India
e Genetics and Plant Breeding Department,Council of Scientific and Industrial Research(CSIR)-Central Institute of Medicinal and Aromatic Plants(CIMAP),Lucknow,226015,India
f Department of Phytochemistry,Council of Scientific and Industrial Research(CSIR)-Central Institute of Medicinal and Aromatic Plants (CIMAP),Lucknow,226015,India
g School of Biological Sciences,Queen's University,Belfast,BT9 5DL,UK
Keywords:Rapid metabolic fingerprinting Natural medicines FT-NIR Chemometric models
ABSTRACT Herbal medicines are popular natural medicines that have been used for decades.The use of alternative medicines continues to expand rapidly across the world.The World Health Organization suggests that quality assessment of natural medicines is essential for any therapeutic or health care applications,as their therapeutic potential varies between different geographic origins,plant species,and varieties.Classification of herbal medicines based on a limited number of secondary metabolites is not an ideal approach.Their quality should be considered based on a complete metabolic profile,as their pharmacological activity is not due to a few specific secondary metabolites but rather a larger group of bioactive compounds.A holistic and integrative approach using rapid and nondestructive analytical strategies for the screening of herbal medicines is required for robust characterization.In this study,a rapid andeffective qualityassessment system for geographical traceability,species,and variety-specific authenticity of the widely used natural medicines turmeric,Ocimum,and Withania somnifera was investigated using Fourier transform near-infrared(FT-NIR)spectroscopy-based metabolic fingerprinting.Four different geographical origins of turmeric,five different Ocimum species,and three different varieties of roots and leaves of Withania somnifera were studied with the aid of machine learning approaches.Extremely good discrimination(R2>0.98,Q2>0.97,and accuracy=1.0)with sensitivity and specificity of 100%was achieved using this metabolic fingerprinting strategy.Our study demonstrated that FT-NIR-based rapid metabolic fingerprinting can be used as a robust analytical method to authenticate several important medicinal herbs.
1.Introduction
Natural medicines obtained from medicinal plants,including traditional Chinese medicines and Indian Ayurvedic medicines,have been widely employed as therapeutic agents [1].The use of herbal medicines continues to grow globally as their role in improving and curing various adverse health conditions becomes better understood [2,3].Natural medicines have played a critical role in clinical therapies for thousands of years.The global herbal medicine market is dominated by Asia (81%),followed by Africa(12%),while Europe accounts for less than 3% [4].It is estimated that more than 40% of the global population uses herbal medicines,and over a quarter of all modern medicines are directly or indirectly derived from medicinal plants [5,6].During the last decade,herbal medicines have drawn the attention of the population of Western countries because of their high pharmacological activities and low toxicity [7].The World Health Organization(WHO) places great emphasis on several critical issues regarding herbal medicines.These include inadequate regulatory measures,poor quality control,and uncontrolled distribution channels of natural medicines [8].Inadequate/poor-quality herbal medicines may cause adverse effects [8].The quality of natural medicines is highly dependent on their bioactive constituents,including secondary metabolites.These compounds are metabolic products derived from various primary and secondary biological pathways.These secondary metabolites are mainly responsible for the various health care and therapeutic functions of natural medicines.However,the secondary metabolite profile is highly dependent on the geographical origin,genotype,and chemotype,including the species and variety of natural medicine [9].Furthermore,some herbal medicines are derived from different species and,as a result,have very different therapeutic performances due to different bioactive constituents.However,they may have very similar morphological characteristics and could be prone to misclassification [9].
The globalization of herbal medicines starting from production to consumption involves complex supply chains that need to be managed and ideally fully traceable.The WHO,European Medicines Agency,and United States Food and Drug Administration have updated their regulations,which require that authentication of particular herbal medicines is one of the first assays that should be conducted,specifically to ensure that they are of the correct species and that batches are free from adulteration [8].The identification of the geographical origin,the type of species,and varieties of herbal medicines is highly challenging,as there are many bioactive constituents present,and precise measurements are required to fully assess their quality.The quality and efficacy can be markedly different for species that have different varieties even when grown under identical geographical and climatic conditions [9].
The pharmaceutical industry has initiated the use of highthroughput untargeted methods for the quality assessment of medicinal products during the last decade [10].This includes the use of untargeted metabolomics-based methods to identify geographical origin,species,and variety-specific variations[11,12].Although these methods have significant advantages for the identification of marker compounds,these techniques are timeconsuming,and complex sample preparation steps are needed,including extraction,purification of samples,and in some instances,the derivatization/modification of metabolites [13].Furthermore,the analytical platforms,gas chromatography-mass spectrometry (GC-MS) and liquid chromatography (LC)-MS analysis,are expensive and require highly skilled operators for sample preparation,instrument use,and subsequent data analysis.The cost and requirement of skilled personnel for these MS-based platforms created the need for alternative techniques that are rapid,nondestructive,and capable of using small sample volumes and requiring minimal preparation are highly desirable.
Fourier transform near-infrared (FT-NIR) spectroscopy is a simple,rapid,accurate,easy-to-operate,and nondestructive technique that requires minimal sample preparation prior to analysis.Moreover,the key advantage of FT-NIR spectroscopy combined with chemometrics is that once a reliable database and suitable analytical protocol are established,samples can be screened within a few minutes [3,14].FT-NIR provides complex structural information correlated to the variation in combinations of bonds within secondary metabolites.This technique is widely used in pharmaceutical,biomedical,and clinical applications[15].Recently,FT-NIR metabolic fingerprinting has been used to identify the geographic origin of herbal medicines [3,16].However,the application of this strategy for the most widely used traditional herbal medicines needs to be further explored.
Globally,turmeric,Ocimum,andWithania somniferaare widely used natural medicines.The rhizome of turmeric is used as a traditional medicine in Ayurveda and in Eastern Asian medical systems such as traditional Chinese medicine [17].It is one of the most popular natural medicines and grows primarily in India(85%),but it can also be found in China(8%),Myanmar(4%),and Bangladesh(3%).Recently,this medicinal herb has drawn significant attention due to its wide-ranging health benefits,including anti-inflammatory and antioxidant properties.Turmeric is traditionally used to treat skin disorders,upper respiratory tract infections,joint pain,and diseases of the digestive system [18].It is recorded in both the Indian and Chinese Pharmacopoeias and was the second top-selling herbal supplement in the United States in 2020,with sales totaling more than$92 million.India is the leading cultivator and exporter (more than 85%) of turmeric worldwide,with more than $226 million recorded in sales in 2021[19].Geographic indication(GI)is a major consideration for the overall quality of this natural medicine [3,16].Four geographical origins (Lakadong turmeric from Meghalaya,Alleppey turmeric from Kerala,Sangli turmeric from Maharashtra,and Erode turmeric from Tamil Nadu) are considered premium turmeric sources and are regarded as being of exceptionally high quality.A rapid and effective technique for the identification of the GI of this herb has yet to be demonstrated.
Ocimumis one of the most widely used medicinal herbs,especially in Asia and Africa,to treat diarrhea,kidney diseases,coughs,and many other ailments [20,21].It is known as the “Queen of herbs”;moreover,theOcimum basilicum(sweet basil) plant is a perennial crop extensively cultivated in various regions of the world to meet market demand [22].There are various species ofOcimumavailable,such asOcimum kilimandscharicum,Ocimum basilicum,Ocimum africanum,Hybrid tulsi,andOcimum sanctum;however,the secondary metabolite profile and therapeutic efficacy vary from species to species.
Withania somnifera(Ashwagandha,Solanaceae family),also known as poison gooseberry or winter cherry,is a herb that has been widely used across the world.It has a relatively high content of bioactive compounds such as carotenoids,phytosterols,withanolides,and polyphenols [23].Leaf and root powders from this plant are used as immunomodulators that significantly increase CD4+and CD8+counts.They also alter the blood profile,specifically,platelet counts and white blood cell counts [24].TheWithaniaspecies is also well known for its neuroprotective properties and is used to improve sleep and brain health [23,24].The global population has shown increased stress levels in recent years,further driving the demand for medicinal herbs that can improve immune health and sleep cycles.Withania somnifera,during 2020,achieved significant sales growth,with sales over $31.7 million,which makes this 12th top-selling herb[25].The United States and European markets have also shown significant growth in recent years.In 2020,the global sales ofWithania somniferawere more than $198 million,and the demand for this medicinal herb is forecast to increase each year by over 26%.The roots of this plant are widely used,followed by the leaves,as the active secondary metabolite content varies depending on the source being used.
Identification of GI,species-and variety-specific variation,and adulteration of medicinal herbs is of great importance in terms of ensuring the integrity of products,avoiding any forms of adulteration or mislabeling and protecting their commercial value.Because of an increasing demand from the global market for the screening of therapeutic drugs from natural products,there is high demand and interest in efficient and robust analytical strategies for plant-based medicinal herbs in the pharmaceutical industry.The therapeutic potential is highly dependent on the GI,type of species,and variety.Therefore,it is important to have a suitable analytical method with rapid and high-throughput analysis and on-site capability that requires little or no sample preparation.The main aim of the present study was to develop and validate testing methods to authenticate widely used natural medicines in terms of their GI,species,and variety using rapid metabolic fingerprinting models.Although herbal medicines derived from turmeric,Ocimum,andWithania somniferaplay significant roles in health and therapeutic applications,no such approaches have yet been reported.
An untargeted and rapid FT-NIR-based metabolic fingerprinting approach was used to investigate the GI phenotype,species,and variety of turmeric,Ocimum,andWithania somniferasamples.FTNIR combined with multivariate models,partial least square discriminant analysis (PLS-DA),and random forest (RF) classification were used to identify the phenotype.Furthermore,one-class models,data-driven soft independent modelling of class analogy(DD-SIMCA),and K-nearest neighbors(KNN),were used to classify the samples based on GI,species-and variety-specific variation.Moreover,the methods were further tested against adulterated samples from the market.
2.Materials and methods
2.1.Chemicals and reagents
All standards and reagents were procured from Sigma-Aldrich(St.Louis,MO,USA) unless otherwise stated.Ethyl acetate and methanol were procured from Sigma-Aldrich.Acetic acid,ethanol,acetonitrile and ammonium dihydrogen phosphate were procured from Merck(Rahway,NJ,USA).Ultrapure water was prepared by a Milli-Q®IQ 7000 water purification system from Millipore (Billerica,MA,USA).
2.2.Sample preparation
The leaves of five differentOcimumspecies,namely,Ocimum basilicum,Ocimum africanum,Ocimum kilimandscharicum,Ocimum sanctumand Hybrid tulsi,were collected from the research field of Council of Scientific and Industrial Research(CSIR)-Central Institute of Medicinal and Aromatic Plants (CIMAP) in October 2021.CSIRCIMAP has a history of cultivating medicinal plants for more than 50 years.Ocimumplants with similar growth without diseases were randomly selected.The driedOcimumleaves were ground to powder,passed through mesh,and stored in glass containers in dark and dry conditions prior to analysis.The leaves and roots of three different sample classes ofWithania somnifera,including NMITLI-101 (WS 101),NMITLI-118 (WS 118),and PHPL were collected from the research field of CSIR-CIMAP in May 2022.WS 101 and WS 118 seeds were obtained from CSIR-CIMAP while PHPL seeds were provided from Pharmanza Herbal Pvt.Ltd.,Gujarat,India (acquired from Madhya Pradesh,India).Root,leaf,and stem samples were dried and ground to powder.Turmeric samples from four different geographical origins,namely,Lakadong turmeric from Meghalaya,Sangli turmeric from Maharashtra,Erode turmeric from Tamil Nadu,and Alleppey turmeric from Kerala,were obtained from farmers.The collected samples were shed dried and ground to powder and then passed through a mesh.All medicinal herbs were identified by expert botanists.The individual provinces,species,and varieties of samples are presented in Table S1.
2.3.High performance liquid chromatography (HPLC) analysis
2.3.1.Analysis of turmeric samples
Quantitative analysis of methanolic extracts of turmeric samples was performed by a Shimadzu Prominence-i (LC-2030C 3D Plus)HPLC system (Kyoto,Japan).Separation was achieved using a Purospher®STAR RP-18 end-capped (5 μm) LiChroCART®250-4.6 column (Merck) subjected to isocratic elution.The two solvents used for the analysis consisted of water containing 0.1%(V/V)acetic acid in water (solvent A) and acetonitrile (solvent B).Isocratic programming of the solvent system was at 50% B for 0-15 min,with a flow rate of 1.2 mL/min.Five microliters of sample was injected,and the column temperature was maintained at 35°C.Wavelengths were set at 420 nm for curcumin,demethoxycurcumin,and bisdemethoxycurcumin.Pooled samples were run to serve as quality control (QC).The compounds were quantified using standards with the aid of Labsolutions version 6.89 software.
2.3.2.Analysis of Withania somnifera samples
Quantitative analysis of the ethanolic extract ofWithaniasamples was carried out using a Nexera-XR HPLC system (Shimadzu)equipped with a quaternary pump (Nexera XR LC-20AD XR),a diode arrays detector(SPD-M20 A),an autosampler(Nexera XR SIL-20 AC XR),a degassing unit (DGU-20A 5R),and a column oven(CTO-10 AS VP).A Phenomenex reversed-phase Luna 100 Å C18column(250 mm×4.6 mm,5 μm)(Torrance,CA,USA)was used to analyze the samples.The two solvents used for the analysis were water-containing phosphate buffer (solvent A) and acetonitrile(solvent B).Samples were separated by gradient elution.The gradient programming of the solvent system was initially at 5% B for 0-18 min,5%-45% B for 18-25 min,45%-80% B for 25-28 min,80%-45% B for 28-35 min,45%-5% B for 35-40 min,and 5% B for 40-45 min,with a flow rate of 1.5 mL/min.The total run time was 45 min,with 10 μL of sample injected and the column temperature kept at 35°C.Wavelengths were set at 227 nm for withanoside IV,withanoside V,withaferin A,12-deoxy-withastramonolide,withanone,withanolide A,and withanolide B.Pooled samples were run to serve as QC.The compounds were quantified using Labsolutions version 6.89 software.
2.4.GC-MS analysis of Ocimum samples
Ethyl acetate extracts ofOcimumsamples were analyzed using a PerkinElmer GC Clarus 680 (Waltham,MA,USA) equipped with a mass spectrometer(PerkinElmer SQ8C).Full scan mass spectra were acquired in the mass range of 40-500 Da at a 0.8 scan/s rate with an initial solvent delay of 3 min.The injector,ion source,and transfer line temperatures were set at 290,220,and 220°C,respectively.The initial oven temperature was kept at 60-240°C at a rate of 3°C per min.Helium was used as a carrier gas at a flow rate of 1.0 mL/min.One microliter of sample was injected into the DB-5 MS capillary column (Agilent Technologies,Santa Carla,CA,USA)(30 m×0.25 mm i.d.0.25 μm film thickness) consisting of a stationary phase of 5%(V/V)phenyl and 95%(V/V)methyl polysiloxane in the split-less mode.Detection was achieved using a mass spectrometer in electron ionization mode at 70 eV.After every 10 samples,a blank and pooled sample was run to serve as QC to estimate run time variables.
2.5.FT-NIR spectroscopy analysis
FT-NIR spectra were recorded using the spectrometer ANTARIS II FT-NIR Analyzer(Thermo Fisher Scientific Inc.,Waltham,MA,USA)equipped with an interferometer and an integrated sphere.Approximately 1 g of weighed powdered samples was placed in glass vials for spectral recording.Spectra were recorded in the range of 10,000-4,000 cm-1,with each spectrum being an average of 64 scans.The raw dataset was measured with a spectral resolution of 4 cm-1resulting in 1557 variables.The FT-NIR reflectance spectra were expressed as log(1/R),whereRis the reflectance.The time of analysis was approximately 60 s.The spectra of the samples were randomly generated to remove any systematic variation in the model.All spectral measurements were carried out at room temperature(26±1°C).
2.6.Data processing and multivariate analysis
2.6.1.Data processing and PLS-DA models
The resulting spectral files were converted into comma-separated values(CSV)files.The data matrix containing wavenumbers,samples,and absorbances was further used for statistical analysis.Quantile normalization was performed in the data matrix.Pareto scaling(mean centered and then divided by the square root of the standard deviation of the variable)was performed to make features more comparable in magnitude with each other.These standardized FT-NIR data were used to perform principal component analysis(PCA)to identify patterns.Multivariate statistical analysis was performed using R software(version 4.2.0).The differences among various groups can be visualized by projecting the objects of the dataset into the space of the first few principal components (PCs).
Furthermore,supervised PLS-DA was performed to discriminate the samples.The developed PLS-DA model was validated using a ten-fold cross validation method,and its quality was assessed onR2,Q2,and accuracy scores [26].Furthermore,this model was validated using 1000 permutation tests [27].
Both training(60%-70% of data)and validation sets(30%-40%)were used.The performance classification models were evaluated using calculated merit figures with the values in contingency tables,such as the number of samples wrongly classified as true(FP),number of samples correctly classified as true (VP),number of samples correctly classified as false (VN),number of samples wrongly classified as FP,and number of samples wrongly classified as false (FN).Furthermore,sensitivity (SEN) and specificity (SPE),representing the measure of correct classification of samples,were also calculated.The false-positive (TFP) and false-negative (TFN)rates are incorrectly classified samples.
For variable selection,variable importance in projection (VIP)values were considered provided that the lowest root mean square error for cross validation (RMSECV) was selected.
2.6.2.RF classification models
Other supervised RF models were performed to classify different groups based on geographical indication,species,and varieties of herbs and spices.This model works based on bagging and random feature selection.This model builds numerous decision trees and combines them to obtain a more accurate prediction.It is worth mentioning that decision trees differ from RF models,as decision trees can be vulnerable to overfitting;however,RF models can overcome this by creating random subsets of the features and building smaller trees using those subsets,with the subsets then merged for classification.The RF algorithm performs cross-validation in parallel with the training step by using out-of-bag samples.On average,each tree grows with approximately 2/3 of the training data and leaves approximately 1/3 of the test data.
2.7.Development of one-class classification models
2.7.1.DD-SIMCA classification
DD-SIMCA models [28] for turmeric,Ocimum,andWithania somniferawere performed using MATLAB R2021a,DD-SIMCA tool box [29].This one-class classifier method distinguishes objects of one particular target class from all other objects and classes.
The SIMCA model is developed using the PCA decomposition of matrix X:
whereT={tia} is the (I×A) score matrix,Pis the (J×A) loading matrix,Eis the(I×J)residual matrix,andAis the number of PC.The PCA results are used to calculate two relevant statistics: the orthogonal distance (OD) and the score distance (SD).OD is the squared Euclidian distance between a sample and the score subspace.It is calculated in the original X-space as the sum
The purchase of the card each week is not done out of habit. It is my romantic mission each week to find the right card. At times, my search takes me to many different card stores to find that perfect offering. I have been known to spend a considerable amount of time in front of the card displays, reading up to a dozen different cards before I choose the right one. The picture and the words in the card must have specific meaning to me and must remind me in some way of Patricia and our life together. The card needs to evoke6 an emotion in me. I know that if a card brings a tear of happiness to my eyes, I have found the right one.
of the squared residual presented in the matrixEdefined in Eq.(5).SD is the squared Mahalanobis distance calculated by the formula
wheretiais an element of matrixTdefined in Eq.(5),andis the eigenvalue.
The scaled chi-squared distribution and the full distance can be calculated as
wherecis statistical total distance;h0andq0are the scaling factors;andNhandNqare the numbers of degrees of freedom.These parameters are considered unknown and are estimated using the training dataset.
SIMCA establishes the decision rule that determines whether a sample belongs to the target class.This is determined by employing a cutoff value
which delineates an acceptance area in the space of statisticshandq.
2.7.2.KNN classification
KNN is a nonparametric and supervised learning algorithm used to classify test data based on a distance metric.Euclidean distance with a desired range of values for the neighborhood parameterk(k=1,2,3,etc.)is used for classification of samples[30].KNN was performed using R version 4.2.0.
3.Results and discussion
3.1.Geographic classification of turmeric samples based on FT-NIR metabolic fingerprinting
Overall,194 samples,including 46 samples of Lakadong turmeric,50 samples of Erode turmeric,49 samples of Sangli turmeric and 49 samples of Alleppey turmeric,were analyzed using FT-NIR spectroscopy.The spectral profile was obtained in the range of 10,000-4,000 cm-1for all turmeric samples,as shown in Fig.S1,and the corresponding average spectral profiles are shown in Fig.1A.The absorption intensities (Figs.1A and S1)were obtained in the range of 8,526-8,083 cm-1with maxima at 8,350 corresponding to 2nd overtone of CH,CH2,and CH3functional groups;6,980-6,210 cm-1with maxima at 6,850 cm-1corresponding to 2nd overtone of CH,and OH functional groups;5,943-5,563 cm-1with maxima at 5,730 cm-1corresponding to 1st overtone of CH2,and CH functional groups;5,236-5,106 cm-1with maxima at 5,173 cm-1;and 4,840-4,636 cm-1with maxima at 4,730 cm-1corresponding to 1st overtone of OH functional group.
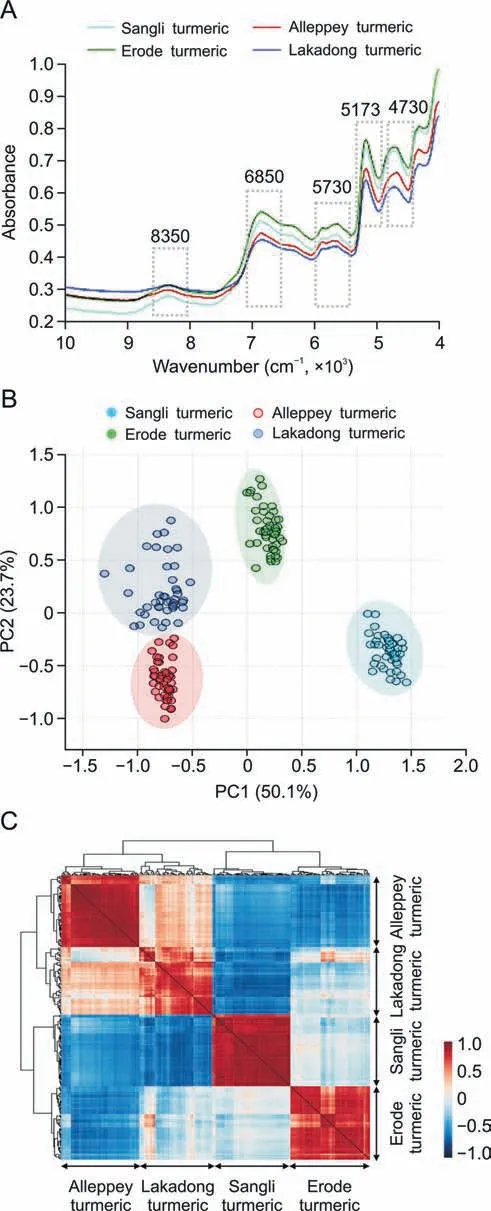
Fig.1. Metabolic fingerprinting of turmeric from four different geographical indications (GI).(A) Fourier transform near-infrared spectroscopy (FT-NIR) average spectra of turmeric samples.The fingerprint wave numbers are indicated with boxes.(B) Principal component analysis (PCA) scores plot for the 1st component (50.1%) vs.2nd component (23.7%),explaining the clustering of four different turmeric samples,Lakadong turmeric,Alleppey turmeric,Erode turmeric,and Sangli turmeric samples.(C) Pearson correlation of samples from Alleppey turmeric,Lakadong turmeric,Sangli turmeric,and Erode turmeric.PC: principal component.
The variation in intensities of absorption bands can be seen.Initially,a preliminary extrapolatory analysis of the data using PCA was applied.The unsupervised PCA model obtained from the FTNIR spectra of all samples revealed the general structure of the complete dataset,in which the first two PCs cumulatively accounted for 73.8% of the total variation,with PC1 accounting for 50.1% of the variance,discriminating Lakadong and Alleppey turmeric from Erode and Sangli turmeric samples (Fig.1B).PC2 was responsible for 23.7% of the variance in discriminating the Erode and Lakadong turmeric samples from the Sangli and Alleppey turmeric samples(Fig.1B).The cumulative and individual explained variances of PCs are presented in Fig.S2.To correlate turmeric samples,Pearson correlation was performed between sample groups.Fig.1C shows that each sample group from a specific GI has a strong positive correlation with the corresponding sample groups based on geographical origin.The key metabolites of turmeric,such as curcumin,demethoxycurcumin,and bisdemethoxycurcumin,were measured using HPLC(Fig.2).These metabolites are considered to be good quality markers for turmeric samples,as these compounds have effective pharmacological activity [31].HPLC data revealed that Lakadong turmeric has a high content of curcumin (>12.5%),demethoxycurcumin(>3.6%),and bisdemethoxycurcumin(1.3%)in comparison to the other three GI groups of samples.The Sangli turmeric contents of curcumin (5.0%),demethoxycurcumin (1.8%),and bisdemethoxycurcumin (0.7%),and the Alleppey turmeric contents of curcumin (4.7%),demethoxycurcumin (2.0%),and bisdemethoxycurcumin (0.7%) were higher than the Erode turmeric contents of curcumin (4.0%),demethoxycurcumin (1.1%),and bisdemethoxycurcumin (0.5%).
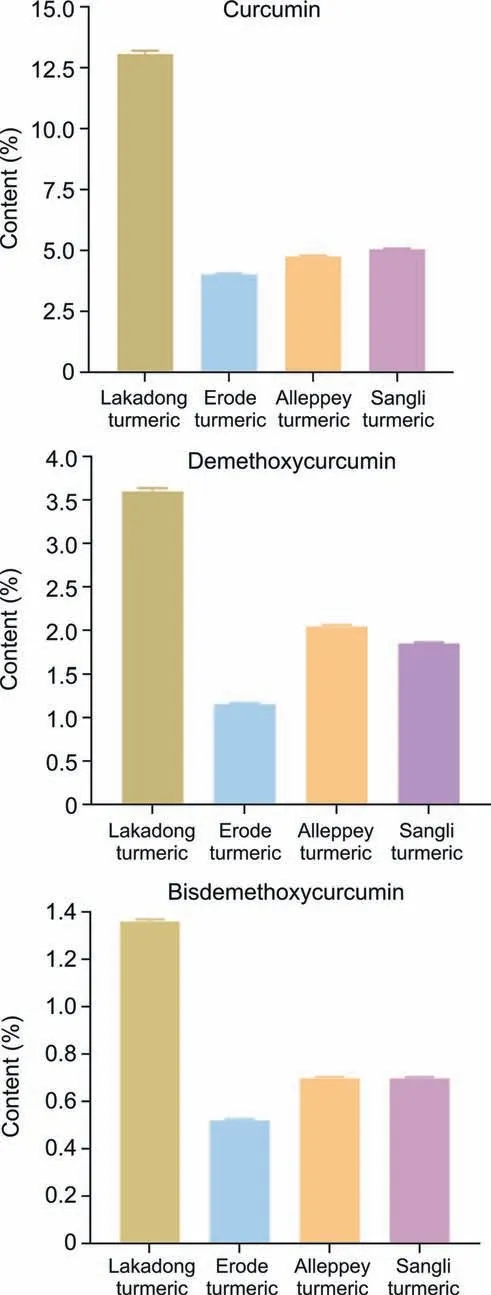
Fig.2. Quantification of marker metabolites in Lakadong turmeric,Alleppey turmeric,Erode turmeric,and Sangli turmeric samples.
A supervised PLS-DA model was then constructed to find a small number of linear combinations of the original variables,which was predicted for the class membership and that described most of the variability of the FT-NIR metabolic profile of Lakadong,Alleppey,Sangli,and Erode turmeric samples (Fig.S3A).Fig.S3A shows that four distinct clusters were identified in the PLS-DA score plot.Two components cumulatively accounted for 48.3% of the total variation,with the first component explaining 34.9% of the variation between the Lakadong,Alleppey turmeric from Erode,and Sangli turmeric samples.The second component explains 13.4% of the variation between Erode,Lakadong turmeric from the Sangli,Alleppey turmeric samples.Ten-fold crossvalidation was performed to find the predictive accuracy and fit of the polynomial model(Fig.S3B).The cumulative values of PLSDA withR2=0.99303,Q2=99,147,and accuracy=1.0 show a good fit of the model.To assess the statistical significance of these potentially highly predictive multivariate models,permutation testing was conducted,and the supervised models were validated with 1000 permutation tests(Fig.S3C).From the analysis of these distributions,the significance of the power of the optimal models to predict the profiles of sample groups was determined to beP<0.001.Supervised PLS-DA was used to validate individual models with 60%-70% of samples considered as the training set and the remaining 30%-40% of samples considered as the validation set.The calculated values for the PLS-DA model using FTNIR data are presented in Table 1,with 100% sensitivity,specificity,accuracy and reliability for the training set.One hundred percent sensitivity,specificity,accuracy,and reliability were obtained for the test set of samples from the Alleppey,Erode,and Sangli turmeric GI types.In the case of the Lakadong samples,more than 98% sensitivity,specificity,accuracy,and reliability were obtained.Fig.3 illustrates the predictions of turmeric samples employing the PLS-DA model.

Table 1 Calculated values for the merit figures for the partial least square discriminant analysis (PLS-DA) model using the Fourier transform near-infrared(FT-NIR) data for the four different turmeric geographical origins samples.
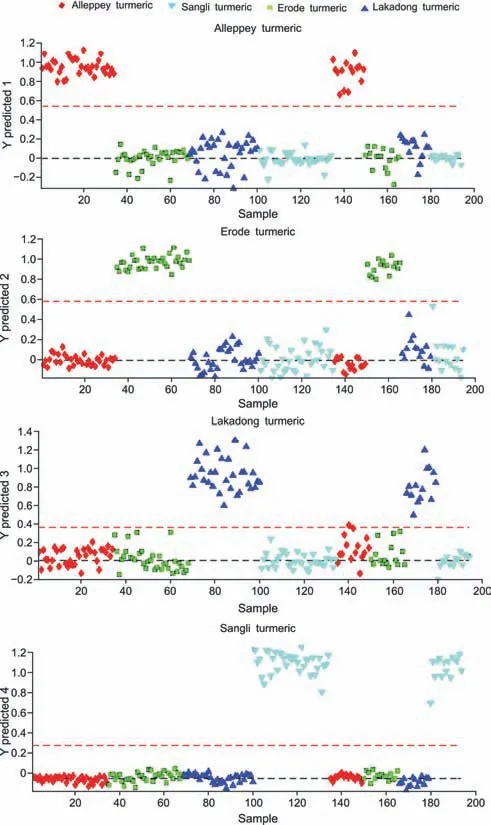
Fig.3. Partial least square discriminant analysis (PLS-DA) prediction of four different geographical indication (GI) turmeric samples.
Furthermore,a one-class model,DD-SIMCA,was used for classification.We used this model to identify the GI of turmeric samples.This method consists of two steps,including decomposition of the training data matrix by PCA and classification of a new sample set with the derived PCs.These components are represented by the acceptance area in the OD and SD with the α value.This α value specifies a type 1 error,i.e.,false-negative decisions.External validation of these models involved using 60%-70% of the target class samples from each geographic origin,including Erode turmeric (Fig.4A),Sangli turmeric(Fig.4B),Alleppey turmeric (Fig.4C),and Lakadong turmeric(Fig.4D) samples in the training set and the remaining samples in the test set.The models of the acceptance plots for training and test sets are shown in Fig.4.One hundred percent sensitivity and specificity were obtained for all four sample groups.The summary of DD-SIMCA performance is presented in Table S2.Furthermore,DD-SIMCA models were built by considering the turmeric samples from each GI as a training set and tested with the new set of samples from all other geographic origins.The corresponding models of acceptance plots for the training and validation sets are shown in Fig.S4.One extreme sample was found in the Erode,Sangli and Alleppey turmeric samples,which resulted in 98% sensitivity with 100% specificity.The summary of DD-SIMCA performance is presented in Table S3.

Fig.4. Data driven-soft independent modelling of class analogy(DD-SIMCA)classification of geographic indication(GI)of turmeric samples:(A)Erode turmeric samples,(B)Sangli turmeric samples,(C) Alleppey turmeric samples,and (D) Lakadong turmeric samples.The acceptance plot for training set provides a graphical representation of the acceptance area,the area inside the blue curve with the threshold for α=0.01 and the red line is the outlier cut-off with threshold γ=0.01.Authentic samples falling outside the blue curve were considered as extremes represented with orange box.No extreme samples were found in all cases.v:orthogonal distance of individual samples;v0:mean orthogonal distance of training samples; h: score distance of individual samples; h0: score distance of training samples.
RF models were built to classify turmeric samples based on GI.A total of 500 decision trees were used to classify samples.None of the samples from each group was misclassified,and the out-ofbag error was 0 (Fig.S5 and Table S4).Another supervised model,KNN,was used for classification.Initially,the complete model(built with 1557 variables obtained by FT-NIR analysis)did not perform well.Classification using the top 18 variables (representing less than 2% of the number of variables) had better results for all samples belonging to a GI group.In this case,we considered all 194 samples for analysis.Sixty-four out of 194 samples were randomly selected for model validation.The remaining 130 samples were considered as the training set.FactorK=13 was used for classification.The model classified all samples correctly with 100% sensitivity and specificity.There were no cases of false-positives or false-negatives observed.The corresponding results are presented in Table S5.
3.2.Rapid fingerprinting identifies species-specific variation in the Ocimum herb
Overall,172 samples from five differentOcimumspecies,namely,Ocimum basilicum(35 samples),Ocimum kilimandscharicum(34 samples),Ocimum africanum(34 samples),Ocimum sanctum(34 samples),and Hybrid tulsi (35 samples),were analyzed using FTNIR in the spectral range of 10,000-4,000 cm-1.The representative images of fiveOcimumspecies are presented in Fig.5A.The spectral profile for all samples is presented in Fig.S6,and the corresponding average spectral profiles are shown in Fig.5B.The absorption intensities were obtained in the range of 8,782-8,110 cm-1with maxima at 8,363 cm-1corresponding to 2nd overtone of CH,CH2,and CH3functional groups;the range of 7,054-6,580 cm-1with maxima at 6,841 cm-1corresponding to 2nd overtone of OH,and CH functional groups;the range of 5,922-5,610 cm-1with maxima at 5,813 cm-1corresponding to 1st overtone of CH,CH2,and CH3functional groups;and the range of 4,880-4,580 cm-1with maxima at 4,598 cm-1corresponding to the combination of vibrations for OH functional group.
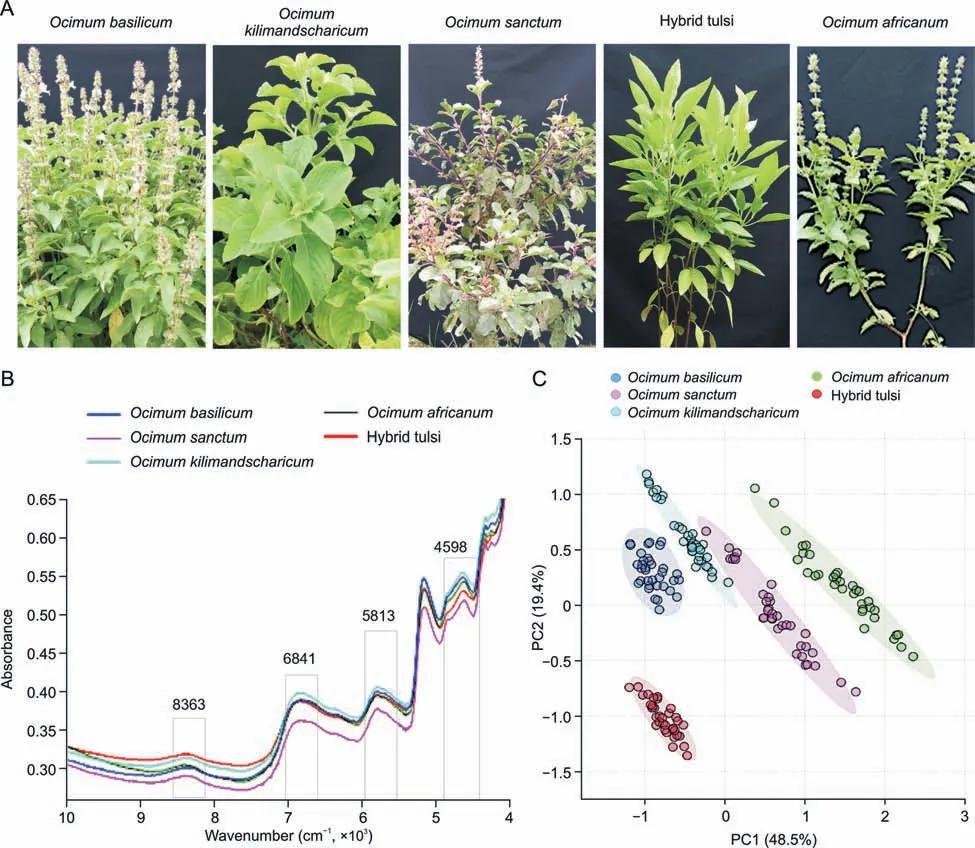
Fig.5. Metabolic fingerprinting Ocimum samples from five different species.(A)Images taken from fresh Ocimum species.(B)Fourier transform near-infrared spectroscopy(FT-NIR)average spectra of five different Ocimum species.The fingerprint wave numbers are indicated with boxes.(C)Principal component analysis(PCA)scores plot for the first component(48.5%) vs.second component (19.4%).PC: principal component.
As an initial step,PCA was performed.The first two PCs of the unsupervised PCA model accounted for 67.9% of the total variation,with PC1 explaining 48.5% of the variation in the species ofOcimum basilicum,Ocimum kilimandscharicum,Hybrid tulsi fromOcimum africanum,andOcimum sanctum,and PC2 explaining 19.4% of the variation in Hybrid tulsi fromOcimum basilicum and Ocimum kilimandscharicum(Fig.5C).The cumulative and individual explained variances of PCs forOcimumsamples are presented in Fig.S7.The supervised PLS-DA model was obtained for all theOcimumsamples from different species,revealing the general structure of the complete dataset,in which component 1 explained 24.9% and component 2 explained 37.3% of the total variance (Fig.S8A),with clear clustering between sample groups.The PLS-DA score plot suggested that there was significant variation in the FT-NIR spectral profiles ofOcimumspecies.Component 1 separated Hybrid tulsi sample groups fromOcimum kilimandscharicum,Ocimum africanum,andOcimum sanctum.Ten-fold internal cross-validation was performed to determine the predictive accuracy and fit of the polynomial model.The cumulative values of the PLS-DA model,with an accuracy of 0.99556,R2=0.95097 and Q2=0.93432,showed a good fit of the model (Fig.S8B).To assess the statistical significance of these apparently highly predictive multivariate models,permutation testing was again conducted.The supervised models were further validated with 1000 permutation tests(Fig.S8C).The PLS-DA model was then used to validate the samples.Sixty to seventy percent ofOcimumsamples from each species were considered as the training set,and the remaining 30%-40% of samples were considered as the validation set (Fig.6).The calculated values for the PLS-DA model using FT-NIR data are presented in Table 2.These values having 100% sensitivity,specificity,accuracy,and reliability were obtained for Hybrid tulsi,Ocimum africanum,and the remaining species had greater than 94% accuracy and 89% reliability for the training set.A total of 99% accuracy and 98% reliability were obtained for the validation set.

Fig.6. Partial least square discriminant analysis (PLS-DA) prediction of five different Ocimum species samples.
Furthermore,GC-MS-based metabolite profiling using ethyl acetate sample extracts was performed to identify the specific marker metabolites for species variation.Ocimum basilicumcontains a high quantity of linalool,Ocimum kilimandscharicumsamples contain a high quantity of camphor,Hybrid tulsi was found to have a quantity of eugenol,and methyl eugenol andOcimum africanumcontain relatively large amounts of humulene(Table S6).

Table 2 Calculated values for the merit figures for the partial least square discriminant analysis (PLS-DA) model using the Fourier transform near-infrared (FT-NIR) data for the five different Ocimum species samples.
A DD-SIMCA classification method was performed to determine the species-specific classification ofOcimumsamples.In the models,we considered performing external validation using 60%-70% of the target class samples from allOcimumspecies,namely,Ocimum africanum,Ocimum basilicum,Ocimum kilimandscharicum,Ocimum sanctum,and Hybrid tulsi samples in the training set,and the remaining samples in the validation set.The models of the acceptance plots for the training and test sets are shown in Fig.7.One hundred percent sensitivity and 100% specificity were obtained for all five groups ofOcimumspecies samples.The summary of DD-SIMCA performance is presented in Table S7.Furthermore,DD-SIMCA models were built by considering theOcimumsamples from each species as a training set and validated with the new set of samples from all other species.The corresponding models of acceptance plots for the training and validation sets are shown in Fig.S9.One extreme sample was found in theOcimum basilicumandOcimum kilimandscharicumsamples,resulting in 97% sensitivity with 100% specificity.The summary of DD-SIMCA performance is presented in Table S8.
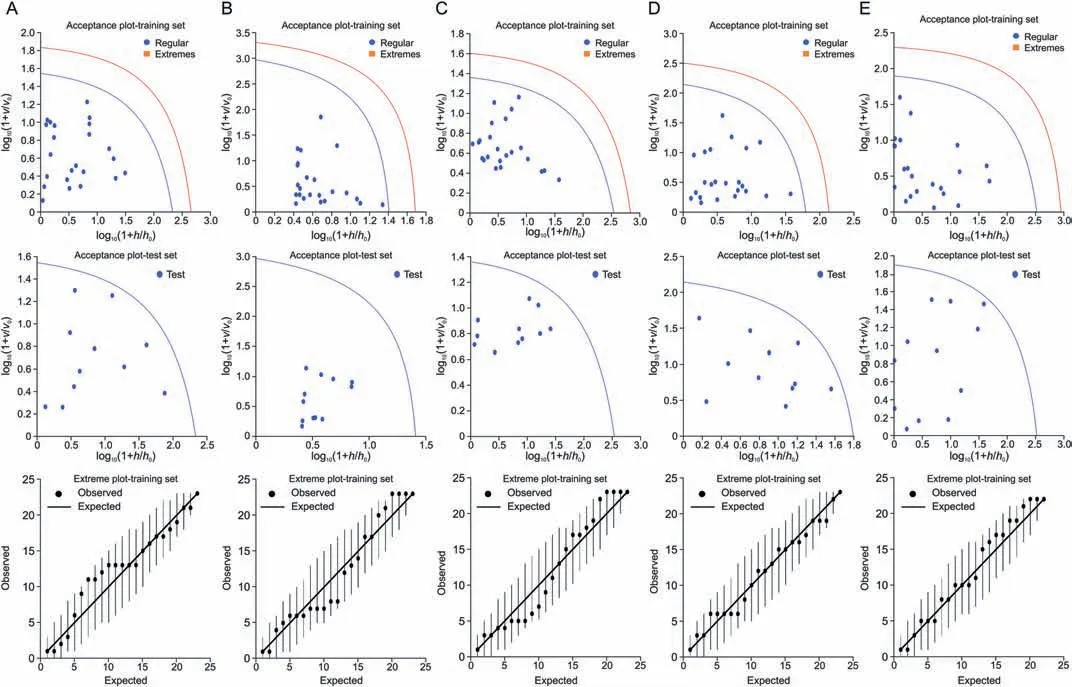
Fig.7. Data driven-soft independent modelling of class analogy (DD-SIMCA) classification of species-specific variation of Ocimum samples: (A) Ocimum africanum samples,(B)Ocimum basilicum samples,(C) Ocimum kilimandscharicum samples,(D) Ocimum sanctum samples,and (E) Hybrid tulsi samples.The acceptance plot for training set provides a graphic representation of the acceptance area,the area inside the blue curve with the threshold for α=0.01 and the red line is the outlier cut-off with threshold γ=0.01.Authentic samples falling outside the blue curve were considered extremes represented with orange box.No extreme samples were found in all cases. v: orthogonal distance of individual samples; v0: mean orthogonal distance of training samples; h: score distance of individual samples; h0: score distance of training samples.
RF testing of allOcimumsamples classified five species samples with 100% accuracy and an out-of-bag(OOB)error of 0(Fig.S10 and Table S9).Furthermore,the supervised model,KNN,was used for the classification ofOcimumspecies.Initially,the complete model built with 1557 variables obtained by FT-NIR did not perform well.RF classification with 18 variables(value representing less than 2% of the original number of variables) had better results for allOcimumsamples.In this case,67% of samples (115 of 174 samples)were used for the training set,and the remaining 33% of samples(59 samples)were used as the validation set.FactorK=13 was used for classification in the region of 4,500-4,800 cm-1for the analysis.The model classified all five species ofOcimumsamples correctly with 100% sensitivity and specificity.There were no cases of falsepositives or false-negatives observed.The corresponding results are presented in Table S10.
3.3.Variety-specific classification of root and leaf samples of Withania somnifera
Withania somniferais a popular Indian medicinal plant whose roots and leaves are used as an immune booster and for the treatment of insomnia.The therapeutic activity of this medicinal herb depends on the type of tissue and variety of the plant used as the active secondary metabolites;specifically,the withanolide content varies.In the present study,we investigated leaf and root samples of three different varieties of the plant.Three distinctive varieties ofWithania somniferaleaf (105 samples) and root (105 samples) samples with different qualities were tested for quality assessment fingerprinting using FT-NIR in the spectral range of 10,000-4,000 cm-1.The representative images of three varieties ofWithania somniferaleaf and root samples are presented in Figs.8A and B.The corresponding FT-NIR spectral profiles of all samples are presented in Figs.S11A and B,and the corresponding average plots are presented in Figs.8C and D.
The spectral profile of the leaf powder exhibited absorbance at the range of 8,500-8,083 cm-1with maxima at 8,372 cm-1corresponding to 2nd overtone of CH,CH2,and CH3functional groups;the range of 7,074-6,667 cm-1with maxima at 6,861 cm-1corresponding to 2nd overtone of CH2,CH,and CH3functional groups;the range of 5,882-5,555 cm-1with maxima at 5,767 cm-1corresponding to combination vibrations of OH functional group;and the range of 4,900-4,545 cm-1with maxima at 4,698 cm-1corresponding to combination vibration of CH,C=O functional groups.Similarly,the spectral profile of root powder exhibited absorbance maxima at 8,333 cm-1,6,873 cm-1,and 5,706 cm-1.Initially,PCA was performed to differentiate samples.In the case of the leaf samples,the first two PCs of the PCA model explained 74.4% of the total variation,with PC1 accounting for 48.6% of the variation,discriminating the WS 101 variety samples from WS 118 and PHPL samples,while PC2 was responsible for 25.8% of the variation,separating leaf samples of WS 101 and PHPL samples from WS 118 variety (Fig.S12A).However,in the case of the root samples,PCA could not separate WS 101 and WS 118 varieties (Fig.S12B).Individual and cumulative explained variances of PCs forWithania somniferaleaf and root samples are presented in Figs.S12C and D.A PLS-DA model was built for supervised classification purposes.A clear separation was identified between three leaf(Fig.8E)and root varieties (Fig.8F) with total classifications of 71.5% (component 1 accounts for 47% and component 2 accounts for 24.5%) and 57%(component 1 accounts for 45.7% and component 2 accounts for 11.3%),respectively,with three distinct clusters being identified in the PLS-DA score plot.

Fig.8. Metabolic fingerprinting of Withania somnifera leaf and root samples from three different varieties. (A) Plant leaf images.(B)Plant root images.(C) Fourier transform nearinfrared(FT-NIR)average spectra of leaf samples.The fingerprint wave numbers are indicated with boxes.(D)FT-NIR average spectra of root samples.The fingerprint wave numbers are indicated with boxes.(E)Partial least square discriminant analysis(PLS-DA)classification of leaf samples from three specified varieties.(F)PLS-DA classification of root samples from three specified varieties.
Withanolides are considered to be qualitative markers,as these metabolites have effective pharmacological activity for treating various diseases [32].In the present study,we measured seven markers of withanolides (withanoside IV,withanoside V,withaferin A,12-deoxywithastramonolide,withanone,withanolide B,and withanolide A) for the comparison of species and varieties (Fig.9).In the case of leaf samples,the PHPL samples contains high quantities of 12-deoxywithastramonolide in comparison to WS 118 samples.The differences in quantities of metabolites are so small that it would be difficult to identify the varieties based on HPLC profiles of the leaf samples alone.However,in the case of root samples,significant differences in the quantity of metabolites were more clearly observed.Specifically,high concentrations of metabolites,namely,withanoside V,12-deoxywithastramonolide,withanone,withanolide B,and withanolide A,were present in the PHPL samples in comparison to those of the WS 101 and WS 118 samples.High concentrations of withanolide A,withanolide B,and 12-deoxywithastramonolide were present in WS 118 samples in comparison to WS 101 samples (Fig.9).
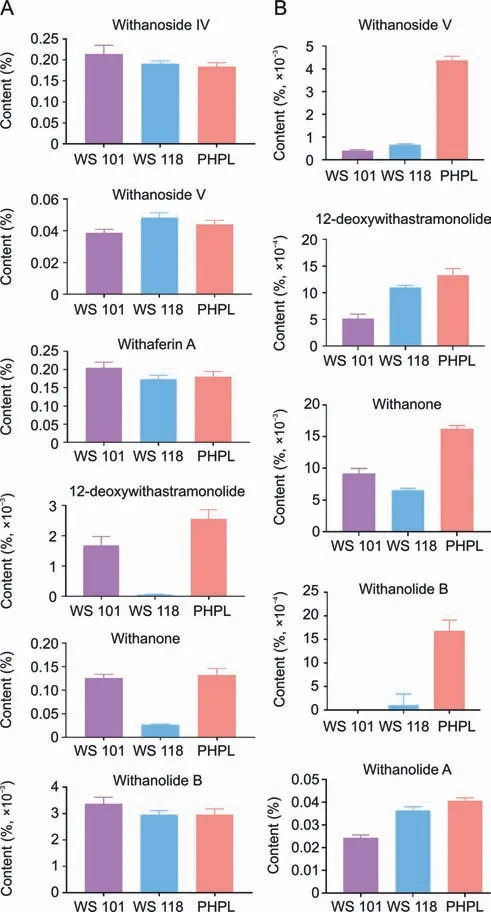
Fig.9. Content of marker compounds in Withania somnifera from WS 101,WS 108,and PHPL samples: (A) leaf samples and (B) root samples.
Ten-fold cross-validation was performed to find the predictive accuracy and fit of the polynomial models(Figs.S13A and B).The cumulative values of PLS-DA withR2=0.99303,Q2=99,147,and accuracy=1.0 for leaf samples andR2=0.98313,Q2=0.96261,and accuracy=1.0 for root samples show good fit of the model.To assess the statistical significance of these apparently highly predictive multivariate models,permutation testing was conducted.The supervised models were further validated with 1,000 permutation tests (Figs.S13C and D).From the analysis of these distributions,the significance of the power of the optimal models to predict the profiles of sample groups was determined to beP<0.001.
The PLS-DA model was further used to validate individual models,again with 60%-70% of samples being used as a training set and the remaining 30%-40% of samples being used as a validation set.The calculated merit values for the PLS-DA model using FT-NIR data forWithania somniferaleaf and root samples are presented in Tables 3 and 4,respectively.One hundred percent sensitivity,specificity,accuracy,and reliability were obtained for the training and validation sets of all threeWithaniavariety leaf samples (Table 3).In the case of root samples,100% sensitivity,specificity,accuracy,and reliability were obtained for the training set of all threeWithaniavariety root samples (Table 4).Onehundred percent sensitivity and 90% specificity were obtained for the WS 101 validation set samples,while 80% sensitivity and 100% specificity were obtained for the WS 118 validation set samples.One hundred percent sensitivity and specificity were obtained for the validation set of PHPL samples.Fig.10 illustrates the predictions ofWithania somniferaleaf and root samples by PLS-DA models.
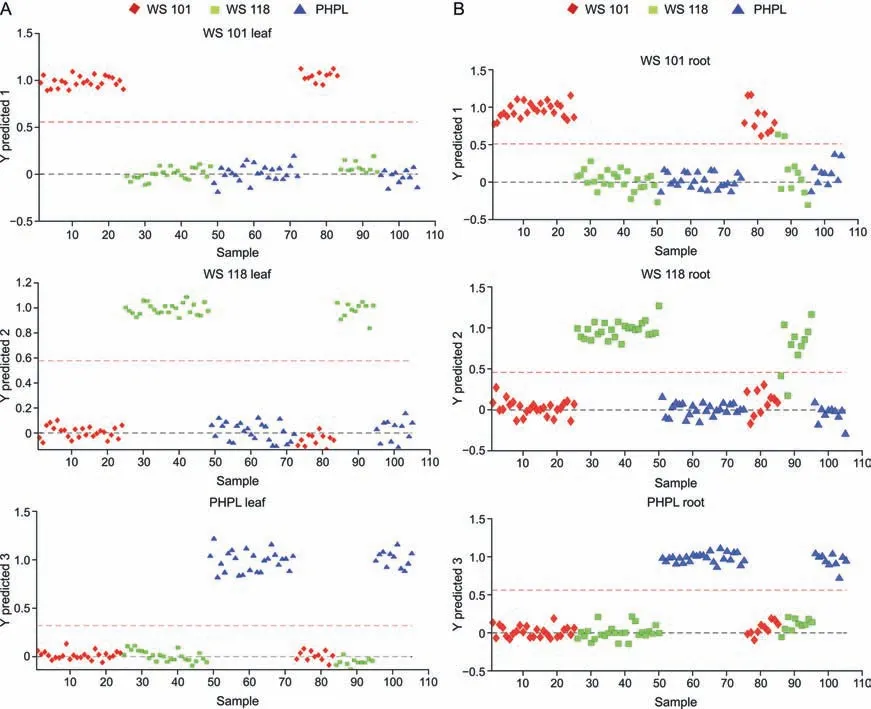
Fig.10. Partial least square discriminant analysis (PLS-DA) prediction of three different varieties of Withania somnifera samples: (A) leaf samples and (B) root samples.
A one-class model using a DD-SIMCA method was performed for variety-specific classification ofWithania somniferaleaf and root samples.In these models,we considered performing external validation using 65%-70% of the target class samples from allWithania somniferaleaf and root variety samples in the training set and the remaining samples in the validation set.The acceptance plots for the training and test sets are shown in Figs.S14 and S15.For the leaf samples,100% sensitivity and specificity were obtained for all three varieties of samples.However,in the case of the root samples,96%,96%,and 100% sensitivity were obtained for the WS 101,WS 118,and PHPL samples,respectively,with a specificity of 100% in all cases.The summary of DD-SIMCA performance is presented in Tables S11 and S12.
The RF classification ofWithania somniferaleaf samples(Fig.S16A and Table S13) provided 100% accuracy.In the case ofWithania somniferaroot samples,one sample is misclassified with a classification performance of 94.28% having an OOB of 0.00952(Fig.S16B and Table S14).Furthermore,a supervised KNN model was used for the classification of leaf and root samples of three varieties ofWithania somnifera.Initially,the complete model(built with 1,557 variables obtained in the FT-NIR)did not perform well.RF classification,which used 23 variables(less than 2% of the original number of variables)for root samples and 15 variables for leaf samples,gave better results for all the samples analyzed.In this case,we considered all 105 samples for the analysis.A total of 30%-40% of samples (31 of 105 root samples and 37 of 105 leaf samples) were randomly selected for model validation,i.e.,the test set.Seventy-four out of 105 root samples and 68 of 105 leaf samples were considered as the training set.FactorK=10 was used for classification in the region of 7,500 to 4,300 cm-1.The model classified all samples correctly with 100% sensitivity and specificity,and there were no cases of false-positives or falsenegatives.The corresponding results are presented in Tables S15 and S16.
3.4.Classification models of adulterants
Adulteration of materials by blending one GI with another or mixing different species/parts of the same plant is a major issue in natural medicines.Such activities are economically motivated and a form of fraud.Rapid screening methods may find possible solutions to these authenticity problems in terms of detection.For geographic origin prediction,pure Lakadong turmeric samples were blended with another GI type (Sangli turmeric and commercial turmeric samples).PLS-DA models were built on spectralprofiles obtained from these samples.All three prediction models were correctly classified pure and blended turmeric samples with 100% sensitivity and specificity having 0% TFP and TFN (Fig.11A).The corresponding merit values are presented in Table 5.For species-specific adulteration identification,Ocimum basilicumsamples were blended with Hybrid tulsi samples and commercialOcimumsamples.PLS-DA models were built on spectral profiles obtained from these samples.Fig.11B represents the class of PLSDA prediction models for pureOcimum basilicumsamples,Ocimum basilicumsamples blended with commercialOcimumsamples,andOcimum basilicumsamples blended with differentOcimumspecies (Hybrid tulsi).All three prediction models were correctly classified pure and blendedOcimumsamples with 100% sensitivity and specificity having 0% TFP and TFN(Table 5).For the identification of authentication in terms of plant tissue-specific parts,Withania somniferaleaf and root samples were considered by blending stem samples with leaf and root samples.The most widely used adulteration method is mixing other portions of the same plant tissue,such as stem samples ofWithania somnifera.PLS-DA prediction models were built on spectral profiles ofWithania somniferaleaf samples blended with stem samples(Fig.S17A),root samples blended with stem samples (Fig.S17B)and pure stem samples blended with root and leaf samples (Fig.11C).The PLS-DA class models correctly predicted the pure tissue-specific samples from blended samples with 100% specificity and sensitivity having 0% TFP and TFN.Furthermore,in addition to multivariant PLS-DA class prediction models,one class classifier model of DD-SIMCA was performed to authenticate pure turmeric,Ocimum,andWithania somniferaroot and leaf samples from the corresponding blended samples.In these models,pure samples were considered as the training set and tested with the corresponding blended samples.The corresponding acceptance plots for training sets,validation sets,and extreme plots are presented in Fig.12.The DD-SIMCA models classified pure turmeric samples (Fig.12A),pureOcimumsamples (Fig.12B),and tissuespecific pureWithania somniferaleaf,root (Figs.12C and D),and stem samples (Fig.S18) from their corresponding blend samples with 100% sensitivity and specificity (Tables S17 and S18).
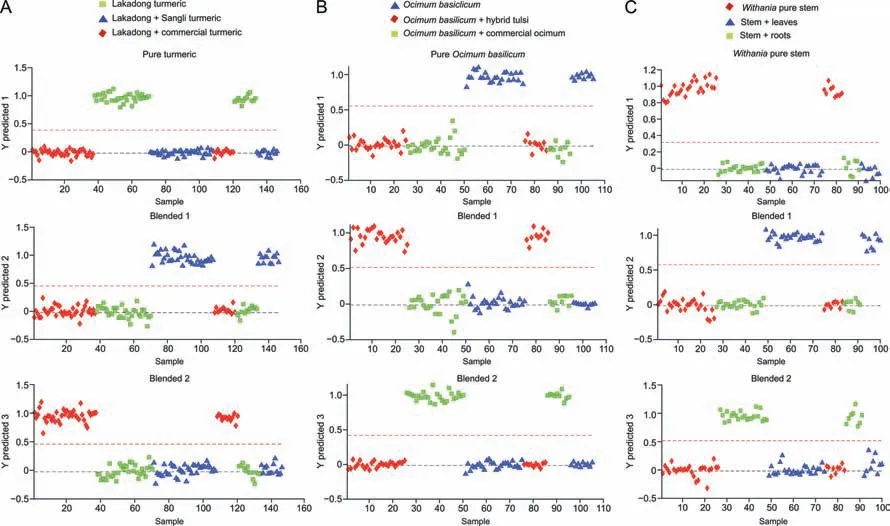
Fig.11. Partial least square discriminant analysis(PLS-DA)prediction of pure and blended samples:(A)Lakadong turmeric samples blended with Sangli turmeric and commercial turmeric samples,(B)Ocimum basilicum samples blended with Hybrid tulsi and commercial Ocimum samples,and(C)Withania stem samples blended with leaves and root samples.
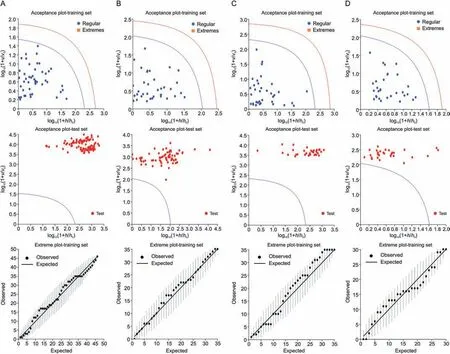
Fig.12. Data driven-soft independent modelling of class analogy(DD-SIMCA)classification of pure and blended samples:(A)Lakadong turmeric samples blended with commercial and Sangli turmeric samples,(B)Ocimum basilicum samples blended with commercial Ocimum samples and Hybrid tulsi samples,(C)PHPL leaf samples blended with stem samples,and(D)PHPL root samples blended with stem samples.The acceptance plot for training set provides a graphic representation of the acceptance area,the area inside the blue curve with the threshold for α=0.01 and the red line is the outlier cut-off with threshold γ=0.01.Authentic samples falling outside the blue curve were considered extremes represented with orange box.No extreme samples were found in all cases.v:orthogonal distance of individual samples;v0:mean orthogonal distance of training samples;h:score distance of individual samples; h0: score distance of training samples.

4.Conclusions
The global use of alternative medicines,especially herbal medicines,is rapidly expanding and becoming increasingly popular.Methods to evaluate the efficacy and safety of herbal medicines are described as major needs by the WHO.Traditionally,discrimination of herbal medicines is carried out based on morphology and the targeted chromatographic analysis of a few specific compounds.However,the quality of herbal medicines should not be limited to a few specific secondary metabolites but rather the entire content of biologically relevant compounds within a plant.The development and validation of integrated approaches with rapid and nondestructive analytical strategies for the screening of medicines are of utmost importance.The potential of FT-NIR spectroscopy in combination with chemometric modelling to identify geographic origin-,species-,and varietyspecific variation was investigated in this study.The results demonstrate that FT-NIR spectroscopy in combination with chemometric models can classify GI in turmeric samples and speciesand variety-specific variation inOcimumandWithania somniferasamples.Supervised classification models using PLS-DA,KNN,and RF tests can be used to assess the quality,GI,and authenticity of medicinal herbs.The results obtained in this study indicate that FT-NIR spectroscopy is a very promising tool for the identification of GI-,species-,and variety-specific vegetation samples and could be used for rapid authentication and quality control in the herbal pharmaceutical industry for the classification of turmeric,Ocimum,andWithania somniferasamples.
CRediT author statement
Samreen KhanandAbhishek Kumar Rai:Methodology,Formal analysis,Data curation,Writing -Reviewing and Editing;Anjali SinghandSaudhan Singh:Resources,Formal analysis,Data curation,Writing -Reviewing and Editing;Basant Kumar Dubey,Raj Kishori Lal,Arvind Singh Negi,andNicholas Birse:Resources,Writing -Reviewing and Editing;Prabodh Kumar Trivedi:Conceptualization,Resources;Christopher T.Elliott:Resources,Writing -Reviewing and Editing;Ratnasekhar Ch:Resources,Conceptualization,Methodology,Investigation,Data curation,Writing -Original draft preparation,Reviewing and Editing,Visualization,Supervision,Project administration,Funding acquisition.
Declaration of competing interest
The authors declare that there are no conflicts of interest.
Acknowledgments
Authors would like to thank Government of India for Department of Science and Technology-SERB-SRG research grant (Grant No.: SRG/2021/000750-G) and Department of Biotechnology for Ramalingaswami grant (Grant No.: BT/RLF/Re-entry/21/2020),and Director,Prabodh Kumar Trivedi,of CSIR-CIMAP for providing infrastructure,facility,and funding support from CSIR,India(Grant Nos.: FC2020-23/NMITLI/TLP0001 &TLP0002).We acknowledge Dr.Ritu Trivedi (CSIR-CDRI Lucknow,India) for support and Dr.Abolie Girme and Dr.Lal Hingorani (Pharmanza herbal Pvt.Ltd,India) for providingWithania somniferasamples.We acknowledge Dr.Neerja Tiwari for FT-NIR access,Ms.Manju Yadav and Ms.Namita Gupta for HPLC access,and Ms.Anju Yadav for GC-MS access.Authors would like to thank Aroma mission HCP-0007,India for funding support.Prof.Christopher T.Elliott would like to thank Bualuang ASEAN Chair Professor Fund,UK and Queen's University Belfast Fund,UK.
Appendix A.Supplementary data
Supplementary data to this article can be found online at https://doi.org/10.1016/j.jpha.2023.04.018.
 Journal of Pharmaceutical Analysis2023年9期
- Journal of Pharmaceutical Analysis的其它文章
- Comment on: “Development of a CLDN18.2-targeting immuno-PET probe for non-invasive imaging in gastrointestinal tumors”
- JOURNAL OF PHARMACEUTICAL ANALYSIS BEST PAPERS 2022
- Targeted bile acids metabolomics in cholesterol gallbladder polyps and gallstones: From analytical method development towards application to clinical samples
- Characterization of natural peptides in Pheretima by integrating proteogenomics and label-free peptidomics
- Eight Zhes Decoction ameliorates the lipid dysfunction of nonalcoholic fatty liver disease using integrated lipidomics,network pharmacology and pharmacokinetics
- Gut microbiota-based pharmacokinetic-pharmacodynamic study and molecular mechanism of specnuezhenide in the treatment of colorectal cancer targeting carboxylesterase
