Theoretical analyses on the one-dimensional charged particle transport in a decaying plasma under an electrostatic field
Yao-Ting Wang(汪耀庭), Xin-Li Sun(孙鑫礼), Lan-Yue Luo(罗岚月), Zi-Ming Zhang(张子明),He-Ping Li(李和平), Dong-Jun Jiang(姜东君), and Ming-Sheng Zhou(周明胜)
Department of Engineering Physics,Tsinghua University,Beijing 100084,China
Keywords: transport of charged particles, decaying plasma, low-pressure plasma, theoretical analysis,
1.Introduction
Wall-confined decaying plasmas widely exist in the applications of plasma immersion ion implantation,[1–4]afterglow plasmas[5–7]and ion extraction process of laser-induced plasmas.[8–14]In these fields of engineering and academic research,ion extraction flux is one of the key parameters,which is determined by the evolution of sheath and the propagation of waves in plasmas.In this paper,we focus on the ion extraction process of the laser-induced plasmas, and the spatiotemporal evolutions of the decaying plasmas under an externally applied electrostatic field are analyzed theoretically.
For a typical ion extraction process, as shown in Fig.1,the metal vapor is formed starting from the pool of the molten metal; then, a weakly-ionized metal plasma is induced by a laser pulse during a very short period; and then, an electrostatic field is imposed between the electrodes, which results in the extraction of the charged particles until all of them are collected on the electrode surfaces.Two parameters, i.e., the ion extraction flux (Γi), and ion extraction time(text) defined as the time required from the start of the ion extraction process to the time point when 90% of ions are extracted, are used to describe the features of the ion extraction process in previous studies.[12]Up to now, many efforts have been made to improveΓi, such as improvements of extracting electrode configurations (e.g., Π type[10,13,15,16]and M type[15,17–19]) and weakening of the shielding effect of high voltage sheath (e.g., RF resonance method[11,20–24]),etc.Analytical description,[7,9,25–27]fluid simulation,[28,29]and particle-in-cell (PIC) simulation[15,16,30,31]are the three major theoretical methods for studying the ion extraction process.The fluid method consumes fewer computing resources,but it provides less accurate descriptions of the whole process and is even not applicable to some cases.[16]Fewer assumptions are employed in the PIC method which gives a more accurate description compared with the fluid model, however,it consumes much more computing resources.For analytical description,it can provide a clear physical image of the ion extraction process provided that a reasonable simplification can be made.Thus, it is of great significance to establish an analytical model to analyze and predict the physical processes during the decaying of a laser-induced plasma.
Physically, for the singly- or doubly-bounded decaying plasmas, the sheath dynamics can operate in a supersonic regime or a subsonic regime depending on the relative speed between the sheath front movement and the ion rarefaction wave(IRW)propagation.[30]For the sheath dynamics in a supersonic regime,the theoretical analysis on the ion extraction characteristics in a decaying plasma was firstly conducted by Chen.[9]Chen’s work shows that, during the whole ion extraction process, firstly the sheath will expand rapidly until the balance between the Langmuir flux and the Bohm flux is obtained; then, the density of the bulk plasma will drop slowly with almost unchanged sheath thickness; and finally,the plasma will collapse quickly when the density and the thickness of the bulk plasma reach sufficient small values.Based on Chen’s work, Okano[25]derived a simplified formula forΓithat is applicable over a wide initial plasma density range to evaluatetext.While for the sheath dynamics in a subsonic region, the IRW propagation is also a dominant factor contributing to the ion fluxes.Combining sheath expansion and IRW propagation, Murakami and Nishihara[26]developed an analytical model for describing the sheath expansion and IRW propagation in a decaying plasma bounded by a single negatively biased electrode.In addition,the whole process is generally divided into two phases,i.e.,the ion matrix sheath relaxation and the Langmuir sheath expansion,in the plasma immersion ion implantation (PIII) with a decaying single-wall confined plasma;[1,2]and correspondingly,the formulas for the ion flux or the governing equations for sheath dynamics in the whole implantation process have also been presented.Focusing on the ion extraction process in the decaying plasmas confined between two electrodes,recent studies showed that: the ion flux to the anode could not be ignored and was greatly influenced by the initial electron temperature of plasmas;[30]and the whole ion extraction process could be divided into three stages, i.e., the electron oscillation stage, sheath expansion and IRW propagation stage,and the subsequent rapid decaying stage.[16,30]However, up to now, the ion flux to the anode during the whole process and the fluxes of the charged particles during the electron oscillation stage are not included in the analytical model.Therefore,the goal of this paper is to establish a complete analytical model for describing the transport of the charged particles during the whole decaying process of the laser-induced plasma bounded between two electrodes under the externally applied electrostatic field.This paper is organized as follows:descriptions on the physical model and the PIC code are presented in Section 2, then, theoretical analyses and simulation validations are provided in Section 3, and then, discussions are presented in Section 4, and finally, the major conclusions are summarized in Section 5 with a brief discussion on future research.
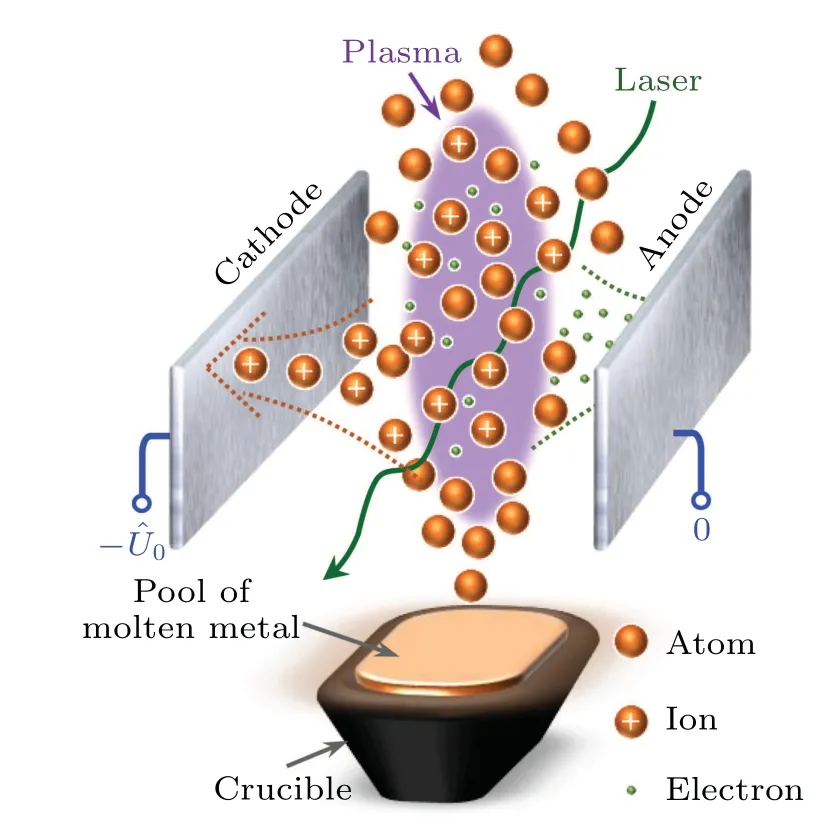
Fig.1.Schematic diagram of the ion extraction device.
2.Descriptions on the physical model and the PIC code
In this study, a one-dimensional(1D)ion extraction system is considered as shown in Fig.2.A laser-induced plasma consisting of argon ions(Ar+)and electrons(e)is suddenly generated att=0 and uniformly distributed between a grounded anode (ˆx= ˆL) and a negatively biased cathode fixed at-ˆU0(ˆx=0).Once an electrostatic field is imposed,the ion extraction process starts at ˆt >0.It is assumed that:(i) the plasma considered here is collisionless because the species mean free path is much larger than the characteristic length of the system due to the typical low chamber pressure(~10-5Torr,1 Torr=1.33322×10²Pa); (ii)the particles are absorbed by the metal plates when they reach the electrodes,and the subsequent sputtering and secondary electron emission effects are neglected; (iii) the initial velocity distributions of the electrons and ions are Maxwellian corresponding to their initial temperatures, ˆTe,0and ˆTi,0,respectively.

Fig.2.Schematic diagram for studying the 1D transport of charged particles in a decaying plasma.
In this study, a 1D code, EDIPIC (the electrostatic direct implicit particle-in-cell code),[32]is employed to simulate the evolutional properties of the bounded decaying plasmas.EDIPIC is a well-developed PIC code for studying the ion extraction process and its accuracy and applicability have been well-verified in previous studies.[30,31]In this paper,considering the needs for both accuracy and consumption of the computing resources,the spatial and time intervals are selected as follows: the grid size(Δˆx)is 0.1 times the Debye length(λD),that is, Δˆx=0.1λD; the time interval is determined to make sure that an electron will not travel across a grid during one time interval(Δˆt),that is ˆveΔˆt <Δˆx,where ˆveis the maximum electron speed considered in the PIC simulation; in particular, ˆveequals 20 times of the electron thermal velocity in this study.The initial macroparticles in a cell are set to be 256,i.e.,Np=256.The operating parameters for a typical case studied in the following sections are listed in Table 1.Here,it should be emphasize that: since in previous PIC simulations of the ion extraction process,the variation ranges for ˆTe,0, ˆTi,0,ˆL,and ˆn0are 0.1 eV~1.0 eV,0.01 eV~0.1 eV,1.0 cm~3.0 cm,and(0.1~10)×1016m-3,respectively,[15,30,31,33,34]the values of ˆTe,0=0.5 eV, ˆTi,0=0.02 eV, ˆL=2.0 cm, and ˆn0=1.0×10¹⁶m-3are used in this study;while for the externally applied voltage,the value of ˆU0=300 V is used according to Ref.[35]for the extraction of argon ions.

Table 1.Typical simulation parameters used in this paper.
3.Theoretical analyses and numerical validations
3.1.Normalization for the physical parameters and equations
In this section, all parameters and the related governing equations will be normalized before we start the analyses.The specific normalization process is as follows(for simplicity,the variables with and without “^” represent the parameters before and after normalization):
wheresrefers to the sheath thickness,xis the spatial variable,ωpiis the ion plasma frequency,urefers to the macroscopic ion velocity,csis the ion acoustic velocity,nrepresents the ion or electron number density,φrefers to the electric potential,eis the elementary charge,kis the Boltzmann constant, andLstands for the distance between electrodes.Thus,the normalized formula for the Langmuir flux and the Poisson equation are expressed as
According to Refs.[26,36],the sheath motion function,the ion density,and velocity profiles in an IRW are as follows:
wherex0andt0are the starting point of IRW in space and time.
3.2.Theoretical analyses of the whole ion extraction process
Based on the previous studies,[16,30]the whole ion extraction process can be divided into three stages, i.e., the electron oscillation and ion matrix sheath extraction stage,sheath expansion and ion rarefaction wave(IRW)propagation stage,and the plasma collapse stage.However,the specific criterion for indicating the starting and/or ending of each stage is still not clear.In this sub-section, the criteria for differentiating various stages during the decaying of the laser-induced plasmas under an externally applied electrostatic field,as shown in Fig.2,are derived theoretically;and then,the expressions for the ion extraction flux at each stage are obtained for predicting the characteristics of the ion extraction process.
3.2.1.Electron oscillation and ion matrix sheath extraction stage
When an external electric field is suddenly imposed on a plasma,the electrons will immediately respond to the electric field to form an electron-free region,which is the so-called ion matrix sheath.In the previous studies on PIII,[1,2]the thickness of the initial matrix near the cathode is thought to be equal to (2U0)1/2.However, when the plasma is confined by two electrodes, electrons will oscillate between electrodes as shown in Fig.3.Here,we define the ion matrix sheath as the largest electron-free region near the cathode and anode, and thus, the ion matrix sheath extraction process will occur near both electrodes.In Ref.[37], it was shown that the thickness of the initial ion matrix sheath near the cathode is
where the subscripts“m”and“ca”represent the matrix sheath and cathode, respectively.Because the normalized electron motion equation can be expressed as
the initial ion matrix sheath thickness near the anode is
where the subscript“an”stands for the anode.
In previous studies on the evolution of the ion matrix sheath,[1]the ions are assumed to be uniformly distributed in space, and then, the temporal evolution of the ion density in the matrix sheath is expressed as
While for a stable Langmuir sheath, the spatial distribution of the ion density can be approximated as follows(a detailed derivation is presented in Appendix A):
wherexrefers to the distance to the sheath edge.Since the ion matrix sheath extraction process is also the formation of the Langmuir sheath, it is reasonable to assume that the ion density in the vicinity of the cathode can be expressed by Eq.(9),and a time-dependent variableγ(t)can be introduced into Eq.(10) to describe the spatiotemporal evolution of the ion matrix sheath as

Fig.3.Schematics of the species number density distributions during the electron oscillation process when the electrons move towards the anode(a)and the cathode(b),where ue represents the motion of electrons.
After a coordinate transformation,the evolution of the ion matrix sheath near the cathode can be simplified as
For the ion matrix sheath near the anode,during the first stage, the plasma potential will be higher than that of the anode.[16,30]Thus, the evolution of the matrix sheath will be similar to the situation near the cathode.According to Eq.(7),during the first stage of the ion extraction process, the range of the electron oscillation in the matrix sheath near the cathode and the anode are[sm,ca-sm,an,sm,ca]and[L-sm,an,L],respectively.Therefore, it is reasonable to believe that the ion density evolutions in the ion matrix sheath near the anode([L-sm,an,L])is similar to that in the region of[sm,ca-sm,an,sm,ca]near the cathode.Finally,the evolution of the ion matrix sheath near the anode can be expressed as
In this subsection, comparisons are conducted between the theoretically predicted and PIC simulated results for the ion density distributions in the ion matrix sheath near the electrodes for the typical case listed in Table 1.It is seen from Fig.4 that a good agreement is obtained at different time points during the electron oscillation and ion matrix sheath extraction stage.Based on the preceding discussions,the criterion indicating the end of the first stage withγ=1 can be obtained from Eq.(11)as
Correspondingly, the ion extraction flux can be obtained provided that the ion density evolution is known.Thus, the ion extraction fluxes near the cathode and anode during the first stage, i.e., the electron oscillation and ion matrix sheath extraction stage,can be expressed as
in the above equations, the Hyp2F1 is the hypergeometric function.
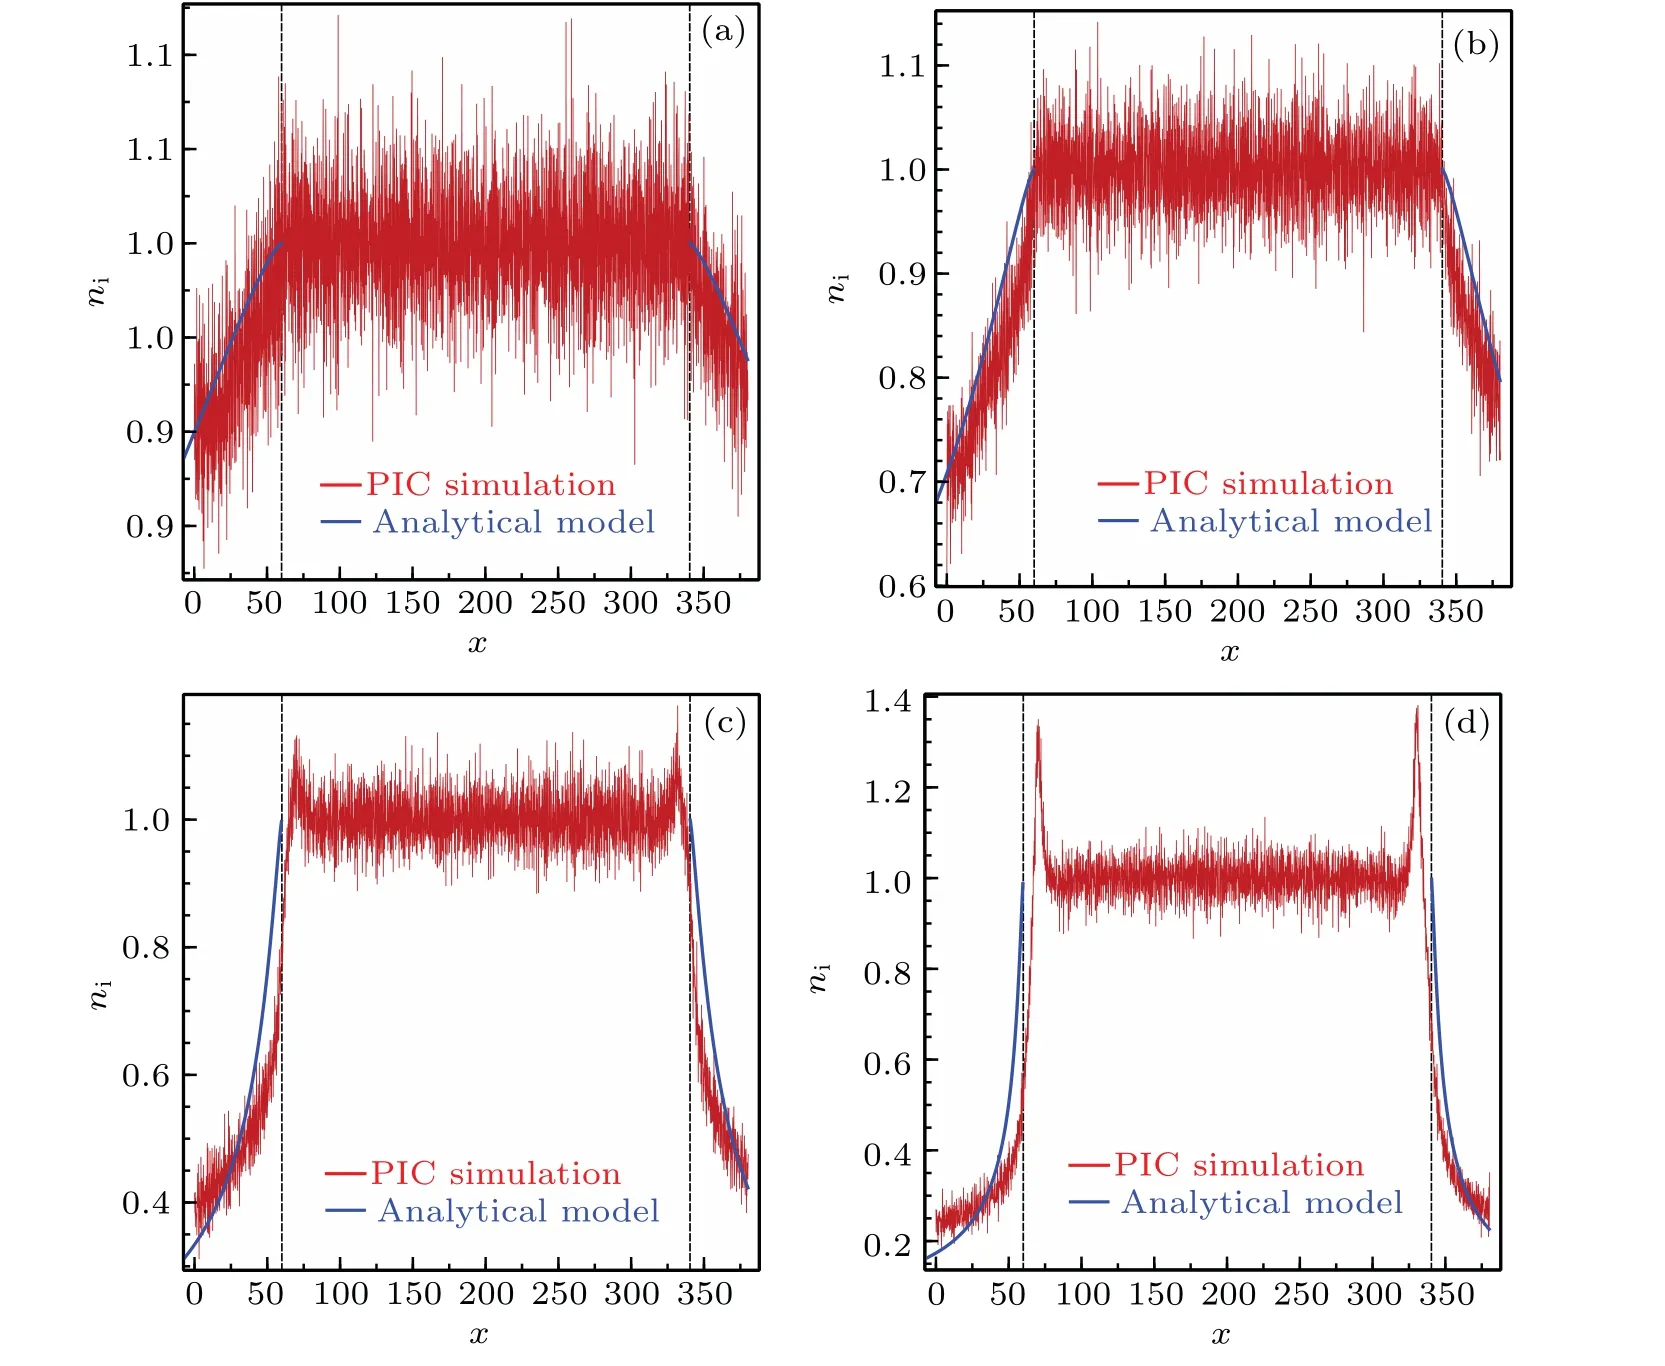
Fig.4.Comparisons of the theoretically predicted (blue line) and PIC simulation (red line) results of the ion density distributions in the ion matrix sheath both near the cathode and anode at t=0.47(a),0.91(b),2.00(c),and 3.09(d).
3.2.2.Sheath expansion and IRW propagation stage
Following the electron oscillation and ion matrix sheath extraction stage, the sheath expansion and the IRW propagation become the dominant phenomena during the ion extraction process.In the second stage, on the one hand, a moving Langmuir sheath is formed in the vicinity of the cathode,and moves towards the bulk plasma; on the other hand, the IRW starts to propagate from the initial matrix sheath edge near the anode, while the remained ions in the matrix sheath will be extracted until the IRW reaches the anode.For simplicity,the IRWs excited near the cathode and anode are noted as IRW-C and IRW-A,respectively,hereafter in this study.
Firstly,the ion extraction flux on the cathode will be considered, as shown in Fig.5(a).According to Ref.[26], the propagating speed of the sheath edge towards the bulk plasma(vs= ds/dt) will gradually decrease with the increase of the sheath thickness.Therefore,compared tocs,the sheath expansion process may include two states:supersonic sheath expansion state whenvsexceedscs,and subsonic sheath expansion state whenvsis less thancs.For the supersonic sheath expansion state,since the sheath expansion speed is higher thancs,the IRW cannot be excited, and thus, makes no contributions to the sheath evolution.Therefore,the normalized sheath motion function during the supersonic state can be expressed as
Since the supersonic sheath expansion state ends whenvs=1,the corresponding sheath thickness and the time point can be expressed as
Here, it should be emphasized that, if the thickness of the initial ion matrix sheath exceedsssup,end,ca,there exists no supersonic sheath expansion state.For universality and the sake of discussion,we assume the existence of a supersonic sheath expansion process in the following analysis.
During the subsonic state,the IRW will be excited and its front will overtake the sheath edge.Thus,there is a two-stage distribution for the ion density, as shown in Fig.5(b).In this case, the IRW will influence the ion density and speed at the sheath edge.Therefore, the normalized sheath motion equation is written as
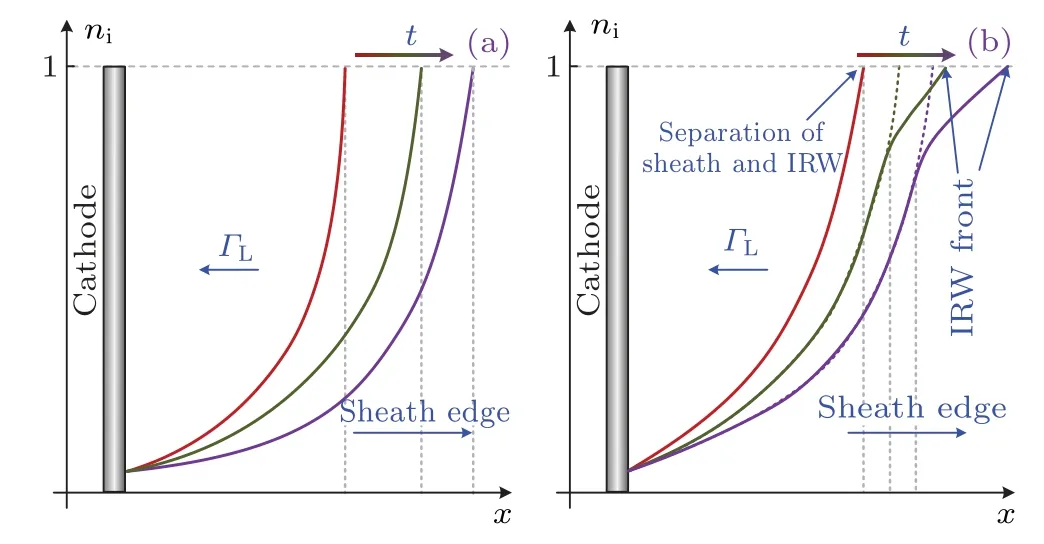
Fig.5.Schematics of the ion density distributions near the cathode during the supersonic(a)and subsonic(b)sheath expansion states.
Secondly,in the vicinity of the anode,after the first stage ends, the sheath will gradually become a neutral region with the potential of the bulk plasma getting closer to that of the anode, as shown in Fig.6.Therefore, the IRW-A will propagate toward both the bulk plasma and the anode,and the corresponding time period when the IRW-A reaches the anode can be expressed as
After the IRW reaches the anode,due to the properties of the IRW,the ion flux to the anode can be expressed as
While before the IRW-A reaches the anode, the ions in the vanishing sheath will be slowly extracted.Considering the continuity of the ion fluxes,the ion extraction flux at this substage can be expressed as
In addition, although the starting point of the IRW-A wheren=exp(-1) will move towards the anode after the front of IRW-A reaches the anode, the starting point of IRW-A will be set tox=Lfor simplicity in the following analysis since the distance between this starting point and the anode surface is relative small compared with the IRW travelling distance.Based on Eq.(19), it is shown that the IRW affects the ion speed and density at the sheath boundary;and thus,affects the sheath expansion process near the cathode.Equations (17)–(22) offer a comprehensive illustration of the ion extraction fluxes before the convergence of the two IRW fronts.Figure 7 gives a schematic description of the evolution of the ion density distributions before and after the IRW-A and IRW-C meet.It is seen from Fig.7 that, after the meet of the fronts of IRW-A and IRW-C,the two IRWs continue to propagate in their original directions as before.In the interaction region,the ion density and speed show parabolic and linear distributions,respectively.[7]During the whole second stage,i.e.,the sheath expansion and IRW propagation stage, the sheath advancing process near the cathode is only affected by the high voltage sheath and the IRW-C,while the extraction process on the anode is divided into two sub-stages.After the front of the IRW-A meets the sheath near the cathode, sheath properties near the cathode start to be affected by both IRW-A and IRWC, thus, the criterion for the beginning of the third stage and the corresponding sheath thickness at this time will be
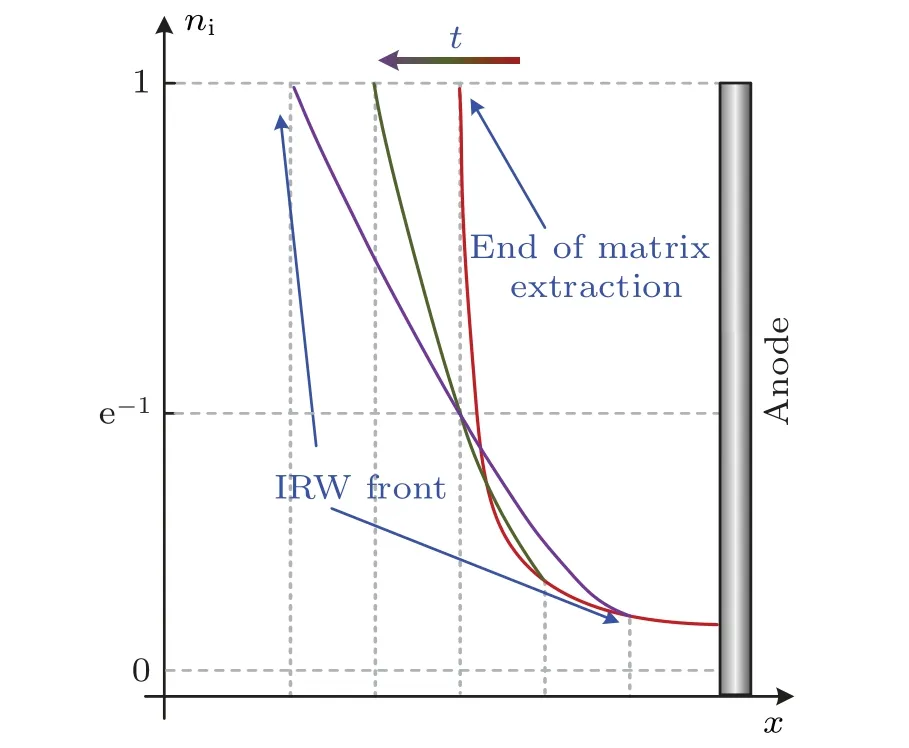
Fig.6.Schematic diagram of the ion density distributions near the anode after the electron oscillation and matrix sheath extraction stage ends.
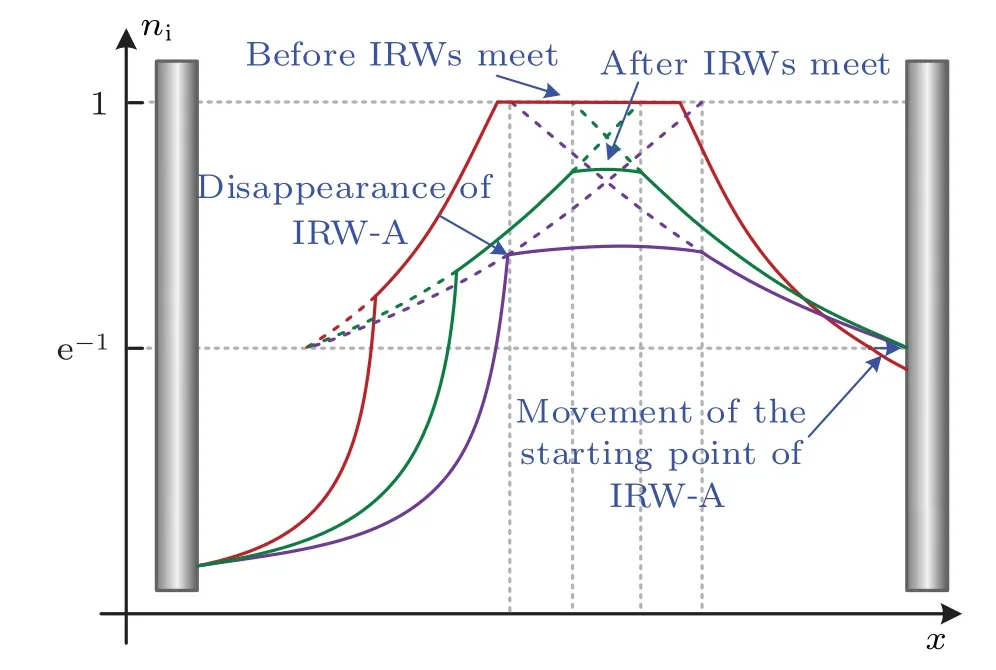
Fig.7.Schematic diagram of the ion density distributions before and after the IRW-A and IRW-C meet.
3.2.3.Plasma collapse stage
After the disappearance of the IRW-A,the ion density and speed at the sheath edge start to be affected by IRW-A.It is seen from Fig.8 that, in the third stage of the ion extraction process, i.e., the plasma collapse stage, the Langmuir sheath continues to expand towards the bulk plasma, while the ion density at the sheath edge drops quickly.The ion density in the interaction region typically exhibits a parabolic distribution; however, for the sake of simplicity, it can be approximated as being uniformly distributed,as discussed in detail in Appendix B.With the front of IRW-C as the boundary point,the ion velocity presents a piecewise linear distribution.

Fig.8.Schematics of the ion density(a)and speed(b)distributions in the plasma collapse stage.
For the sheath motion near the cathode, the sheath function is written as
Thus,the ion density and velocity at the sheath edge can be expressed as
From the analysis in Appendix C,the ion flux to the anode can be written as
After the disappearance of IRW-A,it can be assumed that du/dxis constant,i.e.,
In summary,the ion fluxes both to the cathode and anode in the third stage can be described by Eqs.(24)–(27).
3.2.4.PIC modeling validations
Based on the preceding discussions,there exist three successive stages in a typical ion extraction process, which are the electron oscillation and ion matrix sheath extraction stage(stage I),sheath expansion and IRW propagation stage(stage II),and plasma collapse stage(stage III).During stage II of the ion extraction process,considering the relationship betweenvsandcs,the extraction process near the cathode can be furtherly divided into stage II-1C and stage II-2C;while for the ion extraction process near the anode, it can be divided into stage II-1A and stage II-2A.In stage II-1A, the remaining ions in the matrix sheath will be extracted, while in stage II-2C, the ion extraction flux to the anode will remain unchanged and be equal to exp(-1).The formulas and the governing equations for the whole ion extraction process are summarized in Table 2.
For validating the analytical model developed in this study(Table 2),the PIC simulations for the typical case listed in Table 1 are conducted.Comparisons of the ion extraction fluxes to the cathode and anode between the theoretically predicted results using the equations in Table 2 and the PIC modeling results are shown in Fig.9.It is seen from Fig.9 that: (i)The analytical model gives the same time-dependent trend of the ion extraction fluxes both to the cathode and the anode as that of the PIC modeling results fromt=0 totext;and in particular,two high flux peaks to the cathode and anode in stage I and a constant ion extraction flux to the anode in stage II-2A are both predicted by the analytical model and the PIC simulation.(ii)The percentages of the ions extracted to the cathode and anode in each stage are calculated theoretically and numerically, and the corresponding maximum relative discrepancies in each stage between the analytical model and the PIC simulation are all less than 3%.(iii) The ion extraction time obtained from the PIC simulation istext=335.13 when 90%of the ions are extracted;while att=text,the analytical model predicts that 87.8%of the ions are extracted with a relative discrepancy of 2.2%compared to that of the PIC modeling result.In summary,the preceding comparisons of the trend of the ion extraction flux,percentages of the ions extracted to the anode and cathode in each stage, and the percentage of the ions extracted att=textbetween the theoretical analysis and the PIC simulation have shown a good agreement.This indicates that the analytical model established in this paper can provide a good description on the whole ion extraction process.

Table 2.List of the formulas and governing equations for describing the whole ion extraction process.
4.Discussions on the characteristics of the ion extraction process
As shown in Fig.9,the ion extraction fluxes to the cathode and anode both exhibit considerable peaks during stage I,which means that a large number of ions will be quickly extracted in the first several ion plasma periods; while in stage III,the magnitudes of the ion extraction fluxes are quite small.Therefore, in order to shorten the ion extraction time,it would be very effective to maximize the number of ions extracted in the first stage and reduce the number of ions extracted in the third stage.For the convenience of description,we define the ratio of the number of ions extracted in the first stage, as well as the total number of ions extracted beforet=tdis,anto the initial total number of ions asr1andr2, respectively.In the following two subsections, we will discuss the influence of plasma parameters on these two ratios.
4.1.Proportion of ions extracted during stage I
At the end of the first stage of the ion extraction process,there exist two Langmuir sheaths near the cathode and anode.The total number of ions in a Langmuir sheath is quite small compared with that in the initial matrix sheath.Thus,the ions left in the Langmuir sheath can be neglected when giving a rough estimation of the ions extracted during stage I.Therefore,r1can be approximately expressed as
It is seen clearly thatr1increases with the increase of the magnitude of the externally applied voltage,and decrease with increasing in the initial plasma density and plasma width.Meanwhile,as for the initial electron temperature,it does not appear in Eq.(28),that is to say,it has almost no effects on the ion extraction characteristics in stage I for the ion extraction process.
4.2.Proportion of remaining ions before the starting of stage III
In this subsection,the number of the left ions at the beginning of the third stage will be roughly estimated.During stage II-2C, the moving speed of the sheath edge is lower thancs,and drops quickly with the increase of the sheath thickness.Neglecting the ions in the Langmuir sheath and assuming a uniform ion density distribution in the bulk plasma,r2can be roughly expressed as
Letting(sdis,an-ssup,e,ca)/(tdis,an-tsup,e,ca)=α,the value ofαreflects the position of the sheath edge relative to the front of the IRW.The smallerαis, the more the front of the IRW exceeds the sheath edge.It is seen clearly thatαis affected by the externally applied voltage and the initial electron temperature.As the applied voltage increases, the sheath advances faster, and the value ofαalso increases.Moreover, the increase in the electron temperature will lead to a faster propagation of IRW,and a decrease inα.Thus,r2can be re-written as
Based on the foregoing analysis,it is seen that the values ofsm,an/L,tm,e/L,tsup,e,ca/L,andssup,e,ca/Lall merely depend on the externally applied voltage.Therefore, ifαbeing constant,r2will be only affected by the applied voltage.Here,the values ofr2are calculated using Eq.(31) whenαranges from 0 to 1.0 with an interval of 0.1 andU0varies from 100 to 3000,while keeping other parameters being unchanged for the typical case listed in Table 1.The averaged value ofr2and its variation region enclosed byα=0.0 as the lower boundary andα=1.0 as the upper boundary are shown in Fig.10.For the typical case, the estimated averaged value ofr2obtained from Eq.(31)is 66.59%,which is in good agreement with the predicted value of 69.78%by the analytical model and that of 71.31%by the PIC modeling.
Based on the preceding discussions,the analytical model listed in Table 2 can be employed to study the influences of the key physical parameters,including the externally applied voltage, initial electron temperature, initial plasma density, and plasma width, on the values ofr1andr2.It is shown from Fig.11 that: (i)The value ofr1is significantly positively correlated with ˆU0,and negatively correlated with ˆn0and ˆL,while it remains almost unchanged with ˆTe.(ii)The applied voltage has a significant impact onr2, while the variations of other parameters such as ˆn, ˆL, and ˆTehave minimal effects on it.It should be noted thatr2reflects the proportion of ions extracted before the plasma collapse, and the larger value ofr2is,the less ions need to be extracted in stage III,which is not directly related to the ion extraction time.Although the increasing in the initial electron temperature results in a higher ion acoustic velocity and shorter time,tdis,an,when the IRW-A and sheath meets,and consequently,leads to the reduction of the ion extraction time,text,as predicted in previous study,e.g.,Ref.[30], the ratios of the extracted ions are nearly independent of the initial electron temperature.The modeling results presented in Fig.11 suggest that the increase of ˆU0will be most helpful for increasingr2,but in practice,the increase of ˆU0is often limited by some factors such as the sputtering effect or secondary ionization caused by excessively high voltage.Therefore,novel methods need to be developed to improver2for the ion extraction process.
5.Concluding remarks
In this paper,a complete analytical model for describing the spatiotemporal evolutions of the ion extraction process in a decaying plasma bounded by a negatively biased cathode and a grounded anode is proposed,and also validated by comparing with the PIC simulation results.The evolutions of the ion density distribution, the sheath expansion and IRW propagation during the whole ion extraction process are summarized in Fig.12.The major conclusions are as follows:
(i) The entire ion extraction process can be divided into three stages with the formation of the Langmuir sheath and the disappearance of the IRW-A after reaching the cathode sheath as the dividing points,i.e.,the electron oscillation and ion matrix sheath extraction stage,sheath expansion and IRW propagation stage,and plasma collapse stage.In stage II,depending on the relative values of the sheath expansion velocity and the ion acoustic velocity, the extraction process near the cathode can be further divided into two sub-stages,in which the sheath expansion is supersonic (stage II-1C) and/or subsonic (stage II-2C).While the ion extraction process near the anode can also be divided into two sub-stages according to whether the front of IRW reaches the anode or not.In the first sub-stage(stage II-1A),the remaining ions in the matrix sheath continue to be extracted,and the ion flux to the anode will be constant in the second sub-stage(stage II-2A).

Fig.12.Schematic diagram of the spatiotemporal evolutions of the ion number density distribution, sheath expansion, and IRW propagation during the whole ion extraction process.
(ii) Under the typical case studied in this paper, the ion extraction fluxes both to the cathode and anode obtained from the analytical model show a great agreement with the PIC simulation results.Considering the percentage of ions extracted att=text,the relative discrepancy between the analytical and numerical results is less than 2.2%.
(iii)The ratio of ions extracted during the electron oscillation and matrix sheath extraction process increases with the increase of the externally applied voltage,and decreases with the increase of the initial plasma number density and plasma width;while the initial electron temperature shows little effect on the ion extractions features in stage I.The remaining ions before the plasma collapse are only significantly related to the externally applied voltage.The higher the applied voltage,the more ions are extracted before the plasma collapse,while the other parameters have little influences on this aspect.
In practice, there may exist certain limitations when increasing the applied voltage to improve the ion extraction efficiency, and thus, the remaining ions before the plasma collapse cannot be efficiently reduced.Therefore, new methods based on the analytical model still need to be investigated in future research.In addition,since different electrode configurations,including Π type,M type,etc.,are often employed in actual applications,it is also indispensable to develop the twodimensional analytical model to describe the characteristics of the ion extraction process with complex electrode configurations facing various practical applications.
Appendix A:Derivation of the ion density distribution in a Langmuir sheath
As can be seen in Fig.A1, ignoring the electrons in a Langmuir sheath,the sheath function will be reduced to
whereu0is the normalized ion velocity entering the Langmuir sheath.For a high voltage sheath,series expansion can be conducted forφ ≫1,i.e.,
By employing the same assumptions as the derivation for the Langmuir flux in Ref.[38]that the potential and the electric field are both equal to 0 at the sheath edge, the electric potential distribution in the Langmuir sheath is
Assumingu0=1, the ion density distribution in a stable Langmuir sheath is then obtained as
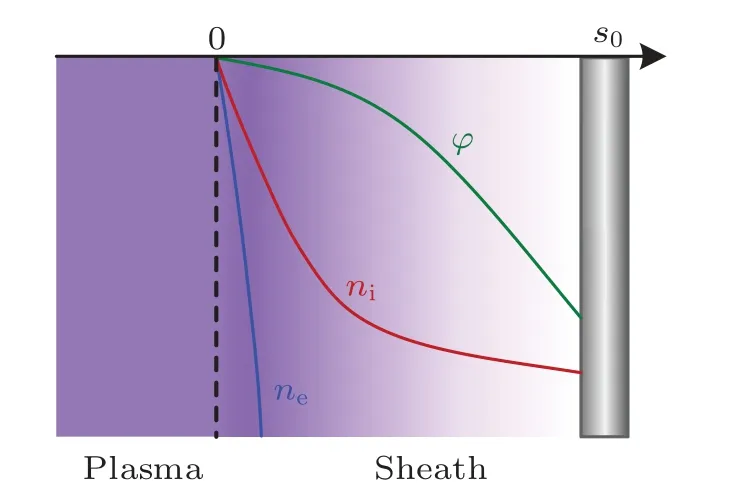
Fig.A1.Schematic diagram of the ion density, electron density, and electric potential distributions in a Langmuir sheath.
Appendix B:Derivation of the ion density distribution in the interaction region of two IRWs
In this section,we will consider such a system presented as Fig.B1, where region II refers to the interaction region,while regions I and III are the non-interacting regions only influenced by IRW-C and IRW-A,respectively.Att=0,IRW-C propagating in the positive direction will be excited atx=x1,while IRW-A propagating in the opposite direction will be excited atx=x2.
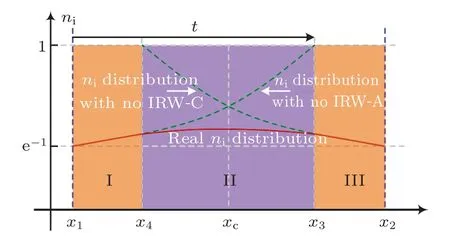
Fig.B1.Schematic diagram of the ion density distribution after the meet of the two IRW fronts.
Here we define the point with zero ion velocity asxc.Before the disappearance of IRW-A,xccan be expressed as
According to Ref.[7], the ion number density in the interaction region exhibits a parabolic distribution.Considering the symmetry,the ion density in region II can be expressed as
whereaandbare the parameters describing the parabolic relationship.
After a traveling time oft, the front of IRW-A arrives atx=x4=x2-t, while the front of IRW-C arrives atx=x3=x1+t.The ion density and its derivate atx=x3can be obtained with the property of the IRW as
Substituting Eq.(B3)into Eq.(B2),aandbcan be expressed as
After the disappearance of the IRW-A (t=tdis,an),xccan be written as
The ion number density and its derivate atx=x3are
Substituting Eq.(B6)into Eq.(B5),aandbcan be re-written as
The ratio of the difference between the ion density atx=xc[(n(xc)]andx=x3[n(x3)]ton(xc), denoted asη, can be employed to evaluate the uniformity of the ion density distribution in the interaction region,i.e.,
Before the disappearance of the IRW-A,
The rough range ofηis
After the appearance of the IRW-C,
The corresponding rough range ofηis
Therefore,it is reasonable to approximate that the spatial distribution of the ion number density in the interaction region is uniform.
Appendix C:Derivation of the ion extraction flux with a uniformly distributed ion number density and a linearly distributed ion velocity
After the disappearance of the IRW-A, the ion number density and velocity exhibit a parabolic and piecewise linear distribution, respectively.From the analysis in Appendix B,it is known that the ion number density is almost uniformly distributed in the interaction region.Thus, in this section,the plasmas with uniformly distributed ion number density and linear distributed ion velocity will be considered.For the plasma near the anode,the electric field can be neglected and the ion thermal pressure can also be ignored due to the low temperature of ions.Therefore, the governing equations describing the ion motions can be written as
Combining Eqs.(C1)and(C2),we can get that
wherefis an arbitrary function ofx.Thus, the ion number density evolution will be
wheren0refers to the ion number density att=0.So,the ion flux to the anode atx=Lwill be
Considering the initial value of the ion number density and the ion velocity,equation(C5)can be re-written as
Since the ion velocities atx=Landt=0 are both equal to 1,equation(C6)can be simplified as
It can be seen from Eq.(C7) that the ion extraction flux on the anode is approximately proportional tot-2in this stage.
Acknowledgement
Project supported by the National Natural Science Foundation of China(Grant No.11775128).
——读李东君的新作
- Chinese Physics B的其它文章
- Robustness of community networks against cascading failures with heterogeneous redistribution strategies
- Identifying multiple influential spreaders in complex networks based on spectral graph theory
- Self-similarity of complex networks under centrality-based node removal strategy
- Percolation transitions in edge-coupled interdependent networks with directed dependency links
- Important edge identification in complex networks based on local and global features
- Free running period affected by network structures of suprachiasmatic nucleus neurons exposed to constant light

