
晋城市大气VOCs污染特征及来源解析
2023-09-25 01:36:28张鹏辉胡冬梅牛伟利龚兴晓闫雨龙牛月圆董佳奇
中国环境科学 2023年9期
张鹏辉,胡冬梅*,彭 林,牛伟利,龚兴晓,闫雨龙,牛月圆,董佳奇
晋城市大气VOCs污染特征及来源解析
张鹏辉1,胡冬梅1*,彭 林2,牛伟利3,龚兴晓4,闫雨龙2,牛月圆1,董佳奇1
(1.华北电力大学环境科学与工程学院,资源环境系统优化教育部重点实验室,北京 102206;2.北京交通大学环境学院,北京 100044;3.晋城市生态环境局,山西 晋城 048000;4.山西省晋城生态环境监测中心,山西 晋城 048000)
采集晋城市环境空气挥发性有机物(VOCs)样品,分析不同风向下VOCs组分特征,运用特征比值法和正定矩阵因子分析模型(PMF)解析VOCs来源,采用混合单颗粒拉格朗日积分轨迹(HYSPLIT)追踪夏季典型污染过程区域VOCs传输贡献.结果表明,偏南风和偏北风主导风向下晋城市大气VOCs浓度分别为(19.4±7.1)和(33.3±17.3)μg/m3,偏北风时浓度约比偏南风时高近70%,北部工业园区对市区VOCs影响较大;各组分按浓度大小排序为烷烃>芳香烃>烯烃>炔烃,偏北风时烷烃和芳香烃浓度显著高于偏南风时,炔烃浓度相仿.偏南风和偏北风时臭氧生成潜势(OFP)分别为(50.5±17.1)和(84.30±44.0)μg/m3;不同风向下各组分贡献均为烯烃>烷烃>芳香烃>炔烃;北风风向下各VOCs组分及OFP小时变化幅度明显高于南风时,尤其早晚间和交通流高峰时段较为显著,北部工业园区和机动车排放源对市区影响突出.偏北风和偏南风时大气VOCs均受老化气团控制,不同风向下OFP及实际O3小时浓度变化呈相反趋势,河南北部接壤区域存在强潜在源区,其对晋城市夏季VOCs贡献率约为25.3%.本地燃烧源、机动车排放源和工业源是晋城市VOCs管控的重点源,尤其要重点加强北部工业企业和机动车排放源管控.
挥发性有机物(VOCs);污染特征;臭氧生成潜势(OFP);来源解析
大气臭氧(O3)已经成为夏季影响我国城市环境空气质量的首要污染物[1-4],其主要前体物为挥发性有机物(VOCs)和氮氧化物(NO)[5].北京、天津、长治等多城市O3敏感性分析指示城区O3多为VOCs主控区[6-9],准确识别VOCs来源对于大气O3污染防控至关重要.
VOCs组分众多、来源复杂,控制难度较大[10].研究表明,汽车尾气、煤炭燃烧和液化石油气/天然气(LPG/NG)是北京市VOCs重要源,且其贡献随环保管控政策的实施呈明显时间变化,随着燃煤管控实施,燃煤源对VOCs贡献从2014年26.3%~45.1%,下降到2016年22.3%,同时汽车尾气贡献呈上升趋势,从44.1%上升至50.0%[11-13].此外,城市产业布局也对VOCs有重要影响.雄安市拉链加工、油墨印刷、聚乙烯吹膜行业排放的苯系物OFP贡献率分别为80.87%、89.63%、85.97%[14].除本地排放外,VOCs还受到区域传输的影响.上海市VOCs区域传输贡献为22.1%~41.9%,且呈现上升趋势[15]. VOCs及O3污染区域联防联控的需求愈加强烈和迫切.
晋城市位于山西省东南部,主要产业为煤炭、钢铁、煤化工、焦化、水泥等,是典型的重工业型城市. 2019~2022年晋城市O3浓度分别为201μg/m3, 176μg/m3,180μg/m3,181μg/m3,近年来夏季O3污染形势严峻,且常与河北南部、河南北部、山东西南部城市构成区域性O3污染.本研究以晋城市O3污染较重的夏季(2022年6月)为研究时段,采集大气VOCs样品,解析不同主导风向下晋城市VOCs污染特征、主要来源及O3生成潜势,为晋城市大气VOCs及O3污染防控提供科学依据.
1 材料与方法
1.1 样品采集
晋城市是山西省东南部重要的重工业城市,与河南、山东等区域接壤,其地理位置及大气VOCs采样点位如图1所示.大气VOCs样品采集点位为国家空气质量监测站点(E112.863539,N35.493759),该采样点位于晋城市区人群密集处,能够较好反映晋城市区VOCs污染特征及人群健康影响.
采样时间为2022年6月1日~31日,其中5d为O3清洁天,26d为O3污染天,采集设备为国家VOCs组分站在线监测设备,采样时间分辨率为1h,每天24个样品.采样期间,同步记录当日的温度、风速、风向等气象条件.
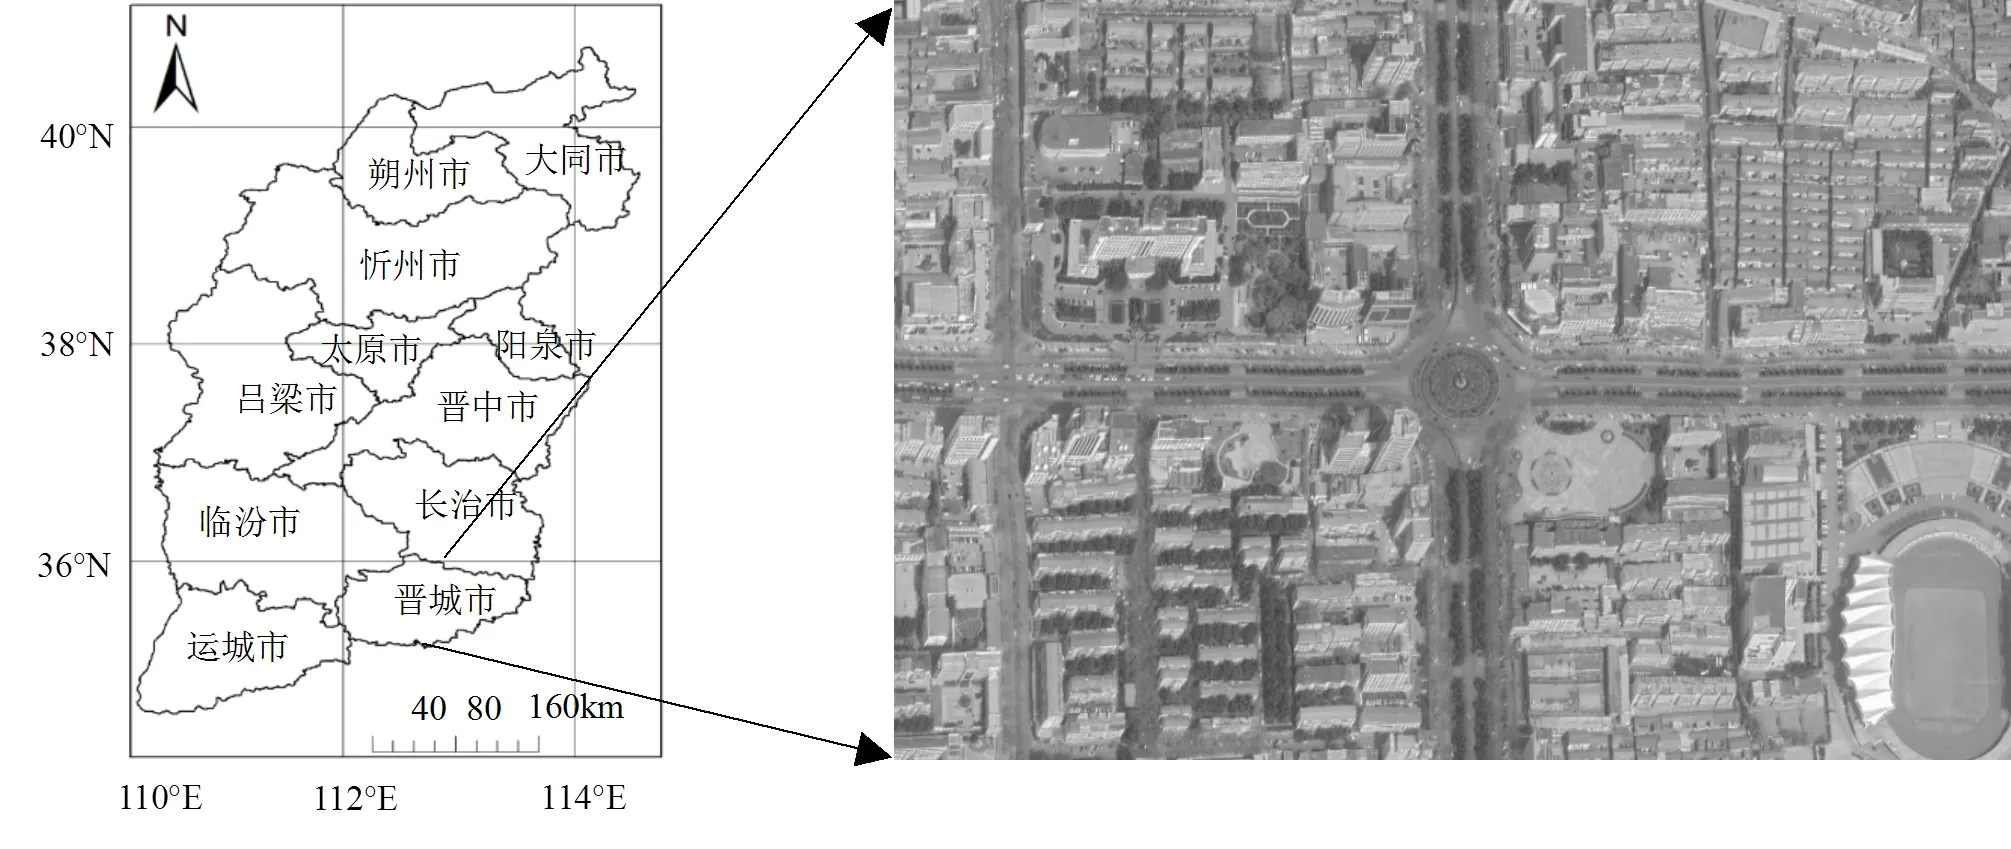
图1 晋城市地理位置及大气VOCs采样点分布
1.2 数据预处理
将VOCs组分数据按浓度从小到大排序,当VOCs组分数据浓度大于MAX或者小于MIN时,认定其为离群值[16],MAX及MIN计算如式(2)和(3).除去离群值后共得到有效VOCs数据589组,将小时VOCs数据与气象数据对应共同用于污染特征分析.


式中:为第25百分位数;为第75百分位数;为第25百分位数与第75百分位数差值的绝对值; MAX为最大范围;MIN为最小范围.
1.3 研究方法
1.3.1 臭氧生成潜势 VOCs作为O3前体物,其O3生成潜势受VOCs浓度、反应活性和气象条件等因素共同影响.Carter[17]提出最大增量反应活性(MIR)概念来评估理想条件下VOCs物种通过化学反应产生O3的能力,计算公式为:
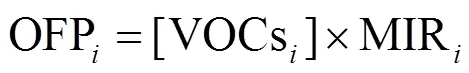
式中:OFP指第个VOCs物种的臭氧生成潜势,μg/m3;MIR指第个VOCs物种的最大增量反应系数,以O3/VOCs计,g/g,不同组分的MIR值见文献[17].
1.3.2 PMF模型 正定矩阵因子分析模型(PMF)是一种多变量因子分析模型,常基于大气VOCs组分观测数据用于VOCs来源解析[18].PMF模型计算原理由式(5)给出,样本数据的不确定度由式(6)计算.
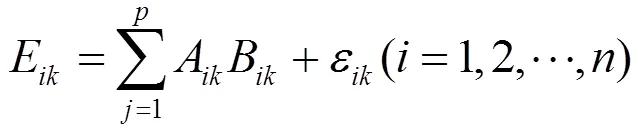
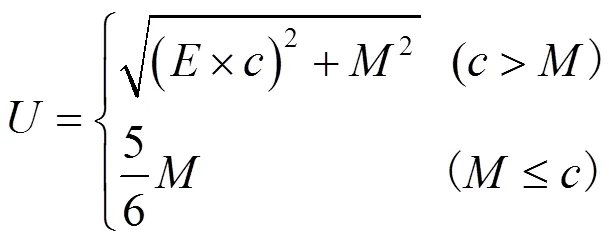
式中:E为次观测的污染物的浓度;为因子;A和B分别表示源成分谱和源贡献;ε为残差;为样本的不确定度;为误差比例;为VOCs种类的实测浓度;为VOCs种类的检出限.在PMF模型的源分配中,目标函数采用迭代最小化算法求解,且值必须尽可能小.目标函数定义在式(7)中.

式中:σ表示样本的不确定偏差.
1.3.3 HYSPLIT4模式 除本地排放外,VOCs污染也会受到区域污染物传输的影响.本研究针对晋城市夏季典型O3污染过程,采用混合单颗粒拉格朗日积分轨迹(HYSPLIT)计算气团轨迹,追踪VOCs区域污染来源[19-21].采用Meteoinfo软件中的HYSPLIT模型,模拟了观测内500m高度到达采样点的48h后轨,聚类分析了不同观测周期下气团轨迹的来源方向[22].
CWT方法基于污染物浓度对轨迹进行加权,定量反映轨迹的浓度贡献.本研究采用CWT法对晋城市VOCs潜在源区进行划分,将研究区域划分为0.2°× 0.2°网格单元阵列.CWT由以下式确定:
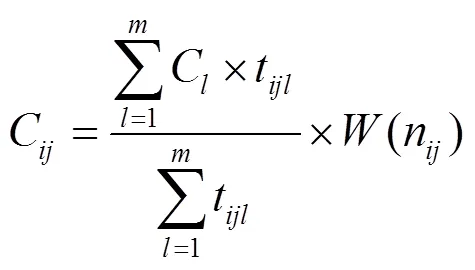
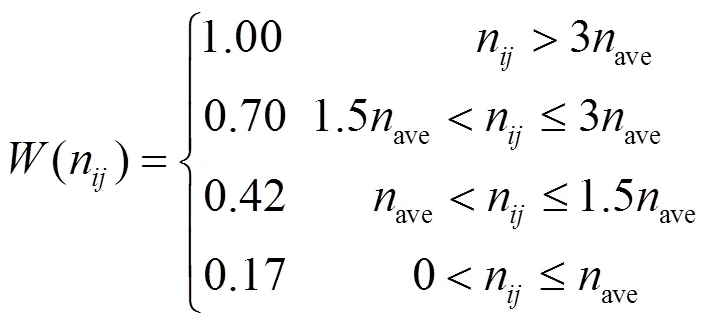
式中:C为单元中后向轨迹的平均权重浓度;C是轨迹对应的VOCs浓度;t是轨迹在单元中停留的时间;权重函数(n)用于减少不确定性;n代表单元中端点的数量,ave为每个网格的平均轨迹端点数.
2 结果与讨论
2.1 晋城市夏季VOCs及组分特征
共分析56种VOCs组分,其中烷烃29种、芳香烃16种、烯烃10种、炔烃1种.将风向角度为90°~270°的风定义为偏南风,风向角度为0°~90°和270°~360°的风定义为偏北风.观测期间,偏南风出现的频数为402,频率为55.8%;偏北风出现的频数为318,频率为44.2%.如图2所示,晋城市夏季偏北风向下总VOCs平均质量浓度为(33.3±17.3)μg/m3,其中烷烃和芳香烃含量最高,分别为(21.1±12.4)和(7.4±4.5)μg/m3,占比为63.4%和22.1%;烯烃和炔烃含量偏低,分别为(2.9±1.4)和(1.9±1.6)μg/m3,占比为8.7%和5.8%.其中,浓度较高的VOCs化合物主要有异戊烷、乙烷、丙烷、正丁烷、苯、甲苯、乙炔、正戊烷、乙烯、异丁烷等,以异戊烷和乙烷浓度最高,分别为(4.0±3.6)和(3.9±1.4)μg/m3.偏南风作用时晋城市总VOCs平均质量浓度(19.4±7.1)μg/m3,约比偏北风作用下低41.7%,其中烷烃和芳香烃含量依然最高(占比60.9%和18.0%,烯烃和炔烃含量偏低(占比11.7%和9.4%),浓度最高的VOCs化合物为乙烷和丙烷.南风和北风作用下晋城市VOCs组分占比表明,偏北风向下工业源、燃烧源和溶剂使用源对晋城市区VOCs的影响更大.
晋城市夏季VOCs浓度组成与国内其他城市比较见表1.晋城市VOCs浓度显著低于郑州、成都、阳泉等地,与北京、天津、太原接近,VOCs浓度水平较低.从组分看,天津、郑州和太原等城市与晋城市烷烃占比相当.相关研究表明,烷烃主要来自机动车尾气排放、油气挥发以及燃烧[23].晋城市烯烃占比与北京、郑州接近,其中乙烯浓度贡献较高,乙烯等烯烃类物质主要来自机动车排放、燃烧和溶剂使用[24].炔烃所包括的物质主要为乙炔,乙炔是燃烧源的指示物种[25],晋城市炔烃的占比明显高于其他城市,表明燃烧源对晋城市VOCs的贡献较大.晋城市芳香烃占比相对较低,与天津、太原和阳泉相当,芳香烃主要来自溶剂使用源[26],其挥发性会随着温度上升增强.
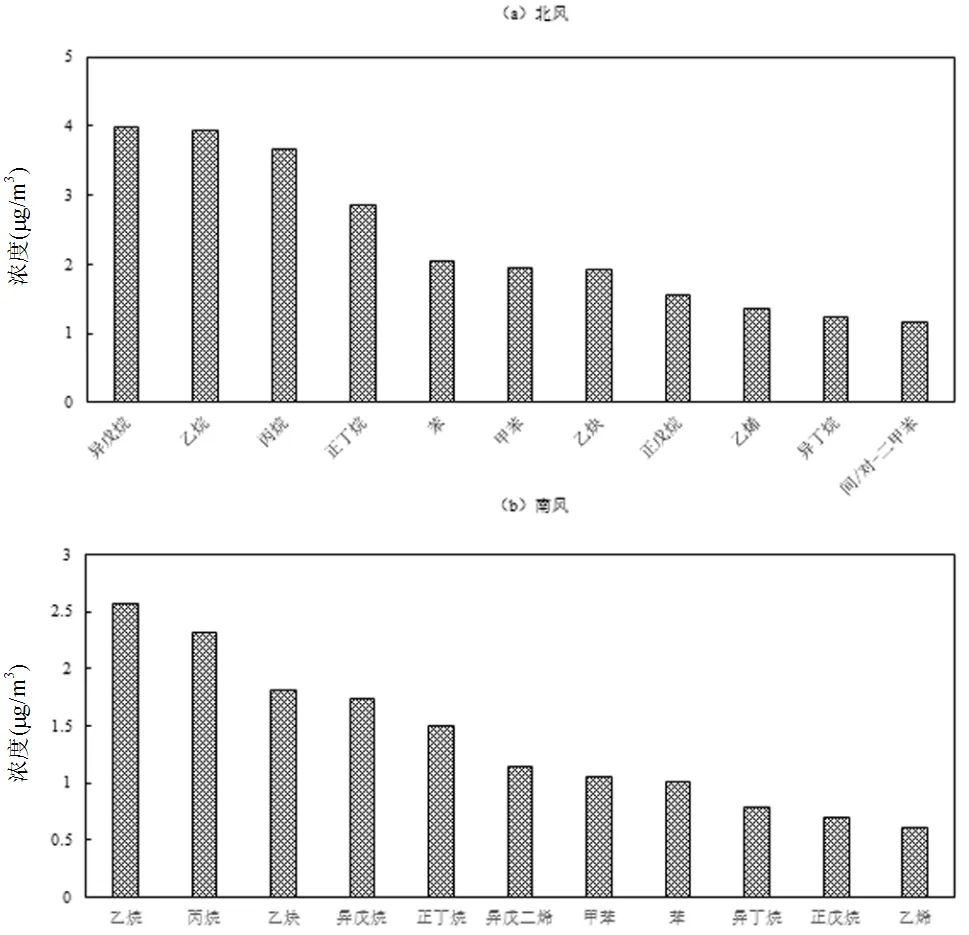
图2 偏北风和偏南风下晋城大气VOCs排名前10物种
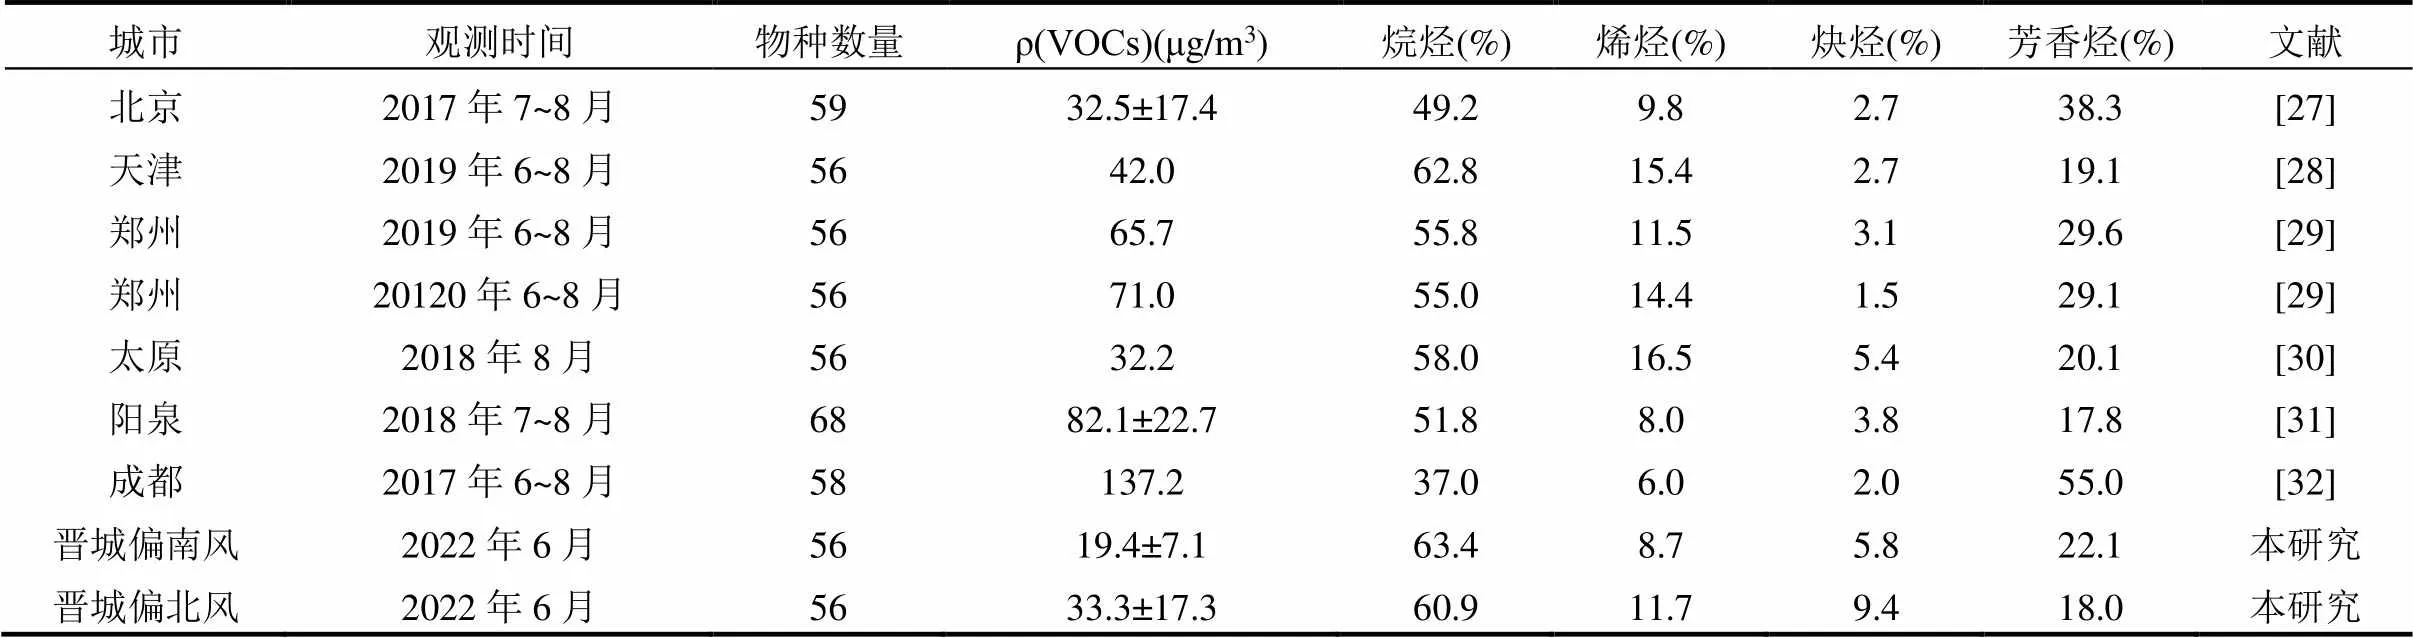
表1 晋城市夏季VOCs浓度组成与国内其他城市比较
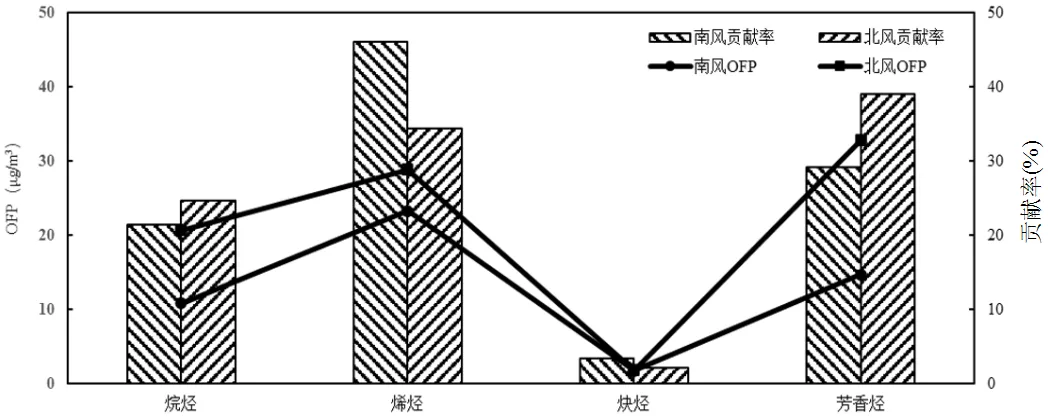
图3 晋城市夏季大气VOCs各组分OFP及贡献率
臭氧生成潜势(OFP)可定量反映VOCs组分对O3生成的贡献,南风和北风风向下OFP值分别为(50.5±17.1)和(84.30±44.0)μg/m3,各组分贡献均为烯烃>烷烃>芳香烃>炔烃,且北风风向下烷烃、芳香烃和烯烃OFP值均高于南风,炔烃相差不大(见图3).
偏北风向下晋城市TVOC、烷烃、烯烃、芳香烃、OFP生成浓度及NO小时浓度高于偏南风向,尤其早晚间和交通流高峰时段较为显著(见图4(a)、4(b)和4(h)),而南风风向下各VOCs组分及OFP变化较小,一定程度指示了北部工业园区和机动车排放源对市区影响较为突出.
值得注意的是,不同风向下的O3浓度则呈相反趋势,偏南风作用下晋城市O3小时浓度均高于偏北风作用下(图4(c)),表明除本地生成的O3外,南部可能存在较多的区域污染物传输贡献.
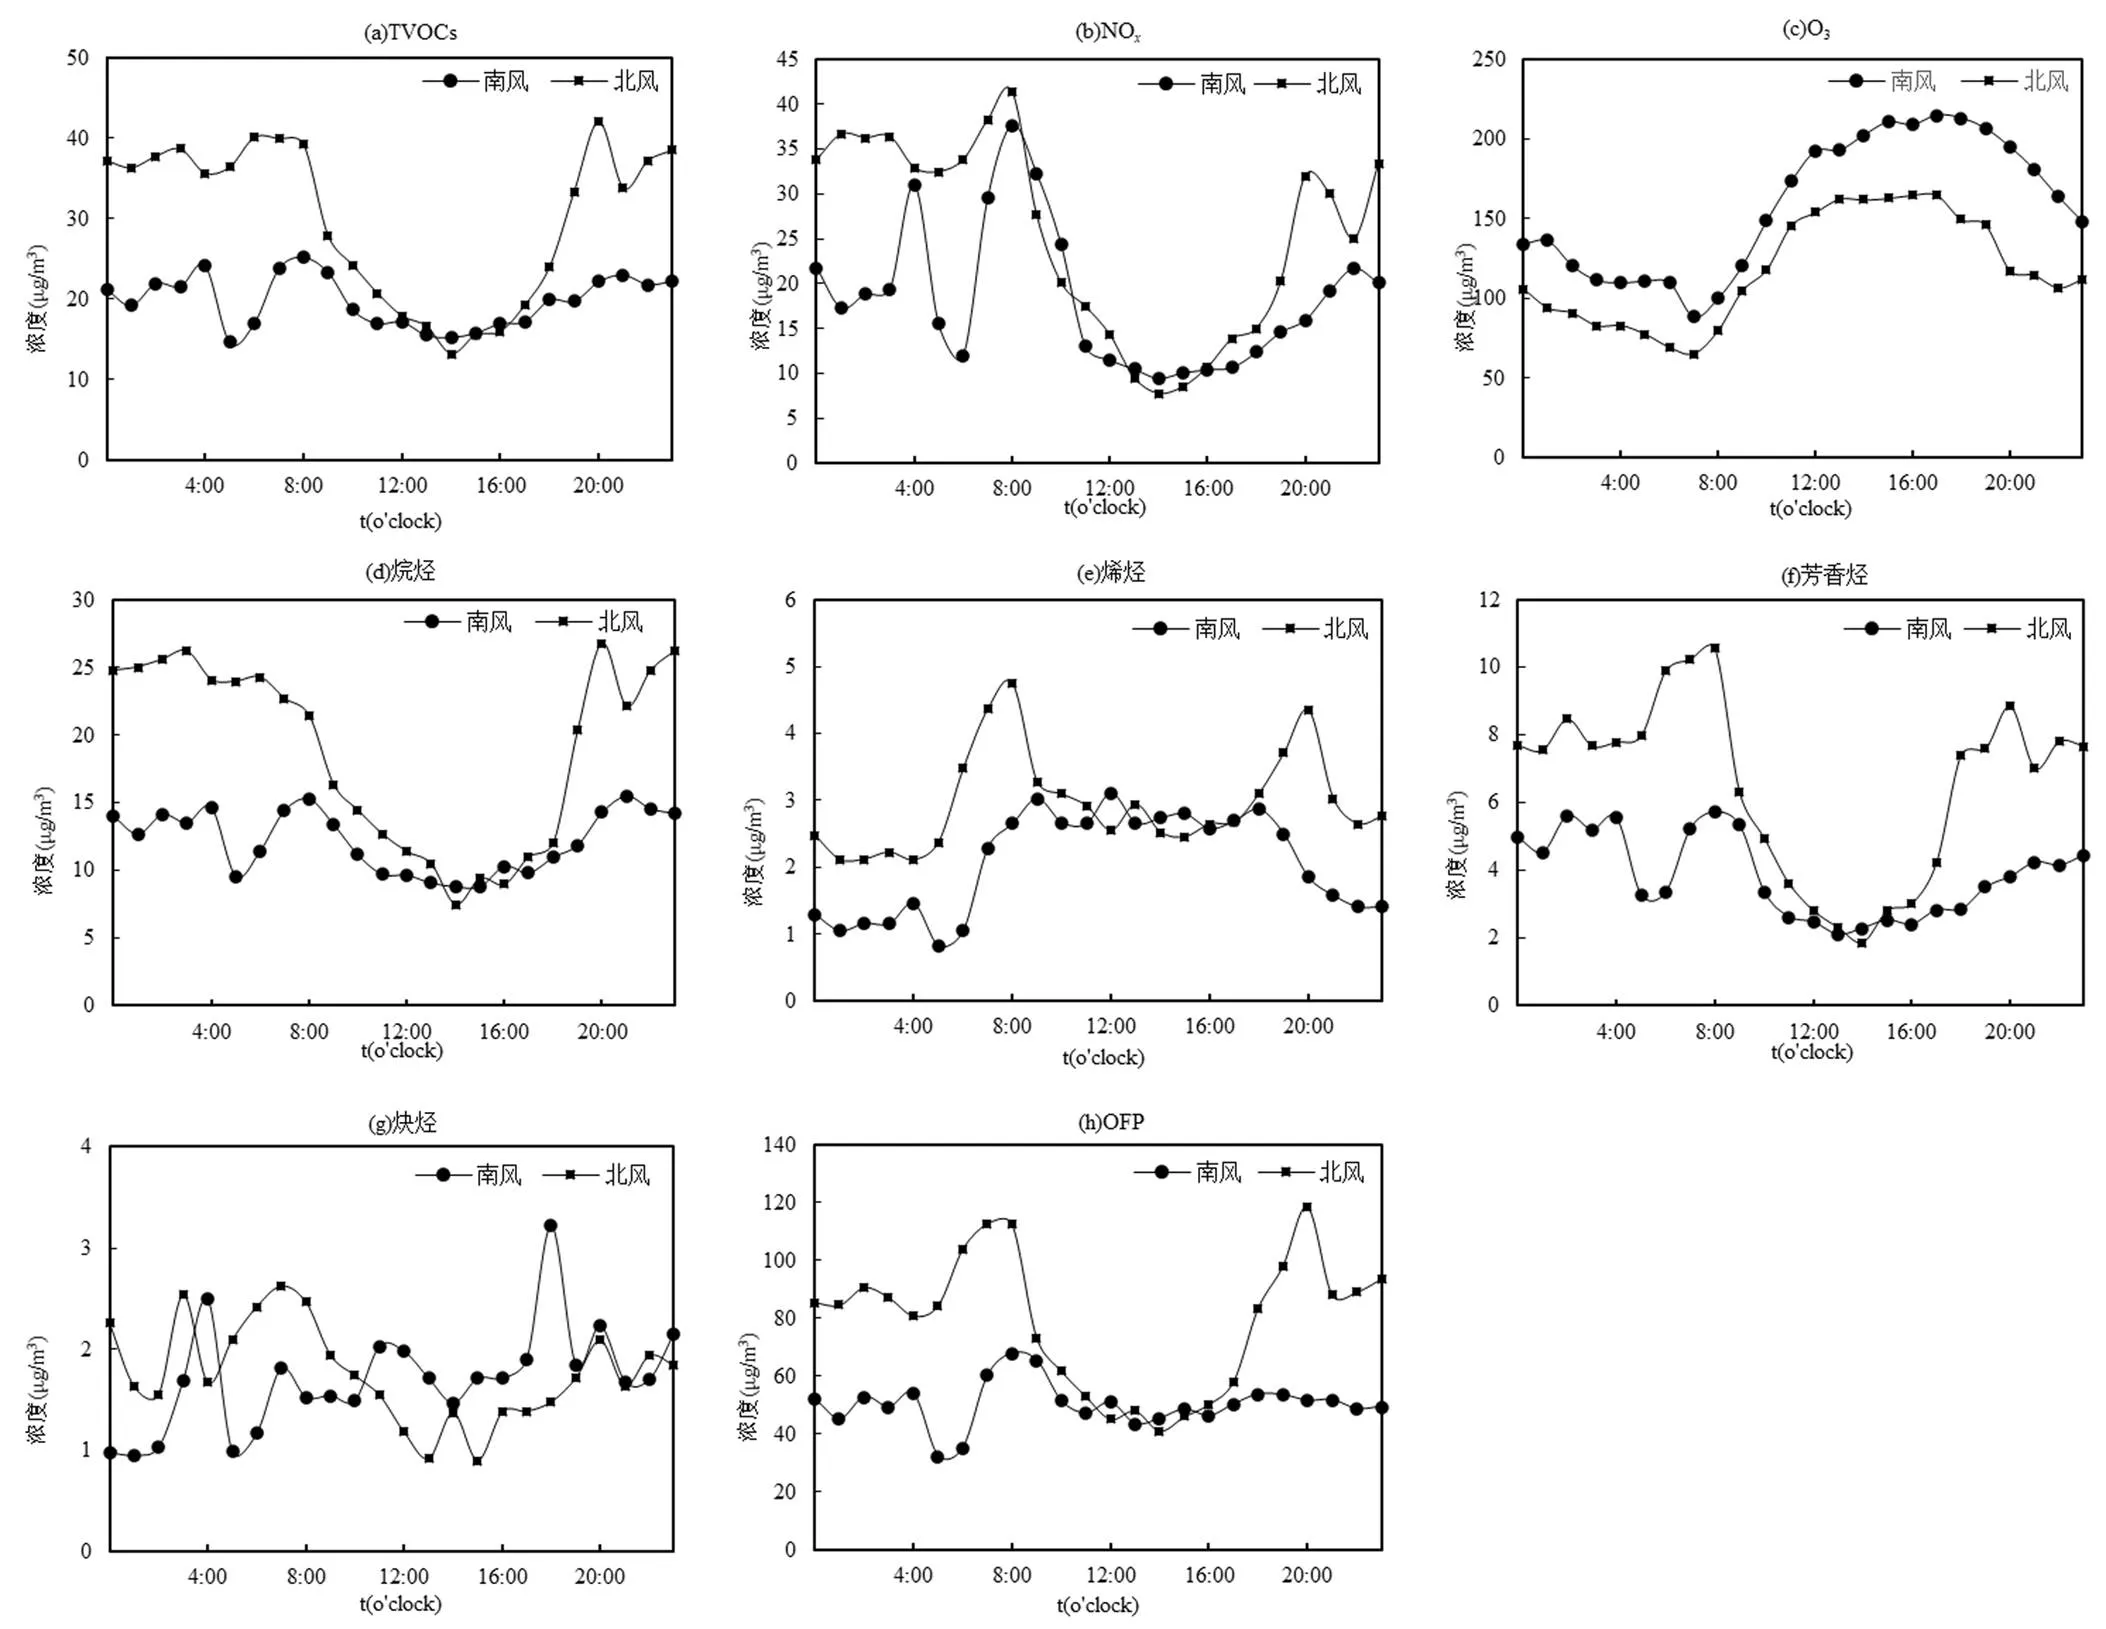
图4 偏北风和南风下晋城市大气主要污染物小时浓度变化特征
2.2 VOCs来源解析
2.2.1 比值分析 苯和甲苯比值(B/T)常用来分析大气中VOCs的主要来源,当B/T值<0.2、0.2~1、1~1.5、1.5~2.2和>2.5时,分别指示大气中VOCs受溶剂使用源、机动车排放源、燃烧源、燃煤和生物质燃烧的影响较大[33-35].虽然苯、乙苯和间对二甲苯具有一定的同源性,但在大气中的老化速度有明显差异,二甲苯与自由基的反应速度约为乙苯的3倍,因此可用乙苯与间/对-二甲苯的比值(E/X)或苯与间/对-二甲苯比值(B/X)来判断气团的寿命[36].当E/X>0.33或B/X>1.7时,初步判断该区域气团老化程度较大[31,37].异戊烷与正戊烷在大气中的存活时间相似,通过其比值(I/N)可初步分析VOCs的可能来源.我国隧道实验和汽油挥发I/N值分别为2.9和3.8,而燃煤源I/N值介于0.56~0.8[38-39],当I/N值在3.1左右时VOCs主要来源于汽车和工业共同排放,通常是由工业油气的逸散挥发、机动车尾气和蒸发损失等原因引起[40].
2022年夏季南风风向下晋城市B/T在0.4~3.3之间,平均值为(1.0±0.5);北风风向下为0.2~6.2,平均值为(1.4±0.9),初步判断南风风向下VOCs排放受机动车排放和燃烧源的影响较大,北风风向下受燃烧源的影响较大,且燃烧源中燃煤源的影响较大.南风和北风风向下E/X分别在0.3~1.2和0.2~0.8,均值分别为(0.5±0.1)和(0.4±0.1);B/X分别在0.3~13.0和0.2~15.6,均值分别为(3.0±2.3)和(2.8±2.2),采样期间位于夏季且晴天居多,VOCs反应较快,加之区域传输的作用,因而初步判断晋城市环境空气中VOCs受老化气团控制.南风风向下I/N在1.6~6.5之间,北风风向下在1.3~5.5之间,平均值分别为(2.5±0.4)和(2.5±0.5),判断晋城市VOCs受汽油挥发的影响较大.综上,不同风向下B/T、E/X、B/X和I/N值结果较为接近,初步研判为VOCs排放主要受汽油挥发、机动车排放及燃烧源影响.

2.2.2 PMF分析 采用PMF5.0模型对晋城市区环境空气VOCs进行定量来源解析,最终选取源指示性较强和较稳定的34种VOCs参与模型运算.因子1中载荷贡献最大的物种是异戊二烯,认作植物排放源[41].因子2中载荷较大的物种有乙烷、丙烷、异戊烷、正丁烷、甲苯、苯、乙苯、间对二甲苯等,认作机动车排放源[42-43].因子3中,邻、间、对二甲苯、1,2,4-三甲基苯、1,2,4-三甲基苯等物种载荷贡献较高,认作溶剂使用源[44-45].乙烷、丙烷除天然气和液化石油气挥发外,燃烧源中也有排放,丙烯等C2~C4烯烃也来自于燃煤,乙炔和乙烯是燃煤源示踪剂,故因子4是主要来自于工业燃煤的燃烧源[43].因子5中载荷贡献较大的物种除C2~C6等短链烃外,还有甲苯、乙苯和间/对-二甲苯等芳香烃,这些物种通常是钢铁、焦化、煤化工等行业在产品生产中的排放,故因子5认作工业源[46].
经计算(图6),南风风向下晋城市夏季VOCs排放主要来源为燃烧源(28.7%)、机动车排放源(26.1%)和工业源(23.2%),北风风向下主要为工业源(31.4%)、机动车排放源(31.1%)和燃烧源(22.5%).因此,燃烧源、机动车排放源和工业源是晋城市VOCs管控的重点源,北风时尤其要重点加强北部工业企业排放和北部机动车排放源管控.
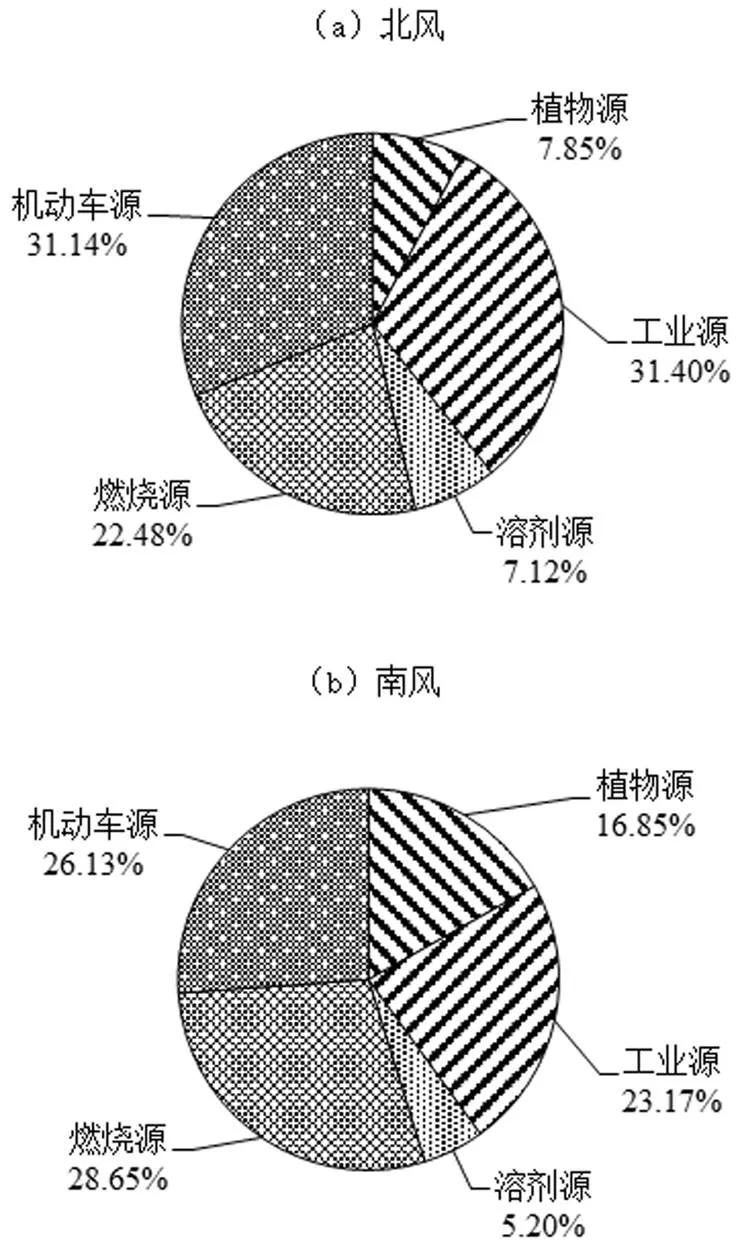
图6 不同风向下晋城大气VOCs来源贡献
2.3 区域传输对晋城市VOCs影响分析
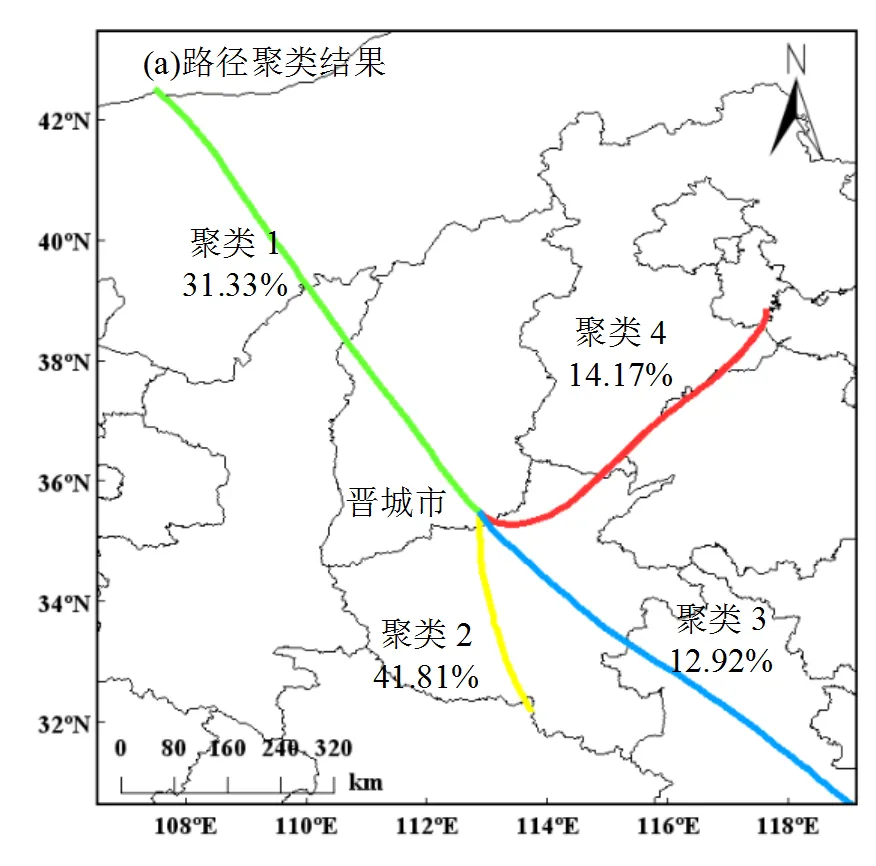
对2022年晋城市夏季典型O3污染过程进行6h后向轨迹模拟分析,共589条气团轨迹.气团聚类获得4条典型污染路径(图7(a)).路径1为西北路径,经内蒙古、陕西北部南下进入晋城,包含276条气团轨迹,占所有轨迹的46.9%;路径2为正南路径,气团由河南沿正北向上,占26.1%;路径3为东南路径,从安徽北部进入河南,占11.4%;路径4为偏东路径,起源于京津冀地区由偏南回流引起,比例为15.6%.路径1~4平均VOCs浓度分别为30.0,24.4,29.0和19.6μg/m3,表明西北方向气团和东南路径气团对城市VOCs影响最大,其次为正南路径.
CWT定量解析结果表明,晋城市大气VOCs强潜在源区集中在晋城本地北部区域和东南部与焦作接壤区域(图7(b)),一方面印证了北部工业企业及机动车排放源是晋城市VOCs主要来源,另一方面也定量展示了河南北部区域存在强潜在源区,其对晋城市夏季VOCs贡献率约为25.3%.
3 结论
3.1 偏南风和偏北风主导时晋城市VOCs浓度分别为(19.4±7.1)和(33.3±17.3)μg/m3,后者较前者高近70%;不同风向下各组分贡献均为烷烃>芳香烃>烯烃>炔烃,偏北风时烷烃和芳香烃浓度显著高于偏南风时,炔烃浓度相仿.
3.2 偏南风和偏北风时晋城市OFP值分别为(50.5±17.1)和(84.3±44.0)μg/m3;不同风向下各组分贡献均为烯烃>烷烃>芳香烃>炔烃;北风风向下各VOCs组分及OFP变化较大,尤其早晚间和交通流高峰时段较为显著,南风时变幅较小,北部工业园区和北部机动车排放源对市区影响较为突出.
3.3 偏北风和偏南风时晋城大气VOCs均受老化气团控制;不同风向下OFP及实际O3小时浓度变化呈相反趋势,除晋城本地排放外,河南北部接壤区域存在强潜在源区,其对晋城市夏季VOCs贡献率约为25.3%.
3.4 燃烧源、机动车排放源和工业源是晋城市VOCs管控的重点源,尤其要重点加强北部工业企业排放和北部机动车排放源管控.
[1] Li K, Jacob D J, Liao H, et al. Anthropogenic drivers of 2013~2017 trends in summer surface ozone in China [J]. Proceedings of the National Academy of Sciences of the United States of America, 2019, 116(2):422-427.
[2] Lu X, Zhang L, Wang X, et al. Rapid Increases in warm-season surface ozone and resulting health impact in China since 2013 [J]. Environmental Science & Technology Letters, 2020,7(4):240-247.
[3] 杨 俊,布 多,刘 君,等.我国城市臭氧污染防治现状研究综述[J]. 环境与可持续发展, 2022,47(4):86-90.Yang J, Bu D, Liu J, et al.Research review on urban ozone pollution control in China [J]. Environment and sustainable development, 2020,7(4):240-247.
[4] 陈多宏,沈 劲,陈瑶瑶,等.2020年珠三角区域臭氧污染特征及主要成因分析[J/OL]. 中国环境科学, 2022,DOI:10.19674/ j.cnki.issn1000-6923.20220616.007. Chen D H, Shen J, Chen Y Y, et al. Characteristics and main causes of ozone pollution in the pearl river delta in 2020 [J/OL]. China Environmental Science, 2022,DOI:10.19674/j.cnki.issn1000-6923. 20220616.007.
[5] 崔虎雄,吴迓名,高 松,等.上海城区典型污染过程VOCs特征及臭氧潜势分析[J]. 环境科学, 2011,32(12):3537-3542. Cui H X, Wu Y M, Gao S, et al. Characteristics of ambient VOCs and their role in O3formation: a typical air pollution episode in Shanghai urban area [J]. Environmental Science, 2011,32(12):3537-3542.
[6] Zhang X, Li H, Wang X Z, et al. Heavy ozone pollution episodes in urban Beijing during the early summertime from 2014 to 2017: Implications for control strategy [J]. Environmental Pollution, 2021, DOI:10.1016/j.envpol.2021.117162.
[7] 张 蕊,孙雪松,王 裕,等.北京市城区夏季大气VOCs变化特征及臭氧生成潜势[J]. 环境科学, 2023,44(4):1954-1961. Zhang R, Sun X S, Wang Y, et al. Variation characteristics and ozone formation potential of ambient VOCs in urban Beijing in summer [J]. Environmental Science, 2023,44(4):1954-1961.
[8] 陈泽鑫,古金霞,霍光耀,等.天津市挥发性有机物污染特征与来源及其O3生成潜势[J]. 环境污染与防治, 2022,44(2):201-205. Chen Z X, Gu J X, Huo G Y, et al.Pollution characteristics and sources of volatile organic compounds and their O3formation potential in Tianjin [J]. Environmental Pollution & Control, 2022,44(2):201- 205.
[9] 张翔宇.长治市环境空气中挥发性有机物来源解析及环境影响研究[D]. 北京:华北电力大学, 2022. Zhang X Y. Source analysis and environmental impact study of volatile organic compounds in Changzhi [D]. Beijing: North China Electric Power University, 2022.
[10] Atkinson R, Arey J. Atmospheric degradation of volatile organic compounds [J]. Chemical Reviews, 2003,103(12):4605-4638.
[11] Li J, Xie S D, Zeng L M, et alCharacterization of ambient volatile organic compounds and their sources in Beijing, before, during, and after Asia-Pacific Economic Cooperation China 2014 [J]. Atmospheric Chemistry and Physics, 2015,15(14):7945-7959.
[12] Shi Y Q, Xi Z Y, Simayi M, et al. Scattered coal is the largest source of ambient volatile organic compounds during the heating season in Beijing [J]. Atmospheric Chemistry and Physics, 2020,20(15):9351- 9369.
[13] Yang W Q, Zhang Y L, Wang X M, et al. Volatile organic compounds at a rural site in Beijing: influence of temporary emission control and wintertime heating [J]. Atmospheric Chemistry and Physics, 2018, 18(17):12663-12682.
[14] 王学臣,王 帅,刘大喜,等.典型工业源挥发性有机物排放特征及臭氧生成潜势分析[J]. 环境污染与防治, 2020,42(11):1387-1391. Wang X C, Wang S, Liu D X, et al. VOCs emission characteristics and ozone formation potential analysis of typical industrial sources [J]. Environmental Pollution & Control, 2020,42(11):1387-1391.
[15] Liu Y H, Wang H L, Jing S G, et al. Strong regional transport of volatile organic compounds (VOCs) during wintertime in Shanghai megacity of China [J]. Atmospheric Environment, 2021,244,117940.
[16] Frigge M, Hoaglin D C, Iglewicz B. Some Implementa- tions of the Boxplot [J]. The American Statistician, 1989,43:50-54.
[17] Carter W P L. Development of ozone reactivity scales for volatile organic compounds [J]. Air & Waste, 1994,44(7):881-899.
[18] Norris G, Duvall R, Brown S, et al. EPA positive matrix factorization (PMF) 5.0 fundamentals and user guide [R]. Washington, DC, USA: EPA, 2014.
[19] 徐祥德,周 丽,周秀骥,等.城市环境大气重污染过程周边源影响域[J]. 中国科学:地球科学, 2004,34(10):958-966. Xu X D, Zhou L, Zhou X J, et al. The influence domain of the surrounding sources in the process of heavy atmospheric pollution in urban environment [J]. Scientia Sinica(Terrae), 2004,34(10):958-966.
[20] 王 茜.利用轨迹模式研究上海大气污染的输送来源[J]. 环境科学研究, 2013,26(4):357-363. Wang Q. Study of air pollution transportation source in shanghai using trajectory model [J]. Research of Environmental Sciences, 2013,26(4): 357-363.
[21] Wang Y. Q, Zhang X Y, Draxler R R. TrajStat: GIS-based software that uses various trajectory statistical analysis methods to identify potential sources from long-term air pollution measurement data [J]. Environmental Modelling & Software, 2009,24(8):938-939.
[22] Davis R E, Normile C P, Sitka L, et al. A comparison of trajectory and air mass approaches to examine ozone variability [J]. Atmospheric Environment, 2010,44(1):64-74.
[23] 陆嘉晖,吴 影,刘慧琳,等.南宁市冬季挥发性有机物特征及其来源分析[J]. 中国环境科学, 2022,42(8):3616-3625. Lu J H, Wu Y, Liu H L, et, al.Characteristics and sources of volatile organic compounds (VOCs) in winter over Nanning of China [J]. China Environmental Science, 2022,42(8):3616-3625.
[24] 邓思欣,刘永林,司徒淑娉,等.珠三角产业重镇大气VOCs污染特征及来源解析[J]. 中国环境科学, 2022,41(7):2993-3003. Deng S X, Liu Y L, Situ S P, et, al.Characteristics and source apportionment of volatile organic compounds in an industrial town of Pearl River Delta. [J]. China Environmental Science, 2022,41(7): 2993-3003.
[25] 马 静,燕莹莹,孔少飞,等.武汉军运会前后臭氧及其前体物的特征和来源[J]. 中国环境科学, 2022,42(7):3023-3032. Ma J, Yan Y Y, Kong S F, et, al.Characteristics and sources of ozone and its precursors around the Wuhan Military Games [J]. China Environmental Science, 2022,42(7):3023-3032
[26] 张浩然,刘 敏,王小嫚,等.南昌市2021年春季大气VOCs污染特征和来源分析[J]. 中国环境科学, 2022,42(3):1040-1047. Zhang H R, Liu M, Wang X M, et, al.Characteristics and sources of atmospheric VOCs during spring of 2021in Nanchang [J]. China Environmental Science, 2022,42(3):1040-1047.
[27] Zhang L H, Li H, Wu Z H, et al. Characteristics of atmospheric volatile organic compounds in urban area of Beijing: Variations, photochemical reactivity and source apportionment[J]. Journal of Environmental Sciences (China), 2020,95:190-200.
[28] 王文美,高璟赟,肖致美,等.天津市夏季不同臭氧浓度级别VOCs特征及来源[J]. 环境科学, 2021,42(8):3585-3594. Wang W M, Gao J Y, Xiao Z M, et al. Characteristics and sources of VOCs at different ozone concentration levels in Tianjin [J]. Environmental Science, 2021,42(8):3585-3594.
[29] 齐一谨,王玲玲,倪经纬,等.郑州市夏季大气VOCs污染特征及来源解析[J]. 环境科学, 2021,43(12):5429-5441. Qi Y J, Wang L L, Ni J W, et al.Characteristics and source apportionment of ambient summer volatile organic compounds in Zhengzhou, China [J]. Environmental Science, 2021,43(12):5429- 5441.
[30] 司雷霆,王 浩,李 洋,等.太原市夏季大气VOCs污染特征及臭氧生成潜势[J]. 中国环境科学, 2019,39(9):3655-3662. Si L T, Wang H, Li Y, et al. Pollution characteristics and ozone formation potential of ambient VOCs in summer in Taiyuan [J]. China Environmental Science, 2019,39(9):3655-3662.
[31] 牛月圆,刘倬诚,李如梅,等.阳泉市区夏季挥发性有机物污染特征、来源解析及其环境影响 [J]. 环境科学, 2020,41(7):3066-3075. Niu Y Y, Liu Z C, Li R M, et al. Characteristics, source apportionment, and environmental lmpact of volatile organic compounds in summer in Yangquan [J]. Environmental Science, 2020,41(7):3066-3075.
[32] 徐晨曦,陈军辉,韩 丽,等.成都市2017年夏季大气VOCs污染特征、臭氧生成潜势及来源分析 [J]. 环境科学研究, 2019,32(4):619- 626. Xu C X, Chen J H, Han L, et al. Analyses of pollution characteristics, ozone formation potential and sources of VOCs atmosphere in Chengdu city in summer 2017[J]. Research of Environmental Science, 2019,32(4):619-626.
[33] 张翼翔,尹沙沙,袁明浩,等.郑州市春季大气挥发性有机物污染特征及源解析[J]. 环境科学, 2019,40(10):4372-4381. Zhang Y X, Yin S S, Yuan M H, et al.Characteristics and source apportionment of ambient VOCs in spring in Zhengzhou [J]. Environmental Science, 2019,40(10):4372-4381.
[34] 张 栋,于世杰,王 楠,等.郑州市冬季VOCs污染特征、来源及健康风险评估[J]. 环境科学学报, 2020,40(8):2935-2943. Zhang D, Yu S J, Wang N, et al. Characteristics, sources and health risk assessment of ambient VOCs in winter of Zhengzhou [J]. Acta Scientiae Circumstantiae, 2020,40(8):2935-2943.
[35] Liu Y F, Kong L W, Liu X G, et al. Characteristics, secondary transformation, and health risk assessment of ambient volatile organic compounds (VOCs) in urban Beijing, China [J]. Atmospheric Pollution Research, 2021,12(3):33-46.
[36] Hui L R, Liu X G, Tan Q W, et al. VOC characteristics, sources and contributions to SOA formation during haze events in Wuhan, Central China [J]. Science of The Total Environment, 2019,650(2):2624-2639.
[37] Yurdakul S, Civan M, Kuntasal Ö, et al. Temporal variations of VOC concentrations in Bursa atmosphere [J]. Atmospheric Pollution Research, 2018,9(2):189-206.
[38] 聂 烨,彭 瑾,王祖武,等.黄石市大气挥发性有机物污染特征及源解析[J]. 环境科学与技术, 2021,44(S1):183-190. Nie Y, Peng J, Wang Z W, et al. Pollution characteristics, ozone formation potential, and sources of atmospheric volatile organic compounds in huangshi [J]. Environmental Science & Technology, 2021,44(S1):183-190.
[39] Zheng H, Kong S F, Xing X L, et al. Monitoring of volatile organic compounds (VOCs) from an oil and gas station in Northwest China for 1year [J]. Atmospheric Chemistry and Physics, 2018,18(7):4567- 4595.
[40] Bari M A, Kindzierski W B. Ambient volatile organic compounds (VOCs) in Calgary, Alberta: Sources and screening health risk assessment [J]. Science of The Total Environment, 2018,631-632: 627-640.
[41] Hui L R, Liu X G, Tan Q W, et al. Characteristics, source apportionment and contribution of VOCs to ozone formation in Wuhan, Central China [J]. 2018,192:55-71.
[42] Mo Z W, Shao M, Lu S H. Compilation of a source profile database for hydrocarbon and OVOC emissions in China [J]. Atmospheric Environment, 2016,143:209-217.
[43] Song Y, Shao M, liu Y, et al. Source apportionment of ambient volatile organic compounds in Beijing [J]. Environmental Science & Technology, 2007,41(12):4348-4353.
[44] Zhong Z M, Sha Q E, Zheng J Y, et al. Sector-based VOCs emission factors and source profiles for the surface coating industry in the Pearl River Delta region of China [J]. Science of The Total Environment, 2017,583:19-28.
[45] Cai C J, Geng F H, Tie X X, et al. Characteristics and source apportionment of VOCs measured in Shanghai, China [J]. Atmospheric Environment, 2010,44(38):5005-5014.
[46] 王铁宇,李奇锋,吕永龙.我国VOCs的排放特征及控制对策研究[J]. 环境科学, 2013,34(12):4756-4763. Wang T Y, Li Q F, LV Y L. Characteristics and countermeasures of volatile organic compounds (VOCs) emission in China [J]. Environmental Science, 2013,34(12):4756-4763.
Characteristics and sources of atmospheric VOCs pollution in Jincheng.
ZHANG Peng-hui1, HU Dong-mei1*, PENG Lin2, NIU Wei-li3, GONG Xing-xiao4, YAN Yu-long2, NIU Yue-yuan1, DONG Jia-qi1
(1.Key Laboratory of Resources and Environmental System Optimization, Ministry of Education, College of Environmental Science and Engineering, North China Electric Power University, Beijing 102206, China;2.School of the Environment, Beijing Jiaotong University, Beijing 100044, China;3.Jincheng Municipal Bureau of Ecology and Environment, Jincheng 048000, China;4.Jincheng Ecological Environment Monitoring Center of Shanxi Province, Jincheng 048000, China)., 2023,43(9):4525~4533
Volatile organic compounds (VOCs) samples were collected at environmental sampling sites in Jincheng, and the characteristics of VOCs components under different wind direction were analyzed. The VOC sources were identified by diagnostic ratios and positive matrix factorization (PMF), the hybrid single-particle lagrangian integrated trajectory (HYSPLIT) was used to trace the contribute of typical contaminated areas in summer. The results showed that the average VOC concentration was (19.4 ±7.1) μg/m3under southerly wind, and (33.3±17.3) μg/m3under northerly wind.VOCs concentration in northerly wind was nearly 70% higher than that in southerly wind, and northern industrial park had a great impact on VOCs concentration in urban areas. The components concentration showed the characteristics ofalkane > aromatic > alkene >alkyne. The concentration of alkane and aromatic was significantly higher in the northerly wind than that in the southerly wind, and the concentration of alkyne was similar in different wind directions.The average concentration of ozone formation potential (OFP) was (50.5±17.1) μg/m3under southerly wind, and (84.30±44.0) μg/m3under northerly wind.Under different wind direction, the contribution of components showed the characteristics of alkene > alkanes > aromatics > alkynes. The hourly variation range of VOCs components and OFP under the north wind direction was significantly higher than that under the south wind direction,especially in the morning and evening and during the rush hour.The northern industrial park and the vehicular emissions had a prominent impact on the urban area.Atmospheric VOCs were controlled by aging air mass under northerly and southerly winds, and the changes of OFP and O3concentration showed the opposite trends under different wind directions.There was a strong potential source area in the northern border region of Henan, and its percentage contribution to Jincheng summer VOCs was about 25.3%.Local combustion, vehicular emissions and industrial process were the key sources of VOCs control in Jincheng, especially to strengthen the control of industrial and vehicular emissions in the northern region of Jincheng City.
volatile organic compounds (VOCs);pollution characteristics;ozone formation potential (OFP);source apportionment
X511
A
1000-6923(2023)09-4525-09
张鹏辉(1997-),男,山西晋城人,硕士研究生,主要从事大气污染防治研究.发表论文1篇.2445757400@qq.com.
张鹏辉1,胡冬梅1*,彭 林,等.晋城市大气VOCs污染特征及来源解析 [J]. 中国环境科学, 2023,43(9):4525-4533.
Zhang P H, Hu D M, Peng L, et al. Characteristics and sources of atmospheric VOCs pollution in Jincheng [J]. China Environmental Science, 2023,43(9):4525-4533.
2023-02-17
大气重污染成因与治理攻关项目(DQGG202109);国家重点研发计划项目(2019YFC0214203,2019YFC0214202);国家自然科学基金资助项目(21976053)
* 责任作者, 副教授, huhu3057@163.com
猜你喜欢
山西财税(2023年8期)2023-12-28 08:05:46
农产品加工(2023年22期)2023-12-07 15:31:38
农业灾害研究(2022年1期)2022-05-07 01:31:04
选煤技术(2022年1期)2022-04-19 11:15:00
能源工程(2021年2期)2021-07-21 08:39:54
吉林大学学报(理学版)(2021年3期)2021-05-26 02:24:00
今日农业(2021年5期)2021-05-22 01:32:32
今日农业(2019年11期)2019-08-13 00:49:12
杂文月刊(2017年24期)2017-03-03 07:42:55
中国循环杂志(2015年10期)2015-12-24 03:29:56
