深圳工业区夏秋季大气挥发性有机物来源研究
张 月,夏士勇,魏成波,刘侍奇,曹礼明,*,于广河,黄晓锋
深圳工业区夏秋季大气挥发性有机物来源研究
张 月1,夏士勇1,魏成波1,刘侍奇1,曹礼明1,2*,于广河2,黄晓锋1
(1.北京大学深圳研究生院环境与能源学院,大气观测超级站实验室,广东 深圳 518055;2.深港产学研基地(北京大学香港科技大学深圳研修院),广东 深圳 518057)
于2021年夏秋季(7~10月)在深圳北部工业区开展大气挥发性有机物(VOCs)长期在线观测,以分析O3污染日和非污染日VOCs污染特征,并利用特征物种比值法和正交矩阵因子模型(PMF)对VOCs来源进行精细化解析,以探究各类排放源的浓度贡献、臭氧生成潜势(OFP)贡献以及气象条件对其产生的影响.结果表明,深圳工业区夏秋季总挥发性有机物(TVOCs)平均浓度为50.48×10⁻⁹,其中浓度最高的为烷烃,其次为含氧有机物(OVOCs)和芳香烃,分别占比41.3%、22.2%和17.0%.与非污染日相比,OVOCs浓度在污染日上升幅度最高(63.1%).特征物种比值则表明该地区主要受到机动车排放和有机溶剂使用的影响.利用PMF源解析出5个主要排放源,其中机动车排放及汽油挥发的浓度贡献最大(28.2%),其次为工艺过程排放(25.0%)、溶剂使用(22.9%)和生物质燃烧(20.4%).在污染日,工艺过程排放和溶剂使用这两类源的OFP贡献超过70%.各类排放源风场分布特征结果表明,机动车排放及汽油挥发、工艺过程排放和溶剂使用主要来自于本地排放,而生物质燃烧则更多地受到东北方向的传输贡献.建议加大本地工业源和交通源管控,同时关注生物质燃烧,加强与周边区域的联防联控.
工业区;挥发性有机物;臭氧生成潜势;特征物种比值法;正交矩阵因子分析
自2013年“国十条”颁布以来,我国PM2.5浓度持续下降,但O3污染却呈现加重趋势,长时间大范围的O3污染事件频繁发生[1-2].O3对于人体健康[3-4]、生态系统[5-6]、气候变化[7-8]等方面会造成不利影响,而作为其前体物的挥发性有机物(VOCs)在其中扮演着重要角色[9-10].
大气中VOCs种类繁多,不同地区来源复杂,主要包括天然源、生物质燃烧、机动车排放、工业排放等.目前国内外关于VOCs的监测方法分为离线技术和在线技术,离线采样方法有吸附剂采样、气袋采样、不锈钢罐采样等,样品采集后送入实验室进行仪器分析.在线技术包括在线-气相色谱-质谱/氢火焰离子化检测器(GC-MS/FID)、质子转移反应质谱仪(PTR-MS)等[11-13]. VOCs的分析方法包括利用OH消耗速率(LOH)和臭氧生成潜势(OFP)分析VOCs的化学活性,利用特征物种比值法、排放清单法、主成分分析法、化学质量平衡(CMB)、正交矩阵因子分析(PMF)等进行VOCs的来源解析,利用基于观测的模型(OBM)进行O3敏感性分析等[14-17].
在相关VOCs排放清单的研究中,工业排放源在我国珠江三角洲地区VOCs总排放量中占据了主导地位,并且呈现持续增长趋势[18].研究表明,烷烃、芳香烃和OVOCs是珠三角地区VOCs的重要组分,机动车排放和工业排放是主要的排放源[19-20].宋鑫等人[21]于2021年夏初对东莞某工业区VOCs组成及来源进行研究,结果表明含氧VOCs的浓度占比最大(51.5%),且其具有较高的大气化学活性.李佳佳等人[22]于2020年夏季对广州某工业区的VOCs浓度及来源进行研究,结果表明烷烃和芳香烃浓度占比较大,机动车尾气排放,工业溶剂蒸发、印刷等行业排放则是VOCs的可能排放来源.邓思欣等人[23]于2019年在佛山产业重镇开展VOCs污染特征等研究,结果显示环境VOCs主要组成为烷烃(56.5%)和芳香烃(30.1%),溶剂使用源(42.4%)和机动车排放源(25.8%)是主要排放源.
深圳位于珠江三角洲东岸,是珠三角城市群中经济和工业活力较高的主要城市,研究深圳工业区的VOCs污染特征及来源对于珠三角地区VOCs减排具有重要意义.近年来研究表明,芳香烃和OVOCs对深圳市大气VOCs具有重要贡献[9].朱波等人[24]和陈雪等人[14]分别于2017年秋季和2019年秋季在深圳市开展了多点位离线采样,结果发现深圳市西部和北部工业区VOCs浓度较高,其中OVOCs和芳香烃浓度占比较大,可能与工艺过程排放和溶剂使用有关.然而此前研究多为离线采样,观测时间短且时间分辨率低,有限的样品数量难以有效揭示关键VOCs组分长期变化趋势.此外,此前有关深圳市工业区的O3生成敏感性分析表明该地区处于VOCs控制区[25],对于另一种光化学特征指示物PAN的研究也发现前体物浓度是影响其生成的关键因子[26],因此有必要在该地区开展光化学前体物VOCs的来源解析.本研究选取深圳市污染较严重的北部工业区,采取在线监测的方法,于2021年光化学污染较严重的夏秋季(7~10月)开展VOCs长期在线观测,从而快速捕捉VOCs物种变化情况,分析O3污染日和非污染日VOCs污染特征,并利用特征物种比值法和PMF模型对VOCs来源进行精细化解析,以探究各类排放源的浓度贡献、OFP贡献以及气象条件对其产生的影响,以期为珠三角主要工业区VOCs排放源的重点管控提供理论依据.
1 材料与方法
1.1 观测点位与观测时间
深圳市龙华区是深圳重要的产业大区,包含印刷行业、制鞋企业、电子制造、塑胶制品、家具制造和自行车制造等规模以上工业企业1865家[27].观测点位于龙华区桂花小学(113°59′E,22°36′N)五楼楼顶,距离地面大约25m.观测点位南面约150m处为交通主干道,四面被工业园区包围,能够在一定程度上表征深圳市工业区的大气化学组分特征.观测时间为2021年7月18日~10月31日.
1.2 仪器与分析方法
本次VOCs观测使用鹏宇昌亚ZF-PKU- VOC1007型VOCs在线监测系统,搭载超低温捕集系统和分析系统(岛津GCMS-QP2010SE).该系统时间分辨率为1h,设备于整点时刻开始采样,采样流量为60mL/min,采样时长5min.大气样品首先分为FID与MS两路,分别进入除水阱去除水分,然后进入超低温捕集阱浓缩富集.随后捕集阱快速升温加热解析出VOCs, VOCs由载气送入FID/MS检测器.FID分析C2-C5的低碳数烃类物种,MS分析C5-C12烃类、OVOCs、卤代烃以及乙腈等.分析结束后系统进行加热反吹去除残留VOCs.本研究共观测到99种VOCs物种,包括29种烷烃、10种烯烃、16种芳香烃、30种卤代烃、12种OVOCs、乙炔以及乙腈.仪器的质控校准参照《环境空气挥发性有机物气相色谱连续监测系统技术要求及检测方法》(HJ1010- 2018)执行[28],以确保监测数据的准确性、有效性. 采用美国Linde公司的标准气体每月至少进行一次多点标定,确保90%以上物种工作曲线的决定系数(R2)大于0.99,各物种体积分数检出限在0.01×10⁻⁹~ 0.1×10⁻⁹范围内.此外,每周还使用标准气体进行单点校准核查,获得大多数物种的体积分数偏差低于20%,确保了观测期间仪器的稳定性.
光解常数数据来自同站点UF-CCD光解光谱仪,常规污染物(O3、NO、CO)以及气象参数(风速、风向、气温、相对湿度、气压)数据来自同位于桂花小学校园内的深圳市观澜国控点子站.
1.3 臭氧生成潜势(OFP)
OFP常用于评估VOCs物种对O3生成的贡献, VOCs物种浓度和该物种MIR常数决定了OFP大小,计算公式如下:
OFP= MIR[VOCs](1)
式中:OFP为物种的臭氧生成潜势,μg/m3;[VOCs]为物种的平均浓度,μg/m3;MIR为物种的最大增量反应活性,g O3/ g VOC,代表增加单位质量的物种时O3的最大生成量.本文中MIR参考Carter[29]的研究.
1.4 正交矩阵因子分析(PMF)
PMF作为受体模型已被广泛用于源解析,其不需要具体的源排放清单或源排放谱,只需要大量实测数据即可实现污染物的来源解析.该模型需输入受体浓度和不确定度,通过非负约束限制进行计算,得到多个不同的解析因子,最后根据因子结果的源谱特征,识别所对应的排放源.模型计算公式如下[30-31]:

式中:X是样品中物种的浓度;为排放源的数目;g表示第个源对样品的贡献;f为第个源中物种的浓度;e表示模型残差.PMF模型主要是将目标函数最小化,目标函数定义为:
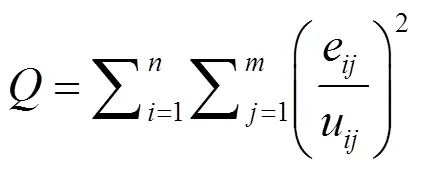
式中:为样本个数;为物种个数;m表示物种的不确定性,根据PMF 5.0指导方法要求计算.
PMF模型的基本原理是质量守恒,假设污染源排放的污染物浓度在传输过程中保持不变.但实际上,VOCs在传输过程中会发生光化学反应,因此解析结果不能真实反映实际污染源贡献.为解决这一问题, Wadden等[32]提出输入该模型的物种应保证成分相对稳定, Liu等[33]去除了高反应活性物种,朱玉凡等[34]按气团老化程度分类后进行源解析,都在一定程度上改善了模型.本研究结合前人的研究成果,综合考虑了物种浓度、活性和示踪性,去除化学反应活性过高和浓度低于检出限的物种,从而尽量减少气团老化可能带来的影响.对于源解析结果,一般认为robust/true接近1,说明解析结果具有较好的可靠性[35].
2 结果与分析
2.1 VOCs污染特征
深圳北部工业区观测期间气象参数及污染物时间序列如图1所示.根据AQI评价,当日最大8h均值超过160μg/m3时视为O3污染[36],本研究共观测到O3污染日17d.O3污染通常出现在光解速率较高、温度较高、相对湿度较低、风速较低的气象条件下(表1),O3前体物(TVOCs和NO)峰值通常先于O3峰值出现.观测期间TVOCs浓度波动较大,平均浓度为50.48×10-9,其中浓度最高的为烷烃(20.83×10-9),浓度占比41.3%,其次为OVOCs(11.21×10-9)、芳香烃(8.57×10-9)和卤代烃(6.82×10-9),分别占比22.2%、17.0%和13.5%.与其他城市夏秋季相比,深圳北部工业区VOCs浓度与南京工业区(34.69×10-9± 34.08 ×10⁻⁹)和广州工业区(41×10-9± 24×10-9)浓度相近,显著低于东莞工业区(81.9×10⁻⁹± 45.4×10⁻⁹),略高于重庆主城区(41.35×10⁻⁹)和成都市区(31.85× 10⁻⁹)[21-22,37-39].
图2给出了污染日和非污染日各类VOCs的浓度变化情况.与非污染日相比,各类VOCs在污染日浓度均升高,其中OVOCs上升幅度最高(63.1%),可能是因为大气氧化性增强,增加了OVOCs的二次生成[40-41].烷烃、芳香烃、卤代烃、乙炔和乙腈浓度上升20%左右,烯烃浓度仅上升约1%,可能是由于烯烃反应活性最强,在污染日大量消耗.污染日VOCs浓度排名前10的物种依次为丙酮、二氯甲烷、乙醛、正丁烷、甲苯、丙烷、异丁烷、甲基乙基酮、间/对二甲苯和2,3-二甲基丁烷,共占TVOCs总浓度的70%.其中丙酮浓度上升幅度最大,其次为乙醛和甲基乙基酮,分别上升75.6%、61.3%和46.0%.
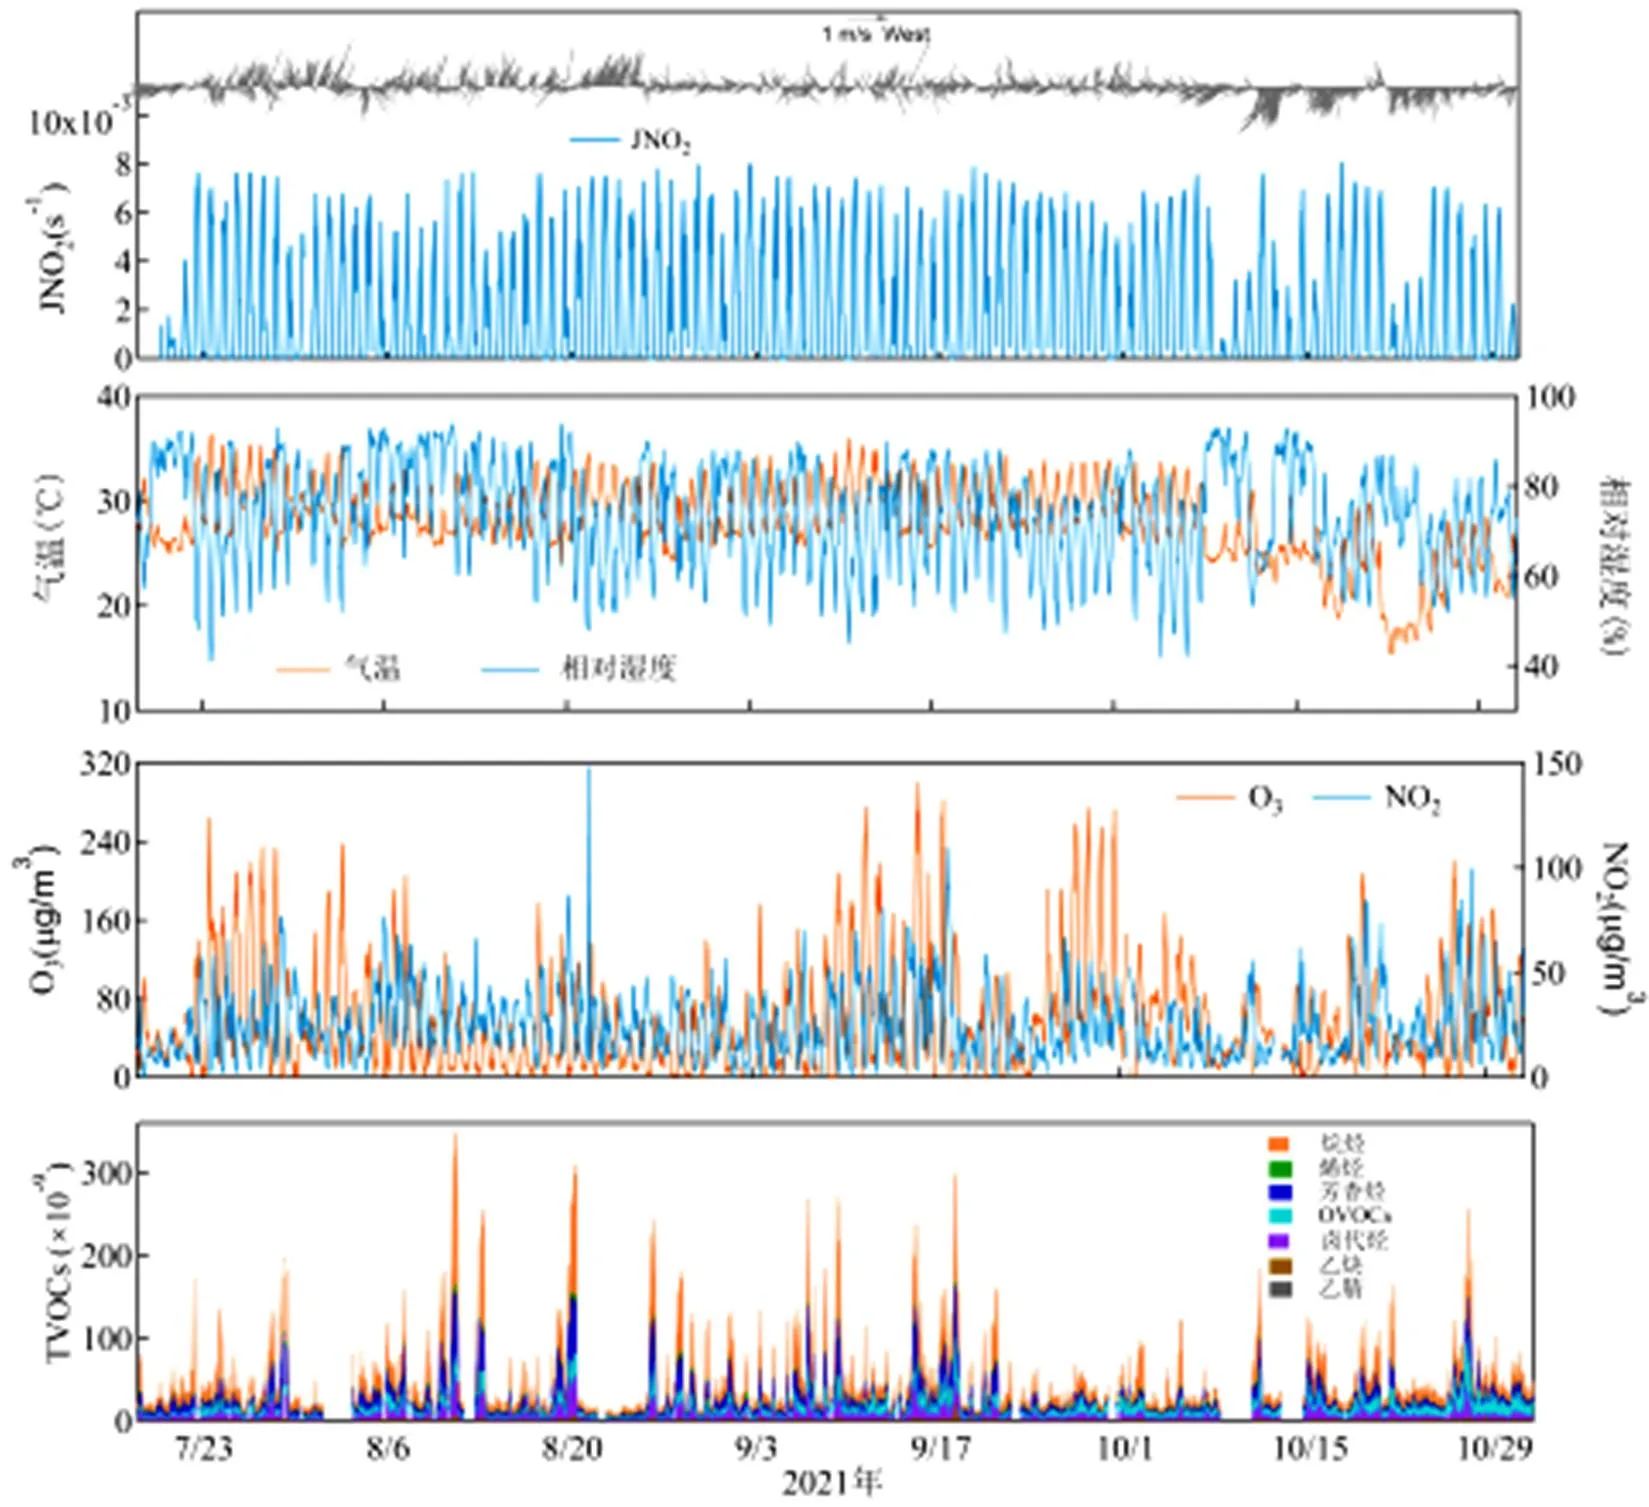
图1 气象参数及污染物时间序列
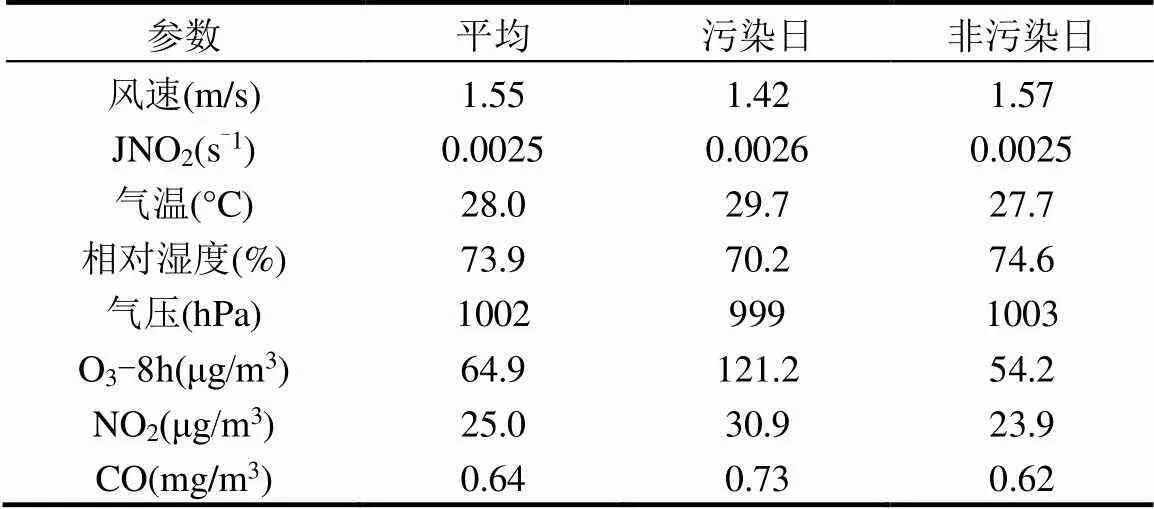
表1 观测期间气象参数及污染物浓度
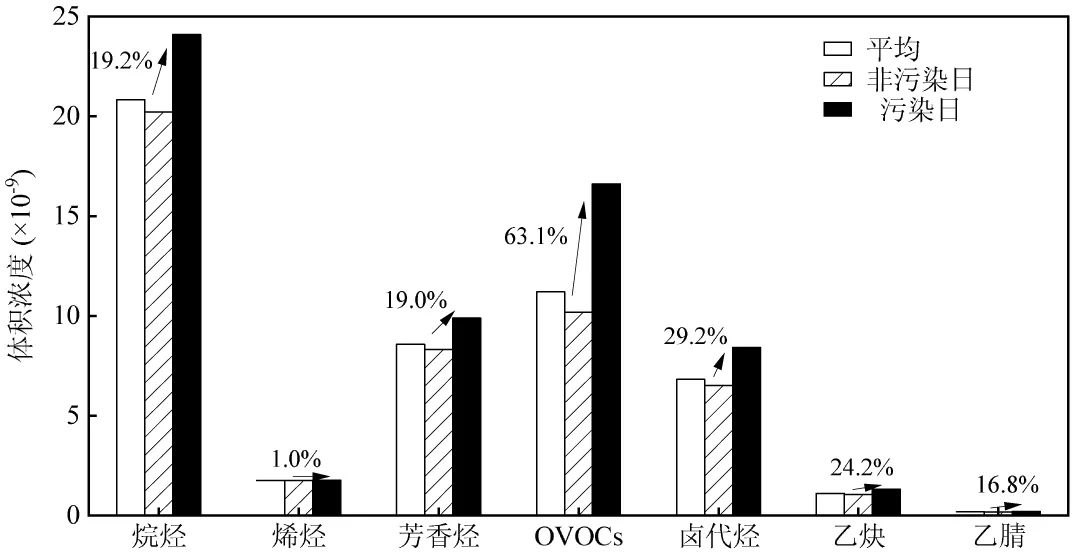
图2 各类VOCs的浓度
表2列出了各类VOCs组分在不同空气质量状况下的OFP变化情况.观测期间OFP为346.7μg/m3,其中芳香烃对臭氧生成的贡献最大,贡献率为52.3%,其次为OVOCs(21.3%)和烷烃(16.9%).在污染日OVOCs对臭氧生成的贡献明显增加,这与OVOCs浓度的大幅提升有关.因此,加强对芳香烃和OVOCs的管控更有利于控制深圳北部工业区的O3污染.
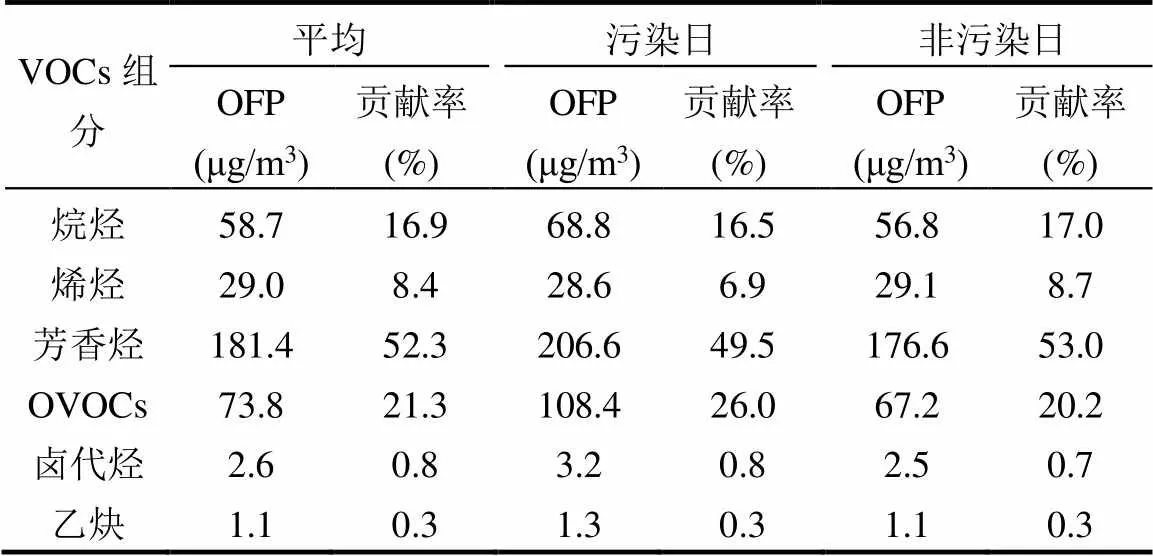
表2 各类VOCs的OFP贡献
2.2 特征物种比值分析
某些VOCs具有相似的OH自由基反应速率,它们在大气中的浓度比值可以反映其来源特征,表3给出了本研究中一些特征物种的比值.本研究中,丙烷与正丁烷比值在污染日和非污染日分别为0.80和0.64,更接近汽油车的比值(0.49),且远低于LPG车中的比值(6.12),说明丙烷与正丁烷主要来源于汽油车的排放[42-44].异戊烷和正戊烷的比值在0.56~0.58时表征燃煤排放,比值在0.82~0.89时主要来自天然气排放,比值在1.5~3.0时代表机动车排放[45-46].本研究中异戊烷和正戊烷比值为1.69,说明该地区受到机动车排放的影响.
甲苯和苯来源较为复杂,通常认为甲苯与苯的比值远大于2时说明有机溶剂使用的贡献更高,比值远小于2时主要来自机动车排放[47-50].本研究中甲苯和苯比值远大于2,说明该地区甲苯主要来自于有机溶剂使用.间/对-二甲苯与乙苯的比值常用于评估本地排放和气团传输的影响,比值在2.5~2.9范围时认为受本地排放贡献较多,比值远小于3时说明该地区气团经历较长的光化学反应,较多受到区域传输的影响[51-52].本研究间/对-二甲苯与乙苯在污染日和非污染日比值分别为2.03和2.31,表明受本地排放贡献较多.相比于非污染日,污染日比值较小,说明污染日大气氧化性更强,气团老化程度更高,可能污染日较多受到区域传输的影响.

表3 特征物种比值
2.3 PMF来源解析
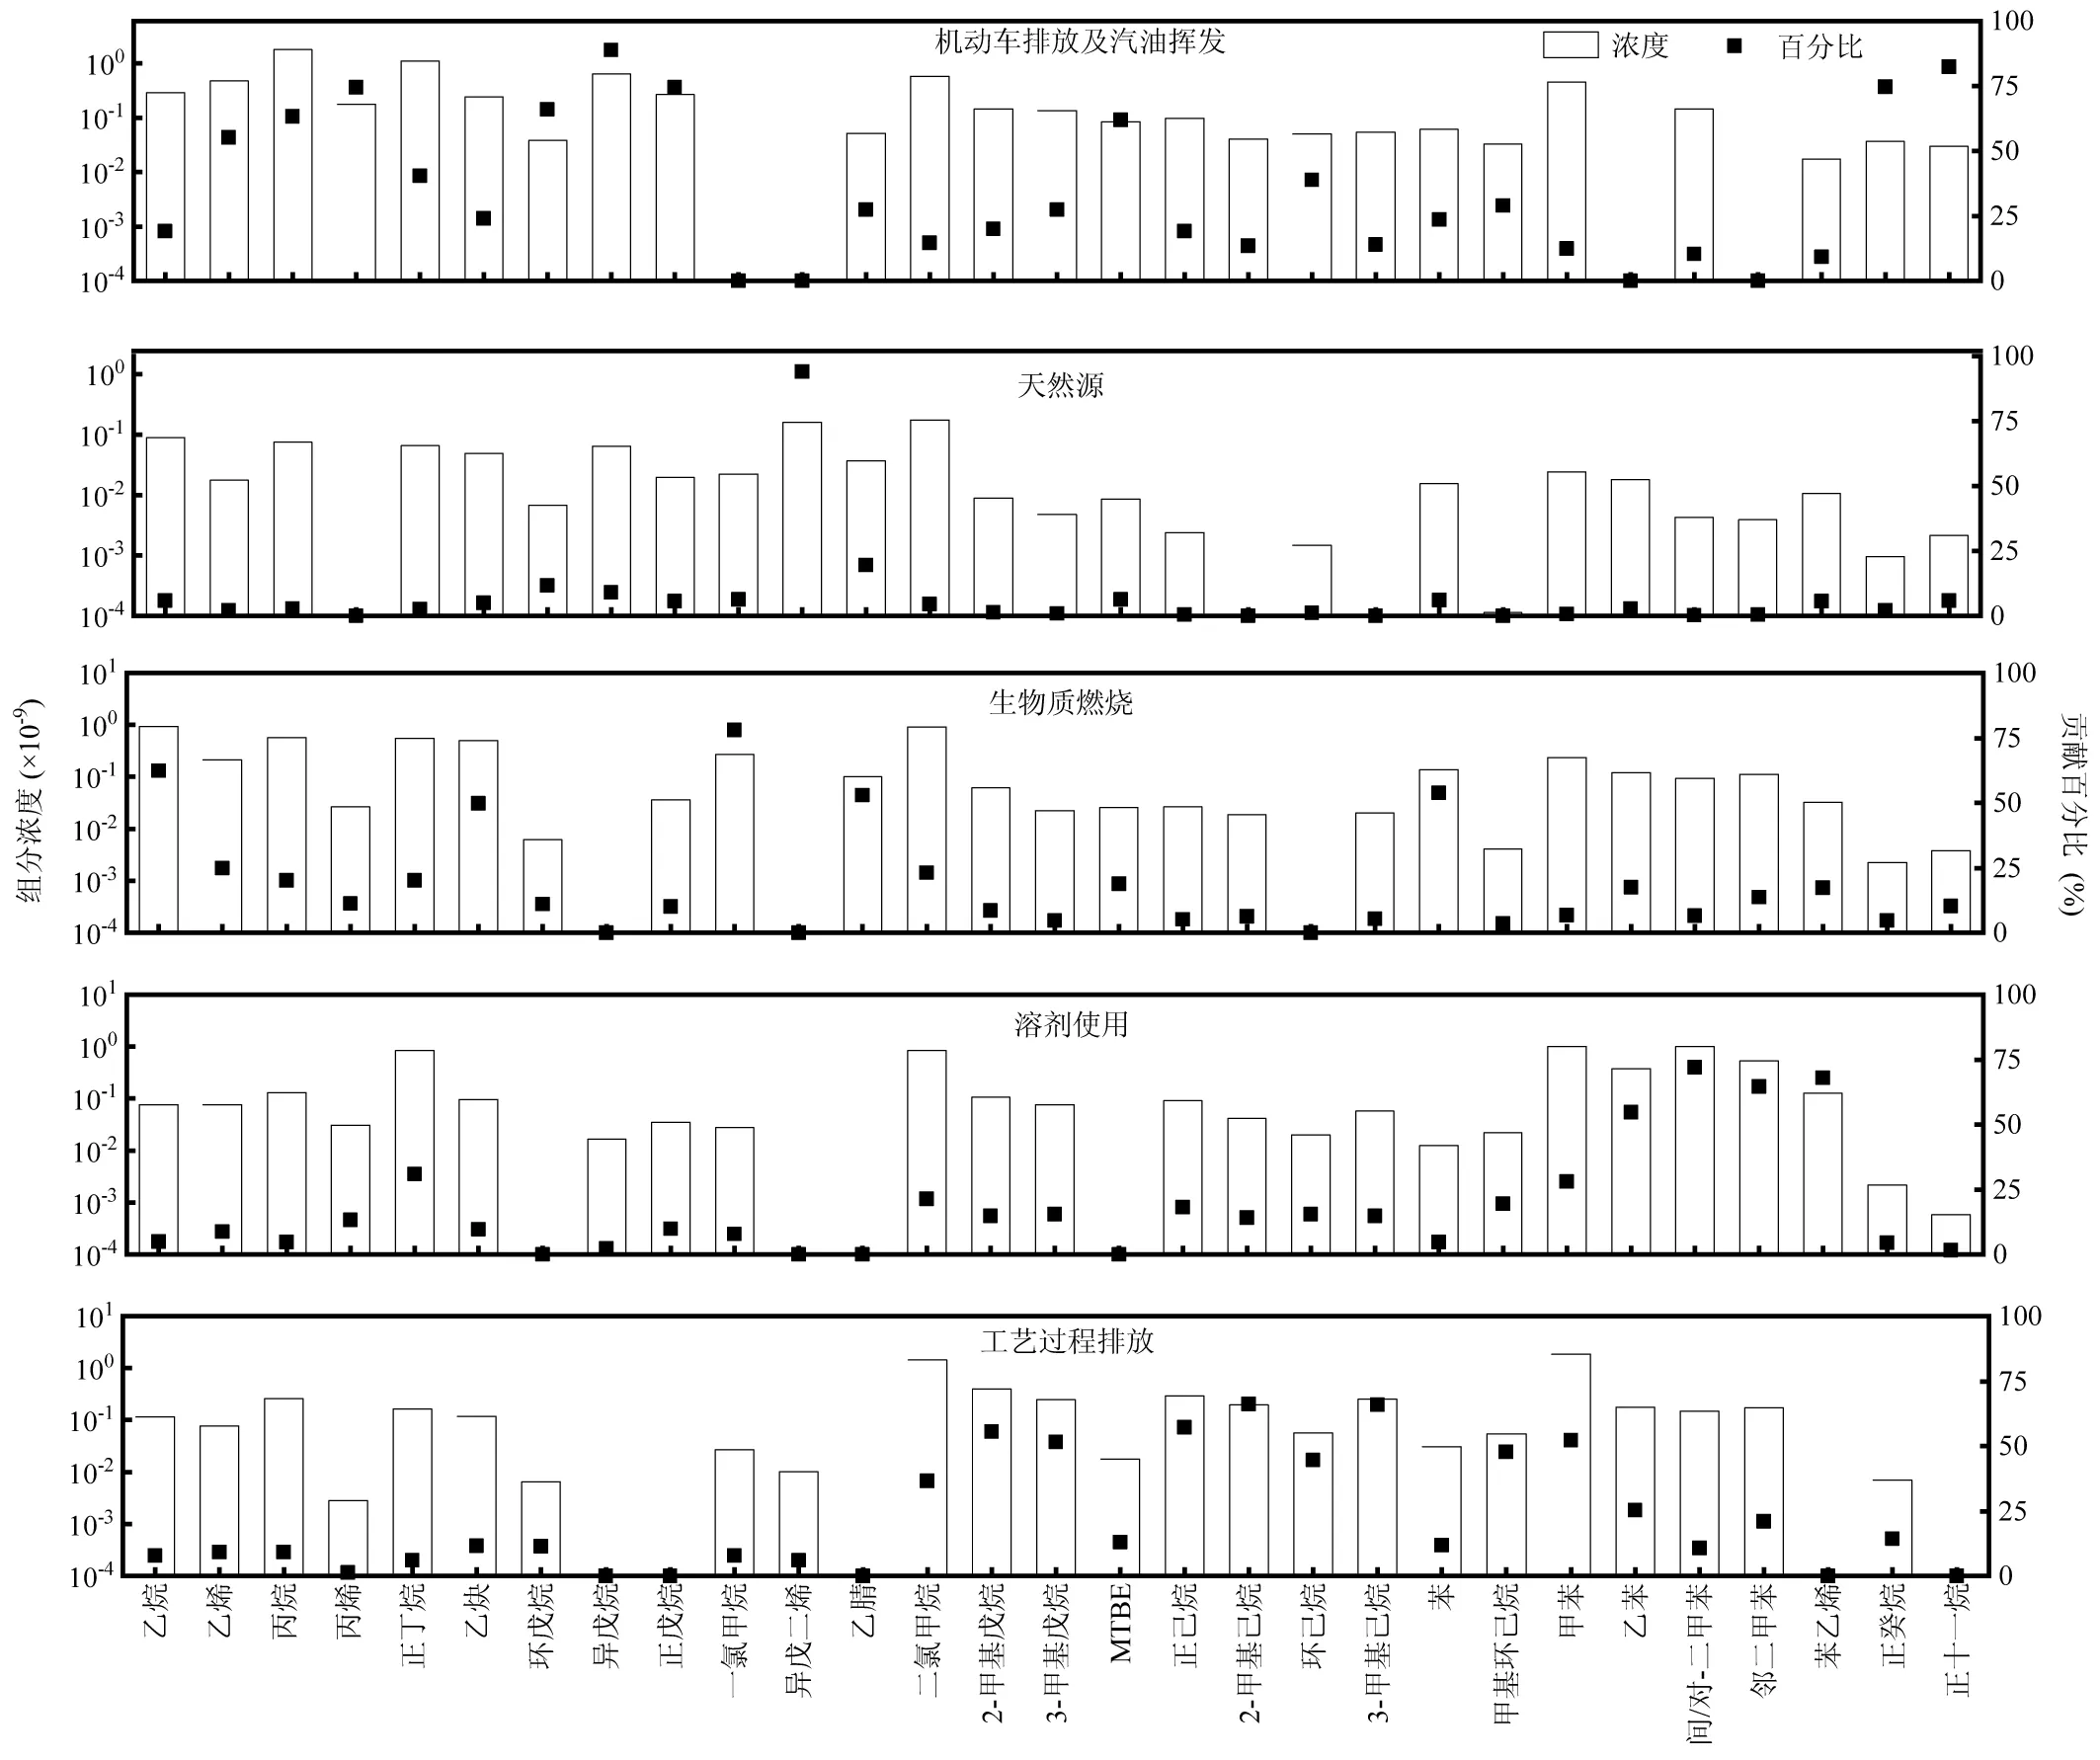
图3 PMF源解析结果
选取环境空气中浓度高、活性和示踪性强的29种VOCs物种,输入PMF 5.0模型进行来源解析.经过多次模型运算得到较稳定的5个因子,此时robust/true为0.98, VOCs模拟浓度与样品实测浓度相关性2=0.96,表明模拟效果较好,解析结果具有可靠性[35].图3是PMF源解析结果,解析出5个主要排放源.第一个排放源中,C2-C5的低碳烷烃贡献较高,其中丙烷、丁烷主要来自于汽油车排放,戊烷是汽油挥发的示踪剂,MTBE是汽油添加剂,正癸烷和正十一烷贡献也较大,是柴油车排放的示踪剂[53],因此判断第一个源为机动车排放及汽油挥发.第二个排放源中,作为植物排放的特征物[54],异戊二烯贡献最大,因此可识别为天然源.第三个排放源中,乙烷、乙炔、一氯甲烷、乙腈和苯的贡献较大,乙腈和一氯甲烷是生物质燃烧的示踪物,乙烷、乙炔和苯常作为不完全燃烧产物[55],因此可判别为生物质燃烧.第四个排放源中,芳香烃的贡献较大,甲苯、乙苯、二甲苯是溶剂使用的主要排放物,苯乙烯也是涂料和稀释剂的典型组分[56],因此可认为是溶剂使用.第五个排放源中, C5-C8的异构化烷烃贡献较大,苯系物也具有一定的贡献.其中2-甲基己烷、3-甲基己烷、甲基环己烷是印刷行业的主要排放物,环己烷和甲苯是电子制造和塑胶制品的主要排放物, 2-甲基戊烷和3-甲基戊烷是制鞋企业的主要排放物,二氯甲烷是胶粘工艺的粘合剂,这与深圳市典型工业行业VOCs排放清单相一致[57-58],因此可识别为工艺过程排放.综上所述,该地区VOCs的排放源主要为机动车排放及汽油挥发、天然源、生物质燃烧、溶剂使用和工艺过程排放.
如图4所示,从浓度贡献来看,机动车排放及汽油挥发贡献最大,贡献率为28.2%,其次为工艺过程排放(25.0%)和溶剂使用(22.9%).这与2.2节中特征物种比值法得到的结论相一致,反映出该地区受交通源和工业源影响非常显著.此外,生物质燃烧也具有一定的贡献(20.4%).在污染日,工艺过程排放和溶剂使用的贡献均有所增加,该地区工业生产会排放大量芳香烃和OVOCs,这可能是污染日OVOCs浓度大幅提升的原因.从OFP贡献来看,溶剂使用的贡献最大(42.1%),其次是工艺过程排放(27.2%)、机动车排放及汽油挥发(17.0%)和生物质燃烧(10.2%).在污染日,同样是工艺过程排放和溶剂使用的贡献增加,这两类源的OFP贡献超过70%;生物质燃烧、机动车排放及汽油挥发贡献略微减少.
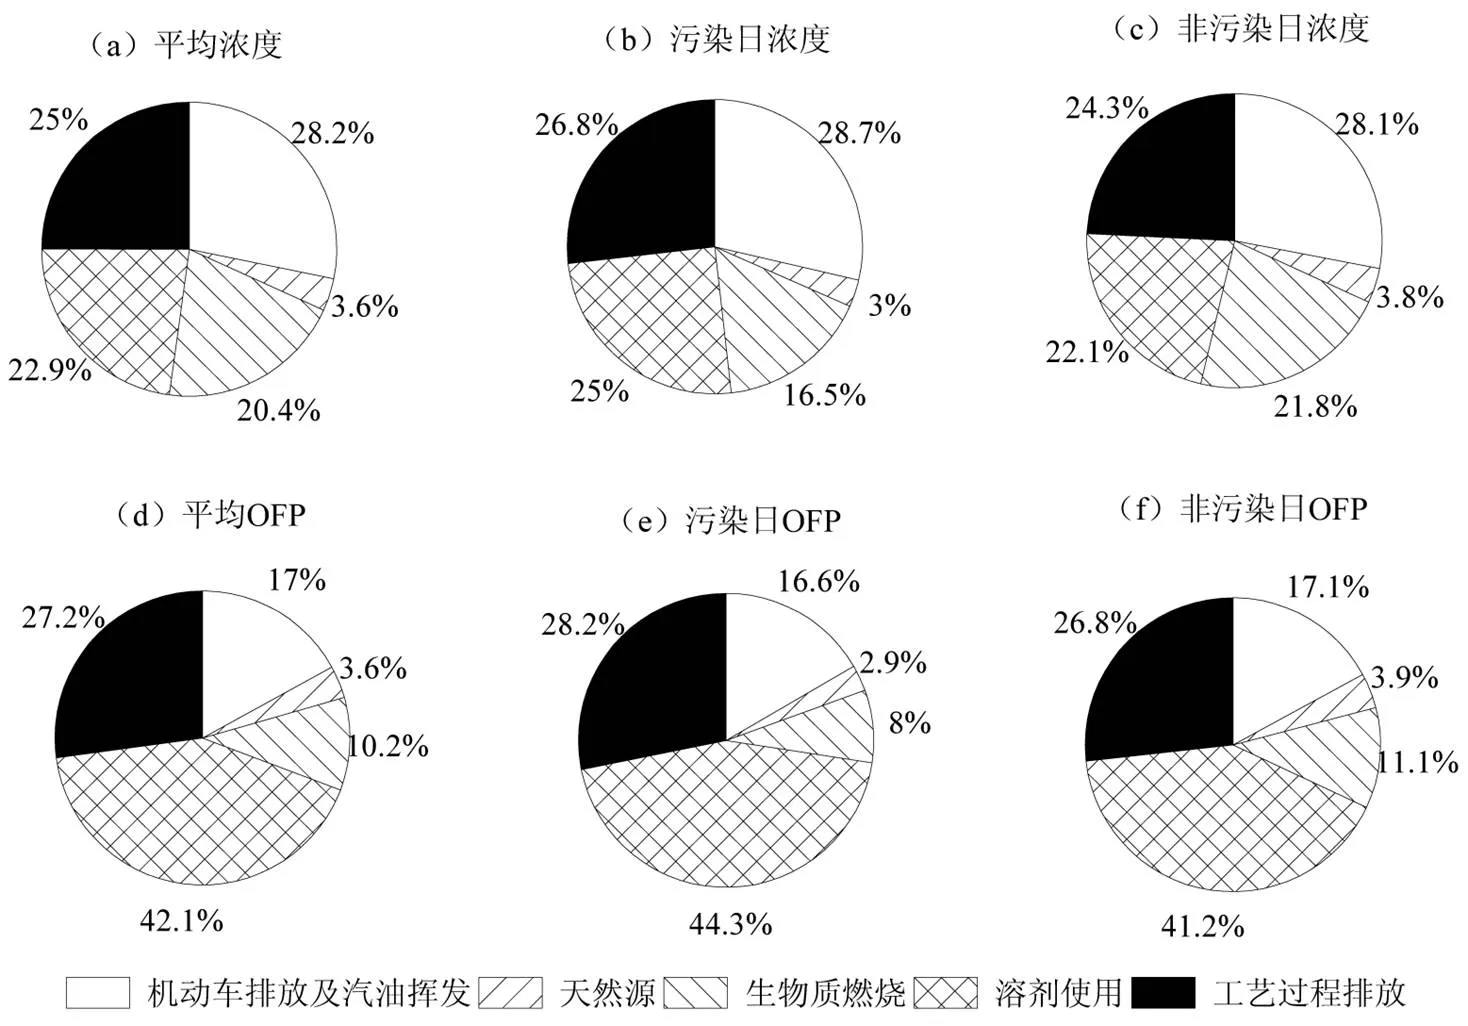
图4 各类排放源浓度贡献及OFP贡献
2.4 气象条件对VOCs来源的影响
为了进一步探讨不同排放源对该地区VOCs的影响,本研究结合气象数据分析各类排放源随温度、光解速率JNO2的变化趋势以及在不同风速和风向下的相对贡献.
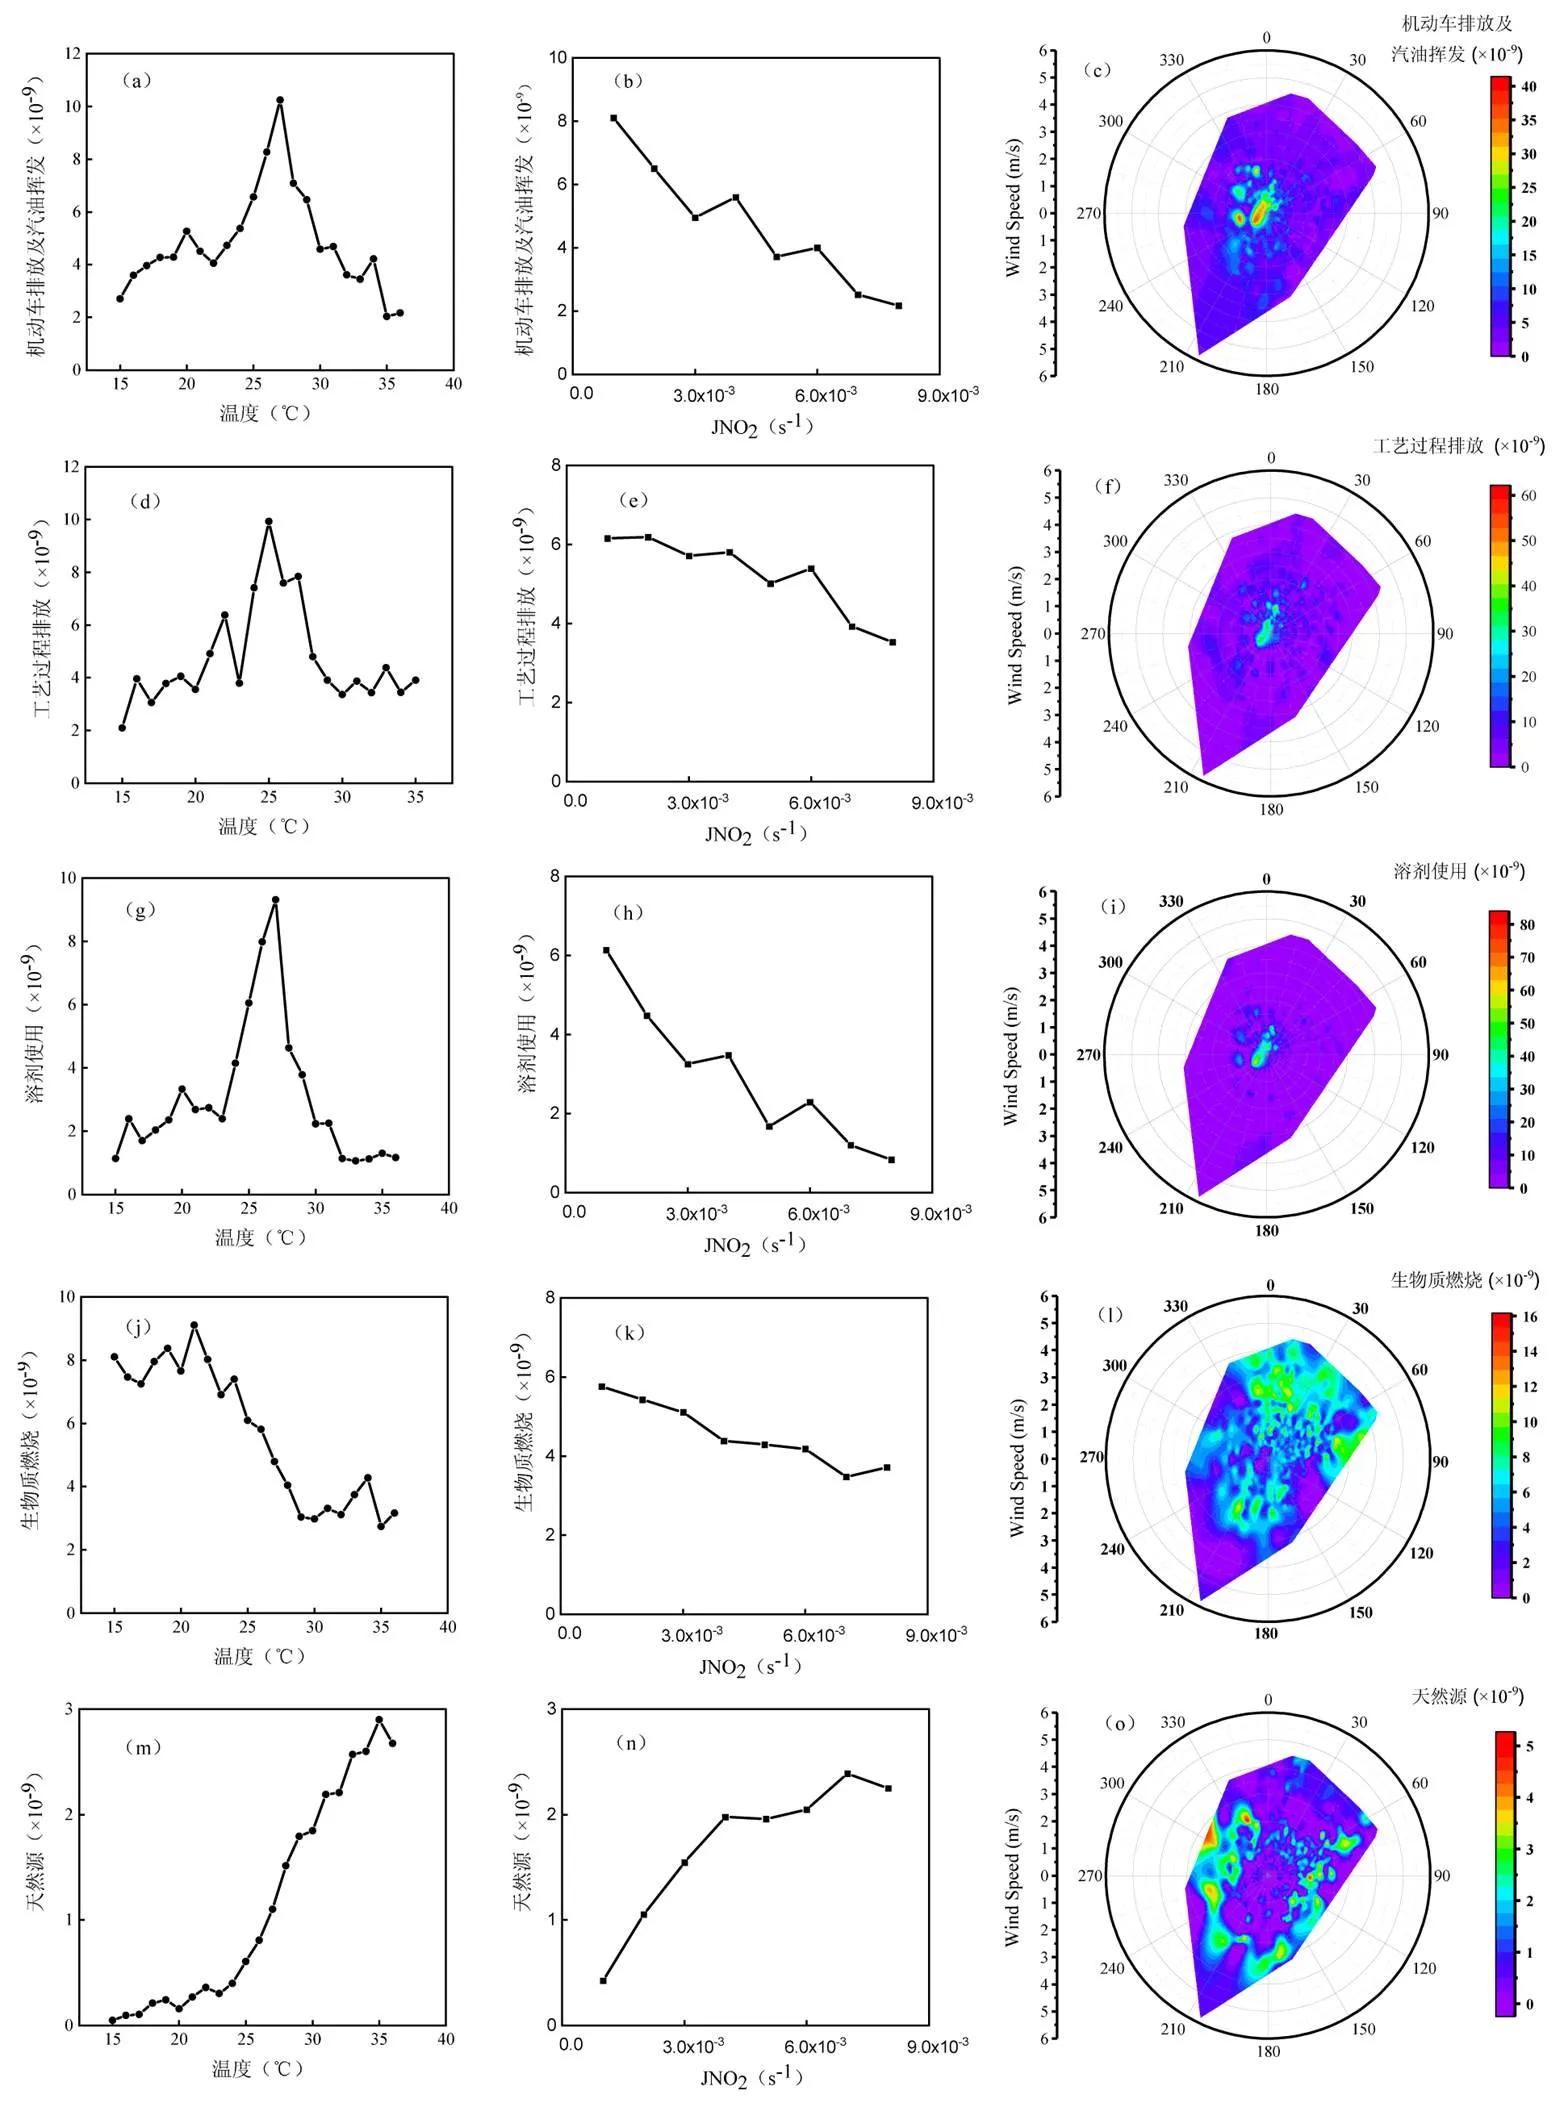
图5 观测期间各类排放源随温度, JNO2变化趋势及风场分布特征
如图5所示,机动车排放及汽油挥发、工艺过程排放和溶剂使用随温度的变化趋势相似,呈现出先随温度上升,当温度超过25℃时快速下降的趋势,这是因为在日间高温时段VOCs作为光化学反应的前体物会被快速消耗.此外,高温时段大气边界层也较高,污染物垂直扩散能力较强.生物质燃烧在15~ 20℃范围时浓度较稳定,当温度超过20℃时快速下降,同样是因为前体物VOCs发生光化学反应被大量消耗.天然源则完全相反,呈现出随温度上升浓度快速升高的趋势,说明温度越高植物排放越强,这与以往研究相一致[19].机动车排放及汽油挥发、工艺过程排放、溶剂使用和生物质燃烧随JNO2变化呈现负相关关系,主要是因为随着光照强度增强,前体物VOCs被大量消耗.而天然源却随JNO2呈现快速升高的趋势,说明光照强度的增强有利于植物的一次排放.
在不同风速和风向下VOCs 排放源贡献率也存在差异.机动车排放及汽油挥发、工艺过程排放和溶剂使用在风场中分布特征相似,主要为本地排放,这是因为该点位处于深莞交界,往来车辆较多尾气排放较大,周边的加油站也存在汽油挥发现象.同时,深圳西部和北部存在较多的工业园区,对本地贡献较大.而生物质燃烧除了本地贡献外,更多地受到东北方向的传输贡献,这是由于观测期间主导风向为东北风,观测点会受到惠州和东莞方向污染物传输的影响,这也与于广河等[25]关于深圳市大气VOCs潜在源贡献 (PSCF) 分析结果相一致.天然源在风场中分布较分散,周边各方向均存在明显的植物一次排放.
3 结论
3.1 深圳北部工业区夏秋季TVOCs平均浓度为50.48×10⁻⁹,其中浓度占比:烷烃(41.3%)>OVOCs (22.2%)>芳香烃(17.0%)>卤代烃(13.5%)>烯烃(3.5%)>乙炔(2.2%)>乙腈(0.4%).在污染日,OVOCs浓度上升幅度最高(63.1%),芳香烃对OFP贡献最大(49.5%),因此控制芳香烃和OVOCs更有利于控制该地区O3污染.
3.2 特征物种比值结果表明,该地区主要受机动车排放和有机溶剂使用的影响,且VOCs主要来自本地排放.
3.3 PMF源解析出5个主要排放源,其中机动车排放及汽油挥发浓度贡献最大(28.2%),其次为工艺过程排放(25.0%)、溶剂使用(22.9%)和生物质燃烧(20.4%).在污染日工艺过程排放和溶剂使用这两类源的OFP贡献超过70%.
3.4 排放源风场分布特征结果表明,机动车排放及汽油挥发、工艺过程排放和溶剂使用主要来自本地排放,而生物质燃烧则更多受到东北方向的传输贡献.因此建议加大本地工业源和交通源管控,同时关注生物质燃烧,加强与周边区域的联防联控.
[1] 中国环境科学学会.中国大气臭氧污染防治蓝皮书 [M]. 2020. Chinese Society of Environmental Sciences. China blue book of atmospheric ozone pollution prevention and control [M]. 2020.
[2] Wang G, Zhao N, Zhang H, et al. Spatiotemporal Distributions of Ambient Volatile Organic Compounds in China: Characteristics and Sources [J]. Aerosol and Air Quality Research, 2022,22(5).
[3] Mirowsky J E, Carraway M S, Dhingra R, et al. Ozone exposure is associated with acute changes in inflammation, fibrinolysis, and endothelial cell function in coronary artery disease patients [J]. Environmental Health, 2017,16(1):126.
[4] 陈 浪,赵 川,关茗洋,等.我国大气臭氧污染现状及人群健康影响 [J]. 环境与职业医学, 2017,34(11):1025-1030. Chen L, Zhao C, Guan M Y, et al. Ozone pollution in China and its adverse health effects [J]. Journal of Environmental and Occupational Medicine, 2017,34(11):1025-1030.
[5] Pina J M, Moraes R M. Gas exchange, antioxidants and foliar injuries in saplings of a tropical woody species exposed to ozone [J]. Ecotoxicology and Environmental Safety, 2010,73(4):685-691.
[6] 列淦文,叶龙华,薛 立.臭氧胁迫对植物主要生理功能的影响 [J]. 生态学报, 2014,34(2):294-306. Lie G W, Ye L H, Xue L Effects of ozone stress on major plant physiological functions [J]. Acta Ecologica Sinica, 2014,34(2):294- 306.
[7] Ren W, Tian H Q, Liu M L, et al. Effects of tropospheric ozone pollution on net primary productivity and carbon storage in terrestrial ecosystems of China [J]. Journal of Geophysical Research, 2007,112 (D22S09).
[8] Liao H, Zhang Y, Chen W-T, et al. Effect of chemistry-aerosol- climate coupling on predictions of future climate and future levels of tropospheric ozone and aerosols [J]. Journal of Geophysical Research, 2009,114(D10).
[9] He Z, Wang X, Ling Z, et al. Contributions of different anthropogenic volatile organic compound sources to ozone formation at a receptor site in the Pearl River Delta region and its policy implications [J]. Atmospheric Chemistry and Physics, 2019,19(13):8801-8816.
[10] Shao M, Lu S, Liu Y, et al. Volatile organic compounds measured in summer in Beijing and their role in ground-level ozone formation [J]. Journal of Geophysical Research, 2009,114.
[11] 李 悦,邵 敏,陆思华.城市大气中挥发性有机化合物监测技术进展[J]. 中国环境监测, 2015,31(4):1-7. Li Y, Shao M, Lu S H. Review on technologies of ambient volatile organic compounds measurement [J]. Environmental Monitoring in China, 2015,31(4):1-7.
[12] 刘兴隆,曾立民,陆思华,等.大气中挥发性有机物在线监测系统[J]. 环境科学学报, 2009,29(12):2471-2477. Liu X L, Zeng L M, Lu S H, et al. Online monitoring system for volatile organic compounds in the atmosphere [J]. Acta Scientiae Circumstantiae, 2009,29(12):2471-2477.
[13] Atkinson R. Gas-phase tropospheric chemistry of organic compounds: a review [J]. Atmospheric Environment, 2007,41:S200-S240.
[14] 陈 雪.深圳市光化学活跃季大气挥发性有机物时空变化特征[D]. 北京:北京大学, 2021. Chen X. Temporal and spatial variation characteristics of volatile organic compounds during the period with active photochemical reaction in Shenzhen [D]. Beijing: Peking University, 2021.
[15] Guo H, Wang T, Simpson I J, et al. Source contributions to ambient VOCs and CO at a rural site in eastern China [J]. Atmospheric Environment, 2004,38(27):4551-4560.
[16] Zheng B, Tong D, Li M, et al. Trends in China's anthropogenic emissions since 2010 as the consequence of clean air actions [J]. Atmospheric Chemistry and Physics, 2018,18(19):14095-14111.
[17] Sun W, Shao M, Granier C, et al. Long-term trends of anthropogenic SO2, NO, CO, and NMVOCs emissions in China [J]. Earth's Future, 2018,6(8):1112-1133.
[18] Li B, Ho S S H, Li X, et al. A comprehensive review on anthropogenic volatile organic compounds (VOCs) emission estimates in China: Comparison and outlook [J]. Environment International, 2021,156.
[19] Shao M, Zhang Y, Zeng L, et al. Ground-level ozone in the Pearl River Delta and the roles of VOCs and NOin its production [J]. Environmental Management, 2009,90(1):512-518.
[20] Meng Y, Song J, Zeng L, et al. Ambient volatile organic compounds at a receptor site in the Pearl River Delta region: Variations, source apportionment and effects on ozone formation [J]. Journal of Environmental Sciences, 2022,111:104-117.
[21] 宋 鑫,袁 斌,王思行,等.珠三角典型工业区挥发性有机物(VOCs)组成特征:含氧挥发性有机物的重要性[J]. 环境科学, 2023,44(3): 1336-1345. Song X, Yuan B, Wang S X, et al. Compositional characteristics of volatile organic compounds in typical industrial areas of the Pearl River Delta: Importance of oxygenated volatile organic compounds [J]. Environmental Science, 2023,44(3):1336-1345.
[22] 李佳佳.典型工业园挥发性有机物的三维空间分布特征及其健康风险评估研究 [D]. 广东:广东工业大学, 2022. Li J J. Study on the three-dimensional spatial distribution characteristics and health risk assessment of volatile organic compounds in typical industrial parks [D]. Guangdong: Guangdong University of Technology, 2022.
[23] 邓思欣,刘永林,司徒淑娉,等.珠三角产业重镇大气VOCs污染特征及来源解析 [J]. 中国环境科学, 2021,41(7):2993-3003. Deng S X, Liu Y L, Situ S P, et al. Characteristics and source apportionment of volatile organic compounds in an industrial town of Pearl River Delta [J]. China Environmental Science, 2021,41(7):2993- 3003.
[24] 朱 波.深圳市大气挥发性有机物空间分布特征与溯源研究 [D]. 北京:北京大学, 2022. Zhu B. Characteristics of Spatial distributionj and source apportionment of atmospheric volatile organic compounds in Shenzhen [D]. Beijing: Peking University, 2022.
[25] 于广河,林理量,夏士勇,等.深圳市工业区VOCs污染特征与臭氧生成敏感性[J]. 中国环境科学, 2022,42(5):1994-2001. Yu G H, Lin L L, Xia S Y, et al. The characteristics of VOCs and ozone formation sensitivity in a typical industrial area in Shenzhen [J]. China Environmental Science, 2022,42(5):1994-2001.
[26] 于广河,夏士勇,曹礼明,等.深圳市工业区大气PAN污染特征与影响因素[J]. 中国环境科学, 2023,43(2):497-505. Yu G H, Xia S Y, Cao L M, et al. Pollution characteristics and influencing factors of atmospheric PAN in industrial area of Shenzhen [J]. China Environmental Science, 2023,43(2):497-505.
[27] 黄沛荣.深圳市典型工业园VOCs排放特征研究 [D]. 北京:北京大学, 2022. Huang P R. Emission characteristics of VOCs from typical industrial sources in Shenzhen [D]. Beijing: Peking University, 2022.
[28] HJ1010-2018 环境空气挥发性有机物气相色谱连续监测系统技术要求及检测方法 [S]. HJ1010-2018 Technical requirements and test methods for continuous monitoring system of volatile organic compounds in ambient air by gas chromatography [S].
[29] Carter W P L. Development of a condensed SAPRC-07chemical mechanism [J]. Atmospheric Environment, 2010,44(40):5336-5345.
[30] Paatero Pentti, Tapper Unto. Positive matrix factorization: A non-negative factor model with optima utilization of error estimates of data values [J]. Environmetrics, 1994,5(2):111-126.
[31] Saeaw N, Thepanondh S. Source apportionment analysis of airborne VOCs using positive matrix factorization in industrial and urban areas in Thailand [J]. Atmospheric Pollution Research, 2015,6(4):644-650.
[32] Wadden R A, Uno I, Wakamatsu S. Source discrimination of short-term hydrocarbon samples measured aloft [J]. Environmental Science & Technology, 1986,20(5):473-483.
[33] Liu C T, Ma Z B, Mu Y J, et al. The levels, variation characteristics, and sources of atmospheric non-methane hydrocarbon compounds during wintertime in Beijing, China [J]. Atmospheric Chemistry and Physics, 2017,17(17):10633-10649.
[34] 朱玉凡,陈 强,刘 晓,等.基于气团老化程度对挥发性有机物分类改善PMF源解析效果[J]. 环境科学, 2022,43(2):707-713. Zhu Y F, Chen Q, Liu X, et al. Improved performance of PMF source apportionment for volatile organic compounds based on classification of VOCs aging degree in air mass [J]. Environmental Science, 2022, 43(2):707-713.
[35] Zheng H, Kong S, Chen N, et al. Source apportionment of volatile organic compounds: Implications to reactivity, ozone formation, and secondary organic aerosol potential [J]. Atmospheric Research, 2021, 249.
[36] 环境空气质量指数(AQI)技术规定(试行) [J]. 中国环境管理干部学院学报, 2012,22(1):44. Technical regulation of ambient air quality index (AQI) [J]. Journal of China Academy of Environmental Management, 2012,22(1):44.
[37] 曹梦瑶,林煜棋,章炎麟.南京工业区秋季大气挥发性有机物污染特征及来源解析 [J]. 环境科学, 2020,41(6):2565-2576. Cao M Y, Lin Y Q, Zhang Y L. Characteristics and source apportionment of atmospheric VOCs in the Nanjing Industrial Area in autumn [J]. Environmental Science, 2020,41(6):2565-2576.
[38] 刘芮伶,翟崇治,李 礼,等.重庆主城区夏秋季挥发性有机物(VOCs)浓度特征及来源研究 [J]. 环境科学学报, 2017,37(4):1260-1267. Liu R L, Zhai C Z, Li L, et al. Concentration characteristics and source analysis of ambient VOCs in summer and autumn in the urban area of Chongqing [J]. Acta Scientiae Circumstantiae, 2017,37(4):1260-1267.
[39] 徐晨曦,陈军辉,韩 丽,等.成都市2017年夏季大气VOCs污染特征、臭氧生成潜势及来源分析 [J]. 环境科学研究, 2019,32(4):619- 626. Xu C X, Chen J H, Han L, et al. Analyses of pollution characteristics, ozone formation potential and sources of VOCs Atmosphere in Chengdu City in summer 2017 [J]. Research of Environmental Sciences, 2019,32(4):619-626.
[40] Huang X F, Wang C, Zhu B, et al. Exploration of sources of OVOCs in various atmospheres in southern China [J]. Environmental Pollution, 2019,249:831-842.
[41] Qu H, Wang Y, Zhang R, et al. Chemical production of oxygenated volatile organic compounds strongly enhances boundary-layer oxidation chemistry and ozone production [J]. Environmental Science &Technology, 2021,55(20):13718-13727.
[42] Lai C H, Chang C C, Wang C H, et al. Emissions of liquefied petroleum gas (LPG) from motor vehicles [J]. Atmospheric Environment, 2009,43(7):1456-1463.
[43] Huang A, Yin S, Yuan M, et al. Characteristics, source analysis and chemical reactivity of ambient VOCs in a heavily polluted city of central China [J]. Atmospheric Pollution Research, 2022,13(4).
[44] Liu B, Liang D, Yang J, et al. Characterization and source apportionment of volatile organic compounds based on 1-year of observational data in Tianjin, China [J]. Environmental Pollution, 2016, 218:757-769.
[45] Song C, Liu Y, Sun L, et al. Emissions of volatile organic compounds (VOCs) from gasoline- and liquified natural gas (LNG)-fueled vehicles in tunnel studies [J]. Atmospheric Environment, 2020,234.
[46] Hong Z, Li M, Wang H, et al. Characteristics of atmospheric volatile organic compounds (VOCs) at a mountainous forest site and two urban sites in the southeast of China [J]. Science of The Total Environment, 2019,657:1491-1500.
[47] Hui L, Liu X, Tan Q, et al. VOC characteristics, chemical reactivity and sources in urban Wuhan, central China [J]. Atmospheric Environment, 2020,224.
[48] 中华人民共和国生态环境部.大气挥发性有机物源排放清单编制技术指南(试行) [S]. 2014. Ministry of Ecology and Environment. People's Republic of China. Technical Guide for Compilation of emission inventories of atmospheric volatile Organic Compounds (Trial) [S]. 2014.
[49] Hui L, Liu X, Tan Q, et al. Characteristics, source apportionment and contribution of VOCs to ozone formation in Wuhan, Central China [J]. Atmospheric Environment, 2018,192:55-71.
[50] Barletta B, Meinardi S, Simpson I J, et al. Ambient mixing ratios of nonmethane hydrocarbons (NMHCs) in two major urban centers of the Pearl River Delta (PRD) region: Guangzhou and Dongguan [J]. Atmospheric Environment, 2008,42(18):4393-4408.
[51] Kumar A, Singh D, Kumar K, et al. Distribution of VOCs in urban and rural atmospheres of subtropical India: Temporal variation, source attribution, ratios, OFP and risk assessment [J]. Science of The Total Environment, 2018,613-614:492-501.
[52] Yurdakul S, Civan M, Kuntasal Ö, et al. Temporal variations of VOC concentrations in Bursa atmosphere [J]. Atmospheric Pollution Research, 2018,9(2):189-206.
[53] Li B, Ho S S H, Xue Y, et al. Characterizations of volatile organic compounds (VOCs) from vehicular emissions at roadside environment: The first comprehensive study in Northwestern China [J]. Atmospheric Environment, 2017,161:1-12.
[54] 林理量.深圳市不同功能区夏秋季挥发性有机物污染特征研究 [D]. 北京:北京大学, 2021. Lin L L. Characteristics of volatile organic compounds in different functional areas of Shenzhen in summer and autumn [D]. Beijing: Peking University, 2022.
[55] Zhu B, Huang X F, Xia S Y, et al. Biomass-burning emissions could significantly enhance the atmospheric oxidizing capacity in continental air pollution [J]. Environmental Pollution, 2021,285:117523.
[56] Zheng J, Yu Y, Mo Z, et al. Industrial sector-based volatile organic compound (VOC) source profiles measured in manufacturing facilities in the Pearl River Delta, China [J]. Science of The Total Environment, 2013,456-457:127-136.
[57] 于广河,朱 乔,夏士勇,等.深圳市典型工业行业VOCs排放谱特征研究 [J]. 环境科学与技术, 2018,41(S1):232-236. Yu G H, Zhu Q, Xia S Y, et al. Emission characteristics of volatile organic compounds (VOCs) source profile from typical industries in Shenzhen [J]. Environmental Science & Technology, 2018,41(S1): 232-236.
[58] 黄沛荣,朱 波,张 月,等.PM2.5与O3协同控制视角下深圳市工业VOCs源谱特征 [J]. 中国环境科学, 2022,42(8):3473-3482. Huang P R, Zhu B, Zhang Y, et al. Source profile characteristics of industrial VOCs in Shenzhen from the perspective of PM2.5and O3synergistic control [J]. China Environmental Science, 2022,42(8): 3473-3482.
Source apportionment of atmospheric volatile organic compounds in summer and autumn in Shenzhen industrial area.
ZHANG Yue1, XIA Shi-yong1, WEI Cheng-bo1, LIU Shi-qi1, CAO Li-ming1,2*, YU Guang-he2, HUANG Xiao-feng1
(1.Laboratory of Atmospheric Observation Supersite, School of Environment and Energy, Peking University Shenzhen Graduate School, Shenzhen 518055, China;2.PKU-HKUST Shenzhen-Hong Kong Institution, Shenzhen 518057, China)., 2023,43(8):3857~3866
The long-term online observation of atmospheric volatile organic compounds (VOCs) was carried out in the northern industrial area of Shenzhen from July to October 2021 to analyze pollution characteristics of VOCs during ozone polluted days and non-polluted days. The refined source apportionment of VOCs was carried out by using ratio method of characteristics species and positive matrix factorization (PMF) model to analyze the concentration and OFP contribution of each emission source and the influence of meteorological conditions. The results showed that the average mixing ratio of TVOCs was 50.48×10⁻⁹, of which alkane contributed the most, followed by OVOCs and aromatic, accounting for 41.3%, 22.2% and 17.0% respectively. Comparing with non-polluted days, the mixing ratio of OVOCs increased the most during polluted days (63.1%). The ratio of characteristic species indicated that the area was mainly affected by vehicle emission and industrial solvent use. Five VOCs emission sources were determined by the PMF model, of which vehicle emissions and gasoline volatilization contributed the most to the concentration (28.2%), followed by solvent use (22.9%), process emissions (25.0%) and biomass combustion (20.4%). OFP contribution of process emissions and solvent use exceeded 70% during polluted days. The distribution characteristics with wind speed and direction indicated that vehicle emissions and gasoline volatilization, process emissions and solvent use mainly came from local emissions, while biomass combustion was more influenced by transmission from northeast. It is suggested to intensify local industrial and traffic source controls, while also paying attention to biomass combustion and strengthening joint prevention and control with neighboring areas.
industrial area;volatile organic compounds (VOCs);ozone formation potential (OFP);ratio method of characteristics species;positive matrix factorization (PMF)
X511
A
1000-6923(2023)08-3857-10
张 月(1998-),女,安徽人,北京大学硕士研究生,主要从事大气挥发性有机物的测量及污染研究.发表论文2篇.zhang- yue@stu.pku.edu.cn.
张 月,夏士勇,魏成波,等.深圳工业区夏秋季大气挥发性有机物来源研究 [J]. 中国环境科学, 2023,43(8):3857-3866.
Zhang Y, Xia S Y, Wei C B, et al. Source apportionment of atmospheric volatile organic compounds in summer and autumn in Shenzhen industrial area [J]. China Environmental Science, 2023,43(8):3857-3866.
2023-01-05
深圳市科技计划项目(KCXFZ202002011006340)
* 责任作者, 高级工程师, climing@pku.edu.cn

