Local hardening and asymmetric twin growth by twin-twin interactions in a Mg alloy
Krishn Ynpui ,Mriyppn Arul Kumr ,Jixing Wng ,Xin Wng ,Timothy J.Rupert ,Enrique J.Lverni ,Julie M.Shoenung,Irene J.Beyerlein,e,Subhsh Mhjn
a Department of Materials Science and Engineering,University of California,Davis,CA 95616,USA
b Materials Science and Technology Division,Los Alamos National Laboratory,Los Alamos,NM 87545,USA
c Department of Mechanical Engineering,Materials Department,University of California,Santa Barbara,CA 93106,USA
d Department of Materials Science and Engineering,University of California,Irvine,USA
e Materials Department,University of California,Santa Barbara,CA 93106,USA
Abstract In this study,the role of twin-twin interactions on the distributions of local defects (e.g.,dislocations) and stress field in a magnesium alloy is investigated.A co-zone tensile twin junction in a deformed Mg-3wt.%Y alloy is analyzed using transmission electron microscopy (TEM).The results show that the morphology of the impinging twin is asymmetric,and the non-interacting boundary of the recipient twin is irregular.Detailed analysis of TEM images reveals that type-II pyramidal dislocations concentrate in the vicinity of the twin-twin junction site.The same 〈c+a〉 dislocations are also observed inside the interacting twin domains along with a few 〈a〉 dislocations.The 〈c+a〉 dislocations emanating from the impinging twin boundary have edge character and are extended with faults parallel to the basal plane.In contrast,the 〈c+a〉 dislocations connected to the recipient twin are predominantly screw orientation and compact.Elasto-viscoplastic fast Fourier transform based crystal plasticity calculations are performed to rationalize the observed twin morphology and local dislocation distribution.The model calculations suggest that the local stress field generated at the junction site where the two twins meet are responsible for the experimentally observed concentration of 〈c+a〉 dislocations.The calculated stress field are asymmetric with respect to the junction site,explaining the observed asymmetric morphology of the impinging twin.Overall,these finding show strong effects of twin-twin interactions on the distribution of dislocations as well as the evolution of the twinned microstructure and as such,can help advance understanding of twinning in Mg alloys and their effect on mechanical behavior.
Keywords: Tensile twins;Twin-twin intersections;Mg alloys;Crystal plasticity;TEM.
1.Introduction

Non-parallel twin interactions create twin-twin junctions(TTJ).Based on the crystallographic misorientation between the two interacting twins,twin-twin junctions can be categorized into two types: cozone (two twins share the same zone axis) and non-cozone [30].In the latter,the intersecting twins do not share the same zone axis and the angle between the zone axes will be either 2π/3 orπ/3.Both cozone and noncozone interactions are observed in Mg and its alloys and hence believed to significantl affect microstructural evolution and materials performance [31–37].TTJs,for example,have been identifie as nucleation sites for dislocations,twins,and cracks[32,38,39].The local stress/strain field and defects associated with TTJs can potentially control the growth of interacting twins [40,41].Lloyd et al.recently showed that the presence of TTJs significantl alters the microstructure under shock loading in Mg [42].Specificall,they found that the interaction of newly formed twins with the pre-existing TTJs changes twin formation into an irreversible process.When the annealed Mg alloy is subjected to rolling direction (RD)compression,newly formed deformation twins do not have enough time to interact with defects like dislocations,and so twinning becomes nearly reversible.On the other hand,in the pre-strained sample,which already contains TTJs,the shock loading-induced twins interact with the pre-existing TTJs and develop a stable twinned microstructure.Consequently,any newly formed twins became irreversible and retained after shock recovery.Recent work by Zhang et al.reveals that the presence of TTJs can promote recrystallization,helping to weaken the texture and achieve uniform grain growth in Mg alloys [43].It has also been well documented that the presence of TTJs strongly affects material strength and strain hardening response,mainly under cyclic loading [32,33,39].Yu et al.showed that the yield strength and strain hardening rate increases with the loading cycles,which is directly correlated with an increase in the number of TTJs [33].Thus,the understanding of TTJ formation,growth of interacting twins,and the local defects present within and around the junctions is of paramount importance.

In this work,transmission electron microscopy (TEM)diffraction and related contrast imaging techniques are employed to characterize the defect structure inside and around a co-zone TTJ in an Mg-3wt.%Y alloy.The detailed analysis reveals many important findings (i) pyramidal 〈c+a〉dislocations concentrate near TTJ in the matrix grain;(ii) the same pyramidal 〈c+a〉 dislocations develop inside both twin domains;and (iii) the morphology of the impinging twin is asymmetric.To understand and rationalize the experimental observations,fast Fourier transform-based crystal plasticity modeling is performed.The model calculation shows that the interaction between twins introduces more pyramidal 〈c+a〉dislocations in the vicinity of the junction in the matrix grain.Experimentally observed dislocations inside the twin domains are mostly likely developed during macroscopic loading.The model calculated stress fiel is asymmetric about the impinging twin and thus explains the experimentally observed asymmetric twin morphology.
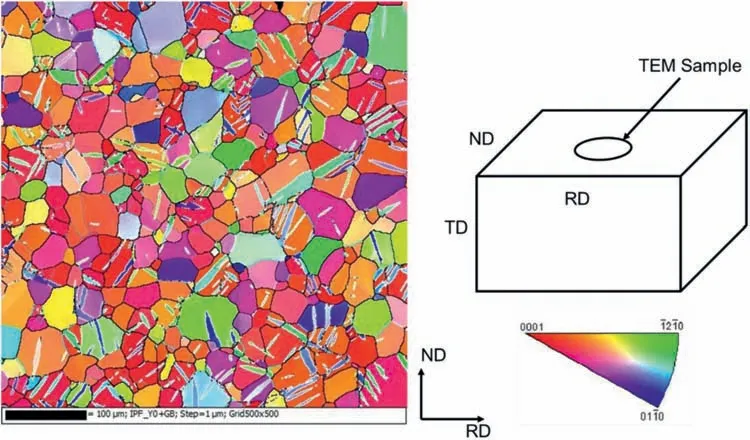
Fig.1.A typical electron backscatter diffraction (EBSD) inverse pole figur (IPF) image of Mg-3wt.%Y alloy,which is deformed in compression along the RD.The schematic shows the macroscopic sample directions of the alloy in relation to the transmission electron microscope (TEM) foil preparation.Here RD,TD and ND refer to rolling,transverse and normal directions,respectively.
2.Experimental methods
In this work,Mg-3wt.%Y alloy is selected to investigate the twin-twin interactions and associated defects.It has been well recognized that the addition of rare-earth element Y improves the strength and ductility of the magnesium alloy by increasing the pyramidal 〈c+a〉 activity via lowering the I1 stacking fault energy and by increasing the barrier for tensile twinning[45–47].Further,in our recent study,the mechanical properties and the evolution of crystallographic texture of Mg-3wt.%Y alloy are studied [48].It provides the material data for the EVP-FFT calculation,which is set up in the next section.Mg-3wt.%Y alloys were obtained from the Helmholtz-Zentrum Geesthachat Center for Materials and Costal Research.Prior to recrystallization at 450 °C for 10 min,the homogenization of cast ingots and hot rolling were performed at 500 °C.The annealing resulted in a fully recrystallized twin-free microstructure with an average grain size of 26 μm.Subsequently,the annealed rolled sheet was sectioned using electrical discharge machining (EDM) to make cuboids of dimensions 3.3×3.3×5.0 mm with the longest dimension along the rolling direction (RD).The cuboids were then deformed in compression at ambient temperature to an engineering strain of 2% along the RD at a strain rate of ∼10−3s−1using 8801 servo-hydraulic universal testing equipment (Instron Inc.,USA).Refer to [48] for a detailed description of the material and mechanical testing procedures.
The microstructure of the deformed Mg-3wt.%Y alloy samples was examined using a JEOL JEM 2100F-AC TEM,operating at 200 kV.The TEM samples were prepared using an FEI Scios dual-beam focused ion beam (FIB) equipped with a Ga-ion source.The prepared TEM samples and its corresponding orientation with respect to the sample coordinate system are provided in Fig.1.The crystallography of grains and twins present in the TEM samples was studied by analyzing the observed selected area electron diffraction (SAED)patterns.Characteristics of the dislocations in the TEM samples were examined using the invisibility criteria,where a perfect lattice dislocation becomes invisible when the vector product g.b=0,where g is the operating reflectio used and b is the corresponding Burgers vector of the dislocation.The glide (habit) planes of the dislocations (twins) were identifie from the observed diffraction patterns coupled with surface trace analysis.
Fig.1 shows a typical EBSD inverse pole figur (IPF)image of the deformed Mg-3wt.%Y alloy,which contains grains and individual twins,as well as TTJs formed across some grains.The normal to the image plane is oriented along the macroscopic transverse direction (TD) of the sample.The schematic shows the relation between the macroscopic sample directions and the region that was used for TEM sample preparation.The normal to the TEM sample is oriented along the TD of the sample.
3.Numerical methods
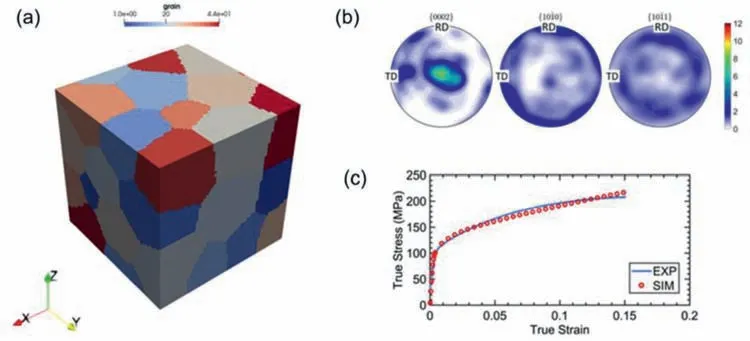
Fig.2.(a) Polycrystal model for calibrating dislocation density-based hardening model parameter;(b) initial texture for the polycrystal model;(c) model predicted strain-stress response for rolling direction tension along with the experimental data [48].
In this work,an elasto-visco-plastic fast Fourier transform(EVPFFT) based crystal plasticity model is employed to calculate the local stresses and dislocation field associated with a twin-twin interaction in Mg-Y alloy.Here,the formulation that combines the original EVPFFT framework [49] with inclusion of discrete intragranular twin domains [41,50,51] and with dislocation density (DD) based hardening for the critical resolved stress of each slip system [52] is used.Before performing the twin-twin interaction calculations,as a firs step,the DD model parameters are identifie using the experimentally measured stress-strain responses of the Mg-3wt.%Y alloy.Recently,using the effective medium visco-plastic selfconsistent (VPSC) framework,Wang et al.[48] obtained the DD model parameters for the same material system.Thus,the model parameter calibration process is started from the parameters listed in [48] and adjusted them to capture the experimental stress-strain curves using the EVPFFT framework.Deformation at every material point in the EVPFFT model is carried by a combination of anisotropic elasticity and crystallographic slip-mediated visco-plasticity.The anisotropic elastic constants (in GPa) of the simulated material are taken as: C11=59.5,C12=26.1,C13=21.8,C33=65.6 and C44=16.3[53].Plasticity is assumed to be accommodated by basal 〈a〉,prismatic 〈a〉,and pyramidal-II 〈c+a〉 slip modes.The initial dislocation density for each slip system is assumed to be 10×1010m−2.A 3D polycrystalline microstructure with 44 equiaxed grains was made through Dream3D,see Fig.2(a).The distribution of the initial crystallographic orientation of the grains is shown in Fig.2(b).The model unit cell is discretized into 60×60×60 voxels.Uniaxial tension along the rolling direction is simulated at a strain rate of 1.0×10⁻³s−1.The model predicted stress-strain response along with the experimental data is shown in Fig.2(c).For the parameter set listed in Table 1,the model response shows good agreement with the experiment[48].This DD model parameter set was used in the following explicit TTJ simulation,which is discussed later.
Table 1 Calibrated dislocation density-based hardening model parameters for Mg-3%Y.Here ,D,g and Q refer to initial lattice friction,dislocation generation rate,drag stress,normalized stress-independent activation energy,and rate coefficien for dislocation debris formation,respectively.For more details,refer to[52].

Table 1 Calibrated dislocation density-based hardening model parameters for Mg-3%Y.Here ,D,g and Q refer to initial lattice friction,dislocation generation rate,drag stress,normalized stress-independent activation energy,and rate coefficien for dislocation debris formation,respectively.For more details,refer to[52].

Table 2 The magnitudes of g•b values used in this study.
3.Results
3.1.Cozone twin-twin interaction
Fig.3(a) shows the weak beam dark fiel (WBDF) TEM micrograph of the deformed Mg-3wt.%Y alloy consisting of two grains labeled as G1 and G2.Grain G2 is out of contrast and the white dashed line highlights the grain boundary.Grain G1 contains two twins labeled as T1 and T2.Twin T2 terminates at the boundary of twin T1,whereas twin T1 terminates at the grain boundary.Twins T1 and T2 interact and form a TTJ.Both twins are highlighted by the white dashed lines for clarity.Based on the observed configuration hereinafter,twins T1 and T2 are referred to as the recipient and impinging twins,respectively.

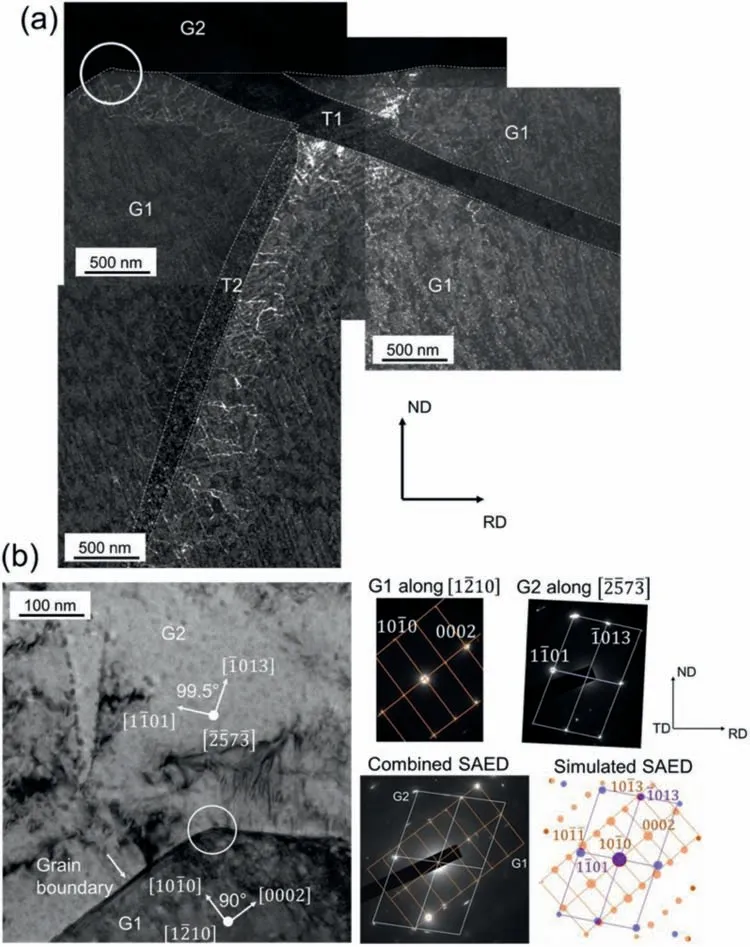
Fig.3.(a) A WBDF TEM micrograph showing the two grains G1 and G2.The G1 contains a twin-twin junction,where twin T1 is terminated at the grain boundary and twin T2 is terminated at T1 boundary.(b) A bright fiel TEM image showing a small portion of two grains (indicated by a white circle in (a))along with a combined experimental SAED pattern acquired from a region enclosed by a small white circle.In the combined experimental SAED pattern,the white grid represents G2 spots,and the orange grid outlines the spots corresponding to G1.A corresponding simulated pattern is also provided,where the orange spots represent G1 and the blue spots represent G2.The individual SAED patterns acquired from the regions of G1 and G2 are also provided for clarity,where G1 is along the orientation and G2 is along the orientation.

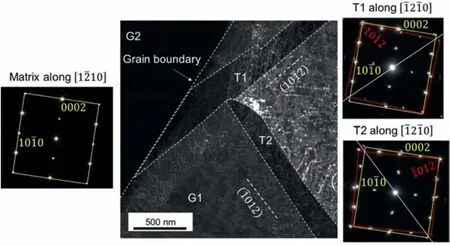
Fig.4.A WBDF TEM image of a small region in G1 that consists of both T1 and T2 twins.The observed SAED patterns confir that both T1 and T2 are of tensile twins.Further,the morphology of the impinging twin T2 is asymmetric.In the SAED patterns the yellow-colored boxes outline the spots corresponding to the matrix whereas the red-colored boxes outline the spots corresponding to twins T1 and T2.The white-colored dashed lines represent the traces of habit planes of T1 and T2.
3.2.Dislocations in the vicinity of TTJ


Table 3 Crystallography of all six pyramidal slip systems that are considered in this work.

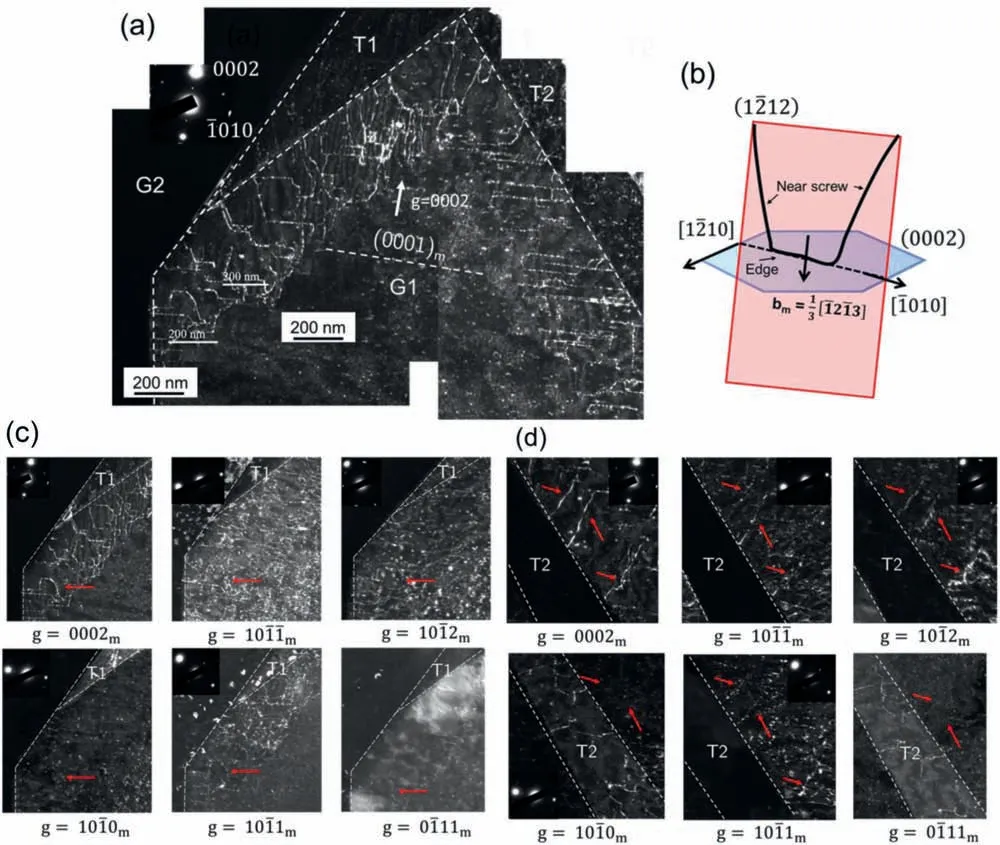
Fig.5.(a) a WBDF TEM image shows the interaction of matrix 〈c+a〉dislocations with the boundaries of T1 and T2.(b) The schematic demonstrates the observed 〈c+a〉dislocations in near screw and edge orientations on type-II pyramidal plane i.e., .The WBDF images in (c) and (d) show the dislocation contrast variation in the vicinity of T1,T2,and for several operating reflection ‘g’ provided for each image.The red arrows point to the contrast variation from a few specifi dislocations.

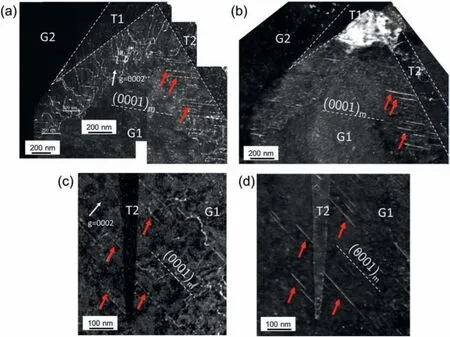
Fig.6.WBDF TEM images (a) and (c) show the projected line segments of 〈c+a〉 dislocations both parallel and non-parallel to the basal plane for the reflectio g=0002.The dislocations parallel to the basal plane are in edge orientation as described in the schematic (Fig.5b).However,after a slight tilt about the axis in (b) and (d),these dislocations exhibit stacking fault contrast parallel to the basal plane,whereas non-basal components are disappeared.The red arrows point to the contrast variation for a few specifi dislocations before and after a slight tilt about the axis.
3.3.Defect structures within the twin domains


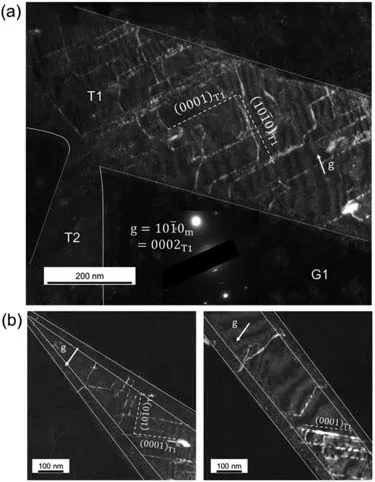
Fig.7.WBDF TEM images showing the structure of dislocations inside twin T1.(a) The dislocations are visible for g=0002 reflection suggesting that they have a strong 〈c〉 component,and the dislocations are projected in different directions on the plane of the micrograph.(b) Shows there are a few non-basal 〈c〉 components inside T1 for g=.The solid lines in the micrographs represent the twin boundary.
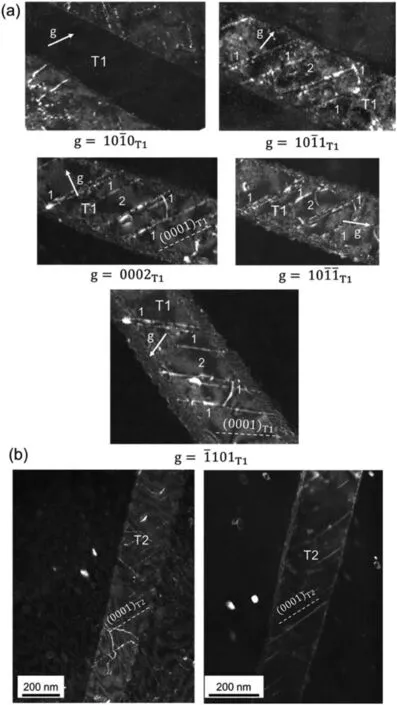
Fig.8.(a) WBDF micrographs showing the variation in dislocation contrast in the domain of twin T1 for the various operating reflections (b) The TEM images showing stacking fault contrast parallel to the trace of the basal plane after tilting the sample about the axis of twin T2.

4.Discussion

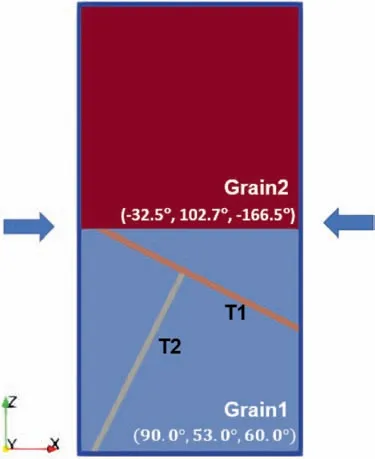
Fig.9.Model arrangement for explicit simulation of twin-twin junction within an EVPFFT framework.
4.1.Crystal plasticity calculations

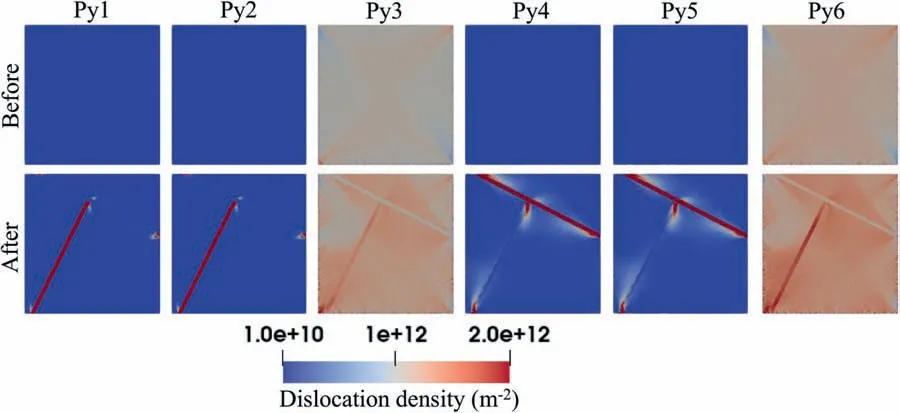
Fig.10.Effect of twin-twin junction formation on pyramidal slip dislocation density distribution.The firs and second rows present the dislocation field before and after twinning,respectively,at 2% strain.
The simulation of twin-twin interaction is performed using the following sequence.First,the entire unit cell is compressed along the X-direction under a constant strain state(0.0001 1/s) and the boundaries in the Z and Y-directions are stress-free.At an applied strain of 2% the voxels lying within T1 and T2 are firs reoriented to their corresponding twin variant.Then the characteristic twin shear of 13% for Mg is applied incrementally and homogeneously across each twin domain in 1000 steps.
4.2.Origin of pyramidal 〈c+a〉 dislocations in the matrix grain
To understand the experimentally observed dislocation distributions,the model calculated DD field of all six pyramidal-II slip systems are analyzed here.Table 3 lists the crystallographic details these six pyramidal-II slip systems.Fig.10 shows these field within the parent G1,which includes the interacting twin domains.For comparison,the DD field in the twin free crystal but generated under the same macroscopic strain are given in the firs row and those with the TTJ in the second one.Following the convention in Table 3,the experimentally observed 〈c+a〉system is Py6.The model indicates that macroscopic straining increases the DD of systems Py3 and Py6 to ∼1×10¹²and∼1.5×10¹²,respectively,from the initial DD of 1×10¹⁰in the twin-free crystal.The experimentally observed Py6 slip dislocations in the grain G1,therefore,could have been generated independent of the TTJ.As described earlier,the model in this calculation included the neighboring grain G2.To test the effect of G2,another simulation without it is performed.Interestingly,systems Py1,2,4,and 5 are the most active compared to Py3 and Py6.The implication is that neighboring grain G2 and its interaction with G1 alter the stress fiel inside G1 in a way that favored activation of Py3 and Py6.Although not shown,the calculations confir that the activation of basal 〈a〉 slip is not significan during the initial loading and also in the process of twin-twin junction formation.
4.3.Origin of pyramidal 〈c+a〉 dislocations inside the twin domains
Here,the source for the experimentally observed pyramidal dislocations inside the twin domains are analyzed.The second row in Fig.10 shows the DD field after forming the TTJ.It reveals that the DD of systems Py3 and Py6 increase around twins T1 and T2 in the matrix,and inside twin T2.Further,DD for systems Py1 and Py2 increased inside T2,whereas DD for systems Py4 and Py5 increased inside T1.The direct comparison of the firs and second rows reveals that twinning promoted DD of systems Py1,2,4 and 5 more so than in systems Py3 and 6.However,the TEM analysis did not fin these slip dislocations inside the twin domains.At the same time,although the predicted increase in Py6 agrees with the TEM observation,the percent increase for Py6 in the twin domains is relatively small.These model predictions suggest that the experimentally observed Py6 dislocations inside the twin domain did not develop due to the TTJ.Rather they are likely to be developed during the initial loading before twinning and/or by dislocation transmission from the surrounding matrix into the twin domains.
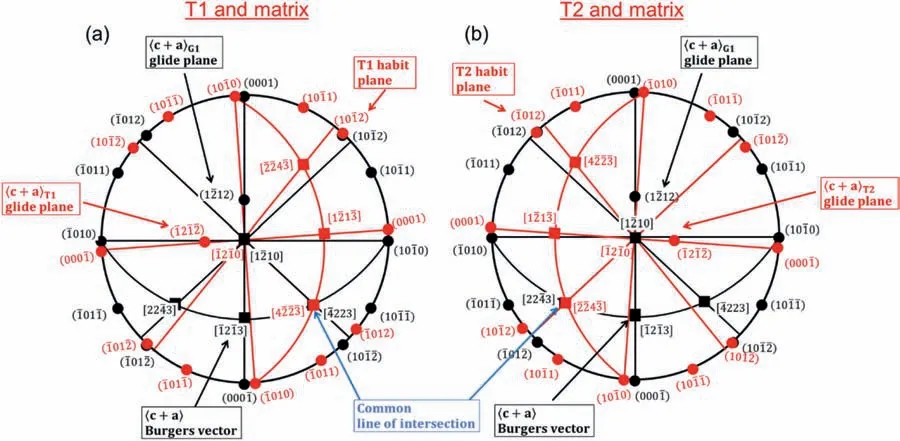
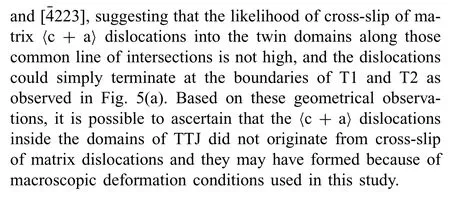
Fig.11.Standard HCP stereographic projections showing the geometric relation between the
4.4.Nature of pyramidal 〈c+a〉 dislocations in the vicinity of TTJ

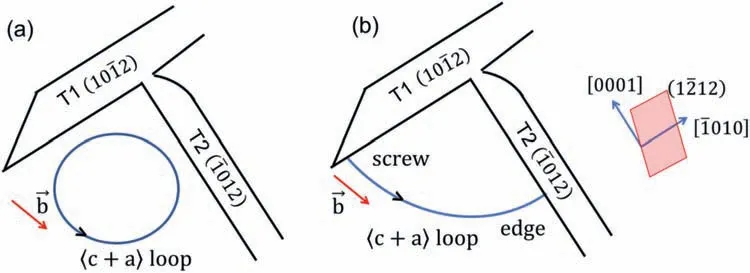
Fig.12.A schematic illustrating a situation where a 〈c+a〉 dislocation loop (under suitable stress concentrations) expands and interact with the boundaries of T1 and T2 in screw and edge orientations.This could result in a situation described in Fig.5(a).The red arrows in the schematic indicate the projected direction of the observed Burgers vector on the plane of the paper.The inset shows the relation between matrix directions and the glide plane of 〈c+a〉dislocations,where the normal of the glide plane makes angle of 58.5° with the [0001] direction.
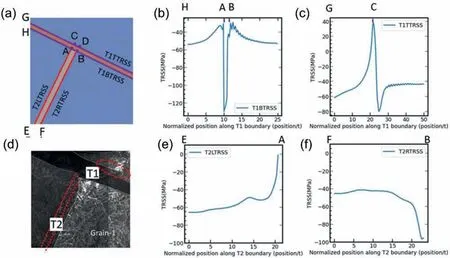
Fig.13.Distribution of TRSS field after twin-twin junction formation.(a) Simulated and (d) experimentally observed twin-twin junction.Key locations (A to H) are marked in (a).T1-TRSS profil along the (b) top and (c) bottom interface of T1.T2-TRSS profil along the (e) left and (f) right interface of T2.
Further,the TEM images provided evidence of loop contrast for 〈c+a〉 dislocations on the basal plane of Mg-3wt.%Y alloy and is consistent with the loop contrast observed in earlier studies [59–61].It was suggested that the〈c+a〉 dislocations gliding on type-II pyramidal plane could be dissociated into partial dislocations bounding a stacking fault.It is,therefore,reasonable to assume that the 〈c+a〉dislocations observed in the current study are dissociated into partial dislocations bounding a stacking fault on the basal plane.Although an explicit investigation has not be performed in this study to identify the stacking fault vectors,the earlier reports suggest the following dissociation mechanism that could lead to the appearance of stacking fault contrast on the basal plane [59].
Based on this reaction,here one can speculate a similar type of dissociation reaction may have produced the basal stacking fault contrast seen in Figs.6 and 8(b).In contrast to the edge 〈c+a〉 dislocations,the near-screw 〈c+a〉 dislocation segments do not show such a stacking fault contrast,as confirme by the absence of non-basal stacking fault contrast in Fig.6(b).The same conclusions can be made in Fig.6(c)and (d),where the 〈c+a〉 dislocations interacting with the T2 twin tip also exhibit basal stacking fault contrast.From Fig.6(b) the stacking fault density is higher at the T2 twin boundary.This is because the 〈c+a〉 dislocations interacting with the T2 twin are predominantly in edge orientation(see Fig.6(a)).In contrast,the 〈c+a〉 dislocations interacting with the T1 are predominantly in screw orientation,and like before,these screw 〈c+a〉 dislocations are not widely dissociated enough to show any stacking fault contrast.Consequently,the stacking fault density is lower on the T1 side.
4.5.Local stresses and growth of interacting twins
In this section,the local stress fiel in the vicinity of the TTJ is studied to understand the experimentally observed morphology of the interacting twins.The EVPFFT model provides the full stress and strain tensor field at every strain level.Using the full stress tensor,the resolved shear stress along the twinning shear direction(TRSS)is calculated to understand whether the local stress field favor the twin boundary migration.The TRSS on the interface can drive the twin dislocation to glide along a coherent twin boundary or the basal-prism facets,resulting in twin boundary migration [62–64].In the following description,T1-TRSS and T2-TRSS represent the resolved shear stress along the T1 shear direction and T2 shear direction,respectively.The TRSS field in the matrix near the twin interface (the purple and red lines shown in Fig.13(a)) are plotted in Fig.13(b,c,e,f).Fig.13(b) shows a negative(anti-twinning)T1-TRSS along the entire profil of the T1 bottom interface.Thus,the T1 boundary migration is not favored on the lower side.On the other hand,Fig.13(c)shows that there is a small region on the left of point C where T1-TRSS is positive,while there is a sudden decrease in the T1-TRSS on the right side of point C.This indicates that with further compression,the T1 top interface may undergo asymmetric growth,initiating growth on the left.One could use this asymmetric stress profil to understand the experimentally observed step-like feature in the TEM image (see the red circle in Fig.13(d)).
In Fig.13(e) and (f),the T2-TRSS is negative on both sides of T2,which suggests that the twin boundary migration on both sides of T2 is not favored.However,with further macroscopic loading,the twin boundary migration could result in an asymmetric growth of T2 since the resisting antitwinning T2-TRSS on the left side is much larger than that on the right side.Meanwhile,a steep decline of T2-TRSS in Fig.13(f)near point B implies that the twin boundary close to this site will be subjected to a larger resistance than other regions.This explains the sharp geometry of the T2 tip marked in Fig.11(d).In summary,the twin-twin interaction-induced stress field suggest that the migration of the T1 top boundary can create a non-smooth stepped boundary as observed experimentally in Fig.4.
5.Summary and conclusions
In this work,a combined experimental and numerical analysis is performed to understand the local defects within and in the vicinity of twin-twin junctions (TTJs).Cozone {10¯12}tensile twins in a deformed Mg-3wt.%Y alloy are selected for analysis.TEM analyses are employed to characterize the local defect structures in the vicinity of the TTJs as well as in the twin domains.To understand and rationalize the experimental observations,the crystal plasticity EVPFFT framework is used.The model microstructure of the TTJs is generated to match the experimentally observed TTJ microstructure,including the parent and neighboring grain orientations.The key finding from this combined experimental/modeling study are as follows:
•A high density of 〈c+a〉 dislocations is observed in the matrix surrounding the TTJ where the two twins meet.The same 〈c+a〉 dislocations have also been found inside the interacting twin domains,and some of these dislocations appear to have crossed the twin boundary.No pure 〈a〉dislocations are observed in the matrix regions.A similar observation,i.e.,the activation of 〈c+a〉 dislocations without any 〈a〉 dislocations,has been observed in Mg-0.6wt.%Y alloy also [11].
•The observed 〈c+a〉 dislocations in matrix grain exhibit a line contrast parallel to the trance of basal plane.A similar observation has been reported in pure Mg,Mg-3wt.%Y,and Mg-Li alloys [26,45,54,55].

•A detailed geometrical analysis of the dislocations and twins’ crystallography suggests that the observed 〈c+a〉dislocations inside the domains of TTJ did not transmit from the matrix grain,instead,they may have formed by the imposed macroscopic loading.
•The model calculations show that the twin-twin interactions increase the density of experimentally observed pyramidal 〈c+a〉 dislocations in the matrix domain,but not in the interacting twin domains.This implies that the experimentally seen pyramidal 〈c+a〉 dislocations in the twin domains most likely formed in the matrix during macroscopic loading before the TTJ formed and after the formation of twin domains,but not as a result of the TTJ.
•The model calculated local stresses suggest that the impinging twin will undergo an asymmetric growth process,which rationalizes the experimentally observed asymmetric twin morphology.Further,the local stress concentration in the recipient twin boundary explains the experimentally observed stepped features in its top boundary.
Overall,this work clearly shows that the twin-twin interactions can develop a high density of dislocations and stress concentrations in the localized regime near a TTJ.These local field are signatures of how the twin and microstructure would evolve in the presence of TTJs and in turn how TTJs affect macroscopic response.Such consequences of twin-twin interactions are non-negligible and hence need to be considered when attempting to understand and predict the deformation response of HCP Mg and its alloys.Specificall,these local defect details need to be accounted for in mechanistic constitutive laws that aim to capture the effect of twin-twin and twin-dislocation interactions[65–70].It will certainly improve the predictability of the models on the aspect of mechanical responses like strain hardening and also damage/failure behavior.
Declaration of Competing InterestThe authors declare that they have no known competing financia interests or personal relationships that could have appeared to influenc the work reported in this paper.
AcknowledgmentM.A.K.acknowledges support from the U.S.Dept.of Energy,Offic of Basic Energy Sciences Project FWP 06SCPE401.J.W.and I.J.B.acknowledge support from the National Science Foundation under Grant Number 2051390.K.Y.acknowledges the financia support from the National Science Foundation CMMI-1723539.X.W.,T.J.R,E.J.L.,and J.M.S.acknowledge the financia support from the National Science Foundation CMMI-1729829.
 Journal of Magnesium and Alloys2023年1期
- Journal of Magnesium and Alloys的其它文章
- Formation of carbon and oxygen rich surface layer on high purity magnesium by atmospheric carbon dioxide plasma
- Brittle and ductile characteristics of intermetallic compounds in magnesium alloys: A large-scale screening guided by machine learning
- Experimental study on uniaxial ratchetting-fatigue interaction of extruded AZ31 magnesium alloy with different plastic deformation mechanisms
- Assessment of Mg(OH)2/TiO2 coating in the Mg-Ca-Zn alloy for improved corrosion resistance and antibacterial performance
- Simultaneous refinemen of α-Mg grains and β-Mg17Al12 in Mg-Al based alloys via heterogeneous nucleation on Al8Mn4Sm
- Unveiling the influenc of dendrite characteristics on the slip/twinning activity and the strain hardening capacity of Mg-Sn-Li-Zn cast alloys
