Electrofluorochromic imaging analysis of dopamine release from living PC12 cells with bipolar nanoelectrodes array
Zhoyn Tin,Xing Qin,Fengying Sho,Xiuxiu Li,Zhi Wng,Songqin Liu,*,Yfeng Wu,*
a Jiangsu Engineering Laboratory of Smart Carbon-Rich Materials and Device,Jiangsu Province Hi-Tech Key Laboratory for Bio-Medical Research,State Key Laboratory of Bioelectronics,School of Chemistry and Chemical Engineering,Southeast University,Nanjing 211189,China
b State Key Laboratory of Analytical Chemistry for Life Science,School of Chemistry and Chemical Engineering,Nanjing University,Nanjing 210023,China
c Wuxi Institute of Inspection,Testing and Certification,Wuxi 214125,China
Keywords:Au nanoelectrodes array Bipolar nanoelectrodes Dopamine release Electrofluorochromic imaging Real-time monitoring
ABSTRACT The coupling of bipolar electrode (BPE) arrays and electrofluorochromic (EFC) imaging has exhibited great abilities in bioanalysis.However,the imaging resolution and analytical performance are hampered by the large size of the electrode and the rapid diffusion of EFC molecules on the electrode surface.Here,to address the challenges,bipolar nanoelectrodes (BPnE) array and in situ immobilization strategy of EFC molecules were proposed.Anodized aluminum oxide (AAO) template-assisted Au nanoelectrodes array with high density was fabricated as BPnE array for high spatial imaging resolution.By electrically polymerizing EFC molecules on the surface of single Au nanoelectrode,the rapid diffusion of EFC molecules on the electrode surface was not only avoided,but also realizing electrofluorescent imaging on an individual nanoelectrode.Using dopamine (DA) released from living PC12 cells as a model,the proposed strategy exhibited an ultra-high sensitivity for DA analysis with a detection limit of 0.45 nmol/L and the DA release amount from a single cell was calculated to be 0.13 pmol/L.Moreover,the dynamic change of DA release under the drug stimulation from living PC12 cells could also be monitored.
Dopamine (DA) acted as a chemical messenger in the central nervous system,and a considerable number of neurological and psychiatric disorders including Parkinson’s disease (PD),depression,and schizophrenia,were associated with neurological dysregulation and abnormal DA secretion [1–4].Compared with the classic techniques,such as high-performance liquid chromatography (HPLC) [5],surface-enhanced Raman scattering (SERS) [6] and fluorescence (FL) [7],the electrochemical technique was advantageous for analyzing DA due to its high sensitivity,fast response and economy [8,9].However,it could not achieve signal visualization.Consequently,a new method with both high detection sensitivity and signal visualization ability was highly desired.Electrofluorochromism (EFC),which could convert an electrochemical redox process from an electrical signal to a visible fluorescence signal with an elevated sensitivity,has recently attracted a lot of attention [10–12].When an external driving voltage was applied to an electrolyte solution,a “classical” (nonfluorogenic) redox reaction of interest was occurring at one pole and an electro-fluorogenic reaction was monitored at the other pole by optical microscopy[13–15].Our group previously combined bipolar electrode (BPE)with EFC technique for the first time to visually detect cell surface glycoprotein and glycan,some unique advantages were achieved:(1) The reporting and sensing poles of the closed BPE were physically separated,effectively avoiding the interaction of substances between two poles,which could also be used for two-phase reactions; (2) the cells at the sensing pole succeed in avoiding damage from the detection solvent or exposure to light at the reporter pole; (3) the EFC coupled the electrochemical and fluorescent signals,which had a sensitivity of electrochemistry as well as visibility of fluorescent images [16,17].Nevertheless,the spatial resolution was limited by the large size of the bipolar electrode and the rapid diffusion of EFC molecules on the electrode surface,which obscured the heterogeneity among single entities.
Nanoelectrodes possessed unique electrochemical properties including the dominance of surface-driven electrokinetic phenomena,rapid or selective mass transport,and fast response time[18,19].When individual nanoelectrodes were assembled into a large-area and highly ordered array,they could achieve nanoscale spatial resolution [20].Based on this unique advantage,they have gained diverse applications in biosensing [21,22] and intracellular electrophysiological recordings [23,24].
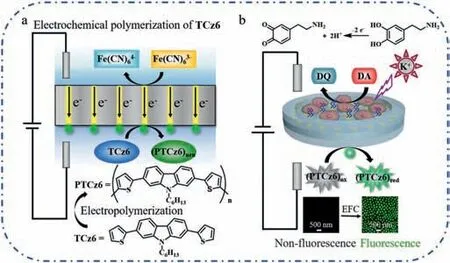
Scheme 1.(a) The basic principle of electrochemical polymerization of TCz6 to PTCz6 on Au nanoelectrodes array.(b) Schematic representation of electrofluorochromic imaging analysis of DA released from PC12 cells.After applying a voltage of 1.6 V between the two driving electrodes,DA released from PC12 cells at the anodic pole of BPnE was oxidized,and the non-fluorescent PTCz6ox electropolymerized at the cathodic pole was reduced to produce fluorescent PTCz6red,which was collected by CLSM.
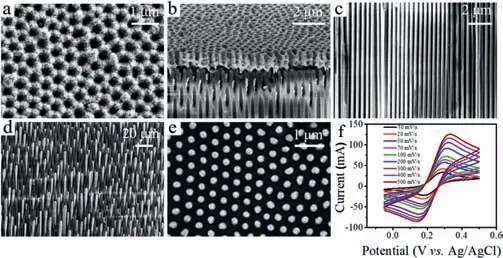
Fig.1.Top-view (a) and cross-section (b) SEM image of AAO evaporated the silver layer on one side.The cross-section (c) and top-view (d) SEM image of Au nanoelectrodes array after electrodeposition.(e) The top-view SEM image of polished Au nanoelectrodes array.(f) Cyclic voltammograms (CVs) of AAO assisted Au nanoelectrodes array in 1 mmol/L FcCH2OH containing 0.1 mol/L KCl at various scan rates.
In this work,to improve the imaging resolution and analytical performance,Au nanoelectrodes array was fabricated as bipolar nanoelectrodes (BPnE),and EFC molecule,poly(carbazolebisthiophene) derivative (PTCz6) was electropolymerized on the single Au nanoelectrode surface to avoid its rapid diffusion(Scheme 1a).Under a certain potential,DA released from PC12 cells induced by K+stimulation at the anodic pole was oxidized,and the non-fluorescent PTCz6oximmobilized at the cathodic pole was correspondingly reduced to fluorescent PTCz6red,the fluorescence signal on individual nanoelectrode was collected by confocal microscope (Scheme 1b).Ascribing to the superiority of BPnE and the immobilization strategy of EFC molecule,highly sensitive and selective detection of DA was accomplished.The dynamic change of DA release under the drug stimulation from living PC12 cells could also be monitored.This work may open up a new avenue to track neurotransmitters with high spatial resolution and provide a highthroughputin vitrodrug screening platform for DA-related psychiatric disorders.
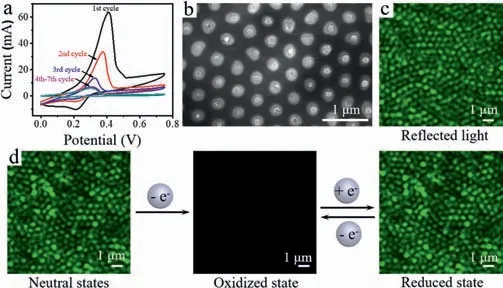
Fig.2.(a) CVs and (b) SEM image of electrochemical polymerization of PTCz6 with a scan rate of 0.1 V/s for 4 cycles.(c) Reflected light from the AAO assisted Au nanoelectrodes array recorded by CLSM.(d) CLSM images at different states.Under a certain potential,the fluorescent PTCz6neu on the Au nanoelectrodes array was oxidized to non-fluorescent PTCz6ox and they could be reversibly switched.
For fabricating AAO assisted Au nanoelectrodes array,a pulse electrodeposition method was applied [19],a 1 μm thick silver layer was firstly evaporated on one side of the AAO template with 200 nm diameter to serve as a working electrode (Figs.1a and b).To verify that the Au nanoelectrodes array was successfully obtained,the morphology of Au nanoelectrodes array was characterized by SEM.Figs.1c–e showed the SEM images of the crosssection or top-view of the AAO assisted Au nanoelectrodes array,it could be seen that the Au nanoelectrodes filled in the entire nanochannels and remained well-aligned (Figs.1c and d).To work as BPnE,each electrode should be uniform and independent without connecting,so the overgrowth Au nanoelectrodes were polished to the same length to ensure the electrochemical properties of each electrode were identical (Fig.1e) [25,26].
To investigate whether the AAO assisted Au nanoelectrodes array was electrochemically active,the steady-state electrochemical behavior was examined in 1 mmol/L FcCH2OH containing 0.1 mol/L KCl at various scan rates (Fig.1f).Peak-shaped characteristics were displayed in the CV curves at different sweep rates,because the high density of the nanoelectrodes array resulted in an overlap of the diffusion layers of adjacent electrodes [27,28].The consequence demonstrated that the fabricated Au nanoelectrodes array was electrochemically active and suitable for subsequent electrochemical imaging.
EFC molecular monomer 9-hexyl-2,7-di(2-thienyl)carbazole(TCz6) was firstly synthesized and characterized (Scheme S1,Figs.S1–S3 in Supporting information).To avoid the rapid diffusion of EFC molecules on the electrode surface,PTCz6 was electropolymerized on the single Au nanoelectrode surface by cyclic voltammetry in a homemade two-electrode cell (Fig.S4 in Supporting information).According to the CV curve of electropolymerization,the initial oxidation potential (Eonset) was 0.41 V(Fig.2a).The current was gradually decreased with the increasing polymerization time,implying that a layer of conjugated polymeric material was deposited on the Au nanoelectrodes array.During the electropolymerization process,the electrode was gradually covered by the polymer,and at the same time,the ion concentration in the solution decreased,which led to an increase in electrode contact resistance and liquid contact resistance,exhibiting a decreased current [29].The final oxidation and reduction current signals were approximately at 0.3 and 0.15 V,respectively,further confirming the oxidation and reduction of the resulting polymer deposited on Au nanoelectrode.
As displayed in SEM and magnified SEM images (Fig.S5 in Supporting information),the particle size of PTCz6 electrodeposited on the AAO assisted Au nanoelectrodes array was about 50–60 nm with a scan rate of 100 mV/s for 1 cycle.After 4 cycles,the particle size approximately increased to be 100–150 nm (Fig.2b),which was comparable to the size of Au nanoelectrodes.Therefore,a scan rate of 100 mV/s with 4 cycles was performed for electropolymerization.The obtained PTCz6 on the Au nanoelectrodes array was further confirmed by AFM.As exhibited in Fig.S6 (Supporting information),the Au nanoelectrode was independent without connecting with each other and the thickness of PTCz6 was about 25 nm.
Since Au nanoelectrodes and AAO have different reflectivity to light,the reflection of incident light was used to locate a single electrode on the confocal fluorescence microscope without a notch filter.As exhibited in Fig.2c,the reflected light imaging at each electrode was indeed uniform relative to its adjacent electrodes.The slight unevenness of the polished surface affected the difference in the brightness of the reflected light.The obvious green fluorescence was observed after polymerizing PTCz6 on the Au nanoelectrode surface,verifying that PTCz6 was successfully polymerized on the surface of AAO assisted Au nanoelectrodes array.Once an oxidation potential was applied,the fluorescent neutral state of PTCz6neuwas transformed into the non-fluorescent oxidized state of PTCz6ox.The quenching of the fluorescence was mainly due to the formation of cationic radicals along the conjugated main chain through electrochemical oxidation [30,31].When PTCz6oxwas reduced,the quenched fluorescence could be recovered and a high luminescence contrast was obtained between the fluorescent/non-fluorescent states (Fig.2d).Furthermore,it could be reversibly switched between oxidation and reduction states.
Herein,a homemade device combining the electrochemical workstation and confocal laser scanning microscopy (CLSM) was used to image electrochemical events (Fig.S7 in Supporting information).At the cathodic pole of BPnE,PTCz6 were electrically polymerized on the surface of Au nanoelectrodes array and was placed in an acetonitrile solution containing 0.1 mol/L TBAPF6,while in the anode reservoir,different concentrations of DA in PBS buffer(0.1 mol/L,pH 7.4) were injected.An electric field was generated in the electrolyte when a sufficiently high external voltage was imposed on the driving electrodes at each pole [32].According to the charge balance principle,an equilibrium electrochemical proceeding at one pole of the BPnE must be accompanied by an equal and contrary proceeding at the other pole.In our system,under a certain potential,DA was oxidized at the anodic pole of BPnE,nonfluorescent PTCz6oxwas correspondingly reduced to PTCz6redemitting fluorescent signal at the cathodic pole.Thus,the DA concentration at the anodic pole was detected by measuring the fluorescence intensity at the cathodic pole.To further confirm the EFC signal really originated from the DA oxidation,DA solution in the anode was replaced with PBS solution,under a voltage of 1.6 V,and the EFC signal in the cathode was negligible (Fig.S8 in Supporting information),demonstrating that the oxidation of water in the PBS did not occur at the same time as the oxidation of DA and had no influence on the EFC signal.
CV plots of 1 mmol/L DA were recorded at AAO assisted Au nanoelectrodes array with distinct oxidation–reduction peaks at 0.23 and 0.07 V,separately (Fig.S9 in Supporting information).The reduction potential of PTCz6 deposited on the surface of the Au nanoelectrode was 0.15 V.Taking into account the resistance from the solution and BPnE,an adequate external voltage was imposed on Ag/AgCl driving electrode to trigger the oxidation of DA and the reduction of PTCz6oxat two poles of the BPnE [13,33].As illustrated in Fig.S10 (Supporting information),no fluorescence signal was observed for the voltage less than 0.6 V,showing that the voltage was inadequate to simultaneously initiate the oxidation and reduction reactions at both poles.As the driving voltage increased from 0.8 V to 1.6 V,the fluorescence intensity gradually enhanced until reaching the maximum value.Therefore,1.6 V was adopted in the following experiments.
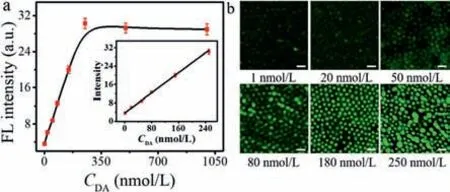
Fig.3.(a) The variation trend of fluorescence intensity (read with ImageJ software)at the cathodic pole of the BPnE array with the increasing concentration of DA at the anodic pole under a voltage of 1.6 V.The inserted graph was a normalized plot of fluorescence intensity as a function of CDA.(b) EFC images under different concentrations of DA at 1.6 V.Scale bar: 1 μm.
Under the optimum conditions,the AAO assisted Au nanoelectrodes array with PTCz6 electropolymerized on one side were used as BPnE to detect DA.At the anodic of BPnE,the DA aptamer was modified only on the surface of the Au nanoelectrode without contaminating the substrate around the chip,which greatly improves the detection sensitivity.The small molecular size of the DNA aptamer compared to conventional receptors (e.g.,enzymes or antibodies) allowed the modified DA molecules to be closer to the electrode surface during sensing measurements,giving optimal detection signals [34].Notably,the fluorescence intensity increased with the increment of DA concentration from 1 nmol/L to 250 nmol/L (Fig.3a).The value of the normalized EFC intensity scaled linearly withI=0.101CDA+3.582 (R2=0.995) with the concentration of DA from 1 nmol/L to 250 nmol/L.The limit of detection (LOD) of DA was 0.45 nmol/L (3σ/slope,whereσwas the standard deviation of blank samples),which was superior to previous reports based on other material-based electrodes (Table S1 in Supporting information).Compared with material-based electrode for DA detection,such as ITO electrode [35],glassy carbon electrode [36–38] and planar iridium oxide electrodes [39],the Au nanoelectrode [21,40] indeed improved the DA detection sensitivity,attributing to the higher surface area,excellent electrical conductivity and electrocatalytic properties,while the imaging resolution was not enough.We constructed highly ordered Au nanoelectrodes array not only possessed high detection sensitivity,but also provided high spatial resolution imaging,realizing electrofluorescent imaging on an individual nanoelectrode.The optical imaging of the array was displayed in Fig.3b to show single electrode responses and the fluorescence intensity changed uniformly with the increase of DA concentration.As aforementioned,this designed EFC sensor provided a new approach for imaging heterogeneous electrochemical processes.
For an excellent sensing system,selectivity was one of the main concerns.To evaluate the selectivity of the proposed EFC sensor,different interfering biomolecules contained 1 μmol/L ascorbic acid(AA),1 μmol/L uric acid (UA),1 mmol/L KCl and 1 mmol/L glucose(Glu) in 0.1 mol/L PBS were individually introduced into the sensing reservoir.As shown in Fig.S11a (Supporting information),only DA caused a significant increase in fluorescence intensity,while a negligible change in fluorescence was observed in the presence of other interfering substances,separately.The excellent selectivity was ascribed to the high recognition ability of dopamine and its aptamers.
Additionally,the storage stability of the EFC sensor was investigated for 4 weeks in the dark at 4°C,and it still maintained 96.7% of the initial signal intensity (Fig.S11b in Supporting information).Therefore,the proposed EFC sensor could be used for DA detection with acceptable stability.The reproducibility of the fabricated biosensor was also tested by measuring five individually fabricated Au nanoelectrodes array (Fig.S11c in Supporting information).The relative standard deviation (RSD) was less than 4.7%.When the same EFC sensor were used to test repetitively five times at the same concentration of DA (250 nmol/L),the RSD was 6.1%.After five measurements,the electrode surface was then analyzed by SEM,electropolymerized PTCz6 was still tightly packed on the surface of the electrode (Fig.S12 in Supporting information).Thus,the designed biochip possessed good repeatability and accuracy.
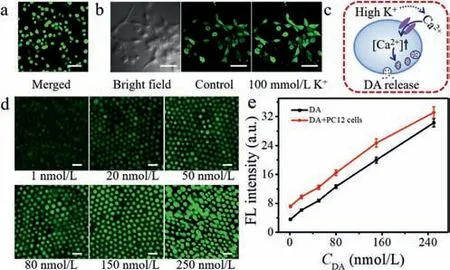
Fig.4.(a) Fluorescent images of PC12 cells co-stained with calcein AM (green fluorescence for live cells) and PI (red fluorescence for dead cells) at the anodic pole of the BPnE array after applying a voltage of 1.6 V.Scale bar: 50 μm.(b) CLSM images of PC12 cells stained with Fluo-4 after the high K+ stimulation.Scale bar: 50 μm.(c)Illustration of the molecular mechanism of K+-evoked DA release.(d) EFC images at the cathodic pole of the BPnE array for increasing concentrations of DA solution at 1,20,50,80,150,250 nmol/L (left to right) in the presence of 1×10⁴ PC12 cells/mL at the anodic pole,scale bar: 1 μm.(e) The fluorescence intensity vs. DA concentration in the absence (black line) and presence (red line) of the PC12 cells.
For monitoring K+-evoked dopamine release from PC12 cells,it was of great significance to ensure the cell viability under the applied voltage.Calcein-AM (green fluorescence) and PI (red fluorescence) were applied to stain living cells and dead cells,respectively,which could be easily differentiated by fluorescent images under a microscope.Almost all cells showed green fluorescence and thus maintained excellent viability under the voltage of 1.6 V(Fig.4a),evidencing the applied potential of 1.6 V on the driving electrode had little effect on the cell viability.
It was reported that an elevated level of extracellular K+could stimulate exocytosis via the depolarization of PC12 cells [41–43].Depolarization of the plasma membrane was likely to trigger the inflows of calcium ions into cellsviathe voltage-dependent calcium channels.Then the increase of intracellular calcium ions evoked the release of intracellular neurotransmitters [44,45].To verify this phenomenon in our system,a Fluo calcium indicator(Fluo-4) was introduced to stain PC12 cells.After K+stimulation,an obvious fluorescence intensity change was observed,confirming that the DA release was accompanied by an influx of Ca2+(Fig.4b),and the related preliminary mechanism was illustrated in Fig.4c.
To monitor the DA release from living PC12 cells,1×104PC12 cells digested with trypsin were added to the sensing reservoir of the BPnE in presence of various concentrations of DA,and acetonitrile solution containing 0.1 mol/L TBAPF6was added to the reporting reservoir.As displayed in Fig.4d,with the increment of DA concentration,the EFC intensity upon 100 mmol/L K+stimulated 1×10⁴PC12 cells was gradually intensified.Fig.4e showed the linear relationship between fluorescence intensity and DA concentration in the presence or absence of 1×10⁴PC12 cells.The actual DA released from PC12 cells was calculated by eliminating its blank signal (DA addition in PBS without cells),obtaining an average fluorescence intensity difference of 3.73.By matching the fluorescence intensity with the obtained calibration curve,the amount of DA released from the cells (1×10⁴cells) was calculated to be 1.31 nmol/L.Therefore,the amount of DA released from a single cell was 0.13 pmol/L,which was comparable with the literature reports [36,46].
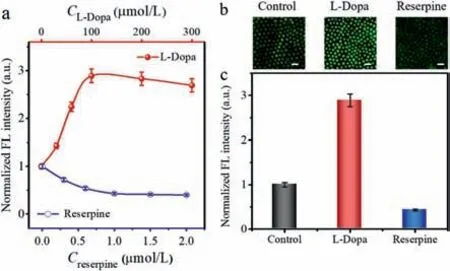
Fig.5.(a) The normalized FL intensity at the cathodic pole of the BPnE corresponding to DA released from PC12 cells pretreated with various concentrations of L-Dopa or reserpine in the anode.EFC images (b) and normalized FL intensity (c) of 20 nmol/L DA in the presence of 1×10⁴ PC12 cells/mL pretreated with PBS,L-Dopa or reserpine,respectively.Scale bar: 1 μm.
To evaluate the dynamic changes of K+-stimulated DA release,PC12 cells were pretreated with different concentrations of dopamine precursor (L-Dopa) or a vesicular monoamine transporter inhibitor (reserpine) for 1 h.Then 1×10⁴PC12 cells with 20 nmol/L DA in PBS buffer were added to the anode of BPnE,and the fluorescence signal in the cathode was recorded by CLSM after applying a voltage of 1.6 V.As expected,after the treatment with L-Dopa,the fluorescence intensity of PC12 cells gradually increased and reached the maximum value with the treatment of 100 μmol/L L-Dopa.In contrast,when PC12 cells were treated with reserpine,a declining trend was obtained and reached the minimum at the reserpine concentration of 1 μmol/L (Fig.5a).To accurately assess the effects of drugs on the release of DA from cells,the background fluorescence of the nonstimulated PC12 cells was normalized to a value of 1.0.As shown in Figs.5b and c,the acquired optical signal on the surface of nanoelectrode was easily visualized and a 2.9-fold fluorescence enhancement signal appeared upon stimulating cells with 100 μmol/L L-Dopa,which illustrated that cytosolic conversion of L-Dopa to DA could increase the storage of DA in catecholamine vesicles.Thus,the DA content was upregulated in LDopa treated cells cultured in a high K+medium.On the contrary,the EFC intensity of 1 μmol/L reserpine treated PC12 cells was reduced by 54% compared with untreated cells,further confirming that reserpine acted as an catecholamines in the neurotransmitter vesicles [47].Therefore,inhibitor of the vesicular monoamine transporter,displacing the EFC sensor could be used to dynamically monitor DA released from PC12 cells.
In summary,the coupling of BPnE arrays and EFC imaging were proposed for monitoring DA released from living PC12 cells with high EFC imaging resolution.AAO template-assisted Au nanoelectrodes array with high-density was fabricated as BPnE arrayvia in-situelectrochemical deposition.For further enhance the imaging resolution,the EFC molecule was electrically polymerized on the surface of single Au nanoelectrode with good reproducibility because the polymerization process could be easily controlled by monitoring the current and charge passed through electrochemical cells,which could not only avoid the rapid diffusion of EFC molecules on the electrode surface,but also realize electrofluorescent imaging on an individual nanoelectrode.Owing to the improved analysis performance and EFC imaging resolution,the proposed strategy exhibited an ultra-high sensitivity for DA analysis with a detection limit of 0.45 nmol/L and the DA release amount from a single cell was calculated to be 0.13 pmol/L.The constructed BPnE sensor showed remarkable selectivity toward DA among different anti-interference molecules,including uric acid,KCl,and glucose.In addition,the sensor could be used to dynamically monitor DA released from K+-stimulated PC12 cells after the addition of drugs.Apart from DA,this sensor with a rational design could also be used for the detection of other redox-active metabolites.
Declaration of competing interest
The authors report no declarations of interest.
Acknowledgments
This work was supported by the National Natural Science Foundation of China (Nos.22174016,21874018,21627806,21635004),Fundamental Research Funds for the Central Universities (No.2242022K40018).
Supplementary materials
Supplementary material associated with this article can be found,in the online version,at doi:10.1016/j.cclet.2022.06.079.
 Chinese Chemical Letters2023年1期
- Chinese Chemical Letters的其它文章
- Editor Note
- Probing region-resolved heterogeneity of phosphoproteome in human lens by hybrid metal organic frameworks
- Enrichment and analysis of circulating tumor cells by integrating multivalent membrane nano-interface and endogenous enzyme-signal amplification
- In situ fluorescence imaging of fungi via (1,3)-β-D-glucan aptamer and tyramide signal amplification technology
- Thiophene-based covalent organic frameworks for highly efficient iodine capture
- Tb3+-xylenol orange complex-based colorimetric and luminometric dual-readout sensing platform for dipicolinic acid and metal ions
