Characteristics and dynamic analysis of the February 2021 long-runout disaster chain triggered by massive rock and ice avalanche at Chamoli,Indian Himalaya
Tintin Zhng ,Yuping Yin ,Bin Li ,Xioji Liu ,Mng Wng ,Yng Go ,Jiwi Wn,Kushl Rj Gnywli
a Institute of Geomechanics,Chinese Academy of Geological Sciences,Beijing,100081,China
b China Institute of Geological Environment Monitoring,China Geological Survey,Beijing,100081,China
c College of Geology Engineering and Geomatics,Chang’an University,Xi’an,710100,China
d Sichuan Geological Survey Institute,Chengdu,610081,China
e Natural Hazards Section,Himalayan Risk Research Institute (HRI),Bhaktapur,44800,Nepal
Keywords:Rock and ice avalanche Disaster chain Long-runout Entrainment Flood
ABSTRACT A massive rock and ice avalanche occurred on the western slope of the Ronti Gad valley in the northern part of Chamoli,Indian Himalaya,on 7 February 7,2021.The avalanche on the high mountain slope at an elevation of 5600 m above sea level triggered a long runout disaster chain,including rock mass avalanche,debris avalanche,and flood.The disaster chain had a horizontal travel distance of larger than 17,600 m and an elevation difference of 4300 m.In this study,the disaster characteristics and dynamic process were analyzed by multitemporal satellite imagery.The results show that the massive rock and ice avalanche was caused by four large expanding discontinuity planes.The disaster chain was divided into five zones by satellite images and field observation,including source zone,transition zone,dynamic entrainment zone,flow deposition zone,and flood zone.The entrainment effect and melting water were recognized as the main causes of the long-runout distance.Based on the seismic wave records and field videos,the time progress of the disaster was analyzed and the velocity of frontal debris at different stages was calculated.The total analyzed disaster duration was 1247 s,and the frontal debris velocity colliding with the second hydropower station was approximately 23 m/s.This study also carried out the numerical simulation of the disaster by rapid mass movement simulation (RAMMS).The numerical results reproduced the dynamic process of the debris avalanche,and the mechanism of long-runout avalanche was further verified by parametric study.Furthermore,this study discussed the potential causes of disaster and flood and the roles of satellite images and seismic networks in the monitoring and early-warning.
1.Introduction
The landslide disasters on hill steep slope with large mass volume have a huge threat to human activities.On February 7,2021,a rock and ice avalanche with~2.7 × 10⁷m3occurred in the Chamoli district,the northern state of Uttarakhand,India.The debris avalanche blocked the Rishiganga valley and caused a massive flood.The geohazard damaged at least 20 fatalities and killed 177 persons(Yin et al.,2021).Over the past two decades,Himalayas have experienced a significant increase in temperature of 0.5ºC-1.5ºC,exceeding the global average,especially in winter (Shrestha et al.,1999;Bhutiyani et al.,2010;Negi et al.,2018).Geohazards in high mountains including ice/rock avalanches,landslides,debris flows and glacial lake outburst floods can be increased in association with the glacier activities(Allen et al.,2011;Fischer et al.,2012;Cook et al.,2016;Gruber et al.,2017;Andreas et al.,2018;Kirschbaum et al.,2019;Jacquemart et al.,2020).These rock-ice geohazards pose a serious threat to hydropower development,which is a concerning issue for high mountain regions (Richardson and Reynolds,2000;Wang et al.,2008,2019).In the Chamoli catastrophe on February 7,2021,Martha et al.(2021)estimated the initial sliding body volume to be 29.3 million m3through digital elevation model differences.Pandey et al.(2021) studied the failure phenomenon during the movement of the sliding body through remote sensing images and seismic wave data,and proposed that the failure of the initial sliding body was related to the structural planes.Shugar et al.(2021)stated that glaciers played an important role in this disaster.They also reconstructed the entire movement process of this disaster,and analyzed the characteristics of debris flow deposition,based on seismic wave data and digital elevation model differences.
Although some scholars have conducted research on the movement process of disasters,the literature about the dynamic process of disaster is insufficient to some extent.Numerical simulations such as discrete element method(DEM),smoothed particle hydrodynamics (SPH) and dynamic analysis are widely used to evaluate the dynamics of long-runout landslides,and the results provide a reasonable basis for early prediction and prevention of geological disasters (McDougall and Hungr,2004,2005;Yin et al.,2016;Gao et al.,2019).In recent years,the software rapid mass movement simulation (RAMMS) has been widely used in analyses of the dynamic process of geological disasters such as debris flows,snow avalanches and rockfalls in high mountain regions (Christen et al.,2010a,b;Aydin et al.,2014).The RAMMS runout model uses the two-dimensional (2D) depth-averaged shallow water equations for granular flows in three dimensions,which has been widely used in practice (Mahboob et al.,2015;Gan and Zhang,2019;Singh et al.,2020).Compared with other numerical simulation software,RAMMS with advanced three-dimensional (3D)visualization interface can be used to combine the results with digital elevation models,aerial images,and topographic maps.Moreover,the results can be imported into Google Earth,ArcGIS and other software,which provides great convenience for user analysis.In this study,the geohazard characteristic and the movement process were analyzed with satellite images,seismic data,videos,RAMMS simulation,etc.The scraping effect of debris avalanche,which plays a crucial role in the distal motion and volume amplification,and causes of disaster and flood were also discussed.
2.Regional geology
The initial failure of the Chamoli rock and ice avalanche was located at 30.375ºN and 79.732ºE in the middle section of the Himalayas.It originated on a steep slope along a tributary of Rishiganga River in Chamoli.Geologically,the avalanche was located in the Greater Himalaya tectonic unit.The Greater Himalayas,bound by the South Tibet Detachment System(STDS)and the Main Central Thrust (MCT),strike NWW-W-NEE (Fig.1).These young mountains are structurally fragile and are exposed to cold temperature that are common in the area.The strata of this region are mainly a high-grade metamorphic rock series composed of gneiss,schist,quartz sandstone,marble,and light-colored granite.Due to strong plate compression,the spatial distribution order of the strata is disordered,and some strata disappear.Moreover,the plateau is rapidly uplifting,the rivers are rapidly incising,causing strong weathering and unloading effects,and also the development of large discontinuity planes in the rock masses near large-scale faults (Fig.1).These large discontinuity planes often cut the rocks to form dangerous rock mass of various sizes.Topographically,the study area is exceedingly rugged with steep slopes and canyons.
3.Long-runout avalanche debris-flood disaster chain
3.1.Disaster chain zoning
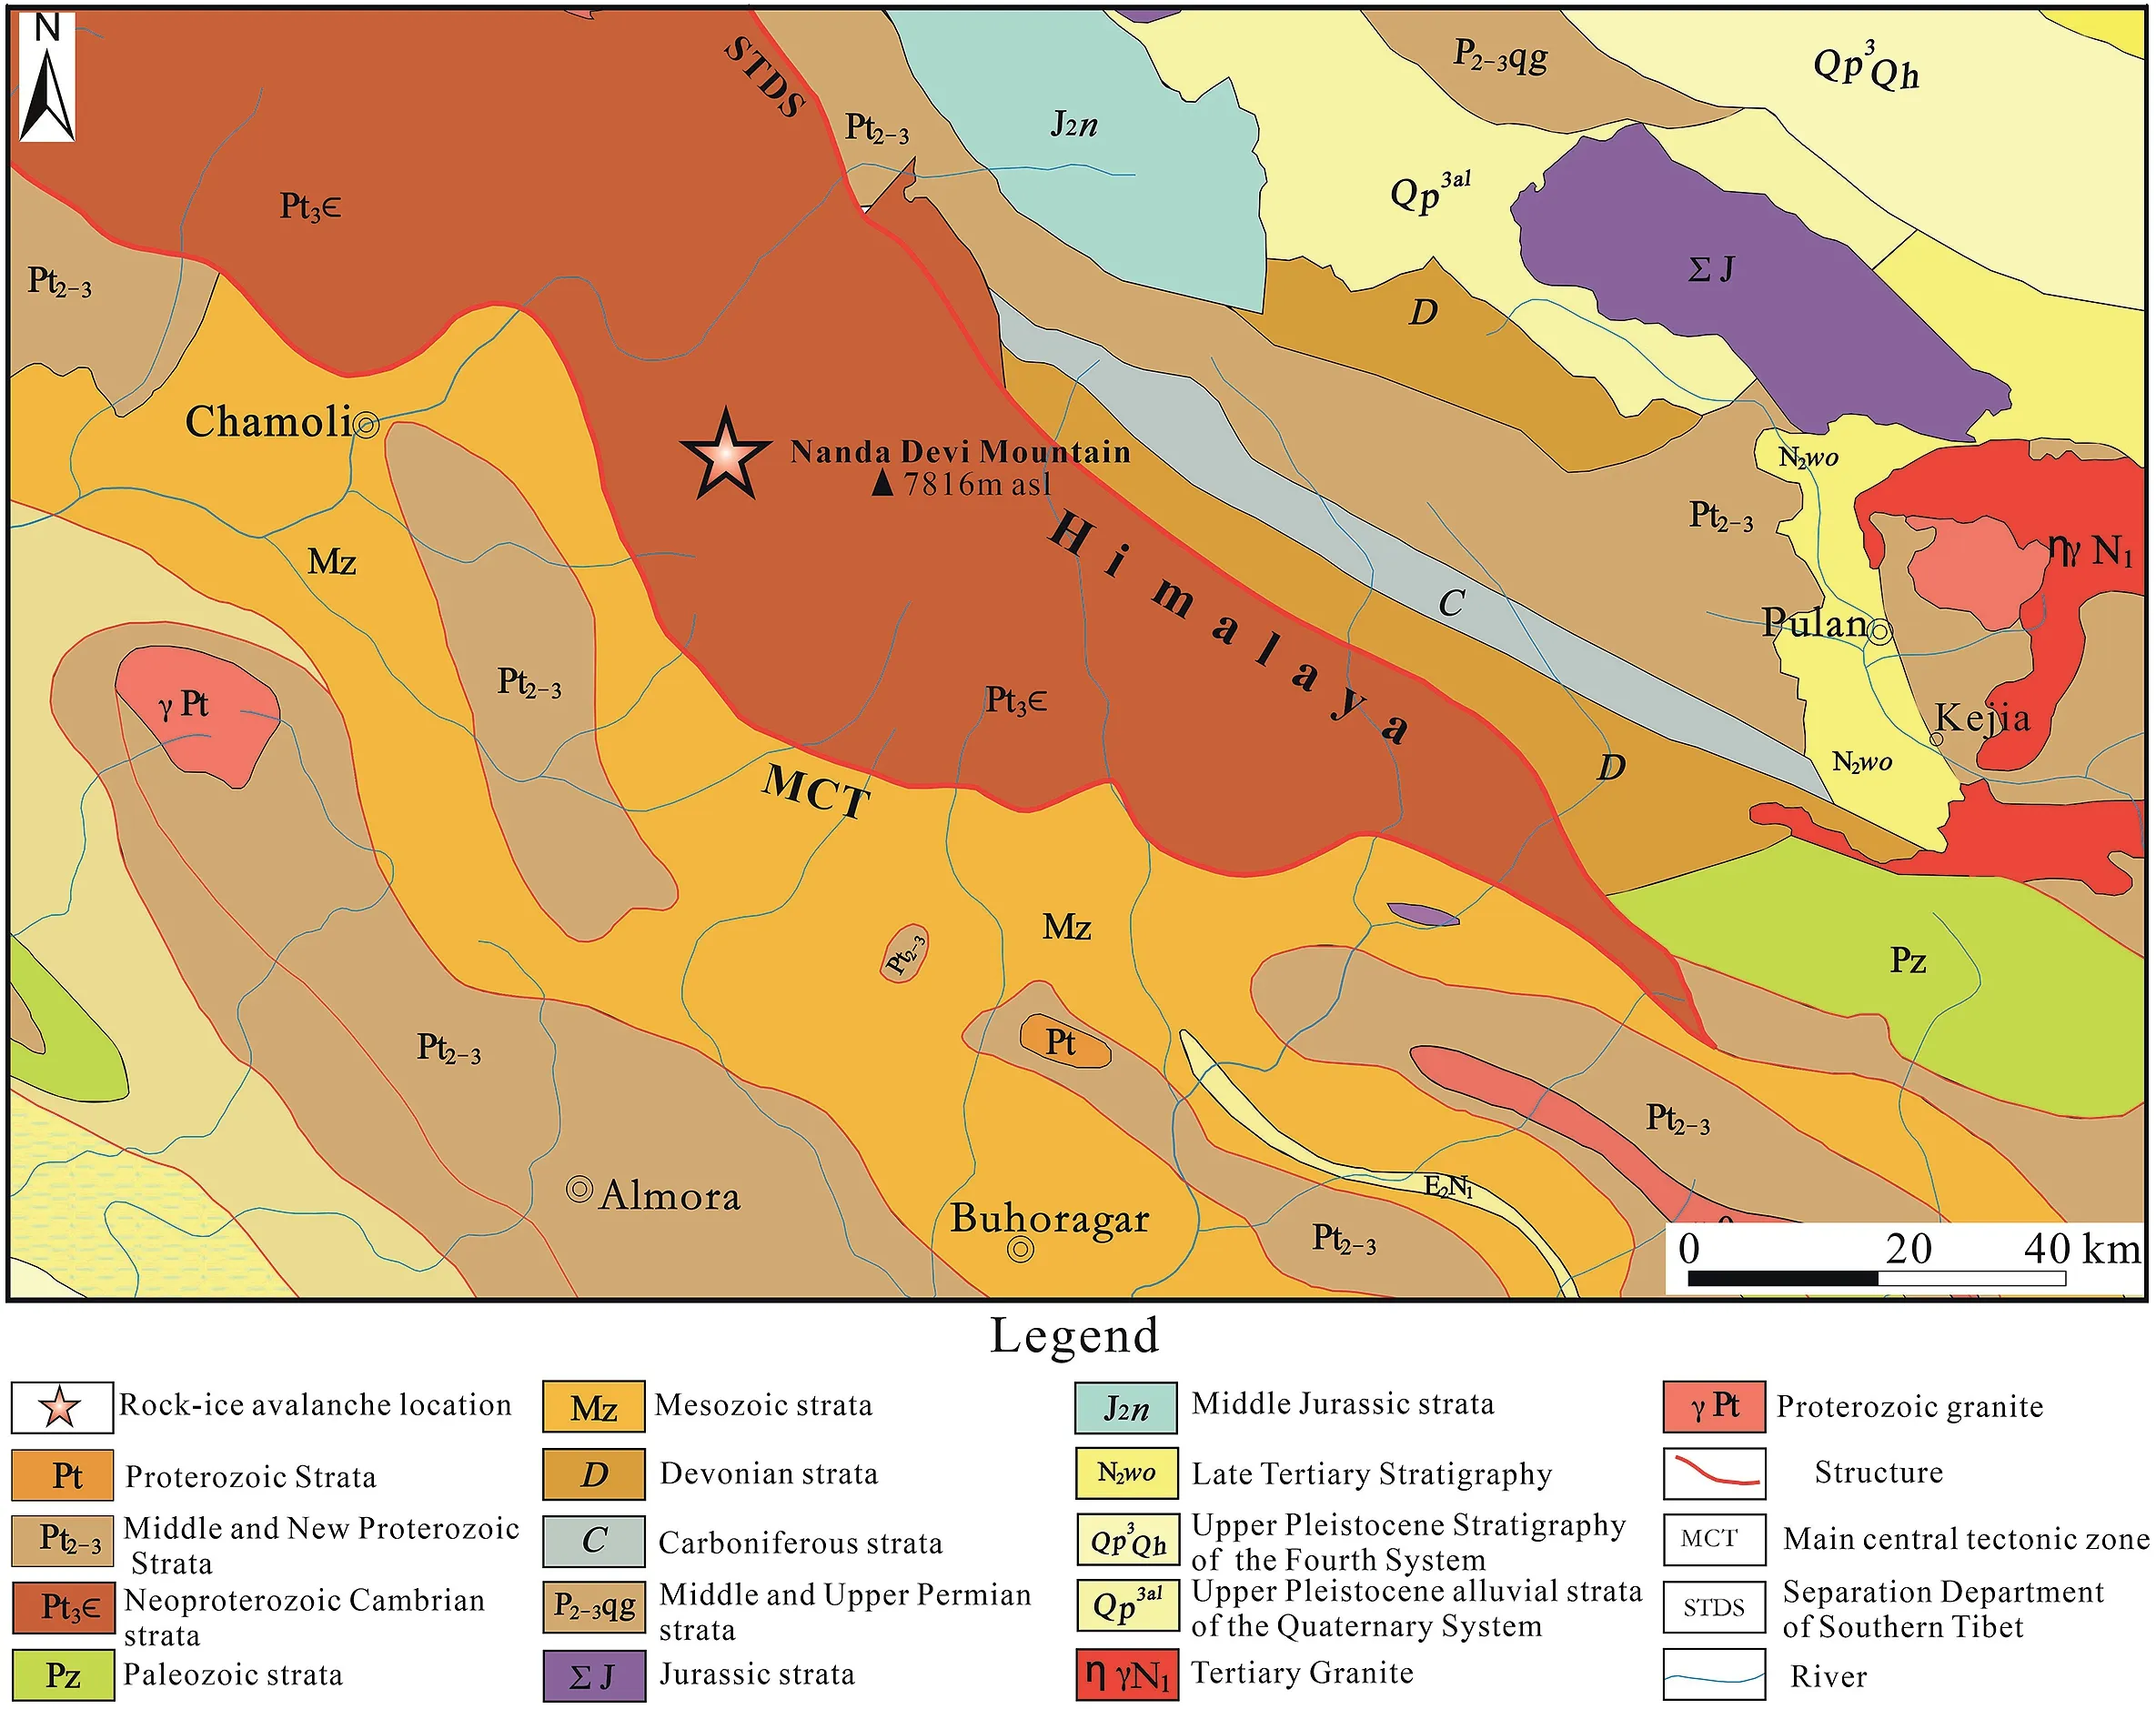
Fig.1.Location map of the Chamoli rock and ice avalanche and adjacent region (Pan et al.,2002).
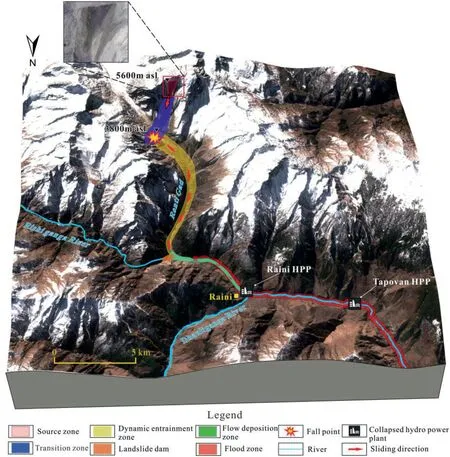
Fig.2.Zoning of the kinematic disaster chain in a 3D rendering of the local geography based on Sentinel-2A images.HPP stands for the hydraulic power plant.
Fig.2 shows the disaster chain by 3D rendering of the local geography based on Sentinel-2A images.After the slope failure in the source zone,the rock and ice mass slid to the valley floor below,with elevations varying from 5600 m above sea level (asl) to 3800 m asl.The mass travelled rapidly down the valley floor and continuously entrained old colluvial and loose deposits in its path.Subsequently,the frontal part of the debris accumulated at the Ronti Gad-Rishiganga River confluence and formed a large landslide dam,blocking the Rishiganga valley.The disaster chain can be generalized as follows:rock and ice avalanche →debris avalanche→debris-rich flash flood.The movement of the disaster chain can be divided into five stages: source zone,transition zone of gravitational potential energy to kinetic energy,dynamic entrainment zone,flow deposition zone,and flood zone (Figs.2 and 3).
3.2.Source zone
The source zone is the red zone in Fig.2 and zone I in Fig.3.This zone was located at the elevation of 4900-5660 m,with longitude length of 1100 m.Multitemporal satellite images from 2012 to 2021 were used to analyze the evolution of the disaster (Table 1).According to pre-event satellite images (Fig.4a-c),the source zone was covered with snow and glaciers,the exposed rock mass surfacewas smooth,and the ice cracks were not obviously identified before 2015.Numerous cracks appeared on the ice surfaces at the upper edge of the source area in 2017.The mean length of these cracks was~73 m,the longest one was 513 m,and the shortest one 15 m.The ice cracks were straight,curved,and not connected with each other (Fig.4d).In the satellite image on October 7,2017 (Fig.4d),however,the boundary cracks are so clear that their morphological characteristics can be recognized.The lengths of the head scar and the eastern boundary fracture were~630 m and~750 m,respectively (Fig.4e).According to post-event satellite image(Fig.4f),the rock mass that broke off occupied an estimated area of~0.32 km2,with a mean thickness of~75 m(Pandey et al.,2021).The failed rock and ice mass with a triangular wedge failure shape had an estimated volume of~28.3 million m3(80% rock and 20%ice) (Shugar et al.,2021).
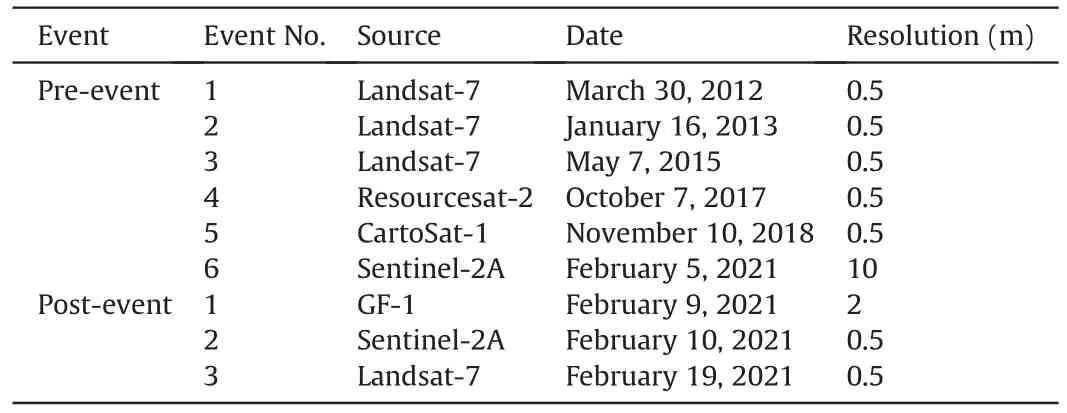
Table 1 List of satellite data used in Chamoli rock and ice avalanche.
3.3.Transition zone of gravitational potential energy to kinetic energy
The transition zone is the blue zone in Fig.2 and the zone II in Fig.3.After slope failure,the rock and ice mass descended from source zone to transition zone.The elevation difference between the scarp of the source area and the valley floor was approximately 1800 m,and that between the shear outlet and the valley floor was approximately 1100 m,with a mean fall height of 1450 m.The large elevation difference provided a massive amount of potential energy for the sliding mass,and the gravitational potential energy was converted into kinetic energy during falling(Fig.3).Eventually,the rock and ice mass was transformed into a fast-moving debris avalanche similar to a flowing fluid,which has fluidization effect after fragmentation and comminution.
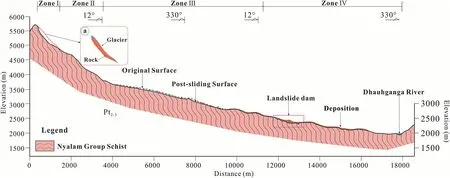
Fig.3.Longitudinal profile of the rock and ice avalanche disaster chain.I -source zone;II -transition zone;III -dynamic entrainment zone;IV -flow deposition zone.
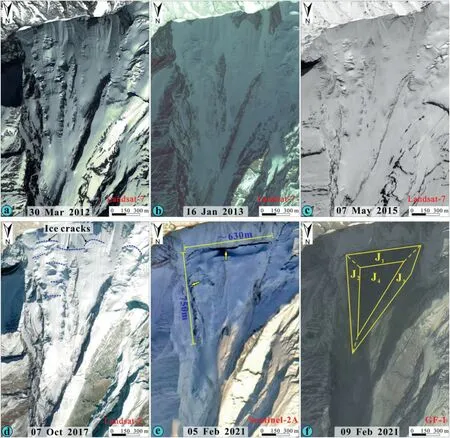
Fig.4.Multitemporal high-resolution remote sensing images.In(a)-(c),snow covers the bedrock without deformation.In(d),the blue dotted lines represent the ice cracks.In(e),two yellow arrows display the cracks widening in the rear and the lateral margins.In (f),J1,J2,J3 and J4 represent the large discontinuity planes.
3.4.Dynamic entrainment zone
The dynamic entrainment zone is the yellow zone in Fig.2 and zone III in Fig.3.It had an elevation range of 3100-3800 m asl and a longitude length of 1200 m.Fig.5a and b shows the comparison of the pre-event and post-event satellite images in the Ronti Gad valley.During the erosive motion of the debris avalanche,the large heat energy generated by friction melted snow and ice contained in the channel and in the debris particles.Meanwhile,the fast-moving debris avalanche strongly entrained colluvial deposits and loose deposits in its path,resulting in total deposition volume increase.Some material mainly comes from an ice avalanche with an area of approximately 0.18 km2on the western slope of the source area in 2016(Fig.6).The length of the deposit area in the valley floor was~2.3 km,with an estimated volume of 2 × 10⁶m3.The residual solid deposits were entrained by the debris avalanche.In addition,the meltwater increased the water in the debris,which can increase the water pressure and decrease the soil cohesion.The two effects decreased the resistance between the debris and the substrate and caused high mobility.
3.5.Flow deposition zone
The flow deposition zone is the green zone in Fig.2 and zone IV in Fig.3.The zone has 600 m elevation difference and 6700 m longitude length.After traveling the entrainment zone,the debris avalanche collided with the river banks due to abrupt changes in the direction of travel at the Ronti Gad-Rishiganga River confluence.The debris velocity decreased and part of debris blocked the Rishiganga valley and formed a landslide dam.Fig.7 shows the comparison of pre-and post-event satellite remote images.The red dotted frame in Fig.7b shows the sediment deposition area,and purple dotted line in Fig.7c shows the scope of the landslide dam.The landslide dam area was approximately 0.6 km2,with a thickness of~40 m and a volume of 8×10⁶m3(Shugar et al.,2021).Moreover,Fig.7c shows a dammed lake formed in the Rishiganga River,with a width of 100 m and a length of 310 m (the area in the yellow dotted line).The width of water surface of the downstream channel reached 150-250 m during the flood,which was an increase of 120-200 m.Due to the natural overflow and the decline of water level,the lake would not induce a large outburst flood downstream.
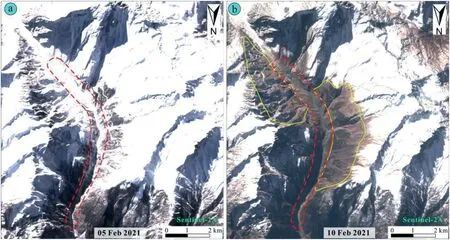
Fig.5.Comparison of pre-and post-event satellite images in the Ronti Gad valley.The yellow dotted lines represent the melting area of snow.The red dotted lines show the motion path.
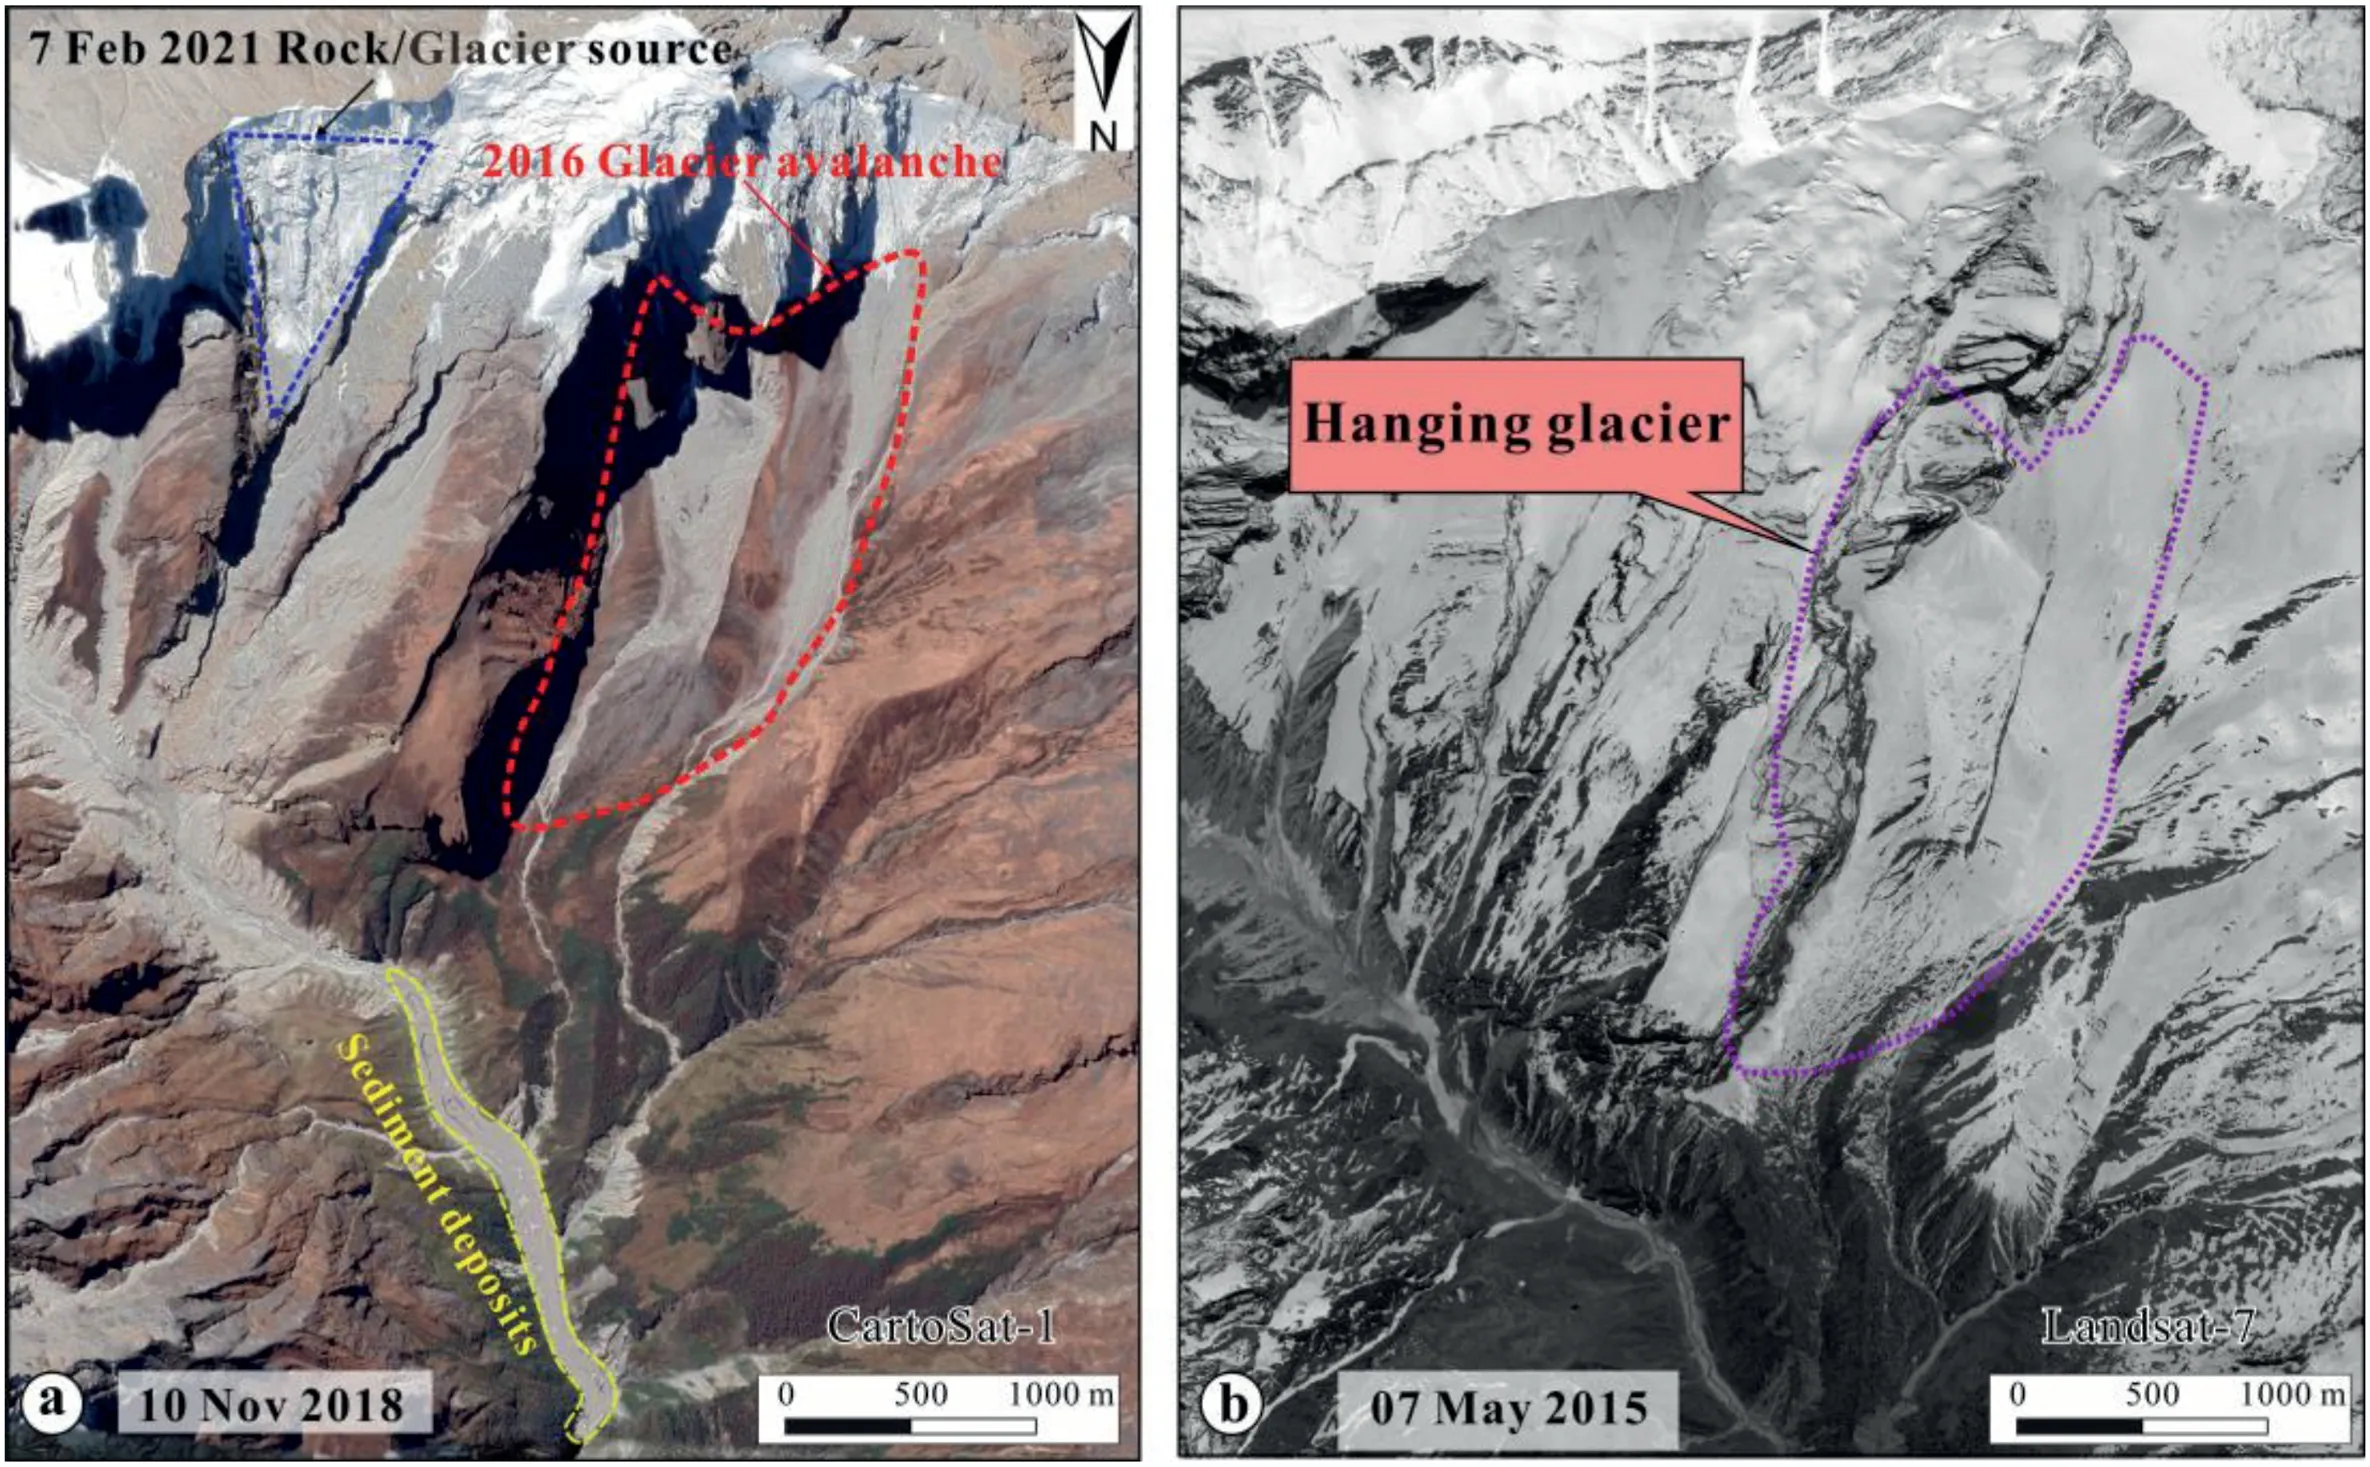
Fig.6.Overview of the ice avalanche in 2016.In(a),the red dotted frame delineates the scope of the ice avalanche and the yellow dotted line indicates the sediment deposit range.(b) represents the pre-event image.

Fig.7.Satellite images of the accumulation area: (a) Pre-event valley image,(b) Post-event valley image,and (c) Landslide dam and dammed lake.
3.6.Flood zone
As shown in Fig.2,the red zone is the flood zone.Most debris mixed with a large amount of ice and snow meltwater flowed rapidly into the Dhauhganga River and caused a debris-enriched flash flood.The maximum flood peak height reached 16 m,and it appeared between the Raini village and the Tapovan HPP.The maximum frontal velocity was 25 m/s near the Raini HPP (Shugar et al.,2021).Fig.8 shows the comparison between pre-and postevent satellite images of the Tapovan HPP.The width of the river before the flood was 30-40 m,whereas the river water level increased~10 m by flood.A large amount of gravel,mud and sand entrained in the flood deposited along the valley floor and directly damaged the Tapovan HPP.Some solid fragments deposited on top of the Tapovan HPP dam and river bank slopes after flood,with a deposit thickness of 10-15 m.The total volume of the sediment deposits was approximately 40-50 million m3in the Dhauhganga valley through digital elevation model difference (Shugar et al.,2021).The total deposition is at least twice that of the initial slope failure volume.
4.Time progress of Chamoli rock and ice avalanche
4.1.Time progress of the long-runout avalanche according to seismic wave records
4.1.1.Seismic wave records
Fig.9 shows the seismic wave signal provided by the Nepalese seismic network (about 160 km away from the Chamoli disaster).The disaster activity can be inferred by the seismic wave record.The initial seismic wave caused by slope failure occurred at~10:21 Indian standard time (IST) (February 7,2021).Subsequently,the sliding body experienced several collisions inducing the fluctuations of the seismic wave.Finally,the seismic wave amplitude reduced to almost zero at 10:42 IST,and the flood passed through the Tapovan HPP.Each sudden increase of the wave amplitude means a collision of the sliding mass with riverbanks or mountains.Fig.10 shows the spatio-temporal distributions of the rock and ice avalanche disaster chain.PointsAtoGin Figs.9 and 10 represent the positions and times of the collision points.PointsOandAwere in the rock and ice avalanche region.PointsBtoEwere located in debris avalanche region.PointsFandGwere in flood zone.
4.1.2.Time progress
The time process of the long-runout avalanche according to seismic wave records can be described as follows:
(1) At 10:21:13 IST,the slope failure occurred.The rock and ice mass began sliding at PointO.
(2) At 10:21:43 IST,the sliding mass reached PointA.The sliding mass impacted the valley floor and the riverbanks,which increased the seismic amplitude for a duration of 105 s(10:21:43 IST to 10:25:22 IST) and then was rapidly transformed into a debris avalanche due to fragmentation and comminution.The debris travelled 2400 m to PointBin this period.
(3) From 10:25:22 IST to 10:29:47 IST,the debris avalanche travelled PointsB,CandD.The debris avalanches reached the intersection of the Rishiganga River (PointD) and blocked the valley,forming a temporary dam.

Fig.8.Satellite images of the Tapovan HPP: (a) Pre-event,and (b) Post-event.
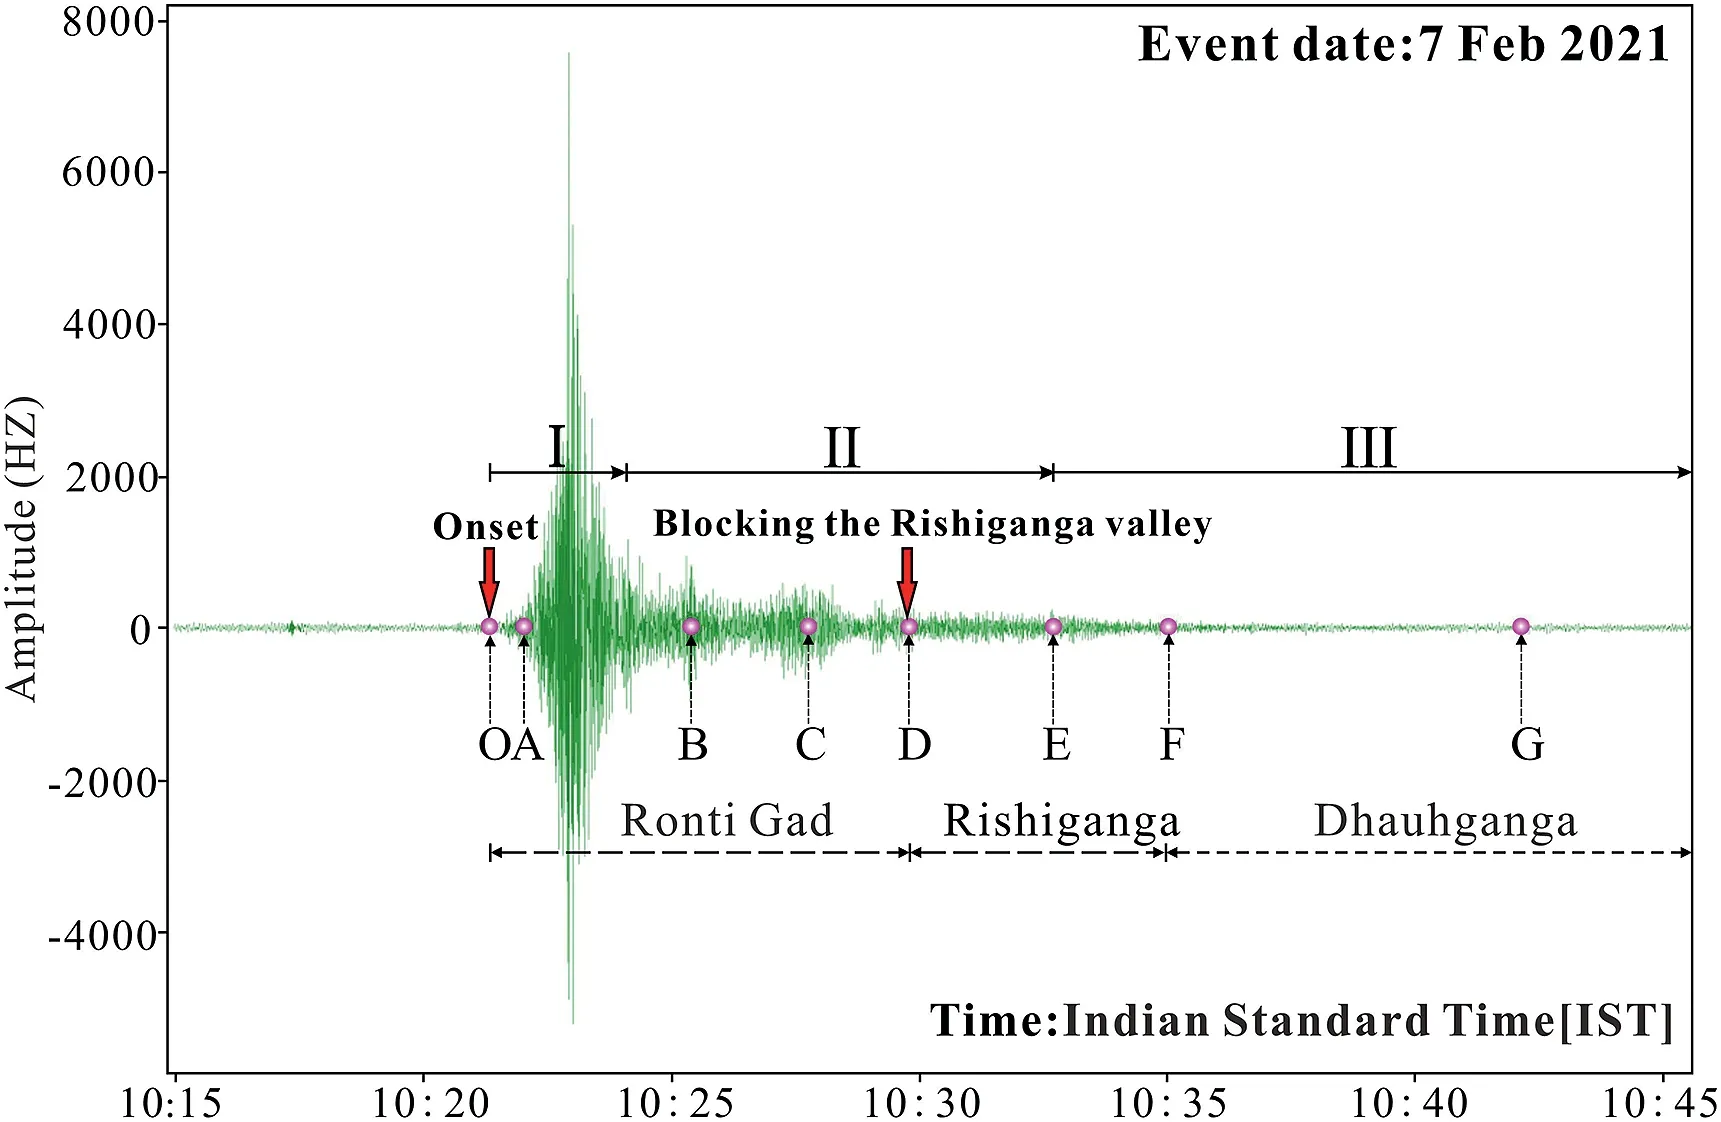
Fig.9.Seismic waveform image from the seismic station showing the recording of the surface of the Chamoli hazard on February 7,2021.I-rock and ice avalanche;II-debris avalanche;III -debris-rich flash flood.
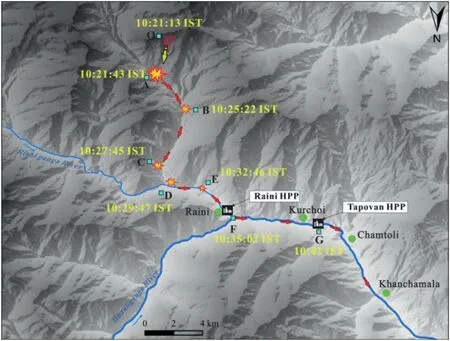
Fig.10.Map showing the spatio-temporal distributions of the rock and ice avalanche disaster chain based on the seismic wave interpretation.
(4) From 10:29:47 IST to 10:35:02 IST,the debris travelled PointsD,EandFand reached the intersection of Rishiganga-Dhauhganga River.After 10:33:37 IST,the seismic wave amplitude decreased.It was inferred that a considerable amount of water from Rishiganga River and meltwater reduced the collision between the debris and bedrock,decreasing the seismic wave amplitude.
(5) From 10:33:37 IST to 10:42:00 IST,the debris-rich flash flood was transformed by debris avalanche travelled PointsF,Gand the Kurchoi village through the Dhauhganga River.The flood damaged the Tapovan HPP.
Fig.11 shows the estimated mean velocity of the mass flow in the valley floor by the seismic wave.The motion of the debris avalanche may have experienced four stages:slipping acceleration(O-A),impacting deceleration(A-D),reacceleration(D-E),and slow deceleration motion (E-G).After the massive mass approximated free fall from its initial position,it had a larger acceleration in SectionO-Adue to the fact that the large gravitational potential energy was quickly converted into kinetic energy.The mass had a mean velocity of 60 m/s.In SectionA-D,the rock and ice mass rapidly impacted and fragmented,the mean velocity decreased abruptly from 60 m/s to 12 m/s.In SectionD-E,the velocity of mass increased to 21 m/s again.It may be caused by the meltwater reducing the frictional resistance.In SectionEtoG,the velocity decreased to 12 m/s due to the collision at PointEand the two HPPs.The flood basically moved at a mean velocity of 12 m/s with slow deceleration,which is consistent with analysis of Shugar et al.(2021).
4.2.Time progress of the flood zone according to actual video
The debris avalanche was transformed into flash flood after mixing with water and rapidly flowed into the Dhauhganga River.In order to better understand the instantaneous velocity changes that flood hit the Tapovan project dam,we explored available eyewitness video published on Facebook and captured the arrival of the flow front at different locations along the flood path,to reconstruct motion process(Fig.12).At first,the relative movement position and time of the frontal flood in the 60 s long video was recorded.It was assumed that starting time(t=0 s,10:41:17 IST)is taken when the frontal flood flowed to PointD1and the ending time is considered as the moment (t=43 s,10:42:00 IST) of overflowing the Tapovan project dam (D10).The reference points every 3 s were selected and the distance between adjacent reference points was measured.The average velocity between adjacent reference points can be calculated by

wherelis the distance betweenDi+1andDi(m),∇Tiis the time interval betweenti+1andti(s),andis the mean velocity(m/s).
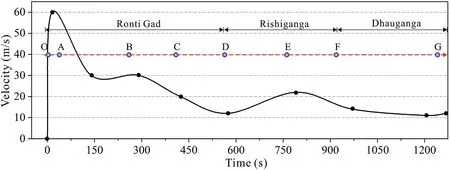
Fig.11.Mean velocity variation curve of the landslide mass.
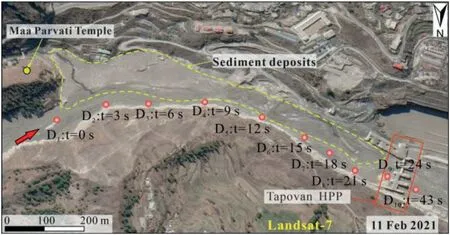
Fig.12.Map showing the location and distribution of Points D1-D10.The yellow dotted line shows the deposit area.The red rectangle outlines the damaged dam.
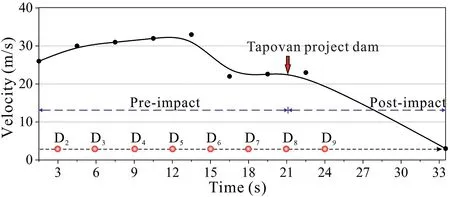
Fig.13.Flood velocity curve between Points D1 and D10.The red arrow shows the time when the flash flood impacted the Tapovan project dam.
Fig.13 shows the velocity variation curve before and after dam damage.The maximum frontal velocity of flowing flood was 30 m/s before impacting the Tapovan project dam.The flow velocity decreased from 23 m/s to 3 m/s after impacting the Tapovan project dam (D8toD10).Shugar et al.(2021) also recognized the frontal velocity decrease caused by impacting Tapovan dam through video,and their mean velocity of flood decreased from 16 m/s to 12 m/s.The difference may result from video quality and local complex terrain.
5.Numerical simulation by RAMMS
5.1.Introduction to RAMMS
RAMMS is a professional dynamic numerical simulation analysis software for debris avalanches designed by the WSL Institute for Snow and Avalanche Research SLF.RAMMS:DEBRIS FLOW module is used for numerical calculations in this study.The RAMMS debrisflow model is based on 2D depth-averaged shallow-water equations for granular flows.The Voellmy friction rheology used in the RAMMS debris-flow model is presented in detail in the following section.Nevertheless,the flood dynamic process unable to achieve still needs to be studied in future.In addition,RAMMS also includes an erosion module.The erosion algorithm is empirical and based on field data,and it describes the potential erosion depth as a function of the basal shear stress produced by debris flow or debris avalanche.The erosion parameters are obtained by many back calculations.The calculation process mainly includes three steps(Fig.14):basic data input,model parameter setting,and the output of results.The basic data includes the terrain,release zone,physicomechanical parameters of the material mass,and erosion area parameters.The RAMMS runout model parameters mainly include the friction coefficient and the turbulence coefficient.The main challenge is to calibrate the runout model using field data.
5.2.Numerical model
RAMMS uses Voellmy model to simulate the dynamic process of the debris avalanche or debris flow.RAMMS modified the Volley model by considering the yield stress,which is more suitable for ideal plastic material:

whereSis the friction resistance (Pa),ρ is the density(kg/m3),g is the gravitational acceleration,μ is the friction coefficient,uis the flow velocity (m/s),ε is the turbulence coefficient,Nis the normal stress(Pa),andN0is the yield stress(Pa).
The friction coefficients are responsible for the behavior of the flow.The parameter μ dominates the moment when the flow begins to stop,and ε dominates the moment when the flow is running quickly.The model was widely used to simulate the runout process of debris flow in high mountains(Körner,1976;Hungr,1995;Hungr and Evans,1996;Evans et al.,2001;Mahboob et al.,2015).
In the RAMMS model,the erosion algorithm is defined using the maximum potential erosion depthemand a specific erosion rate.It is calculated using a critical shear stress τc(=1 kPa)and an average potential erosion depth dz/dτ(=-0.1 m/kPa)as a function of basal shear τ.In addition,the average erosion rateemgenerally is estimated based on back analysis:

5.3.Recommended parameters
Four parameters need to be input in RAMMS: (i) the digital terrain model,(ii) release area,(iii) erosion area,and (iv) friction coefficients.The digital terrain model in RAMMS was generated by digital elevation model data,which can generally be obtained through regional surveys or the Geospatial Data Cloud (https://www.gscloud.cn).The grid resolution in this model was 12.5 m.The release and erosion areas can also be directly delineated in RAMMS according to the results of field investigations or satellite image interpretation.The rock density was 2500 kg/m3(appropriate for gneiss),and the ice density was 900 kg/m3(Shugar et al.,2021).The calibration of the RAMMS model has been carried out through a back-analysis procedure that mainly is committed to the two friction coefficients (μ and ξ) and entrainment coefficient,which affect the simulation results.Subsequently,different combinations for the three calibration parameters have been tested by proceeding with successive simulations in order to compare simulated deposit with the field observation until obtaining the best-fit parameters in RAMMS.Table 2 lists the optimized parameters for modeling the rock and ice avalanche.

Fig.14.Schematic diagram of the RAMMS numerical simulation process for the Chamoli disaster chain.

Table 2 RAMMS model parameter values for the Chamoli disaster chain.
5.4.Analysis of the simulation results
5.4.1.Debris avalanche velocity
Fig.15 shows the simulated result of the debris avalanche velocity.The total simulation time was 705 s.Let the rock and ice avalanche start time ast=0 s.Att=50 s,the landslide mass had passed through the transition area and reached the below valley floor.The maximum velocity of the frontal rock and ice mass was approximately 100 m/s.Att=200 s,the sliding body was transformed into a debris avalanche after impacting the river bank and travelled along the valley floor,with a maximum velocity of 46 m/s.The maximum velocity decreased fromt=50-200 s due to the collision and frictional force.Davies et al.(2011)revealed that some material near the back of the flow may gradually deposit after collision;however,the frontal material continues to travel.
Att=400 s,the debris avalanche reached the Rishiganga River at a mean speed of 27 m/s.The debris near the cross of Rishiganga River and valley had a maximum velocity of 46 m/s.Betweent=500 s and 705 s,the maximum velocity of the debris avalanche was 48 m/s.The debris with maximum velocity was also located near the cross of Rishiganga River.The velocity decreased rapidly,and part of debris accumulated and blocked the Rishiganga valley after leaving Ronti Gad valley.
The results in this study describe the dynamic characteristic at debris avalanche stage.The process of the sliding mass that accelerated first and then decelerated is shown.The dynamic characteristic showed favorable agreement with the actual data such as seismic data,videos and satellite imagery.
5.4.2.Debris avalanche thickness
Fig.16 shows the simulation results of the thickness of the debris avalanche flow.Att=50 s,the rock and ice mass slid down the slope and impacted the valley floor below and the opposite riverbank.Then,the motion direction changed from northeast to northwest,and the maximum flow thickness was 96 m.Att=200 s,the landslide debris continuously scraped the old colluvium and slope deposits along the path,with a motion distance of~5 km and a maximum instantaneous flow thickness of 134 m.Att=400 s,the frontal debris reached the Rishiganga River and began to deposit.Betweent=500 s and 705 s,some frontal debris rapidly deposited at the confluence of the Rishiganga River and Ronti Gad,and produced a dam that blocked the Rishiganga valley with a volume of~8 million m3and an average thickness of~34 m,in agreement with digital elevation model difference (Shugar et al.,2021).The maximum flow thickness was~103 m,which is consistent with our analyses of mud scars from Fig.7c.
In addition,the mean thickness of the landslide dam from the numerical simulation is close to satellite images and field observation.Subsequently,the debris avalanche was transformed into a debris-rich flash flood with a complex dynamic process.Unfortunately,RAMMS cannot simulate the flood motion in this study.In future,the flood dynamics will be studied.
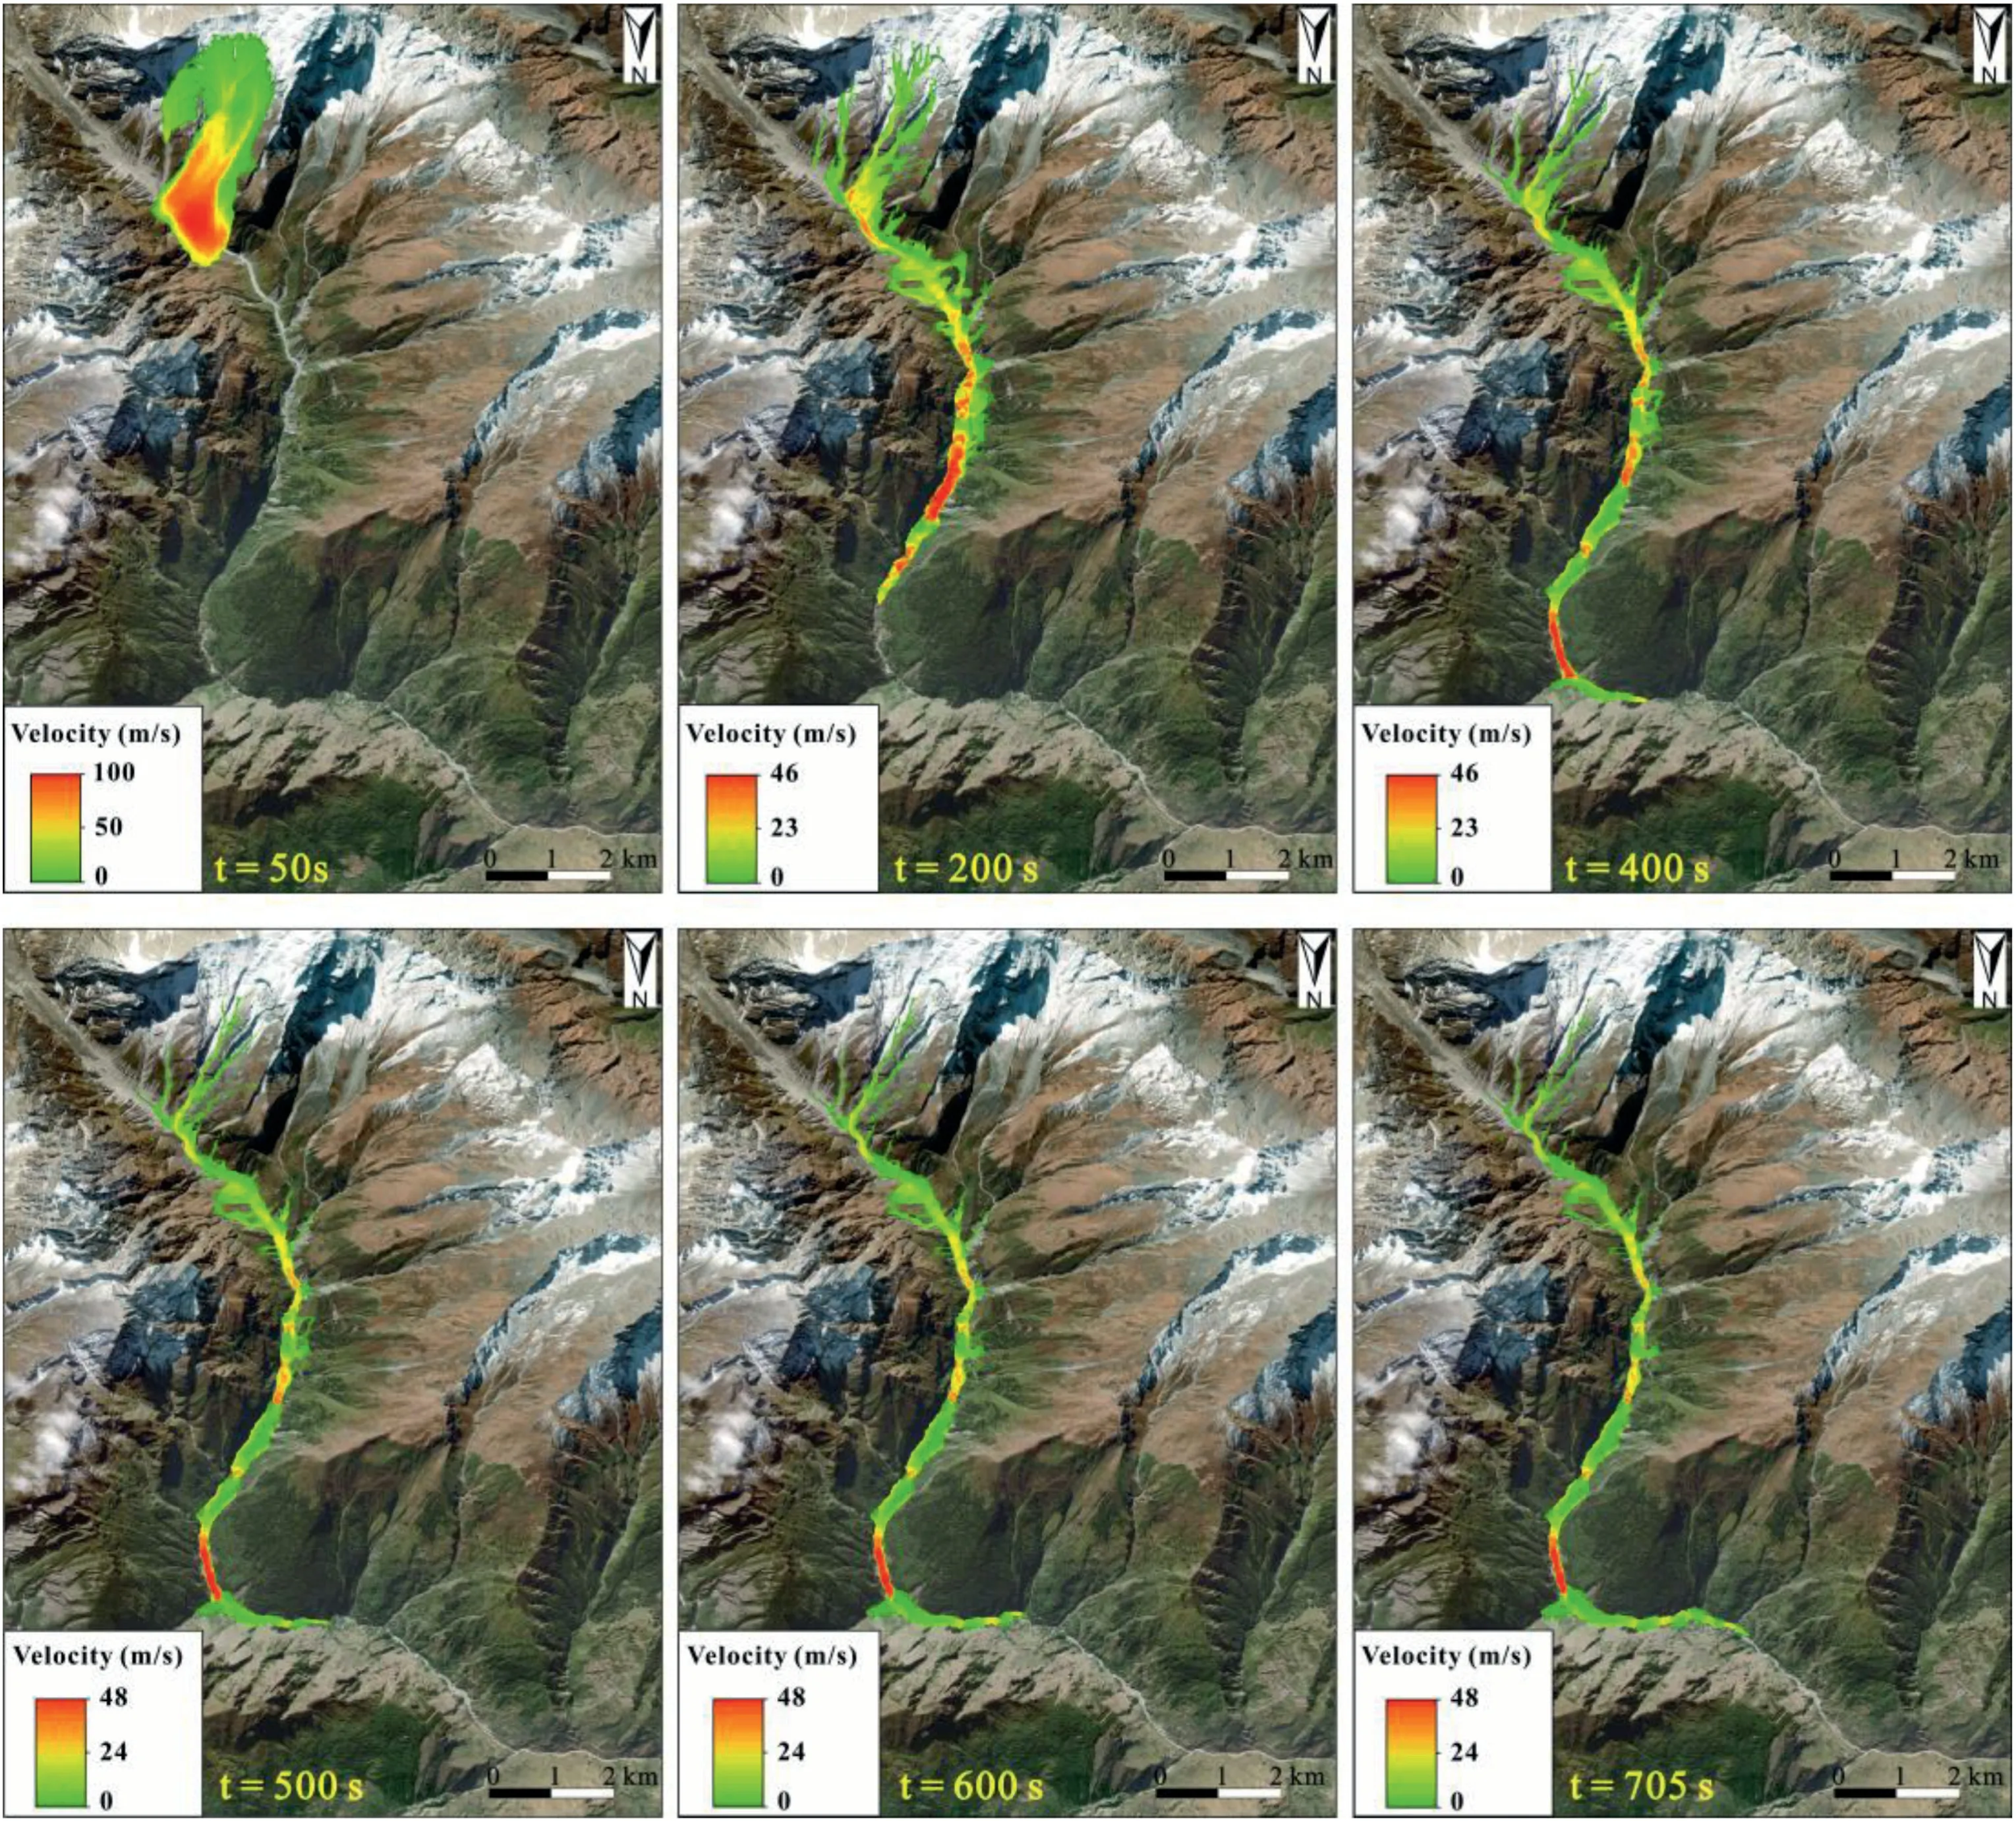
Fig.15.Images of the simulated runout velocities of the mixed rock and ice mass at various times.
6.Discussion
6.1.Causes of rock and ice avalanche
Large rock and ice avalanches usually initiate as sliding,falling and toppling.The major factors promoting rock sliding and avalanches in high regions are(i)seismic shaking(Jibson et al.,2006),(ii) glacial deepening (Ballantyne,2002),(iii) progressive permafrost degradation induced by rock mass temperature and water availability in warming hanging glaciers (Geertsema et al.,2006),and (iv) debuttressing of rockwalls due to glacier retreat (Ambrosi and Crosta,2011).According to the analysis of post-event satellite images (Fig.4e),four discontinuity planes were formed in the source zone.The four large discontinuity planes,which may have been formed by the rapid uplift and compressional activities of the High Himalaya plate,controlled the shape and scale of the initial mass.Moreover,under the effects of gravity unloading,glacier splitting,freezing and thawing,these discontinuity planes continued to expand.Shugar et al.(2021) suggested that regional climate and related cryosphere changes could have interacted in a complex way with the geologic and topographic setting to produce this massive slope failure.Kropáek et al.(2021) assumed that the slope failure was mainly predisposed by the structural geology and morphology and by the supposed melting of mountain permafrost.In addition,the large and expanding discontinuity planes at the head scarp may have allowed liquid water to penetrate into the bedrock,increasing pore-water pressure (Fig.17a and b).Furthermore,the rock and ice mass underwent long-term freezing and thawing processes,which may have accelerated the extension of the fractures.After detaching from the slope,the sliding body was transformed into a debris avalanche and flood (Fig.17c).
6.2.Causes of flood disasters and long-runout distance
Pandey et al.(2021)analyzed the causes of the flood disaster and proposed two ideas.First,a temporary dam was formed by the deposit of the debris avalanche.After the dam was breached,the dammed lake water rapidly flowed downstream and extended the scope of the hazard.However,there is no evidence to prove that the dam burst led to flood disasters.Second,a large amount of meltwater flowed into the Dhauhganga River after the ices and snow rapidly melted due to the motion of the debris avalanche.Shugar et al.(2021) inferred that the water from the rivers,groundwater,melting snow,wet sediment,and hydroelectric project may all contributed to the debris flow.By comparing the pre-and postevent satellite images (Fig.5),it was found that a large amount of snow was located on the valley floor in pre-satellite image instead of glacial ice.But part of snow melted after disaster due to friction heating.Shugar et al.(2021)estimated that~5×10⁶-6×10⁶m3of glacial ice melted based on energy balance method.In addition,Fig.9 shows that the seismic wave amplitude of the Ronti Gad(B-D)was greater than that of the Rishiganga River (D-F) and the Dhauhganga River (F-G),indicating that the debris avalanche successively mixed with a large amount of water after entering rivers.Ice lake and surface water in the Ronti Gad from the satellite images were not observed.Therefore,it was inferred that the water may be related to the Rishiganga River,groundwater,melting snow and wet sediment.
The lubrication of meltwater reduced the resistance between the debris and the substrate,and the entrainment and scrape effect were also the important reasons for the runout of debris avalanche.Sovilla et al.(2006) suggested that the runout efficiency increases with the erosion of large amounts of snow and ice.Due to the huge amount of scraping,the increased gravitational potential energy was far greater than the energy consumed by scraping (Fig.18).Some of the increased gravitational potential was transformed into kinetic energy,which improved the mobility.To analyze entrainment effect on the runout distance,RAMMS was used to simulate the travel distance under three different erosion depths,including the no erosion and erosion.Three groups of simulation with different depths (the maximum scraping depths are 0 m,5 m and 30 m,respectively) were established (Fig.19).Subsequently,the corresponding numerical results were compared with digital elevation model difference (Shugar et al.,2021) and satellite images.It was clearly found that when the maximum erosion depths were 0 m and 5 m,the debris avalanche has not reached the Rishiganga River.Whereas the debris avalanche with a maximum erosion depth of 30 m travelled~15 km,which agreed with the estimation from satellite image.Apparently,the entrainment of debris avalanche can strongly influence the flow mobility.In the near future,we will further perform the research about dynamic erosion mechanism.
6.3.Early warning of avalanche and flood disaster chain
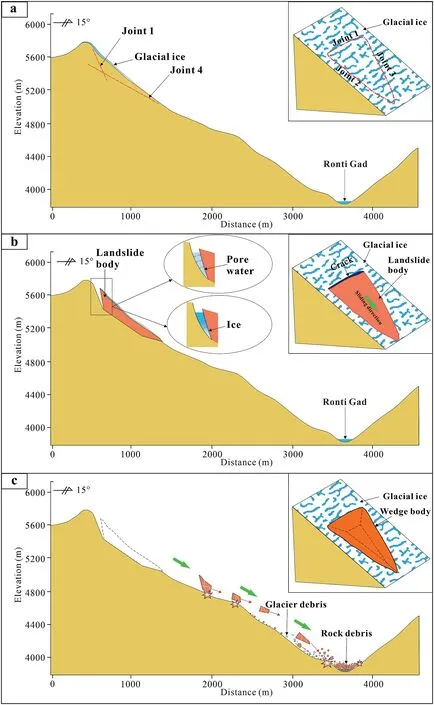
Fig.17.The exit and runout scenarios of the Chamoli rock and ice avalanche:(a)Initial stage before the deformation of the landslide mass(the red dotted lines represent joint planes);(b) Creep deformation of the sliding mass;and (c) Fragmentation and comminution after the slipping of the initial landslide mass(the green and red arrows represent the traveling direction of the detached mass).
Based on an in-depth analysis of pre-and post-satellite remote images,new insights into the formation mechanism and movement process of the hazard cascades have been gleaned (Martha et al.,2021;Pandey et al.,2021;Shugar et al.,2021).Numerous tensile cracks occurred in the back and lateral margins of the source area since 2017.On February 5,2021,these tensile cracks expanded and connected to each other.Multiple periods of satellite images were selected to analyze the formation mechanisms of the slope failure and the subsequent movement of the debris avalanche.The sliding body formed via the discontinuity planes cutting each other is consistent with Shugar et al.(2021).Satellite images can play an important role in the analysis of the causes and evolution of disaster chains,and these images have unique advantages in high mountain regions.In the future,multiple high-resolution satellite images can be used to identify and track the sliding bodies and their motion characteristics.Subsequently,the relevant numerical simulation may be achieved to predict disaster risk and scale based on satellite images.
Although satellite images can be used to effectively monitor the deformation process of a sliding body,it cannot capture the time of sliding body failure.Pandey et al.(2021) and Shugar et al.(2021)collected seismic wave data from four surrounding ground motion monitoring stations to analyze the temporal sequence of this event.The results revealed that the initial failure time was~10:21 IST.The flood reached the Raini HPP and Tapovan HPP at~10:32 IST and~10:42 IST,respectively (Shugar et al.,2021).In other words,the early warning system may have activated for 10-20 min before the flood arrived at the hydroelectric station.If a seismic network had been installed near the source of the landslide,the early warning system may provide enough time to arrange for the evacuation of relevant personnel.Satellite image data and seismic networks may be useful for monitoring and early warning technology in such areas.First,potential areas of geohazard can be delineated by analyzing and comparing multitemporal remote sensing images.Second,a dense seismic network should be built near the hazard region.Based on the seismic network,the seismic wave of large slope failure and small earthquakes would be recorded.Thus,the disturbing signs resulting from small earthquakes should be quickly eliminated to conduct scientific monitoring and early warning.Once it is determined that the seismic wave results from large slope failure,we can issue an early warning to remind surrounding people to evacuate.
7.Concluding remarks
The characteristics of the hazard chain caused by the Chamoli rock and ice avalanche were analyzed in this study.By multitemporal pre-and post-satellite images,the evolution of the rock and ice avalanche and the dynamic process of the disaster chain were assessed.Furthermore,the initial failure time and subsequent travel sequence of the landslide mass were assessed based on the seismic wave data and field video.The results provided a scientific basis for kinematics analysis and hazard risk assessment and indicated that a seismic network,as a ground monitoring technology,can be effectively applied to the massive geohazards monitoring and early warning system.Subsequently,RAMMS was used to simulate the movement of the Chamoli geological disaster chain,and the results further contributed to understanding the movement of debris avalanche.The simulation results revealed that debris avalanche travels for long-runout distance and blocks the rivers.In this study,scraping effect of debris avalanche resulting in long-runout distance was demonstrated.The dynamic erosion effect of catastrophic disaster chains in high mountain and valley areas should be noticed to reduce casualties and economic losses.Furthermore,monitoring and early warning based on dense seismic network can be achieved to minimize casualties and provide a geological and scientific basis for formulating relevant government policies.

Fig.18.Schematic diagram of debris avalanche entrainment.
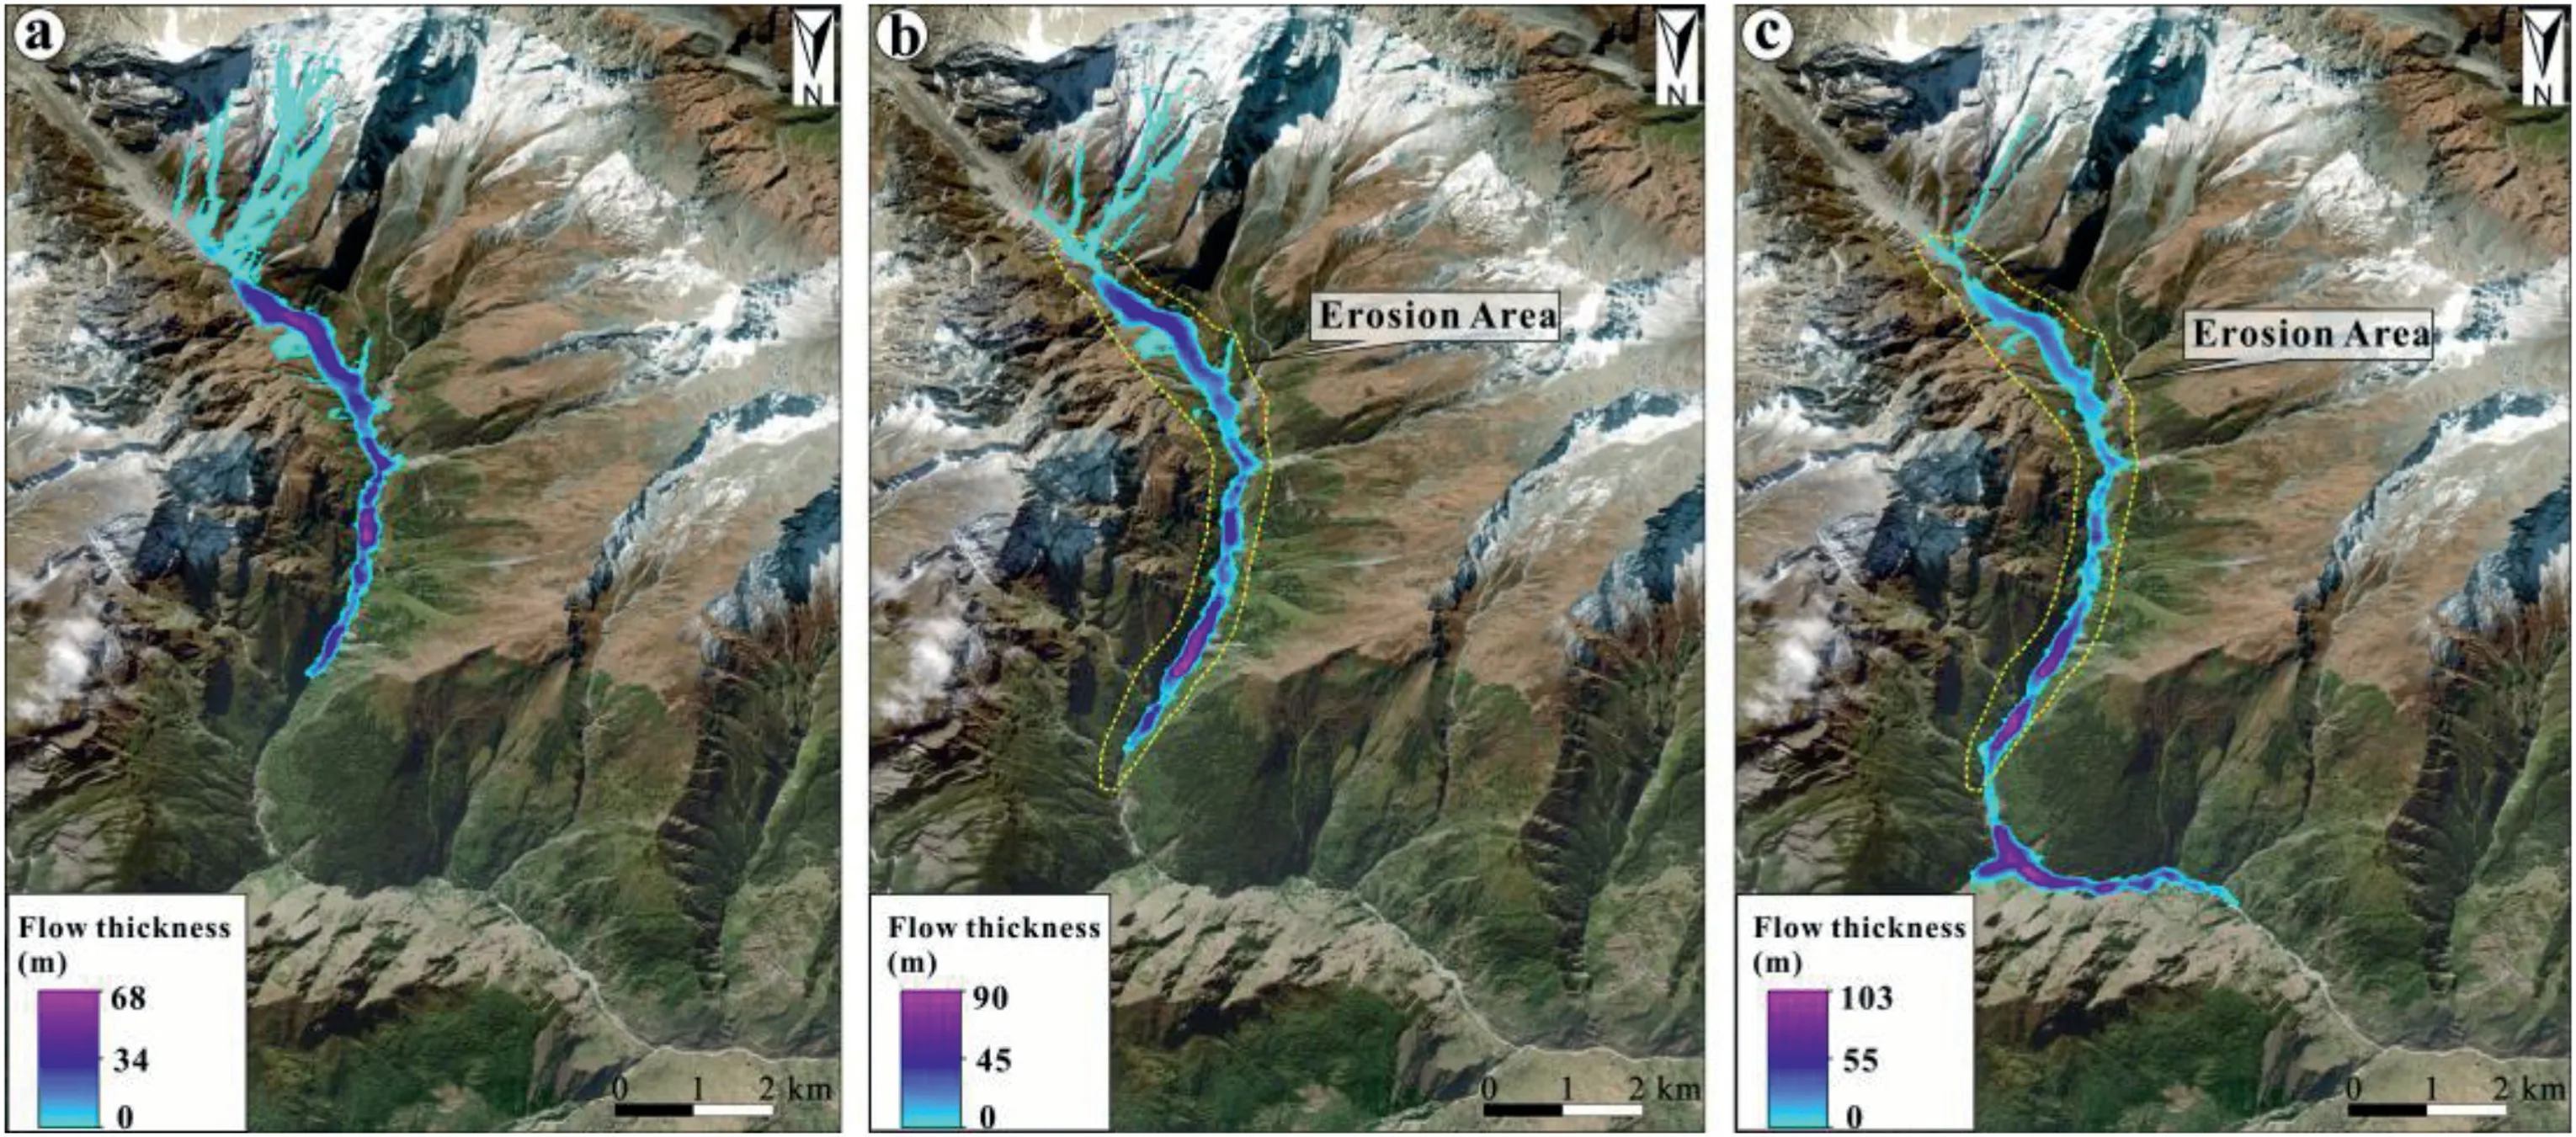
Fig.19.Simulated images of the flow thickness at various erosion depths of (a) 0 m,(b) 5 m,and (c) 30 m.
Declaration of competing interest
The authors declare that they have no known competing financial interests or personal relationships that could have appeared to influence the work reported in this paper.
Acknowledgments
We acknowledge the Institute of Geophysics,China Earthquake Administration for providing technical support during preparing this manuscript.Special thanks are given to Prof.Zhongqi Yue at the University of Hong Kong and Dr.Xingyu Kang at the Peking University for their valuable suggestions and revisions to this paper.
 Journal of Rock Mechanics and Geotechnical Engineering2023年2期
- Journal of Rock Mechanics and Geotechnical Engineering的其它文章
- On the critical particle size of soil with clogging potential in shield tunneling
- Strength and deformation characteristics of irregular columnar jointed rock mass: A combined experimental and theoretical study
- Spatial distribution and failure mechanism of water-induced landslides in the reservoir areas of Southwest China
- Characteristics of electromagnetic vector field generated from rock fracturing
- A multi-purpose prototype test system for mechanical behavior of tunnel supporting structure: Development and application
- Geotechnical investigation of low-plasticity organic soil treated with nano-calcium carbonate
