Classification of Young Females’ Body Shape in Jiaodong Area Based on 3D Morphological Characteristics
LI Wenxi(李文熙), ZHAO Meihua(赵美华)
College of Textiles and Clothing, Qingdao University, Qingdao 266071, China
Abstract: To improve the classification method of body type, 103 young female college students in Jiaodong area(Shandong, China) were measured by a 3D body scanning system, and variables of upper body parts were selected and analyzed by SPSS software. According to the indices such as the chest ratio, the chest sagittal diameter ratio, and the shoulder angle, the tested population was quickly clustered into six categories by the classification method of “size feature+shape index+front and back indices”, which were divided into flat chest body, graceful body, breast augmentation body, normal body, convex back body, and flat body. The proportion of various body types and classification rules were obtained. According to the classification rules, 103 samples and 15 new females’ body data were analyzed and verified. Finally, according to the descriptive statistical analysis of upper body-related indicators of young female in this area, the height and the chest circumference were selected as independent variables, regression analysis was carried out on 11 related indicators, and the mapping relationship between height and chest circumference was studied, which provided a mathematical model for the design of fit clothing structure of young females in Jiaodong area.
Key words: young female; 3D anthropometry; body shape characteristics; type classification; regression analysis
Introduction
Obtaining human body data is the primary work of clothing drawing, and it is the starting point and foothold of clothing[1]. Our country has a vast territory and a large population, and human body shapes vary widely in different regions. Body classification has become a hot topic in the field of clothing research. Clothing body is the main part of clothing covering human body, and clothing body structure is the most important part of clothing structure[2]. The structure of females’ upper body is complex and involves many factors. For example, the shoulder, as the support part of the clothing, is the key part of the design, which affects the comfort and fit of the clothing[3]. The distribution design of the waist dart could create a beautiful and fit shape. At present, there is a relative lack of somatotype research in Jiaodong area(Shandong, China), including the cities of Yantai, Weihai, Qingdao, and Weifang. Therefore, this experiment mainly classifies the upper body of young females in Jiaodong area, and provides references for design of fit clothing structure with young females in this area.
In view of the fact that many studies combined a single angle value, or obtained the classification of human body shapes according to a single cross-sectional shape feature or size feature, many domestic scholars have adopted a 3D combination of coronal and sagittal planes of human body shapes, and conducted classification research on human body shape from multiple perspectives. Fanetal.[4]adopted the method of “national standard body size+side body size” to divide the body size of young female in eastern China into 24 categories. Yu and Li[5]divided the body shape of young females in eastern China into 14 categories by combining the index of body shapes with the index of size characteristics. Based on the shape of horizontal section of human body, Zhang[6]transformed the classification method of single characteristic part shape into the general classification of five commonly used control parts in garment engineering, classified the surface curves of horizontal section of shoulder, chest, waist, abdomen and buttocks of human body in sequence, and achieved good classification results. Peng[7]continued to divide young females’ body into eight body types based on the current classification of body type standards in China, and combined with the front-back relationship of body section curves, thus refining the clothing size standards.
To sum up, all kinds of classification methods mentioned above have not completely combined the size characteristics and shape indices of human body with the front, back and side indices, and the factors considered are rather one-sided. Liu and Zhou[8]combined with the ratio of the transverse sagittal diameter of chest, lateral shape and waist type, subdivided the body types of a large chest of 40-60 years old middle-aged and old women in Xi’an(China) into 12 categories, and achieved good classification results. Inspired by this, if the size characteristics, shape indices, and front and back sides of human body are combined, it can provide more comprehensive classification indices for human body classification, thus obtaining more accurate classification results. Therefore, this study combines “size feature+shape index+front and back indices” to classify young females’ body shapes in Jiaodong area, which is of great practical significance for improving the structural design of clothing of different body shapes[9]. In this paper, 103 young females college students in Jiaodong area were measured by 3D body scanning system, and correlation analysis and cluster analysis were carried out on the morphological parameters of each part from the perspective of front side and back side. The classification method was improved, and the classification categories and rules of various types of body shapes were obtained, which could supplement the current research on subdivision of human body shapes.
1 Experiments
1.1 Subjects and instruments
Young females college students in Jiaodong area were randomly selected by using self-service 3D body scanner (College of Textile and Clothing, Qingdao University, China) .
The 3D human posture measurement is a challenging task due to changes in lighting conditions, cluttered backgrounds, occlusions, inter and intra subject pose variabilities. Moreover, due to its nature, accurate annotation of captured data is not a trivial task and most available datasets are captured under controlled environments[10-12]. In order to improve the accuracy of measurement data, the measured personnel are required to wear close-fitting clothing, bundle hair and remove accessories. Two feet should stand at the designated position in the measuring room. The body should be upright and still, and the eyes should be straight ahead.
1.2 Measurement of body parts and statistical analysis of body shape characteristics
1.2.1Measurementofbodyparts
According to the actual production situation of clothing, there are 52 measurement items (containing one manual measurement itemW) were selected, as shown in Table 1.
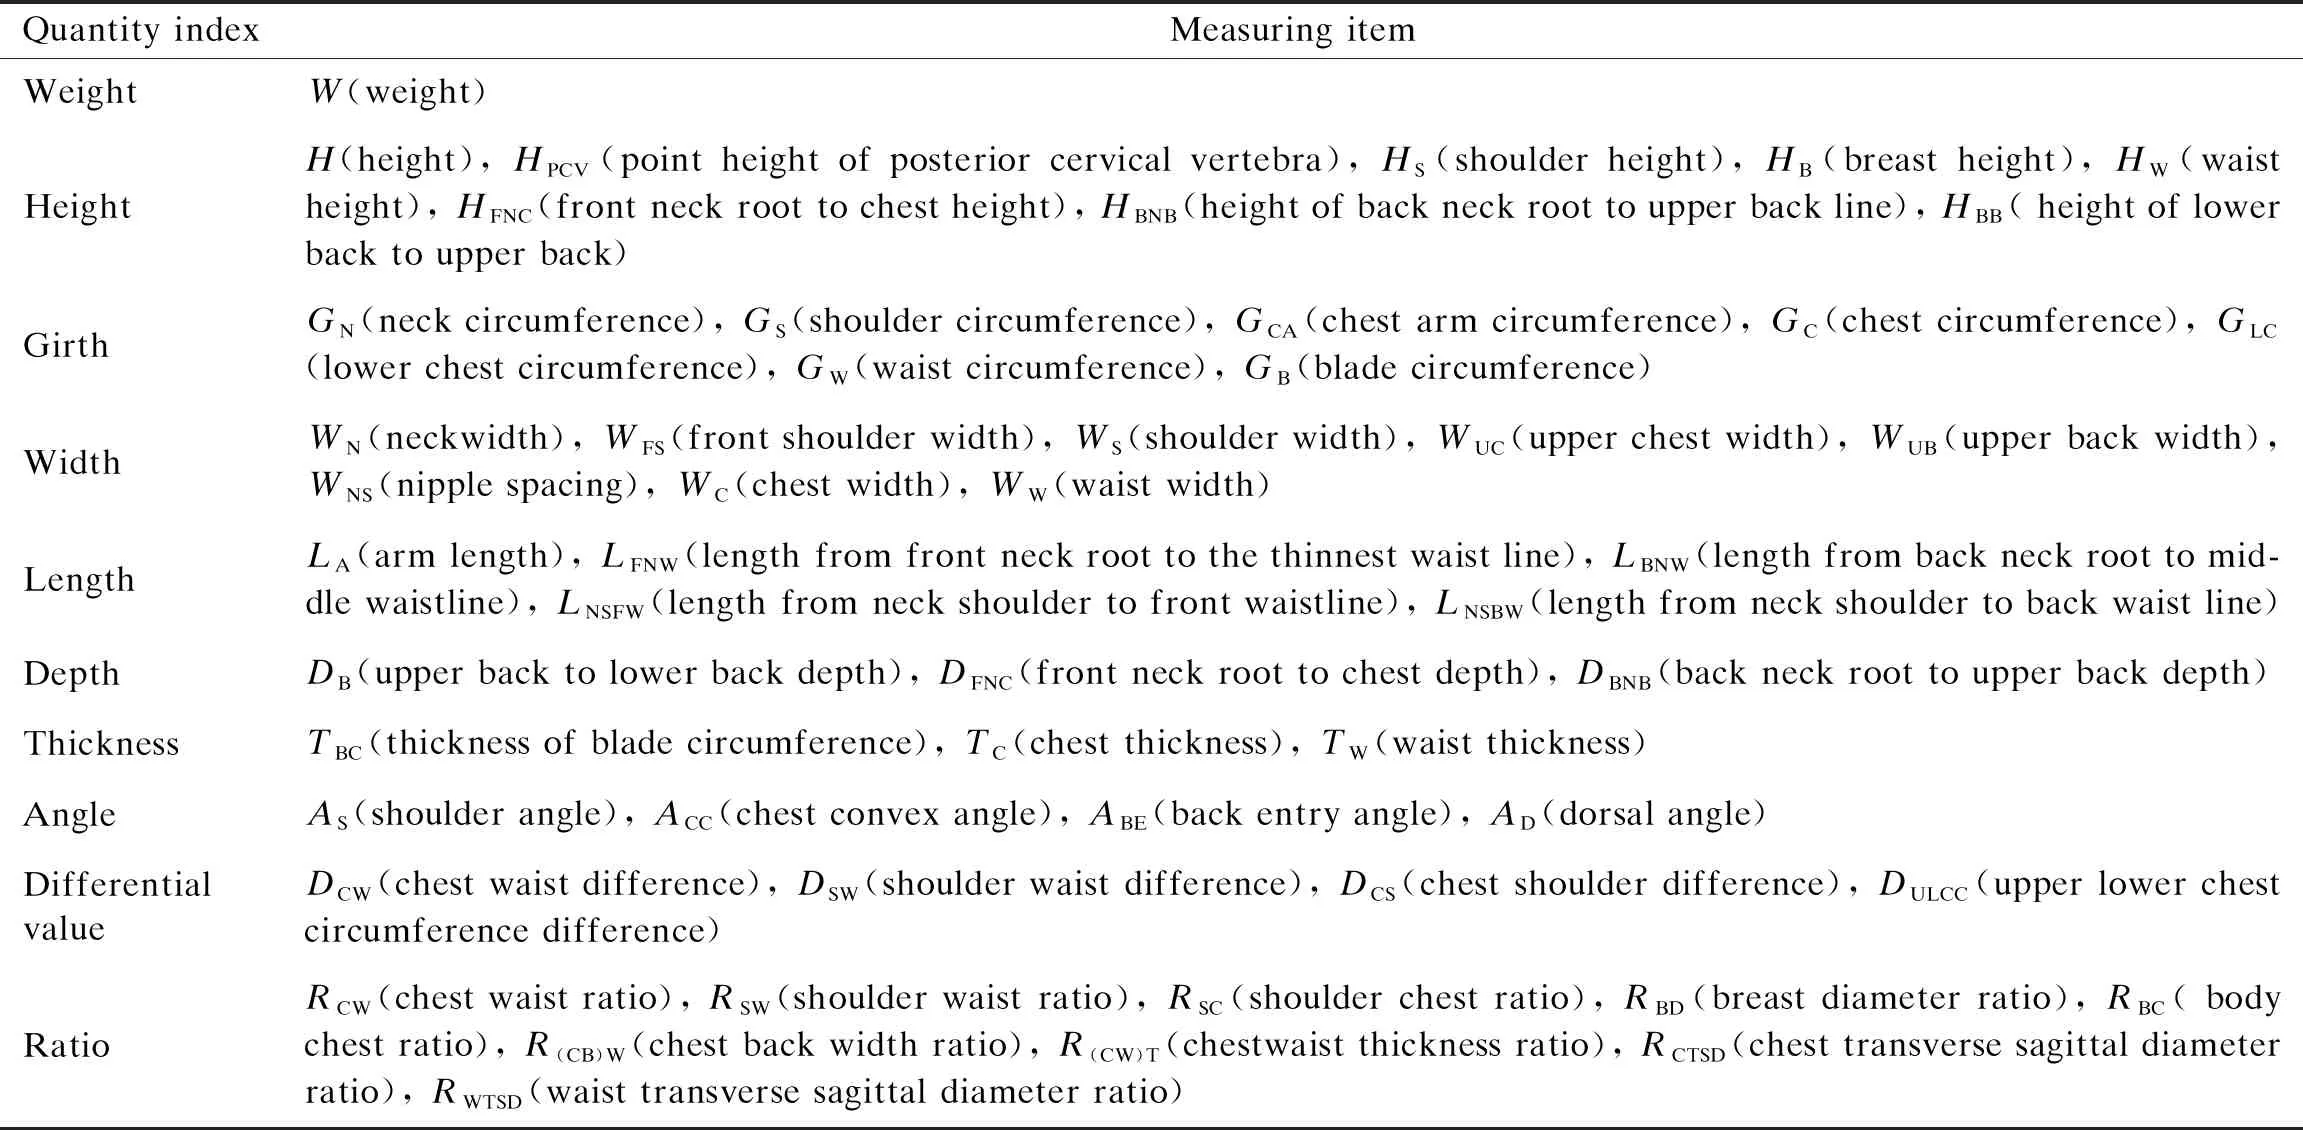
Table 1 Survey item list
Seventeen variables about shoulder, chest, waist and back includeDCW,DSW,DCS,DULCC,RCW,RSW,RSC,RBD,RBC,R(CB)W,R(CW)T,RCTSD,RWTSD,AS,ACC,ABE,andAD. Refer to the national standard GB/T 1 335.2—2008, which includes seven indices:H,GC,GW,HPCV,HB, WS, andLA.
1.2.2Dataprocessingandanalysis
Box diagrams of important parts of the body are made using SPSS software to eliminate three abnormal data. Then the normality test was carried out and sample pairingT-test was carried out on the corresponding parts on the left and right of human body[13]. After the normality test, each variable index accords with or approximately accords with the normal distribution. 103 effective samples were retained, the effective rate was 97%.
1.2.3Descriptivestatisticalanalysis
Statistical analysis of descriptive variables of shoulder, chest, waist and back of young females in Jiaodong area are shown in Table 2.
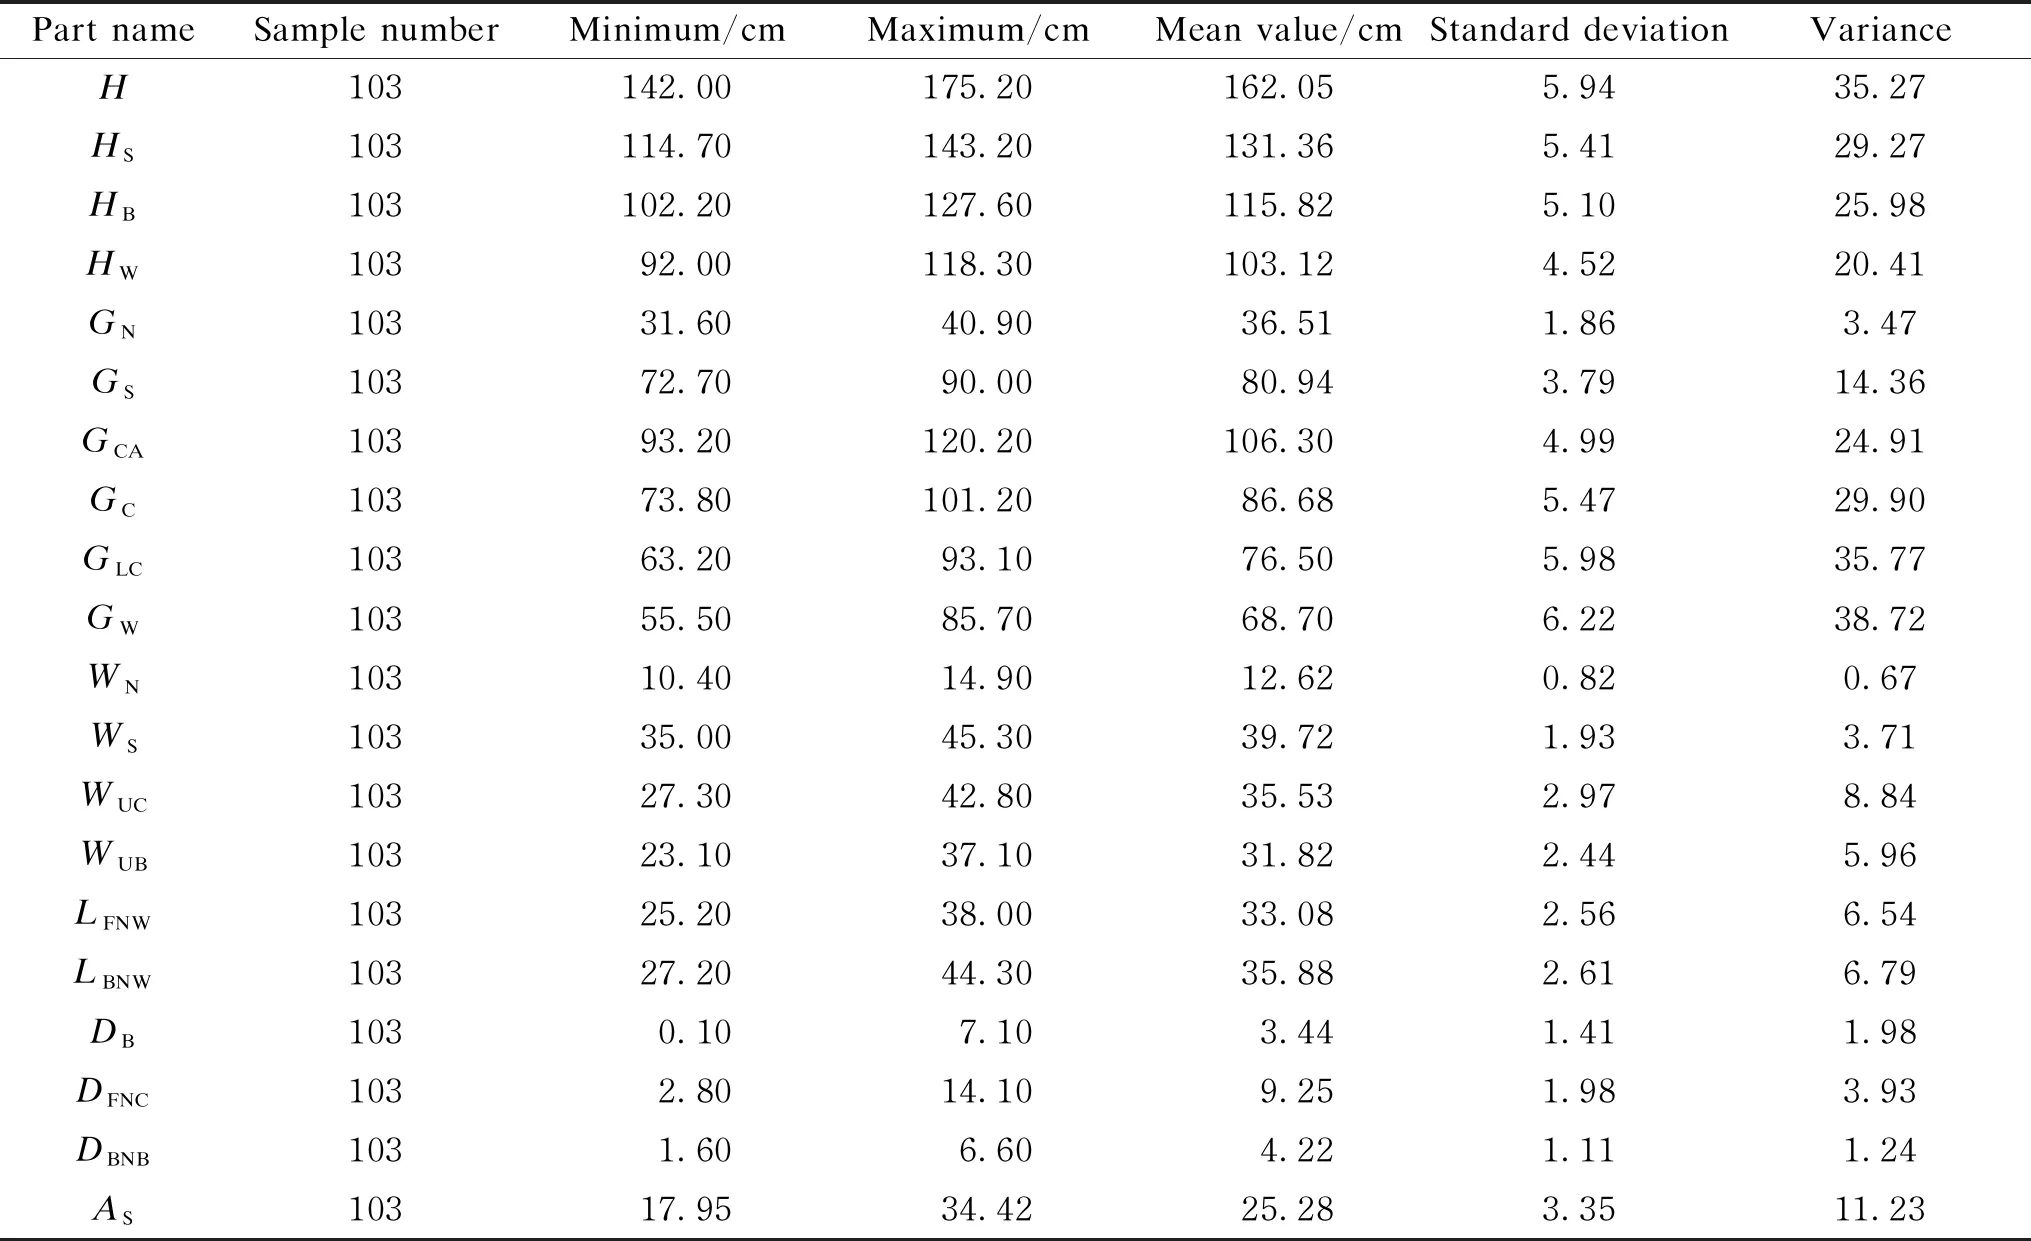
Table 2 Discriptive statistics of shoulder, chest, waist and back of young females in Jiaodong area
As shown in Table 2, standard deviation and variance reflect the degree of deviation and variation range of data. From Table 2, the top five items with the largest values in standard deviation and variance areGW,GLC,H,GC, andHS. It shows that young females in Jiaodong area have significant changes in chest, waist, shoulder circumference and height[14]. According to the difference between chest and waist of the national standard clothing model, it is concluded that young females in this area belong to the A-type range[15]. In addition, the rest of the data are shown in Appendix 1.
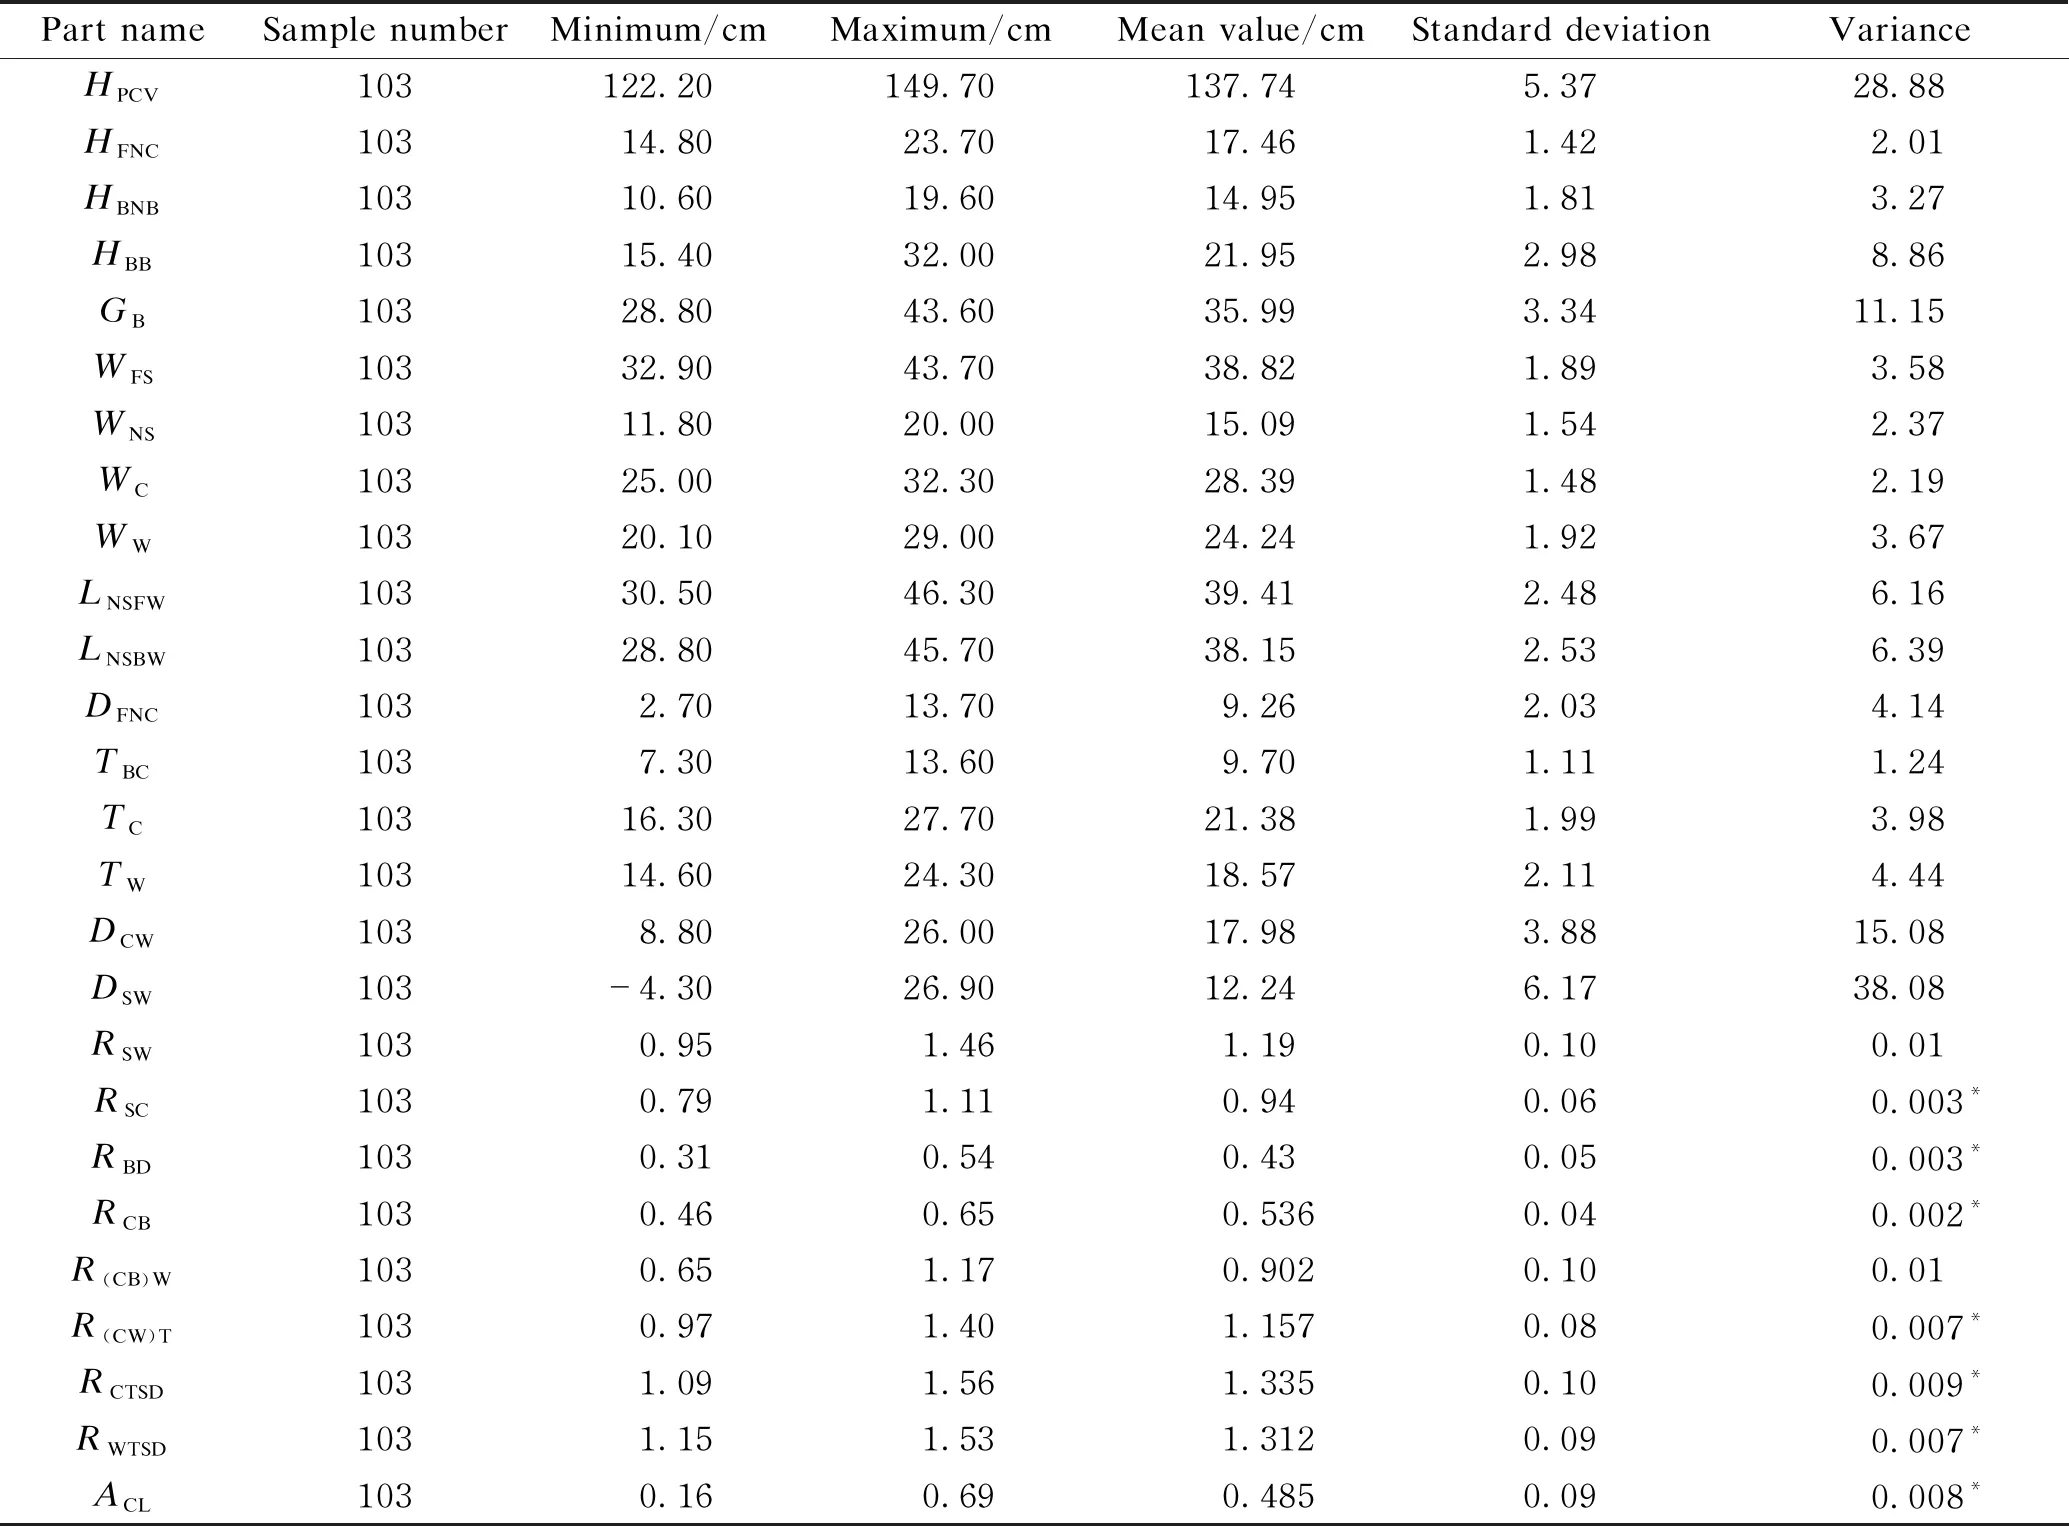
Appendix A
1.2.4Comparativeanalysisofbodyshapecharacteristicsofcontrolparts
The comparison among young females in Jiaodong area and young females in eastern China are shown in Table 3.
From Table 3, it can be seen that compared with female college students in eastern China, the upper body shape of young females in Jiaodong area is significantly different, which is mainly manifested in the fact that young females in Jiaodong area are taller and wider, with fuller breasts, thinner waist, and larger difference between chest and waist.
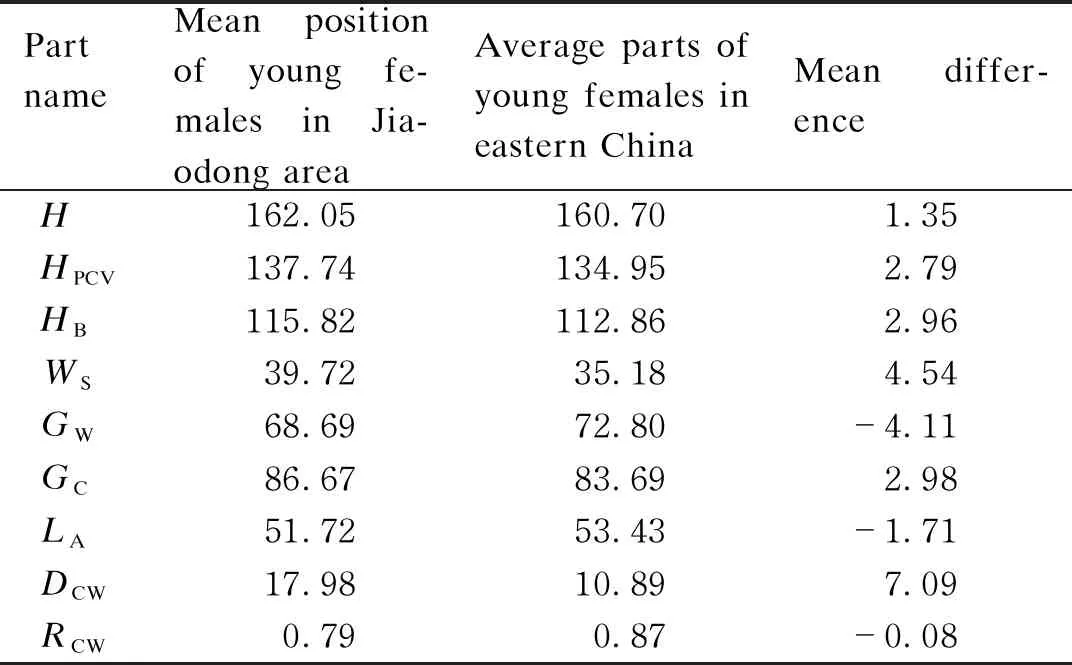
Table 3 Comparison of young females in Jiaodong area and in eastern China Unit: cm
Therefore, we classify the young females in Jiaodong area as a body type group with certain regional characteristics.
1.2.5Rocheindexanalysis
Roche index refers to the ratio of height to weight, which is originally used to evaluate people’s physical state, mental state,etc., and it is commonly used in studying the classification of obesity and thinness, age, body size difference, and its influence on pattern design. The standard value of Roche index for females is 1.30-1.50, and when the value is less than 1.30, it is slender. Roche index is calculated as
R=100×W/H,
(1)
whereRrefers to Roche index,W(g) refers to weight, andH(cm3) refers to height.
Using SPSS software to do data analysis, the average value of Roche index is 1.27, the minimum value is 0.90, the maximum value is 1.74, and the standard deviation is 0.16. According to the specific measurement standard, the measurement samples of young females in Jiaodong area are all in the slender range(shown in Table 4).

Table 4 Roche index distribution
1.3 Analysis of local proportional characteristics
1.3.1Dataanalysisofchestandwaistbodyratio
According to Table 2, the mean value of chest circumference is 86.67 cm, ranging from 73.80 cm to 101.20 cm, and the variance is 29.90 cm. The mean value of lower chest circumference is 76.50 cm, ranging from 63.20 cm to 93.10 cm, with a variance of 35.77 cm. The average waist circumference is 68.69 cm, ranging from 55.50 cm to 85.70 cm, and the variance is 38.72 cm. The variance of lower chest circumference and waist circumference is greater than that of chest circumference, which indicates that the variation range of lower chest circumference and waist circumference is greater than that of chest circumference. The mean value of difference between chest circumference and lower chest circumference is 10.18 cm, and the average brasize of young females in Jiaodong area is 75A.
Transverse sagittal diameter ratio refers to the ratio of transverse diameter to sagittal diameter in cross section, which is an important index to describe the transverse human body shapes[10]. The transverse sagittal diameter ratio of chest and waist of young females in Jiaodong area was used as descriptive statistics to analyze the transverse body shape. The mean ratio of transverse sagittal diameter of chest is 1.34, ranging from 1.09 to 1.56. It can be seen from Fig.1 that most parts are distributed between 1.18 and 1.50, and the highest frequency is about 1.33, which indicates that most young females in Jiaodong area belong to normal chest type. The standard deviation is 0.10 and the variance is 0.09. The average waist sagittal diameter ratio is 1.31, ranging from 1.15 to 1.53. According to Fig.1, most parts are distributed between 1.15 and 1.47, and the highest frequency is about 1.32, which indicates that most young females in Jiaodong area belong to common waist type, with standard deviation of 0.09 and variance of 0.07. The standard deviation and variance of transverse sagittal diameter ratio of chest and waist are small, which indicates that the change range of chest and waist of young females in Jiaodong area is small.
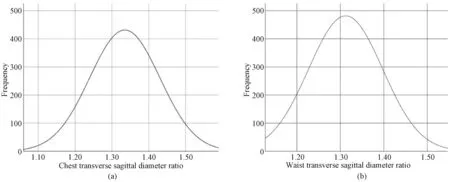
Fig. 1 Frequency of transverse sage to diameter ratio of chest and waist: (a) chest; (b) waist
1.3.2Analysisofbackdata
In this paper, we classify the back of young females in Jiaodong area according toDBNB. The young females’ back form in Jiaodong area can be divided into three groups: straight back, normal back, and slight humpback.The body shape of human back is described by the distanceA(shown in Fig. 2). The back is straight whenA≤2.99 cm, the back is normal when 3.00≤A≤5.20, and the back is humpbacked whenA≥5.21. The maximum value of the back neck root and the upper back depth is 6.60 cm, the minimum value is 1.60 cm, the mean value is 4.22 cm, and the variance is 1.24 cm(shown in Table 2). The variance is small, which shows that the data of this analysis part of young females in Jiaodong area fluctuates little. According to Fig. 3, most of the sites are distributed between 3.0 cm and 6.0 cm, and the highest frequency is about 4.0 cm, which indicates that the majority of young females in Jiaodong area have normal back.

Fig. 2 Distance from neck root to back deep
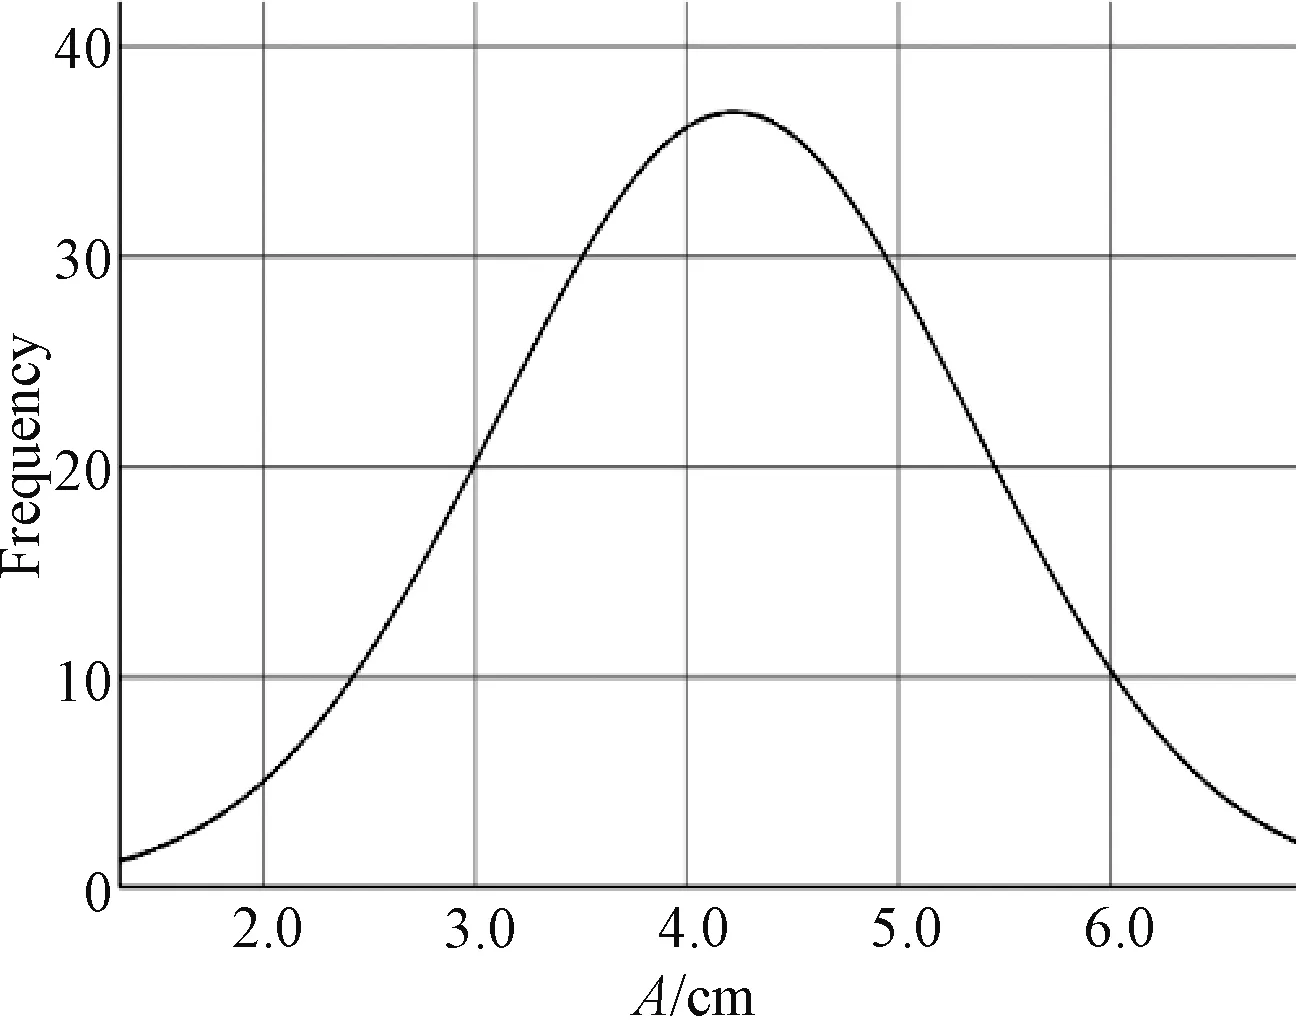
Fig.3 Frequency of A
1.3.3Analysisofshouldermorphologicalcharacteristics
Chest back width ratio is an important way to analyze the human shoulder morphology (shown in Table 2 and Fig. 4). The relationship between chest and back is expressed by the ratio between the back width and the chest width, and the human shoulder morphology is evaluated[16]. After analysis, the index of chest back width ratio is between 0.65 cm and 1.17 cm, with the mean value of 0.90 cm, the maximum frequency is about 0.90 cm, and the variance is very small, which shows that the index changes very little, and there is no obvious flexion and extension in human chest and back[16]. The mean value of shoulder circumference is 80.94 cm, distributed between 72.70 cm and 90.00 cm. The mean value of shoulder height is 131.36 cm, ranging from 114.70 cm to 143.20 cm. The mean value of shoulder width is 39.72 cm, ranging from 35.00 cm to 45.30 cm. The variance of shoulder height and shoulder circumference is larger, but the variance of shoulder width is smaller, which indicates that the data of shoulder height and shoulder circumference change greatly, while the data of shoulder width change slightly. The average shoulder angle is 25.28°, ranging from 17.95° to 34.42°, and the variance is 11.23°, which indicates that the shoulder angle changes greatly. It can be seen from Fig. 4 that the shoulder inclination of young females in Jiaodong area is mostly distributed between 20° and 30°, and the maximum frequency appears around 25°, which indicates that the normal shoulder type of young females in Jiaodong area accounts for a large proportion.
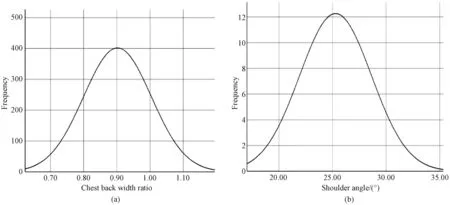
Fig. 4 Frequency of chest back width ratio and shoulder angle: (a) chest; (b) shoulder
2 Cluster Study and Regression Analysis of Body Types
2.1 Selection of classification indicators
Shoulder, chest, waist, and back are important parts of young females’ upper body. The angle of shoulder inclination affects the aesthetic feeling of shoulder shape. Body chest ratio represents the size characteristics of human body and reflects the sagging condition of females’ breasts[17]. Chest transverse sagittal diameter ratio and chest convex angle reflect the fullness of females’ chest shape. Dorsal angle and back angle reflect the humpback condition of females’ upper body shape. The above indicators have an important impact on the aesthetics and comfort of females’ upper body dressing effect. According to the classification principle of "size feature+shape index+front and back indices", six indices were selected, including body chest ratio, chest sagittal diameter ratio, back entry angle, dorsal angle, chest convex angle, and shoulder angle.
2.2 Correlation analysis
The correlation analysis is used to describe the correlation degree between characteristic indices. The correlation coefficient is expressed byγ, and when -1 ≤γ≤ 1 andγ= 0, the wireless correlation is positive and negative, respectively. The formula of correlation coefficient is
(2)

As shown in Table 5, the shoulder angle can be used as an independent characteristic variable index to characterize the shoulder shape. Body chest ratio has a correlation with the transverse sagittal diameter ratio and chest convex angle, while it is positively correlated with transverse sagittal diameter ratio and negatively correlated with chest convex angle. The larger the body chest ratio, the larger the transverse sagittal diameter ratio is and the smaller the chest convex angle is. There is a negative correlation between chest convex angle and transverse sagittal diameter ratio. There is a correlation between chest convex angle and dorsal angle, while there is no correlation between back entry angle and dorsal angle.
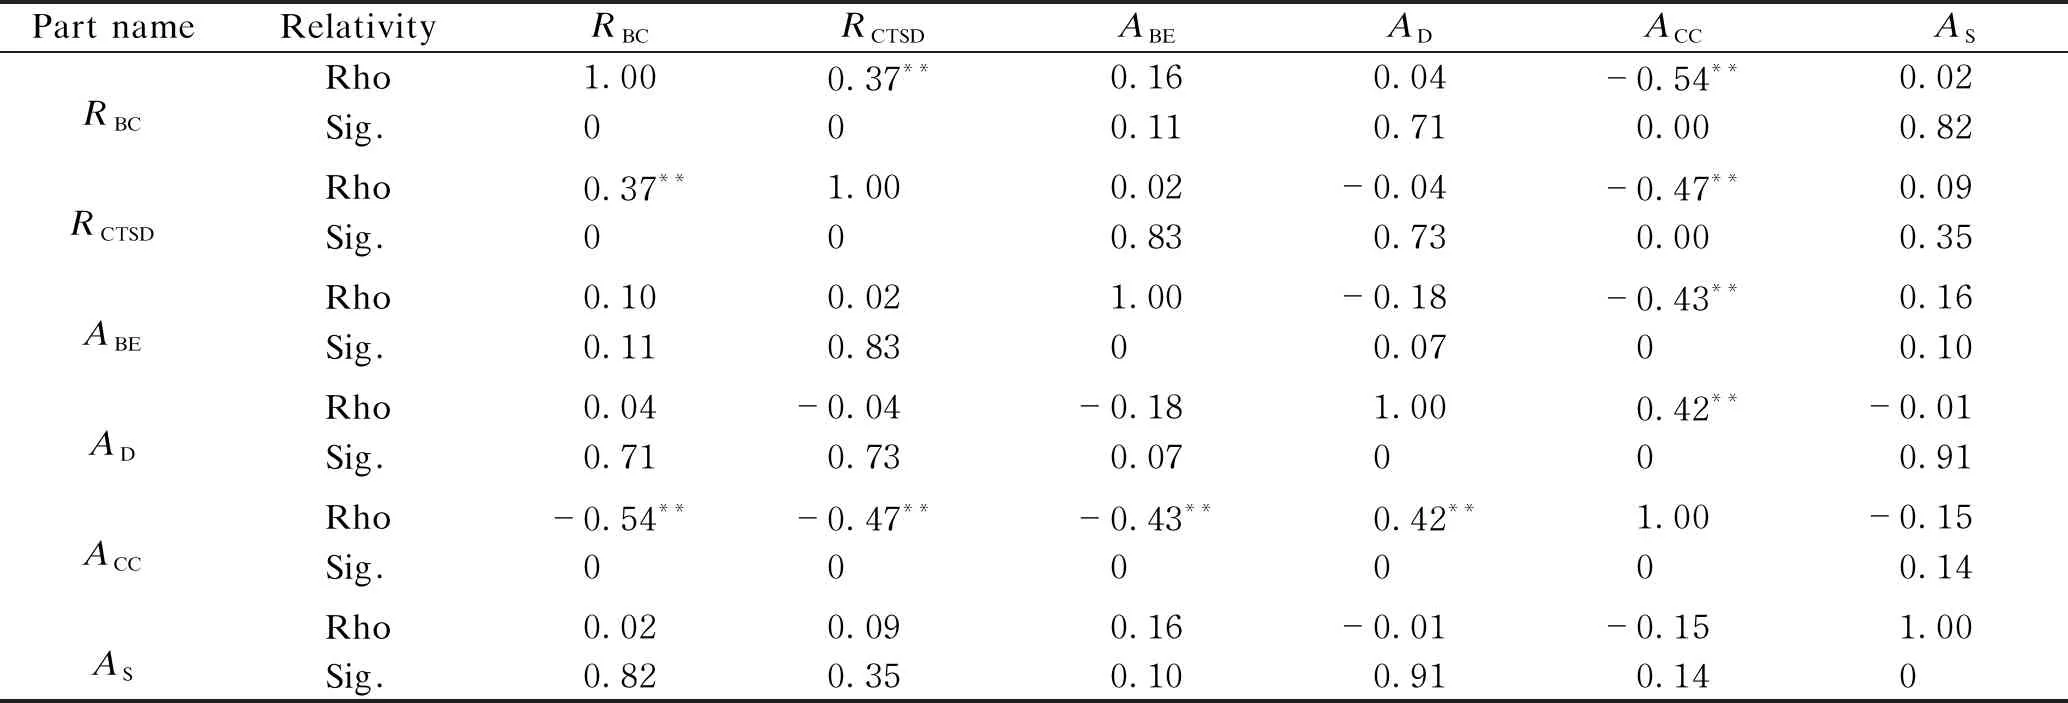
Table 5 Correlation analysis

Table 6 Cluster analysis
2.3 Partial correlation analysis
The correlation between the transverse sagittal diameter ratio and chest convex angle is analyzed under the control of constant chest to body ratio. The partial correlation coefficient between the transverse sagittal diameter ratio and chest convex angle is -0.35, thePvalue is less than 0.01, and then the original negative correlation judgment holds. The correlation between back entry angle and dorsal angle was analyzed under the condition of keeping the chest convex angle constant. The partial correlation coefficient between back entry angle and dorsal angle was 0.02, thePvalue was greater than 0.05, and then the original judgment of no correlation was established.
2.4 Cluster analysis
Fast cluster analysis is also calledK-means cluster analysis[8]. Chest body ratio, transverse sagittal diameter ratio, back entry angle, dorsal angle, chest convex angle, and shoulder angle were standardized to determine the optimal cluster number. Adoping the method of “size feature+shape index+front and back indices”, the processed data are classified into 3, 4, 5, 6, 7, and 8 categories, and theFvalue andPvalue of each group are compared and analyzed. When the tested population is divided into 5, 6, and 7 categories, the difference between the cluster mean square value andFvalue among the three groups is small. When the population is divided into 6 categories, the error mean square value is small and probability valueP<0.05, and the clustering effect is the best.
It can be seen from Table 7 that the body types of young females in Jiaodong area are divided into six categories, among which the middle types (Type 3, Type 4, and Type 5 ) accounts for 88.35% of the total number, and the Type 4 accounts for the largest proportion, reaching 41.75%, which accords with the physical characteristics of young females in Jiaodong area that they are tall and in medium size. The proportion of types decreases in turn[18].
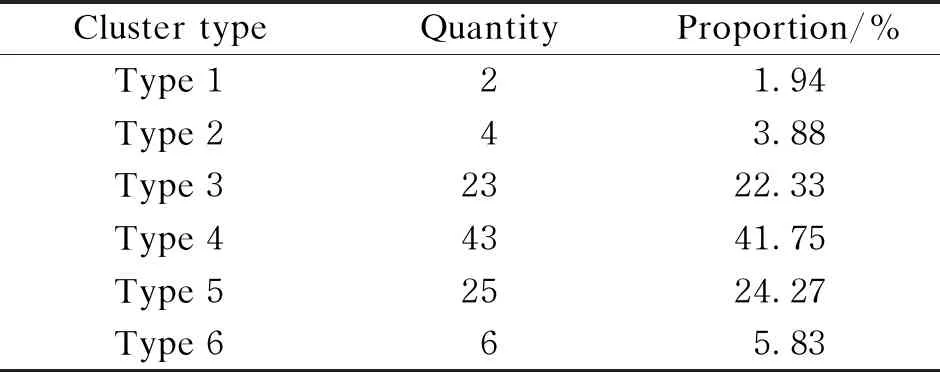
Table 7 Results of body type classification and distribution proportion
The data of these six categozies of human bodies are classified and analyzed, and the classification rules of the main parameters of each type are summarized, as shown in Table 8.

Table 8 Classification rules of shoulder, chest, and waist
(1) Type 1. This body shape has flat chest, sloping upper back and slipping shoulders, and it is named flat chest body.
(2) Type 2. This body shape has plump chest, graceful lower back and slightly slipping shoulders, and it is named graceful body.
(3) Type 3. This body shape has plump chest, normal back, and normal shoulder type, and it is named breast augmentation body.
(4) Type 4. This body shape has normal chest, normal back and normal shoulder type, and it is named normal body.
(5) Type 5. This body shape has normal chest, upper back tilt and slightly slipping shoulder, and it is named convex back body.
(6) Type 6. This body shape has plump chest, normal upper back, straight waist and slightly slipping shoulder, and it is named flat body.
2.5 Verification
In order to verify the validity of the classification results, SPSS software was used for discriminant analysis of 103 samples and 15 new female body data. The results of discriminant analysis are shown in Table 9. The original sample data were correctly classified in 93 cases and wrongly classified in 10 cases, with a correct rate of 90.3%. At the same time, 15 ungrouped subjects were classified by the angle of shoulder, chest, waist and the ratio of the transverse sagittal diameter of chest against the classification rules. Table 10 shows that 15 new female body data were correctly classified in 12 cases and wrongly classified in three cases, with a correct rate of 80.0%. The classification of body types is effective, and the accuracy of classification method needs to be improved. The main reason is that the sample size is insufficient, and the sample size will continue to be supplemented in the following study to make the classification result more perfect.
2.6 Mathematical regression model
According to the statistical analysis of the variables of the upper body of young females in Jiaodong area, taking heightHand chest circumferenceBas independent variables, the regression analysis of 11 related variables was carried out to establish a mathematical regression model to study the functional relationship between upper limb variables and height and chest circumference. The results are shown in Table 11.
It can be seen from Table 11 that the mathematical regression model of the first body type is univariate equation, which shows that each index of Type 1 is only affected by chest circumference, among which the biggestBcoefficient is shoulder circumference, shoulder width, waist circumference, and neck root circumference, which shows that it is most affected by its chest circumference. The mathematical regression model of the Type 2, Type 3, Type 4, Type 5, and Type 6 body types is a binary linear equation, and each index is influenced by height and chest circumference. In Type 2, theBcoefficient of waist is the largest, indicating that it is greatly influenced by chest circumference and less influenced by height. TheHcoefficient of chest height is the largest, which indicates that chest height is greatly influenced by height and less influenced by chest circumference. TheBcoefficients of chest, arm and waist circumference of Type 3, Type 4, and Type 5 body types are the largest, indicating that two indices are greatly influenced by chest circumference. TheHcoefficient of chest height and waist height is the smallest, which indicates that it is greatly influenced by height. In Type 6, shoulder width is greatly influenced by height, waist circumference is most influenced by chest circumference,Hcoefficient andBcoefficient of chest and arm circumference are both large, so the chest and arm circumference are both influenced by height and chest circumference.
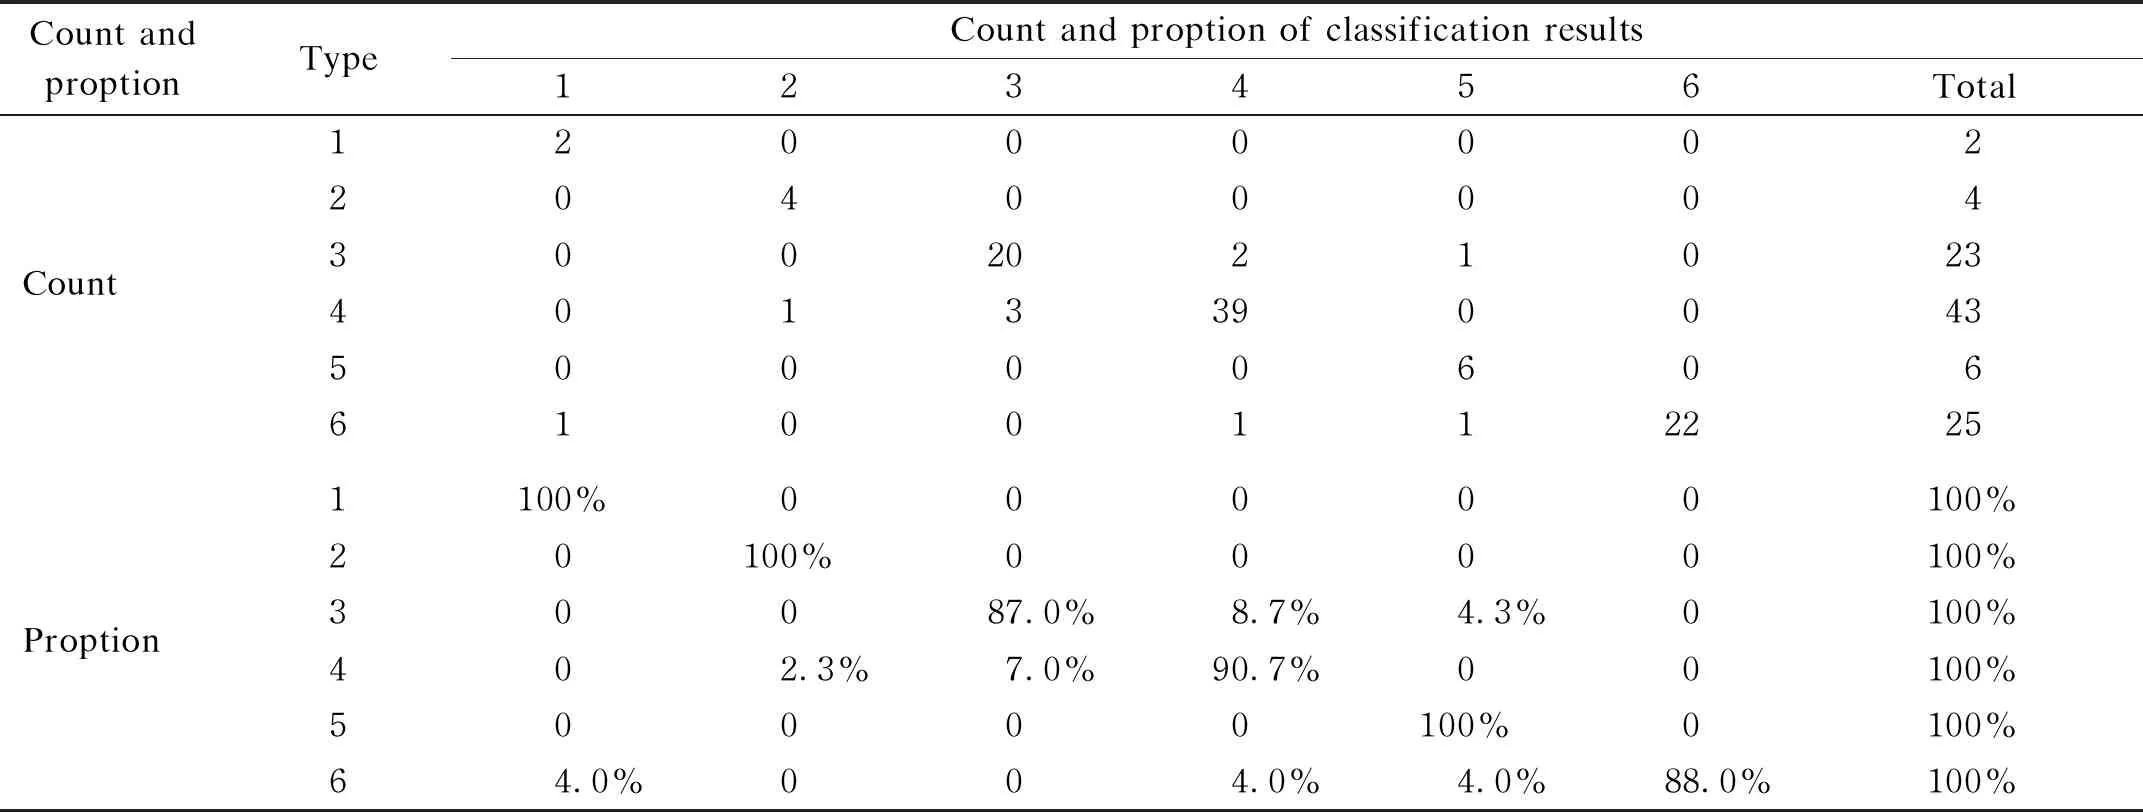
Table 9 Verification of classification results
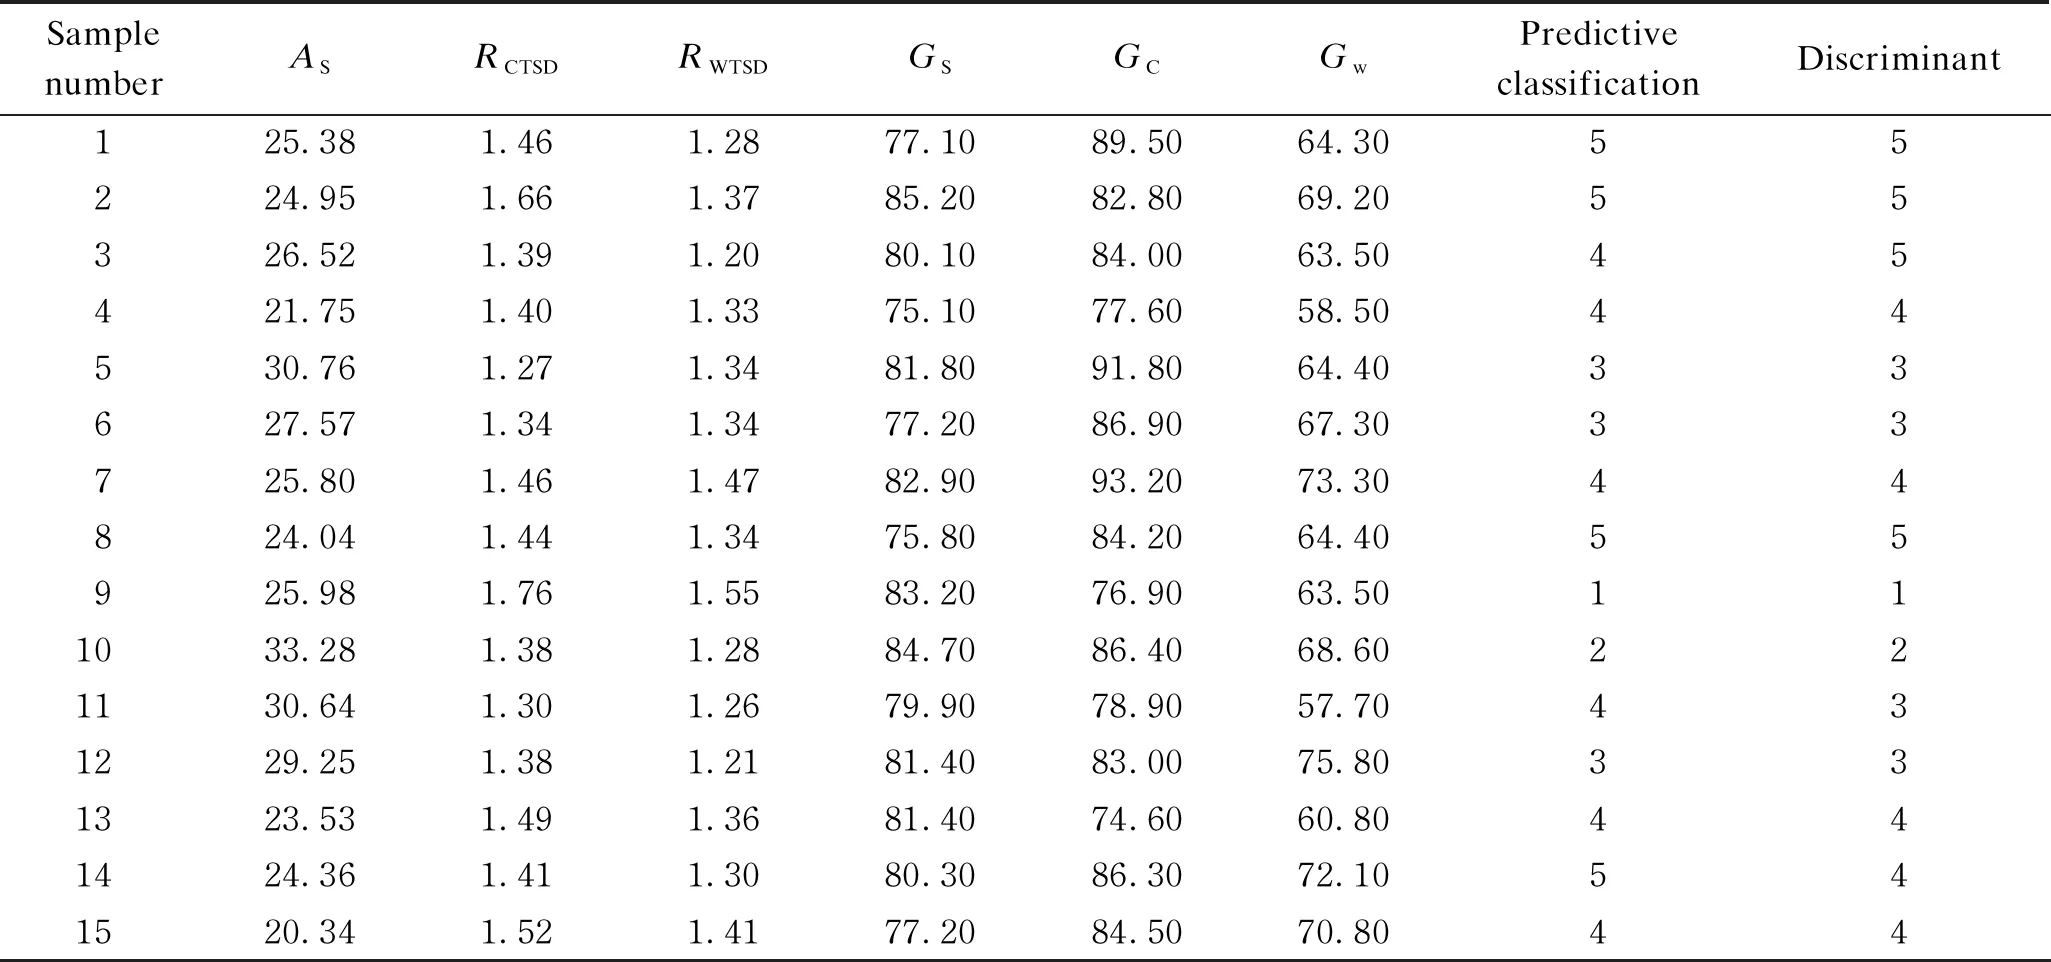
Table 10 Division of 15 new samples
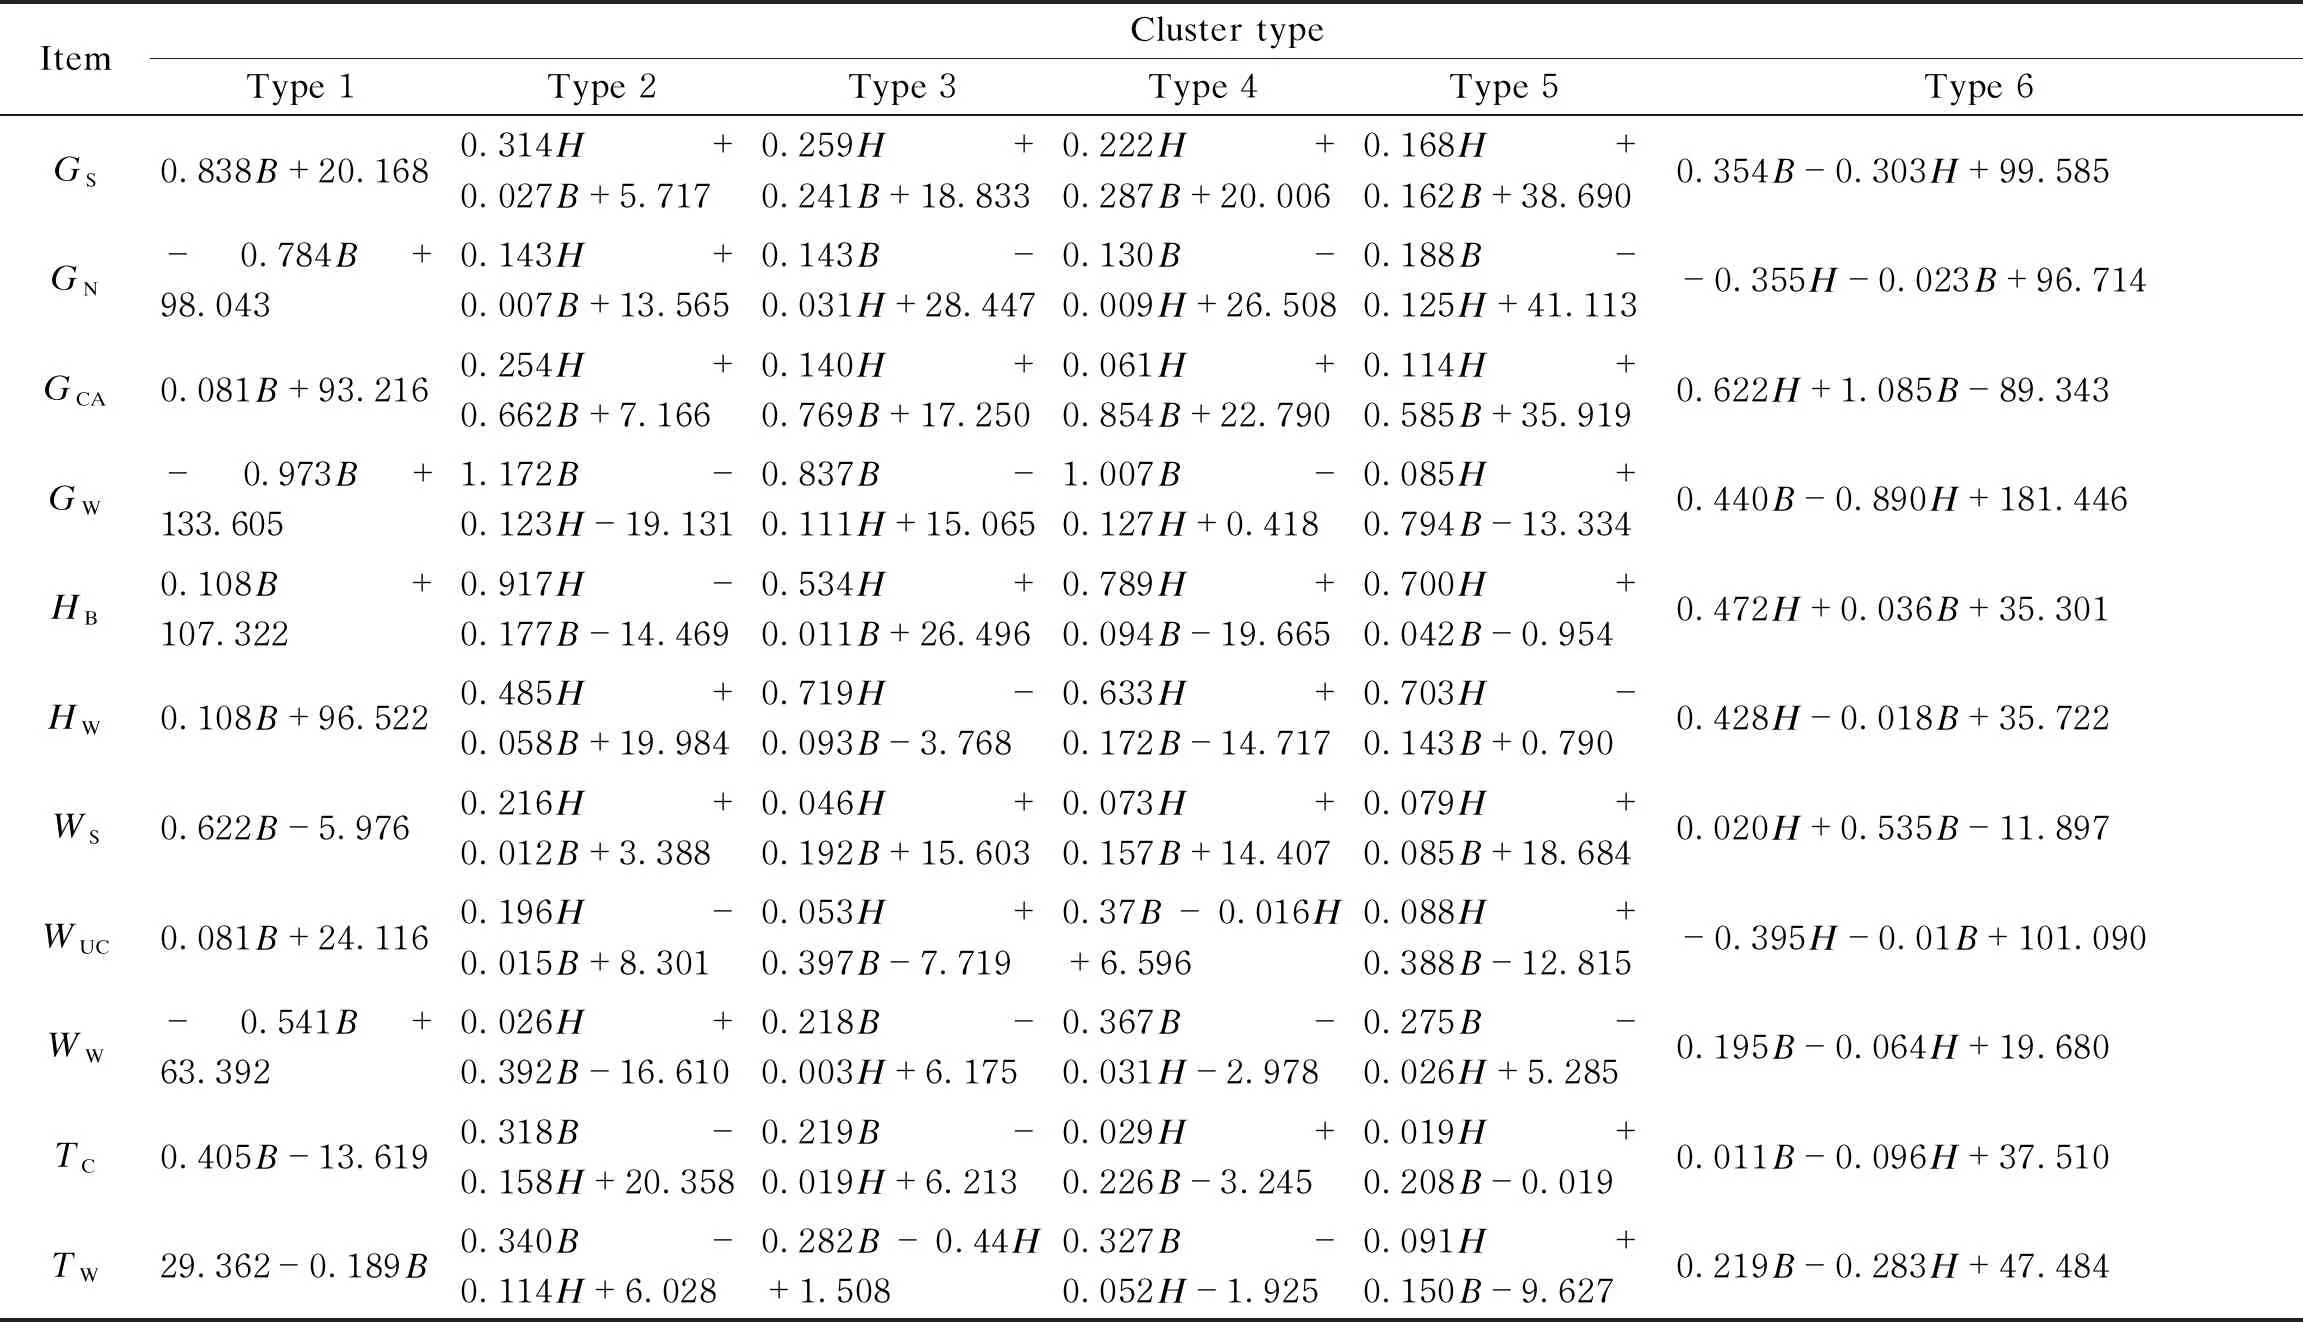
Table 11 Mathematical regression model of 11 various body types
3 Conclusions
(1) Making analysis of the basic measuring position of the upper body of young females in Jiaodong area shows that it is a group with their regional characteristics.
(2) Using the classification method of “size feature+shape index+front and back indices”, the upper body shape of young females in Jiaodong area is divided into six categories by rapid clustering.
(3) The mathematical regression model and the functional relationship between upper limb variables and height and chest circumference is obtained. It can provide data support for the structural design of young females in Jiaodong area.
This study is based on the actual anthropometric data of young females in Jiaodong area, and the experimental results show the classification of body shapes of young females in this area, which provides accurate data reference for fashion designers and garment manufacturers, and it is conducive to the personalized design of fit clothing for young females in this area. Due to the limited sample size, the proportion of three body types in Type 1, Type 2 and Type 6 is relatively small, and there may be some deviations in reflecting the characteristics of these three types. Therefore, it is necessary to increase the number of experimental samples and pay attention to relevant specific data. Also relevant experiments should be further studied and expanded.
 Journal of Donghua University(English Edition)2022年5期
- Journal of Donghua University(English Edition)的其它文章
- Finite-Time Stability for Nonlinear Fractional Differential Equations with Time Delay
- Adaptive Single Piecewise Interpolation Reproducing Kernel Method for Solving Fractional Partial Differential Equation
- Adaptive Neural Network Control for Euler-Lagrangian Systems with Uncertainties
- Electromagnetic Transmission Characteristics of Y-Shaped and Y-Ring-Shaped Frequency Selective Fabrics
- Property of Polyimide/Flame-Retardant Viscose Blended Fabrics
- Evaluation of Tactile Comfort of Underwear Fabrics
