Frozen sand–concrete interface direct shear behavior under constant normal load and constant normal height boundary
Jian CHANG ,Jian-kun LIU,2,3✉ ,Ya-li LI
1School of Civil Engineering,Beijing Jiaotong University,Beijing 100044,China
2School of Civil Engineering,Sun Yat-sen University,Zhuhai 519082,China
3Southern Marine Science and Engineering Guangdong Laboratory(Zhuhai),Zhuhai 519082,China
Abstract: The shear strength properties of the frozen sand–structure interface are critical for evaluating the serviceability of pile foundations in frozen ground.The shear characteristics of the frozen sand–concrete interface were studied with two boundary conditions (constant normal load (CNL) and constant normal height (CNH)),at three normal stresses (100,200,and 300 kPa),and at three temperatures (−2,−5,and −8 ℃).A detailed comparative analysis was performed to explore the principal factors affecting the shear/normal-shear displacement.The results showed that the shear behavior of the frozen sand–concrete interface under CNL was similar to that under CNH.The shear stress–shear displacement exhibited strain softening.The temperature and normal stress were the major influences on normal properties.The lower the temperature and the higher the normal stress,the greater was the elastic shear modulus.The peak shear stress and critical shear stress exhibited a dependence on normal stress.An exponential growth in the peak shear stress was observed as the temperature decreased.Critical shear stress was dependent on temperature.The value and percentage of peak ice-cementation in peak shear stress was affected by temperature and normal stress.
Key words: Frozen sand–concrete interface;Peak shear strength;Critical shear strength;Ice-cementation;Boundary condition
1 Introduction
Understanding the mechanical properties of the soil–structure interface is important in geocryology engineering.The properties of the unfrozen soil–structure interface have been studied(de Gennaro and Frank,2002;Lashkari,2013;Saberi et al.,2018a).The influence of factors (such as normal stress,mois‐ture content,roughness,and boundary conditions) on the soil–structure interface has been obtained.Particle image velocimetry (PIV) has been used to study the shear mechanical behavior of particles and their move‐ments and shear bands have been observed directly(Peerun et al.,2019,2020;Choo and Ong,2020).In addition,the well-established four-stage soil she‑aring model was validated based on these studies.The advanced investigation method is of enormous significance for the study of the properties of the fro‐zen interface(Wang et al.,2022).We have a thorough understanding of the shear mechanism of the unfro‐zen soil–structure interface based on these advanced studies.However,the serviceability of foundations in permafrost regions is determined by the mechanical properties of the frozen soil–structure interface,and investigating the influence of various factors on the soil–structure interface behavior can enable effective prediction of freezing strength,which can support structural design in permafrost regions.
Many investigations on the shear properties of frozen interfaces have been conducted.To acquire more accurate shear properties of frozen interfaces,researchers have conducted direct shear laboratory tests and pile foundation in-situ tests in permafrost regions.Numerical simulation methods have been designed to evaluate the shear strength of the frozen interface.It was found that the stress–strain behavior,strain rates,and freezing strength between frozen soil and struc‐ture are functions of the physical properties,loading rate,water content,and normal stress of soil accord‐ing to direct shear laboratory tests;several methods to predict the freezing bond strength have also been pro‐posed (Roggensack and Morgenstern,1978;Ladanyi,1995;Ueda et al.,2004;Choi and Ko,2011;Ko and Choi,2011;Lee et al.,2013;Wen et al.,2013).The significance of water content,freezing temperature,and freezing time on the freezing strength of a frozen silty clay–concrete lining interface was analyzed.The results showed that the influence of freezing tempera‐ture is the most apparent among the three factors,and the effect of water content is the least (Sun et al.,2020).The shear characteristics of ice–frozen soil interface influenced by initial water content,initial void ratio,and negative temperature were investigated.Temperature and initial water content were found to be determinants of ice–frozen clay interface dilatancy and shear properties (Shi et al.,2020).The mechanical properties of a thawing soil–concrete interface influ‐enced by moisture content,temperature,and normal load were analyzed (Pan et al.,2022).The stress path has a sensitive influence on rheological and stiffness properties based on a study of strength and deforma‐tion in frozen loess(Zhou et al.,2020).Model tests of pile foundations in permafrost regions have been con‐ducted,and the freezing features of the pile–frozen soil interface and the relationship between the bearing capacity of a single pile and temperature have been acquired.The results indicated that the negative tem‐perature is the determining factor for the pile founda‐tion’s bearing capacity.Also,the geotechnical frictional performance of piles in permafrost regions has been studied using model tests (Cheng et al.,2004;Wang et al.,2006).The shear and tensile strengths were pos‐itively correlated with negative temperature and mois‐ture content based on the study,and a bond–friction interface model was built to predict the properties of pile–frozen soil (Sun et al.,2021).The shear proper‐ties were examined according to negative temperature direct shear tests and the deformation mechanism of the warm frozen silt–cemented soil interface by a binary medium model(Zhang et al.,2021).The freez‐ing strength of a frozen sand–steel plate interface was analyzed based on tests,and a damage model was pro‐posed based on the comprehensive continuous damage theory and the statistical strength theory(Shi and Yang,2021).A series of pile foundation in-situ tests showed that the shearing deformation of frozen soil around the pile and the changes in porosity in the soil struc‐ture resulted in particularly low pile uplift capacities,and the friction coefficient played an important role in the growth of freezing strength(Biggar and Sego,1993;Zhang et al.,2008;de Hollanda Cavalcanti Tsuha et al.,2016;Ji et al.,2017).Low temperature decreased the shear strength of pile-frozen soil based on the study,and a friction parameter was suggested to describe the resistance of the interface(Aldaeef and Rayhani,2021).The freezing shear tests on frozen sand–steel pipe interfaces were performed,and a judgement equation(τas,i−σas,i≤0,whereτas,iis the frozen shear strength,andσas,iis the frozen shear stress)for freezing shear failure was proposed (Sumitani et al.,2007).The judgement equation illustrated the strength failure condition of the frozen sand–steel pipe interfaces.Sumitani et al.(2007) divided the boundary curve of a frozen inter‐face into several segments and found that a shear strength failure of frozen sand steel pipe interfaces would happen when the load along the micro-segment was smaller than the shear stress of the micro-segment.Numerical simulation methods of pile interaction with frozen soil have been established to analyze heat transfer,soil compression,thaw consolidation,and embankment deformation (Puswewala,1991;Chen et al.,2022).
Most tests were conducted under a constant nor‐mal load (CNL) because of restrictions in the test equipment and engineering conditions.The different boundary conditions exhibit different soil–structure interfaces,which impose different stress paths.Results showed that the load transfer mechanism,shear and volumetric behavior of the interface predominantly depend on the stress path(Johnston et al.,1987;Tabu‐canon et al.,1995;Evgin and Fakharian,1996;Fakhar‐ian,1996;DeJong et al.,2003;Mortara et al.,2007).Hence,it is essential to study the shear properties of interfaces under complex boundary conditions (CNL,constant normal height (CNH),and constant normal stiffness (CNS)) in permafrost regions to provide the‐oretical and experimental support for structural design(Saberi et al.,2018b).
Analysis of the development of shear strength and displacement/stress–shear displacement under dif‐ferent boundary conditions is helpful to understanding the shear properties and mechanism of a frozen inter‐face.This study investigates the development of shear strength,ice-cementation,and displacement/stress–shear displacement of sand–concrete interfaces through a series of experiments using a self-developed large-scale direct shear apparatus at Beijing Jiaotong University,China and considering different temperatures,normal stresses,and boundary conditions.Section 2 pro‐vides a detailed description of the testing process.In Section 3,the influence of normal stress,temperature,and boundary conditions on stress/displacement–shear displacement and shear strength are analyzed.Finally,Section 4 presents the conclusions of the study.The main findings of this study can assist in understand‐ing the bearing capacity mechanism of temperaturecontrolled thermal piles working in high-speed rail‐ways in permafrost regions and provide data support for establishing a constitutive model of frozen sand–concrete interfaces under shear loading.
2 Experimental scheme and testing process
The study of shear behavior influenced by normal stress,temperature,and boundary conditions was inves‐tigated in a series of frozen sand interface direct shear tests.The specimen preparation and test procedures are explained as follows.
2.1 Testing apparatus
The large-scale direct shear test apparatus used for the frozen sand–concrete interface was developed at Beijing Jiaotong University,China (Chang et al.,2022).The walls of the shear boxes were hollow and connected with a refrigeration system by four tubes with the coolant circulated within the walls of the shear boxes to control their inner environmental tem‐perature.The temperature could be held constant or varied within the range of −25 to 30 ℃by program control of the refrigeration system.The schematic of the specimen in the shear boxes is shown in Fig.1.
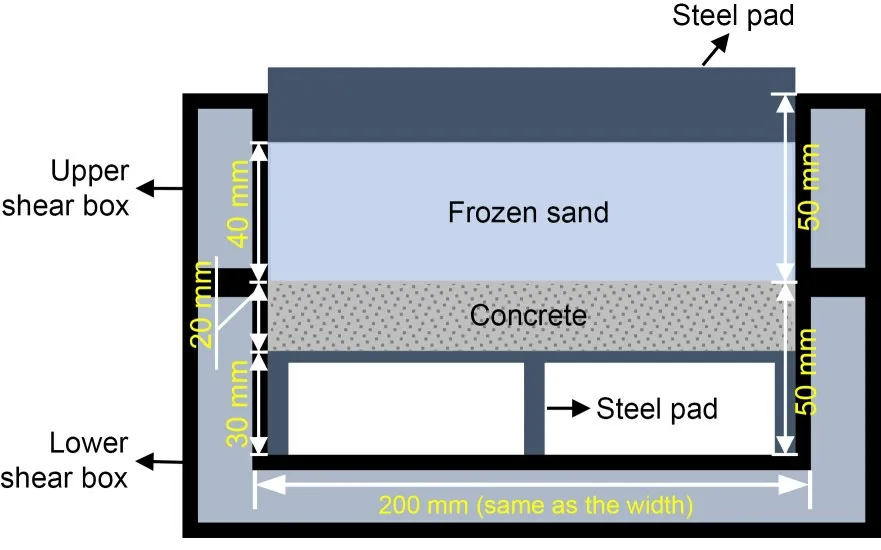
Fig.1 Schematic view of the specimen in shear boxes
2.2 Material and specimen preparation
The soil used for specimens was poorly graded fine sand(based on the unified soil classification system)according to the physical properties of sand as pre‐sented in Table 1.The grain size distribution of sand is presented in Fig.2.The maximum dry density and optimum water content were 1.62 g/cm3and 18%,respectively,based on the ASTM Standards.
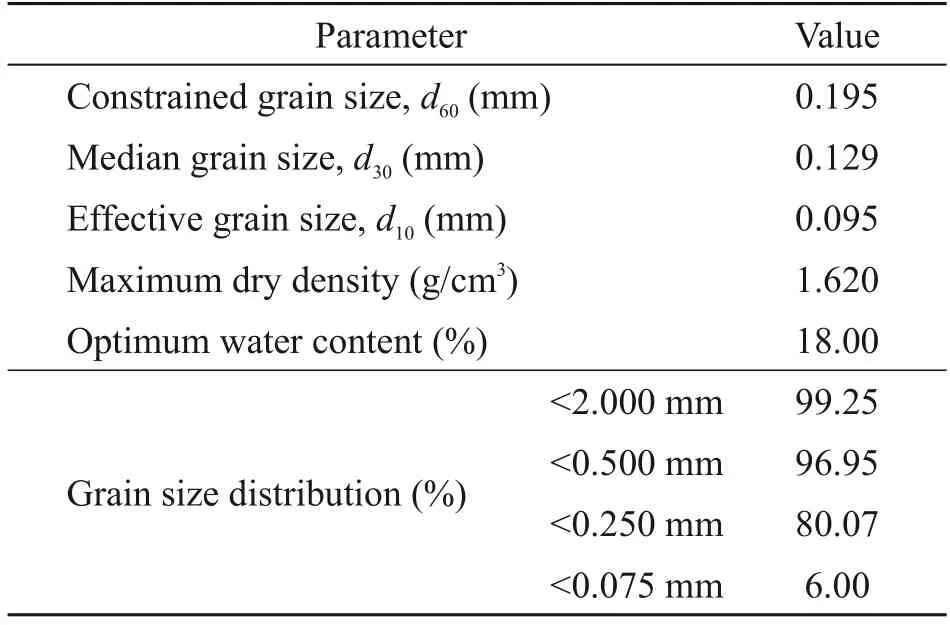
Table 1 Physical properties of the sand

Table 2 Parameters of the interface under CNL

Table 3 Parameters of the interface under CNH
The artificial frozen sand–concrete interface spec‐imens are prepared in three steps(Chang et al.,2022):sand sample preparation,concrete specimen prepara‐tion,and frozen saturated sand–concrete specimen preparation.
2.3 Testing procedure
Direct shear tests were controlled by horizontal displacement,and the shear rate was 0.5 mm/min.Based on the restriction of the performance of the large-scale direct shear apparatus,these tests were conducted under CNL and CNH.The temperatures were −2,−5,and −8 ℃,and the normal stresses were 100,200,and 300 kPa.The normal stiffness of the interface constraints was zero(Fig.3a)when the spec‐imen was under CNL,and the normal stiffness was infinite(Fig.3b)when the specimen was under CNH.The normal stress was imposed after placing the spec‐imen in the pre-cooling shear boxes,keeping the nor‐mal stress throughout the test under CNL and fixing the height throughout the test under CNH.The load‐ing processes of the frozen sand–concrete interface are illustrated in Fig.4.The normal stressσnunder CNL kept constant during shear progress (σn=,whereis the initial normal stress),and the normal stressσnunder CNH kept changing during shear progress.The stress–shear displacement curve after the peak shear stress was steady,which indicated the end of the shear‐ing process.Each test was repeated three times,and the results were averaged.
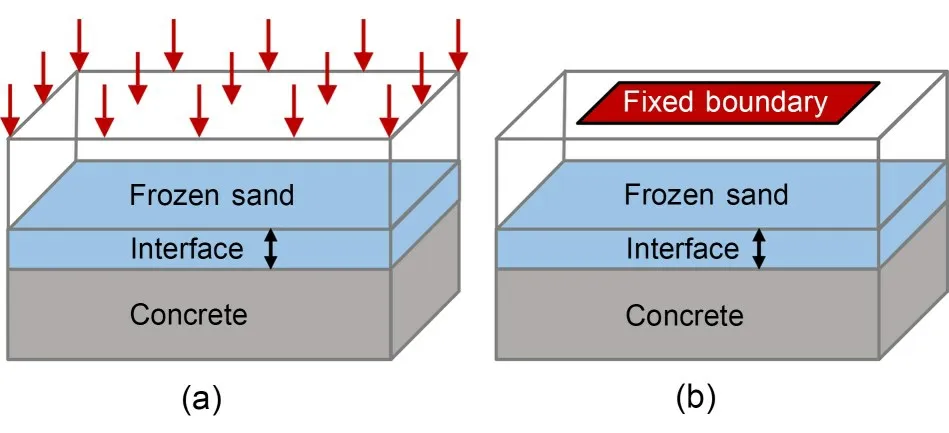
Fig.3 Schematic view of normal stiffnesses of the frozen sand–concrete interface under CNL and CNH: (a) zero normal stiffness(CNL);(b)infinite normal stiffness(CNH)
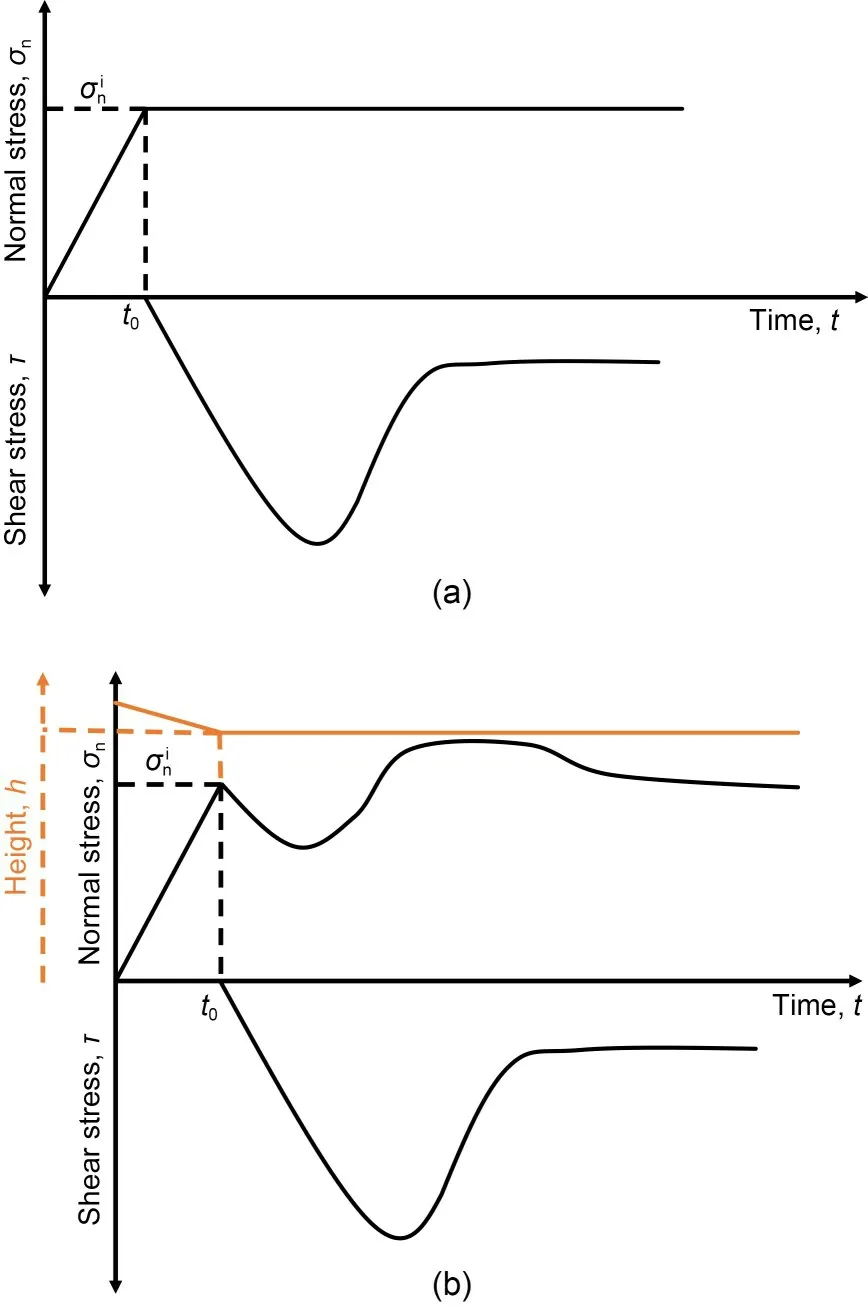
Fig.4 Schematic view of loading processes of the frozen sand–concrete interface: (a) CNL;(b) CNH. t0 is the time the initial normal stress reached the design value
3 Results and discussion
3.1 Shear stress–shear displacement properties
The feature points of the shear stress–shear dis‐placement curve were introduced to comprehensively study the shear characteristics,as shown in Fig.5.When the shear stress increased to the first point,the volume of the frozen interface began to increase,and that stress point was defined as the dilatancy stress.The second point,at the peak of the curve,was defined as the peak shear stress,τp,and the corresponding shear displacement was defined as the peak shear dis‐placement,up.The shear stress then gradually tended towards a stable value as the shear displacement in‐creased,and that stable shear stress was defined as the critical shear stress,τc.
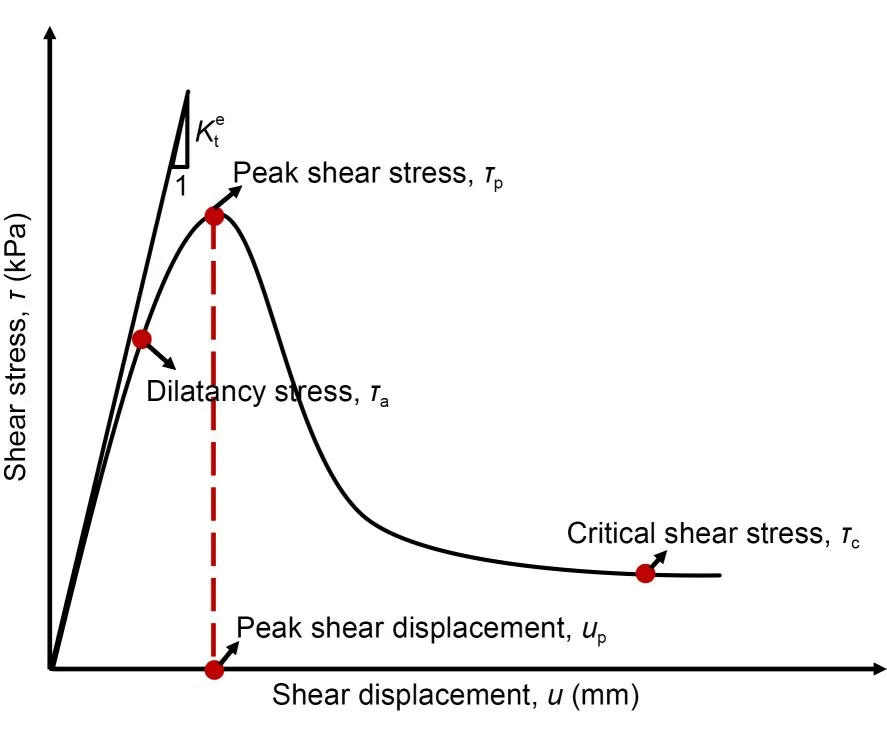
Fig.5 Schematic of characteristic points in a shear stress–shear displacement curve.K et is the elastic shear modulus
The shear stress–shear displacement relationships at different temperatures (T) and different normal stresses under CNL and CNH are shown in Figs.6 and 7,respectively.
3.1.1 Influence of normal stress
The degree of strain softening was obvious.τpandτcof the frozen sand–concrete interface were af‐fected by the normal stress.
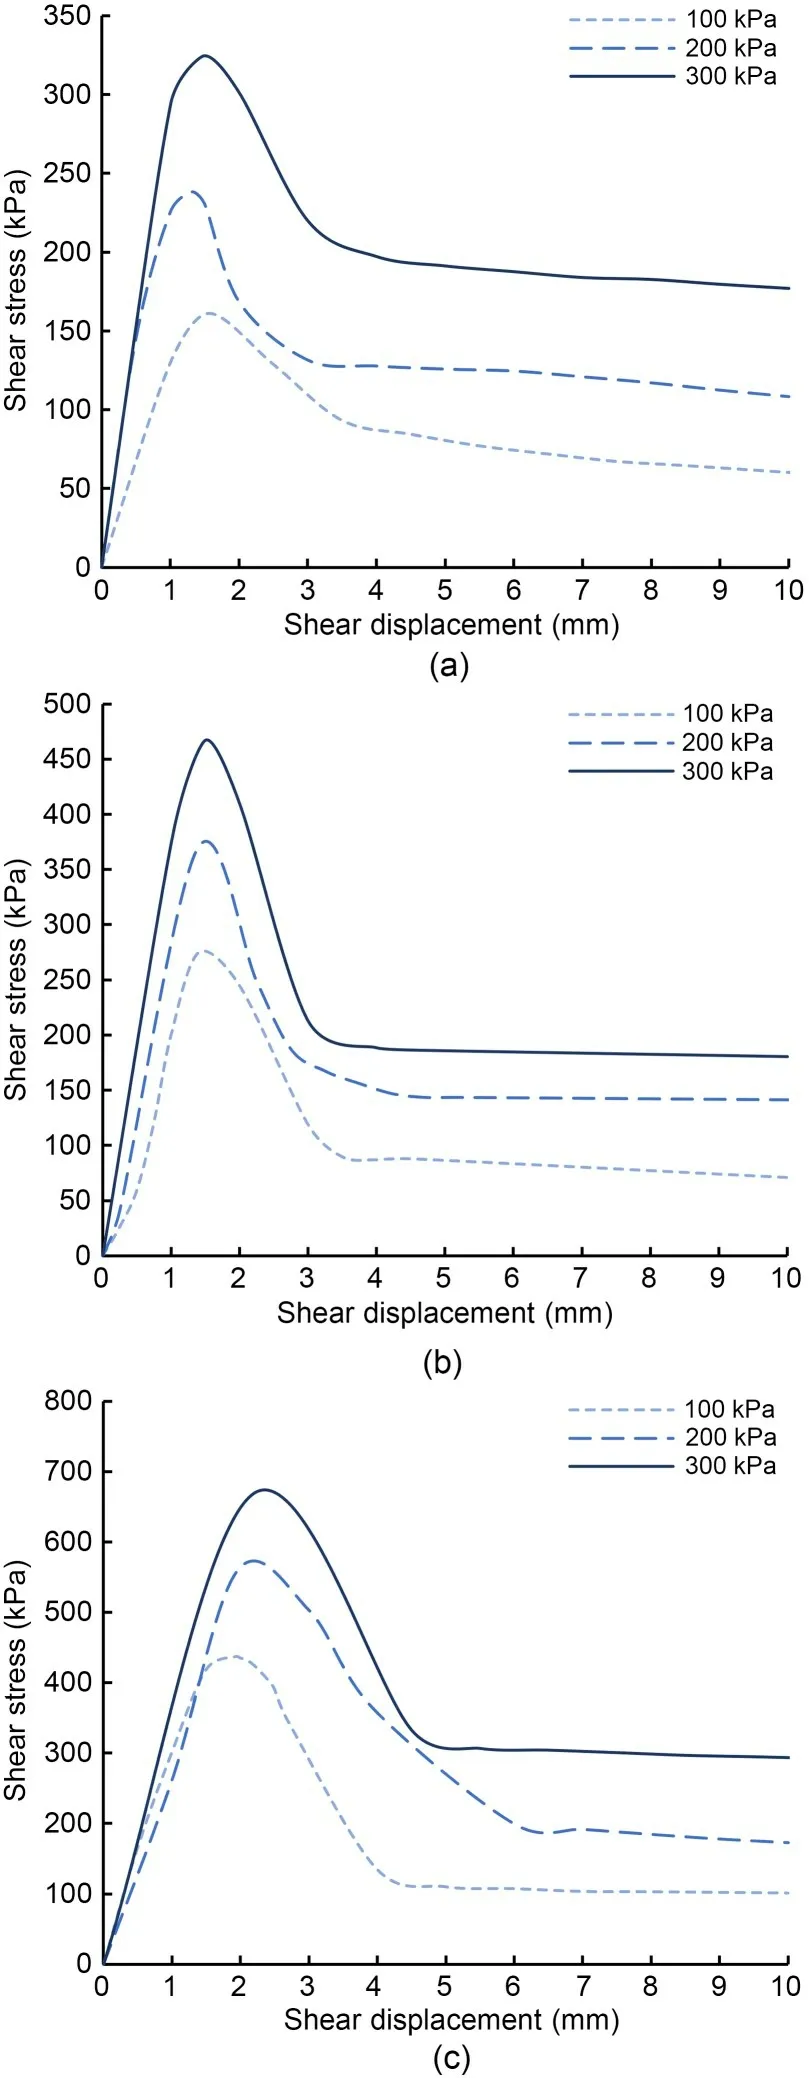
Fig.7 Shear stress–shear displacement curves at different normal stresses under CNH: (a)T=−2 ℃;(b)T=−5 ℃;(c)T=−8 ℃
3.1.2 Influence of temperature
The shear stress–shear displacement relationships at different negative temperatures were similar,butτpandτcwere different.The shear stress–shear displace‐ment relationship tended to soften obviously at the negative temperature under both boundary conditions,as shown in Figs.6 and 7.The degree of strain-softening increases with decreasing temperature.There was a brittle failure after up and the shear stress reduced afterτp.
3.1.3 Influence of boundary conditions
The development trends of shear stress–shear displacement under CNL and CNH are similar,as pre‐sented in Figs.6 and 7.
3.2 Normal displacement/stress–shear displacement properties
Research on the normal displacement–shear dis‐placement relationship under CNL and the normal stress–shear displacement relationship under CNH has improved the understanding of the mechanical charac‐teristics of the sand–concrete interface.The schematic of normal and shear displacements of the frozen inter‐face is illustrated in Fig.8,taking increasing normal displacement as compression.The normal displace‐ment of the frozen interface under CNL is less than 0.7 mm based on the tests (Fig.9),which make it difficult to measure.In addition,higher precision dis‐placement sensor is needed due to the small magni‐tude of the normal displacement of the frozen inter‐face.The development of normal displacement with shear displacement showed a compression trend in this study.The reasons for that may be that the total normal displacement of frozen sand in the shear box was measured or the precision of the displacement sensor was insufficient.Therefore,it is necessary to investigate the development of the normal stress of the frozen interface under CNH to gain further information.
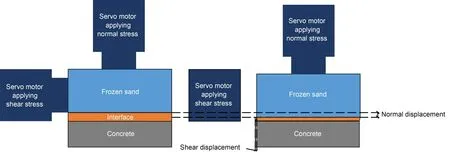
Fig.8 Schematic of normal displacement of the frozen interface
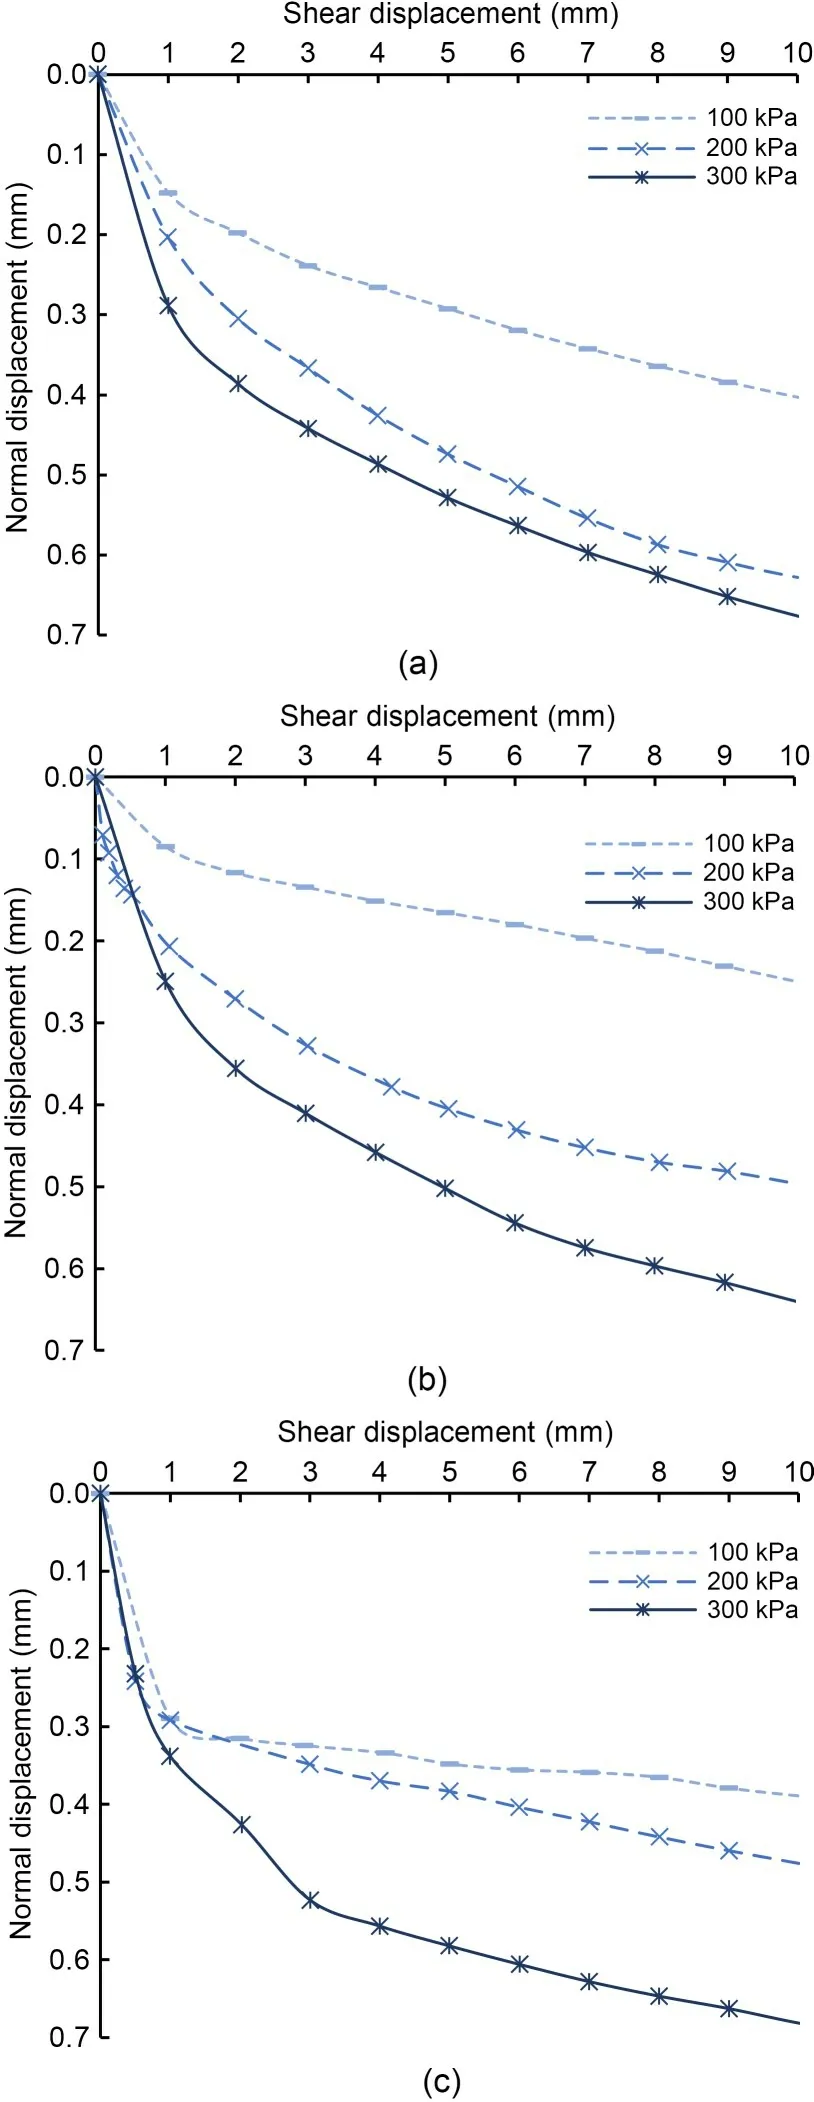
Fig.9 Normal displacement–shear displacement curves of the sand–concrete interface under CNL: (a) T=−2 ℃;(b)T=−5 ℃;(c)T=−8 ℃
The feature points on the relation curves of nor‐mal stress–shear displacement under CNH are shown in Fig.10.The normal stress decreases to a valley with increasing shear displacement,then increases to peak normal stress,σp,and remains constant,before finally decreasing and tending towards stability.In this process,the decrease in the normal stress indicates the compression trend of the sand–concrete interface,and the increase after the valley indicates the dilatancy trend of the sand–concrete interface.This study set the valley point as the phase transition point,σt,and the normal stress increased with increasing shear dis‐placement untilσp.The shear displacement was equal to or greater thanupwhen the normal stress peaked in reference to the corresponding shear stress–shear dis‐placement curve.It was found that when the normal stress remained constant at the peak,the shear stress decreased,and when the normal stress was in a stable state,the shear stress entered its residual state in refer‐ence to the corresponding shear stress–shear displace‐ment curve(Fig.5).In this study,the normal stress stable and shear stress residual states under CNH were assumed to be a critical state.
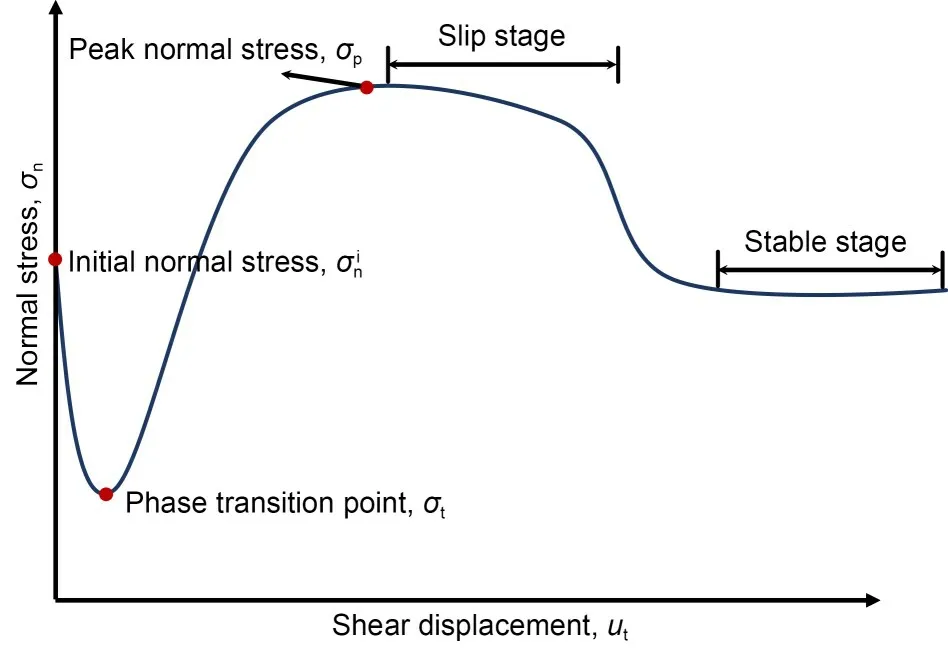
Fig.10 Schematic of characteristic points in a normal stress–shear displacement curve
3.2.1 Influence of initial normal stress
The influence of initial normal stress on normal stress–shear displacement relationship under CNH was investigated,as shown in Fig.11.The feature points of the normal stress–shear displacement curve were more apparent with higher initial normal stress at different temperatures.σt,σp,slip stage,and stable stage of the normal stress–shear displacement curve appeared with higher initial normal stress.The normal stress–shear displacement curve developed with a gentle slope and some feature points disappeared under lower initial normal stress.σtandσpincreased when initial normal stress was increasing at different temperatures.The absolute difference betweenσtandincreased with increasing initial normal stress at different tem‐peratures.The absolute difference betweenσpandat −8 ℃increased,with increasing initial normal stress,as illustrated in Fig.11c.As for −8 ℃,the ab‐solute difference betweenσtandwas 8.75,9.75,and 17.63 kPa and the absolute difference betweenσpandwas 73.13,78.38,and 75.75 kPa when the initial normal stresses were 100,200,and 300 kPa,respectively.
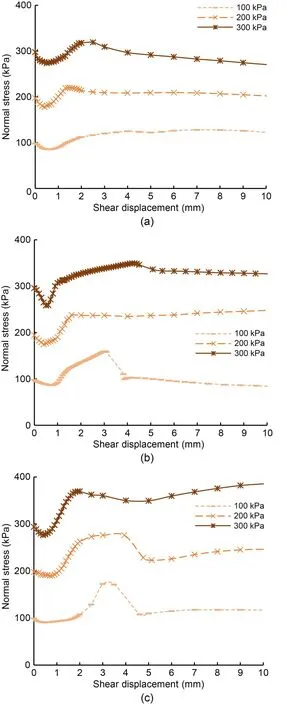
Fig.11 Normal stress–shear displacement curves of sand–concrete interface under CNH:(a)T=−2 ℃;(b)T=−5 ℃;(c)T=−8 ℃
3.2.2 Influence of temperature
The temperature had an appreciable effect on the normal stress under CNH.=100 kPa was used as an example to illustrate the influence of temperature on the normal stress–shear displacement relationship.The normal stress–shear displacement curve at −2 ℃was relatively flat(Fig.12a),and the normal stress decreased with increasing shear displacement toσtand remained constant.An undulating curve of normal stress with shear displacement at −5 ℃is shown in Fig.12a.The normal stress decreased with increasing shear displace‐ment untilσt,then increased toσpand declined,and finally decreased to a stable state.A curve of the normal stress–shear displacement relationship at −8 ℃is shown in Fig.12a.As shear displacement increased,the normal stress decreased toσt,then increased toσp,and dropped to a stable state.Moreover,σpdepended on the temperature.The variation ofσpat=100 kPa is shown in Fig.12a.σpat −2 ℃was 128.0 kPa,σpat−5 ℃was nearly 160.0 kPa,andσpat −8 ℃was 172.2 kPa.σtincreased with decreasing temperature.σtwas 85.5,86.5,and 90.5 kPa when the temperature was −2,−5,and −8 ℃,respectively.
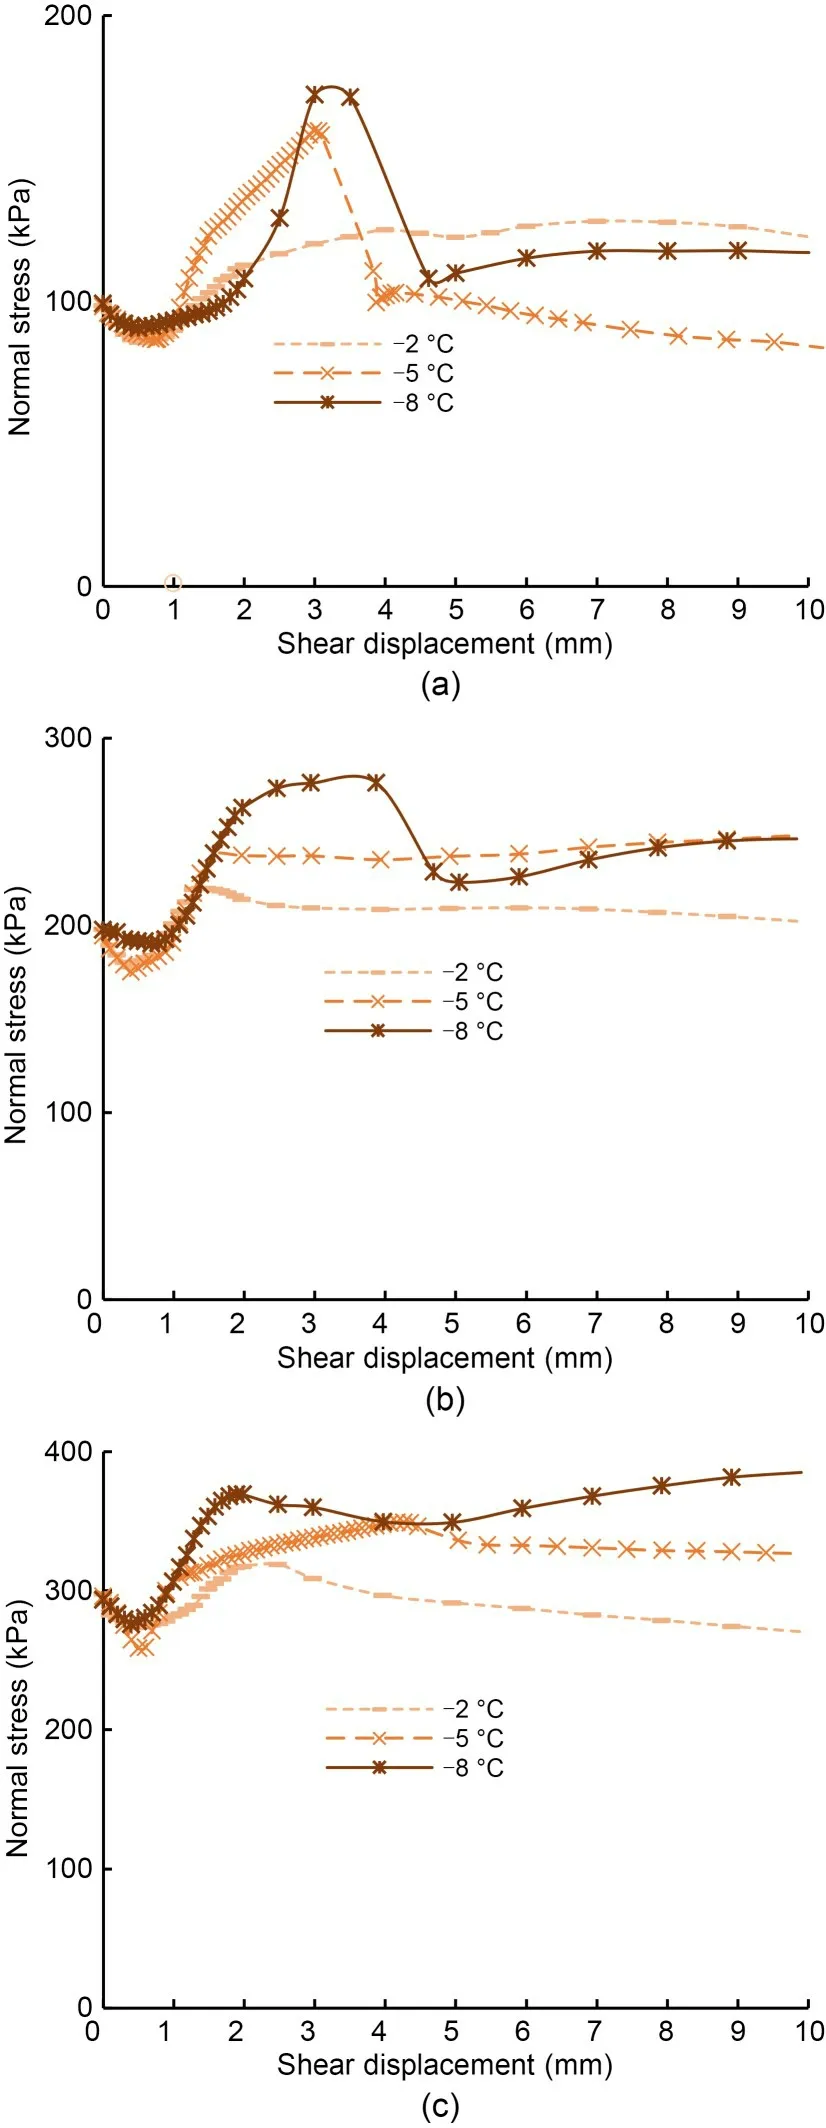
Fig.12 Normal stress–shear displacement curves of the sand–concrete interface under CNH:(a)100 kPa;(b)200 kPa;(c)300 kPa
3.3 Elastic shear modulus properties
The shear stress–shear displacement curves of the frozen sand–concrete interface under CNL,at different temperatures and normal stresses,are shown in Fig.6.The elastic shear modulus is the tangential slope of the initial stage of the shear stress–shear displacement curve under CNL and CNS boundary conditions (Lashkari,2013),as shown as Fig.5.The elastic shear modulus reflects the elastic properties of the frozen sand–concrete interface.The elastic shear properties of the frozen sand–concrete interface were studied based on the monotonic shear tests with differ‐ent temperatures and normal stresses.
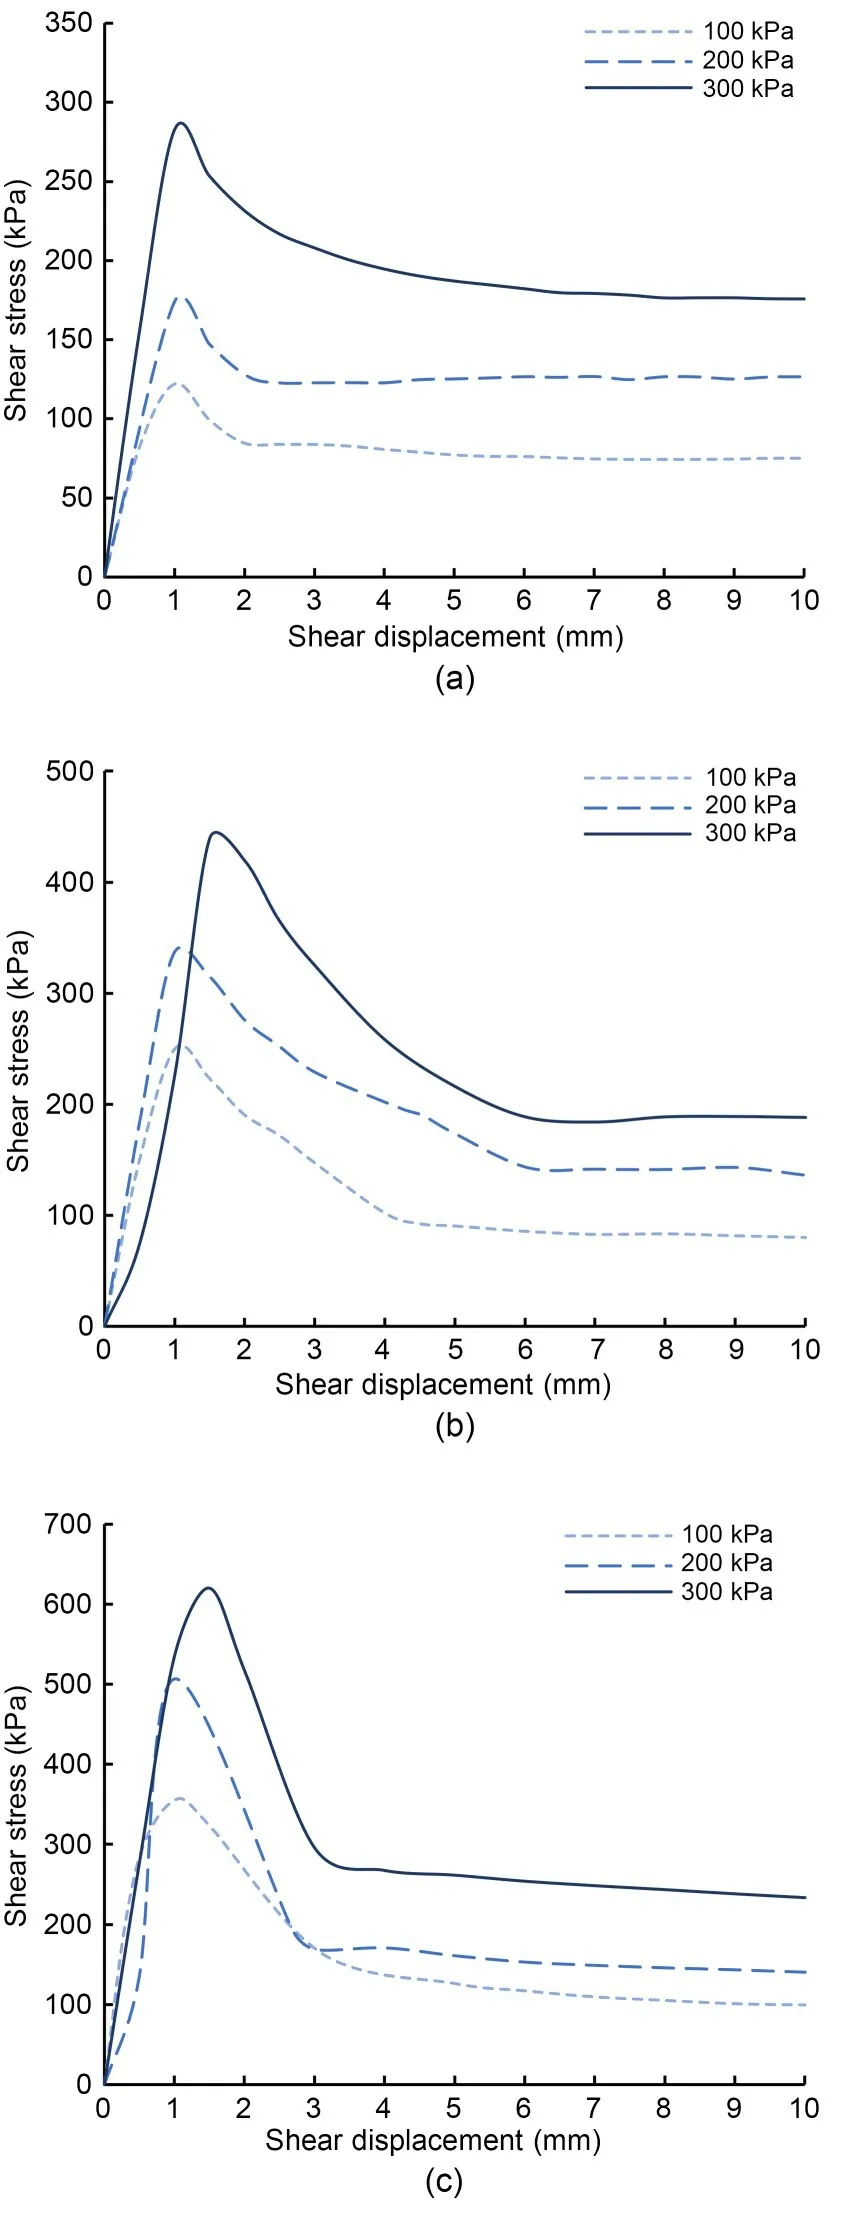
Fig.6 Shear stress–shear displacement curves at different normal stresses under CNL: (a) T=−2 ℃;(b) T=−5 ℃;(c)T=−8 ℃
The effects of initial normal stress onwere studied,as illustrated in Fig.13.increased linearly with increasing initial normal stress and decreasing temperature.The increment of elastic shear modulus increased with increasing initial normal stress and de‐creased with decreasing temperature.The relationship between initial normal stress and elastic shear modu‐lus can be described by the function=f(σn,T)=a(T)σn+m(T) based on the results of experiments,whereaandmare fitting parameters.
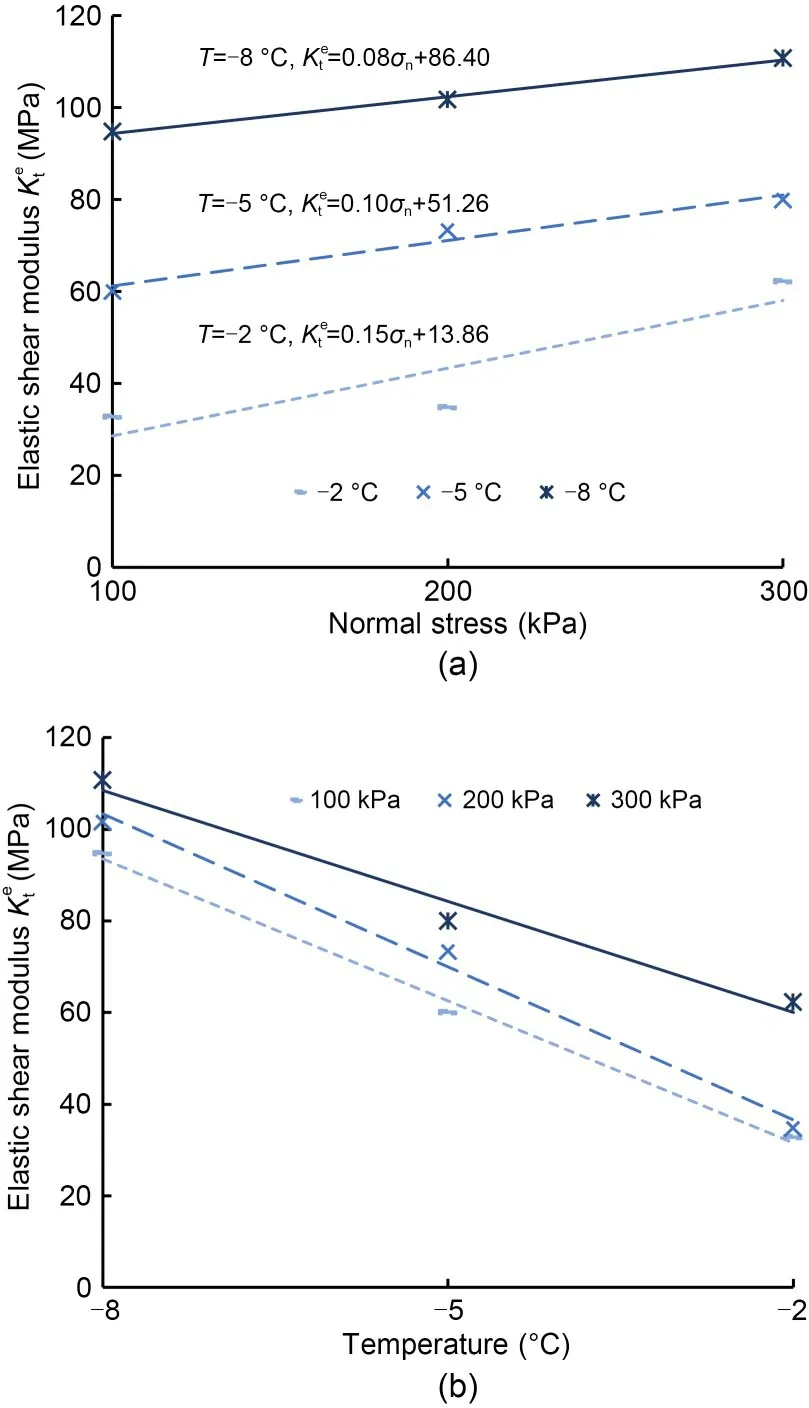
Fig.13 Elastic shear modulus of the frozen sand–concrete interface:(a)relationship between elastic shear modulus and normal stress;(b) relationship between elastic shear modulus and temperature
Further study of the influence of temperature on the elastic shear modulus is shown in Fig.14.As the temperature decreased,the value of parameteradecreased,and the value of parametermincreased.Parametersaandmcould be calculated by empirical formulas as follows:

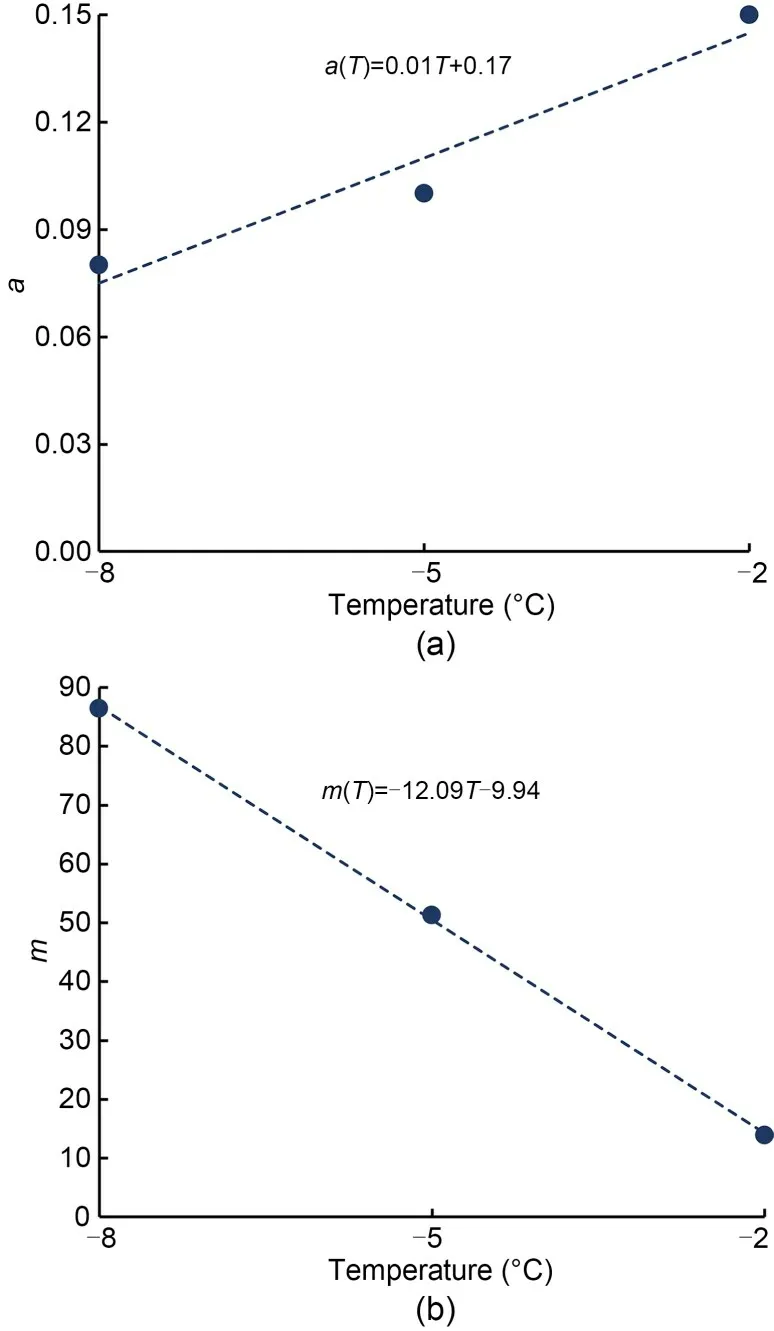
Fig.14 Parameters a(a)and m(b)with temperature
3.4 Shear strength properties
The shear band of frozen sand–structure interface consists of sand particles,ice,unfrozen water,and gas.The cementation produced by ice crystals is the major contribution to the shear strength of the frozen inter‐face.The term“ice-cementation”is used here.
3.4.1 Influence of normal stress
Figs.15 and 16 illustrate the relationships ofτpσnandτc-σnat different temperatures,under CNL and CNH,respectively.τpandτcshowed a linearly increas‐ing trend with increasing normal stress at a certain temperature under both boundary conditions.The rela‐tionships ofτp-σnandτc-σncan be described by the Mohr-Coulomb failure criterionτ=σntanφ+c(parame‐ters tanφandcare the friciton coefficient and cohe‐sion,respectively),as shown in Figs.15 and 16.
3.4.2 Influence of temperature
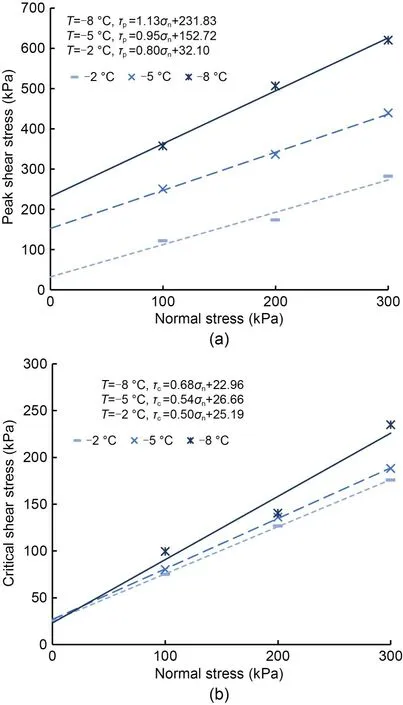
Fig.15 Shear strength of the sand–concrete interface under CNL:(a)peak shear stress;(b)critical shear stress
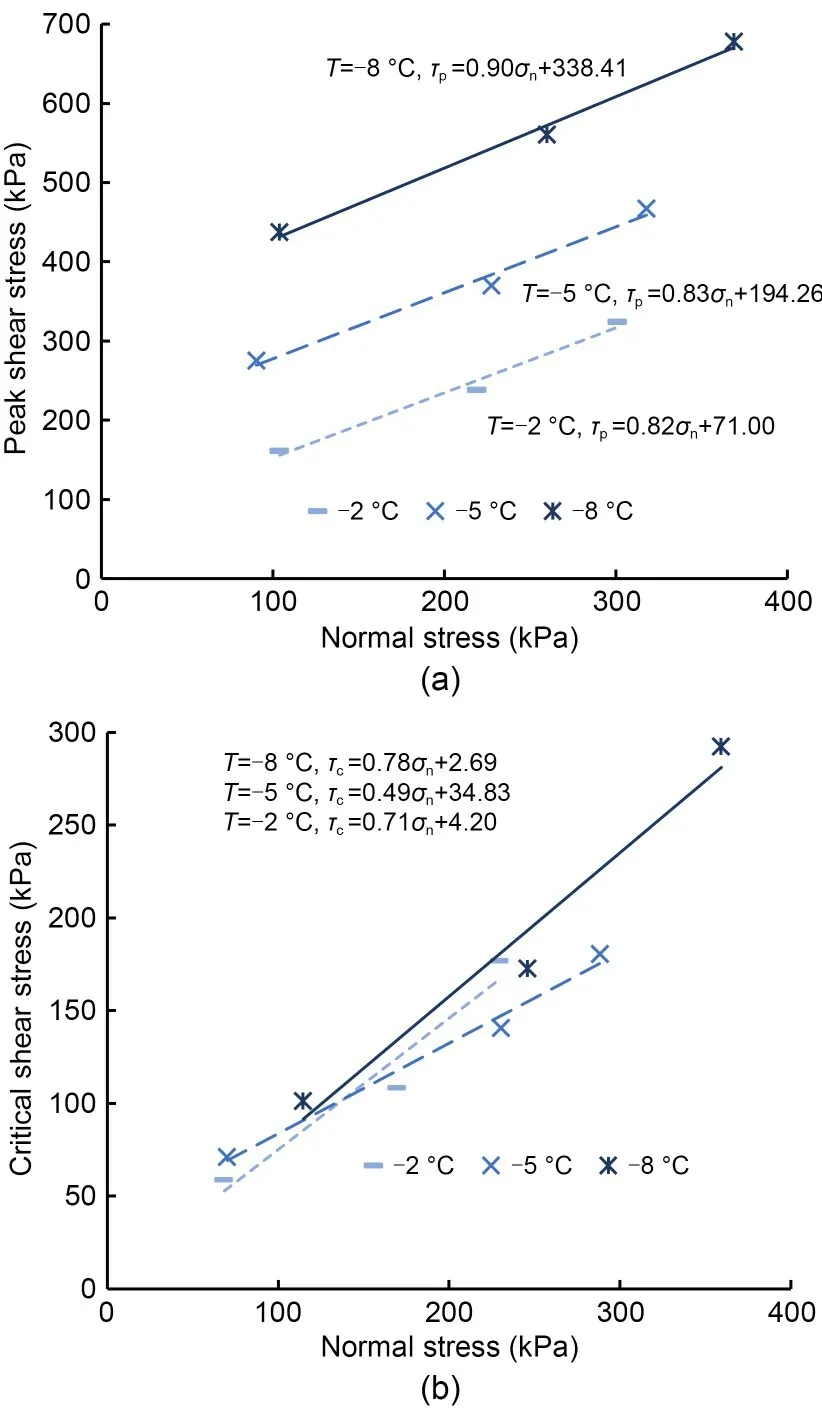
Fig.16 Shear strength of the sand–concrete interface under CNH:(a)peak shear stress;(b)critical shear stress
Further studies were conducted to investigate factors affecting the cohesioncand friction coefficient tanφof the Mohr-Coulomb failure criterionτ=σntanφ+c.The cohesioncand friction coefficient tanφofτpandτcat different temperatures under CNL and CNH are listed in Tables 2 and 3,respectively.The cohesioncofτpincreased significantly,while that ofτcvaried slightly with the decrease in temperatures under both boundary conditions,as shown in Tables 2 and 3.The relationshipsc-Tofτpcould be fitted by an exponen‐tial function=20.09e-0.33Tunder CNL and=45.49e-0.26Tunder CNH.For simplicity,the influences of temperature on the friction coefficient tanφofτpand the cohesioncofτcwere ignored.Then,the weighted average method was adopted to obtain the friction coefficient tanφofτpand the cohesioncofτcunder both boundary conditions (Ladanyi,1995).The relationship between the friction coefficient tanφand temperature ofτcunder both boundary conditions is shown in Fig.17.The parameter tanφincreased with decreasing temperature under both boundary conditions.All the parameters were taken into the Mohr-Coulomb failure criterion.The equations forτpwith initial normal stress and temperature,as well asτcwith initial normal stress and temperature,were obtained,as follows:
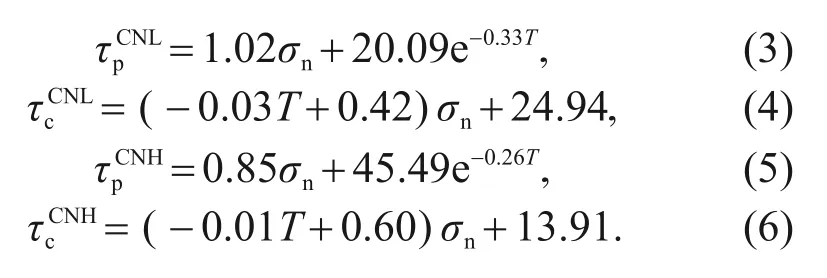
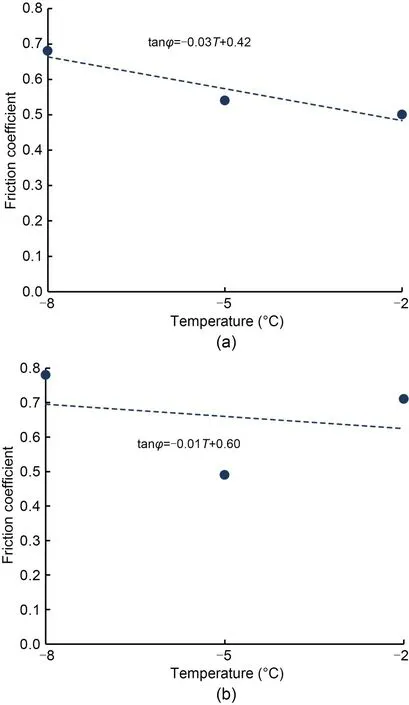
Fig.17 Relationship of the friction coefficient to temperature:(a)CNL;(b)CNH
The variations inτpandτcof the sand–concrete interface with temperature under CNL and CNH are illustrated in Figs.18 and 19,respectively.There was a significant exponential increase inτpof the sand–concrete interface with decreasing temperature at the same normal stress under CNL and CNH,as illus‐trated in Figs.18a and 19a,which is consistent with the exponential relationshipτp-Tderived from the Mohr-Coulomb failure criterion from the first part of Section 3.4.2.Lower temperature caused higherτcat a particular normal stress under CNL and CNH,as shown in Figs.18b and 19b.
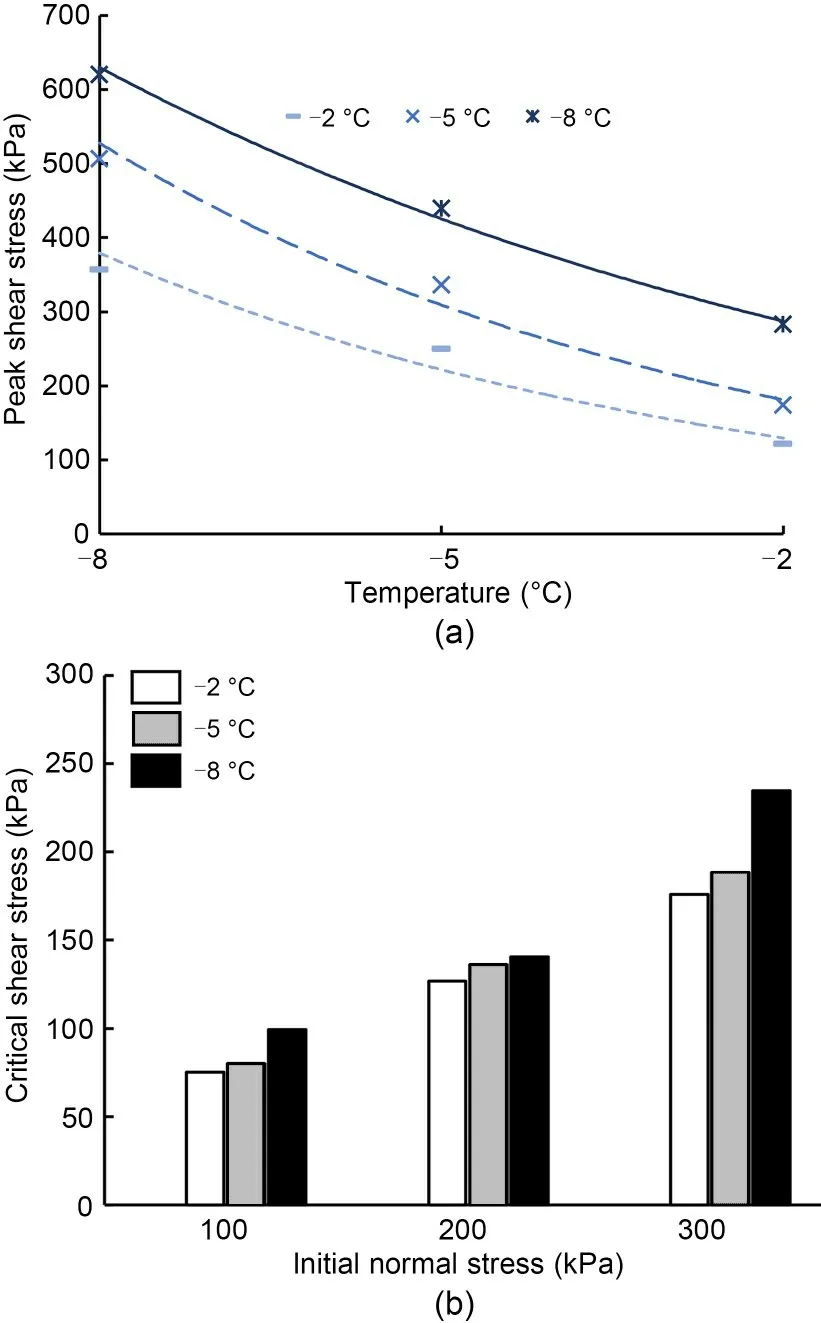
Fig.18 Shear strength of sand–concrete interface under CNL:(a)peak shear stress;(b)critical shear stress
The characteristics of shear stress were compre‐hensively analyzed and combined with the above.The shear stress increased with increasing shear dis‐placement when the shear displacement was less thanup(u
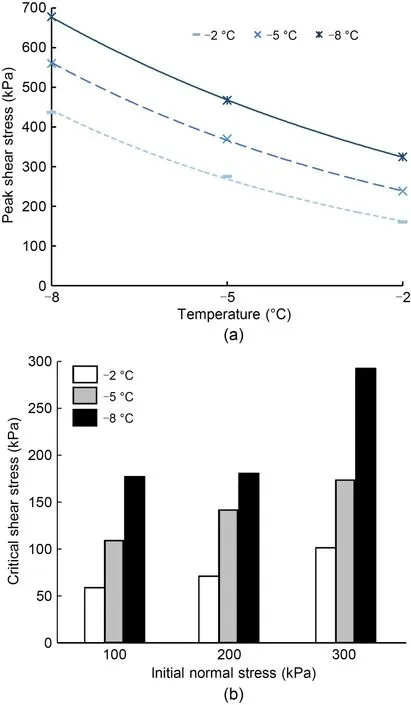
Fig.19 Shear strength of sand–concrete interface under CNH:(a)peak shear stress;(b)critical shear stress
The ice-cementation was analyzed based on the calculation method suggested by He et al.(2018).The peak ice-cementation was the difference betweenτpandτc,as=τp-τc,for CNL and CNH,as shown in Tables 4 and 5,respectively.The calculations from Tables 4 and 5 show that there was a significant increase inwith decreasing temperature and increas‐ing normal stress.A comparison of the percentage of peak ice-cementation at peak shear stress under dif‐ferent initial normal stresses at −2,−5,and −8 ℃is shown in Fig.20.The percentage of peak icecementation at peak shear stress decreased with increas‐ing initial normal stress,as shown in Fig.20.The interaction of sand particles increased with increasing initial normal stress and then the shear strength of sand increased.This showed that the shear strength of sand played a major role with increasing initial normal stress in the peak shear stress of the frozen interface.The value and percentage of peak ice-cementation in the peak shear stress increased with decreasing tem‐perature.This is because ice-cementation was deter‐mined by the ice film thickness,which caused a higher value and percentage of peak ice-cementation in the peak shear stress with decreasing temperature(Volok‐hov,2003).Thus,there was an increase in the shear stress with decreasing temperature before the shear displacement reachedup(before the failure of icecementation).

Table 4 Peak ice-cementation of the frozen sand–concrete interface under CNL
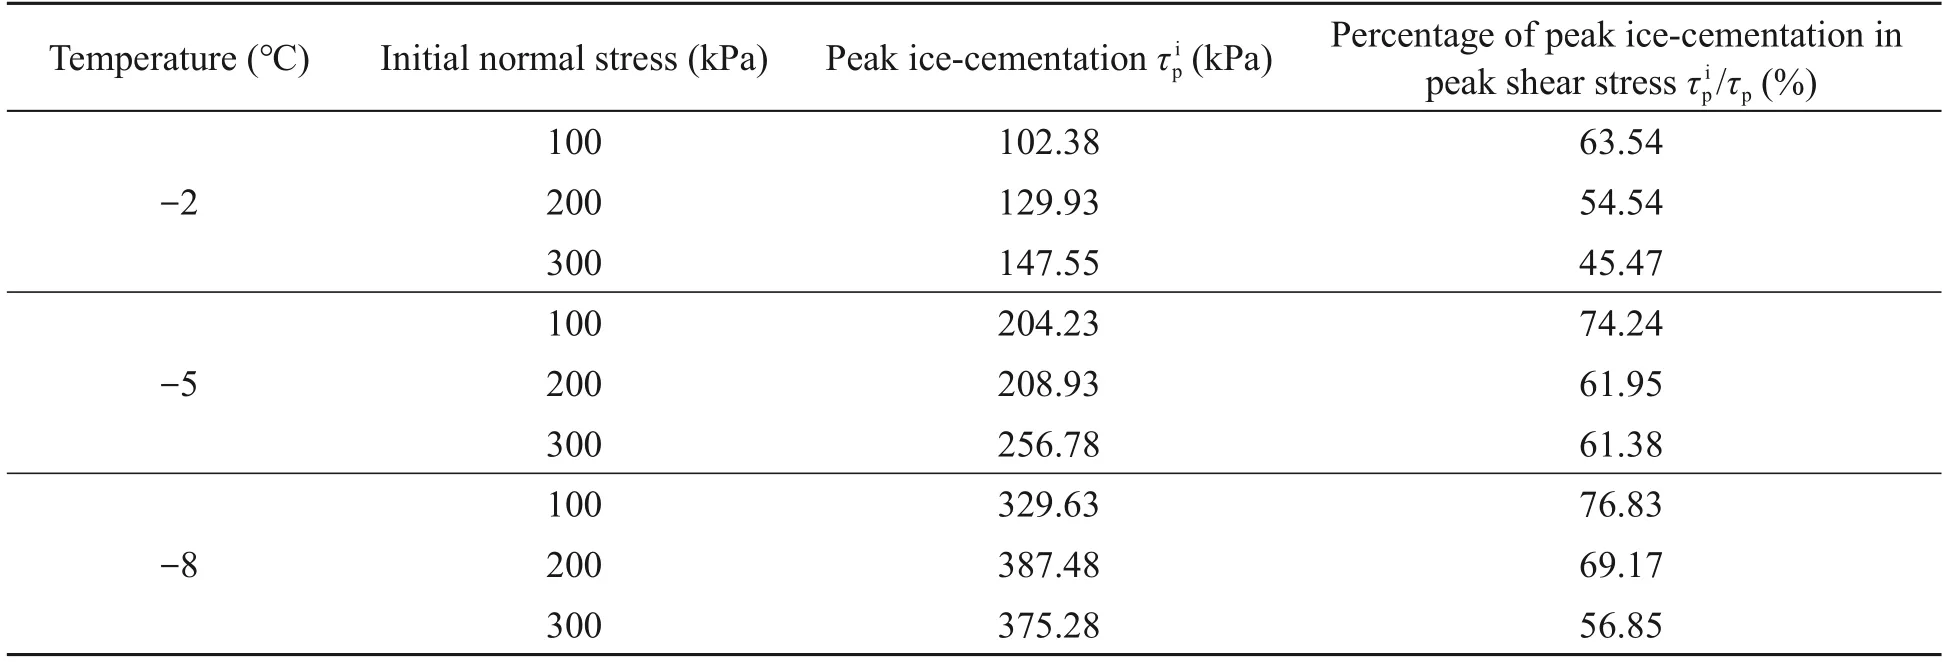
Table 5 Peak ice-cementation of the frozen sand–concrete interface under CNH
3.4.3 Influence of boundary conditions
The influence of different boundary conditions(CNL and CNH)on,τp,andτcis shown in Fig.21.under CNH was higher than that under CNL at the same temperature and initial normal stress,as shown in Fig.21a.The percentage of peak ice-cementation in the peak shear stress was higher under CNH,as illustrated in Fig.20.τpwas affected by the nega‐tive temperature and initial normal stress under bothboundary conditions,andτpunder CNH was higher at the same temperature and initial normal stress,as shown in Fig.21b.Dilation occurs with increasing shear displacement for shear displacements less thanup(Fig.11).Dilatancy caused a higher normal stress under CNH,which implies higher ice-cementation and higher peak shear stress.τcunder CNH was lower at the same temperature and initial normal stress,as shown in Fig.21c.The compression occurred with increas‐ing shear displacement at the residual stage,which led to a decreasing normal stress under CNH.It implied thatτccontinued to decrease.However,the normal stress remained constant under CNL,which caused a higher critical shear stress.
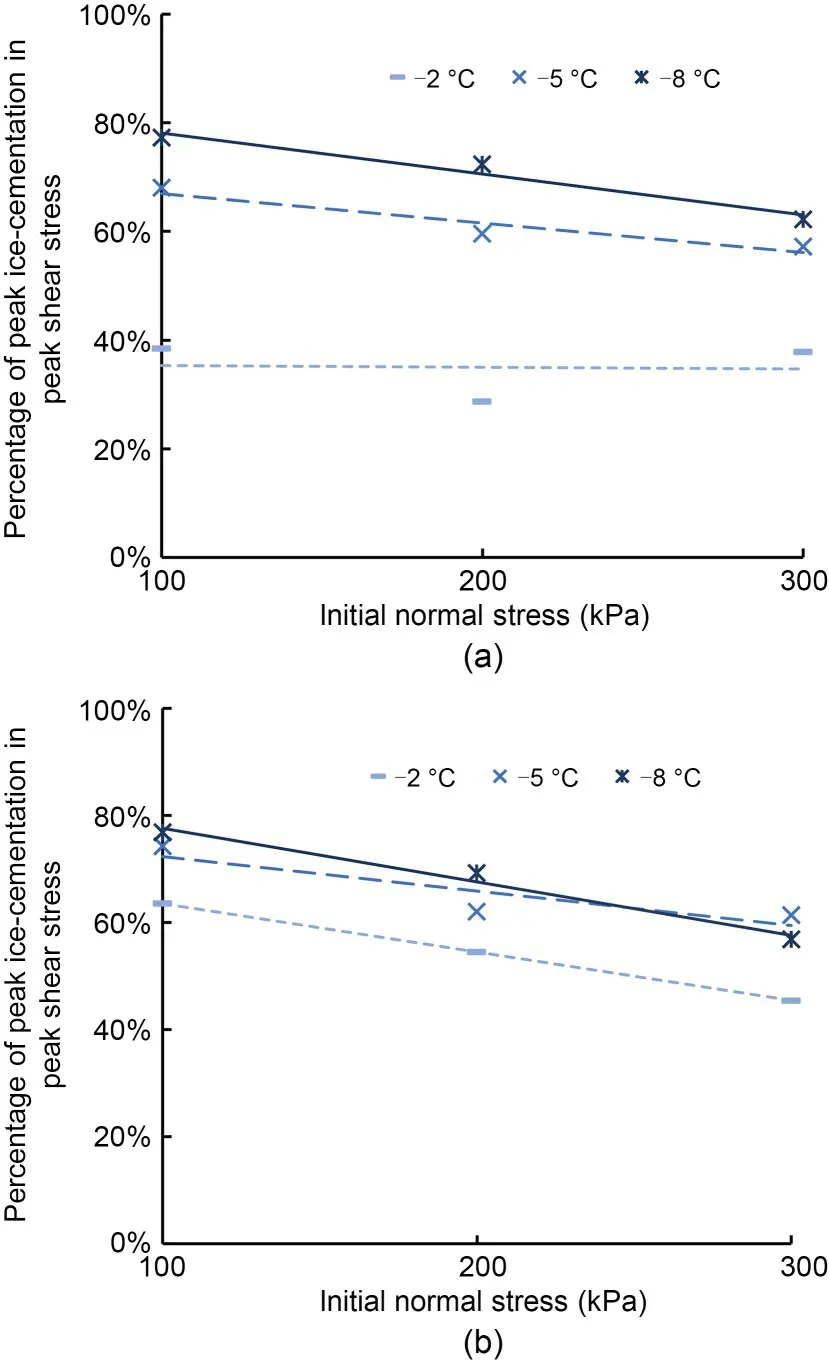
Fig.20 Peak ice-cementation of the frozen sand–concrete interface:(a)CNL;(b)CNH
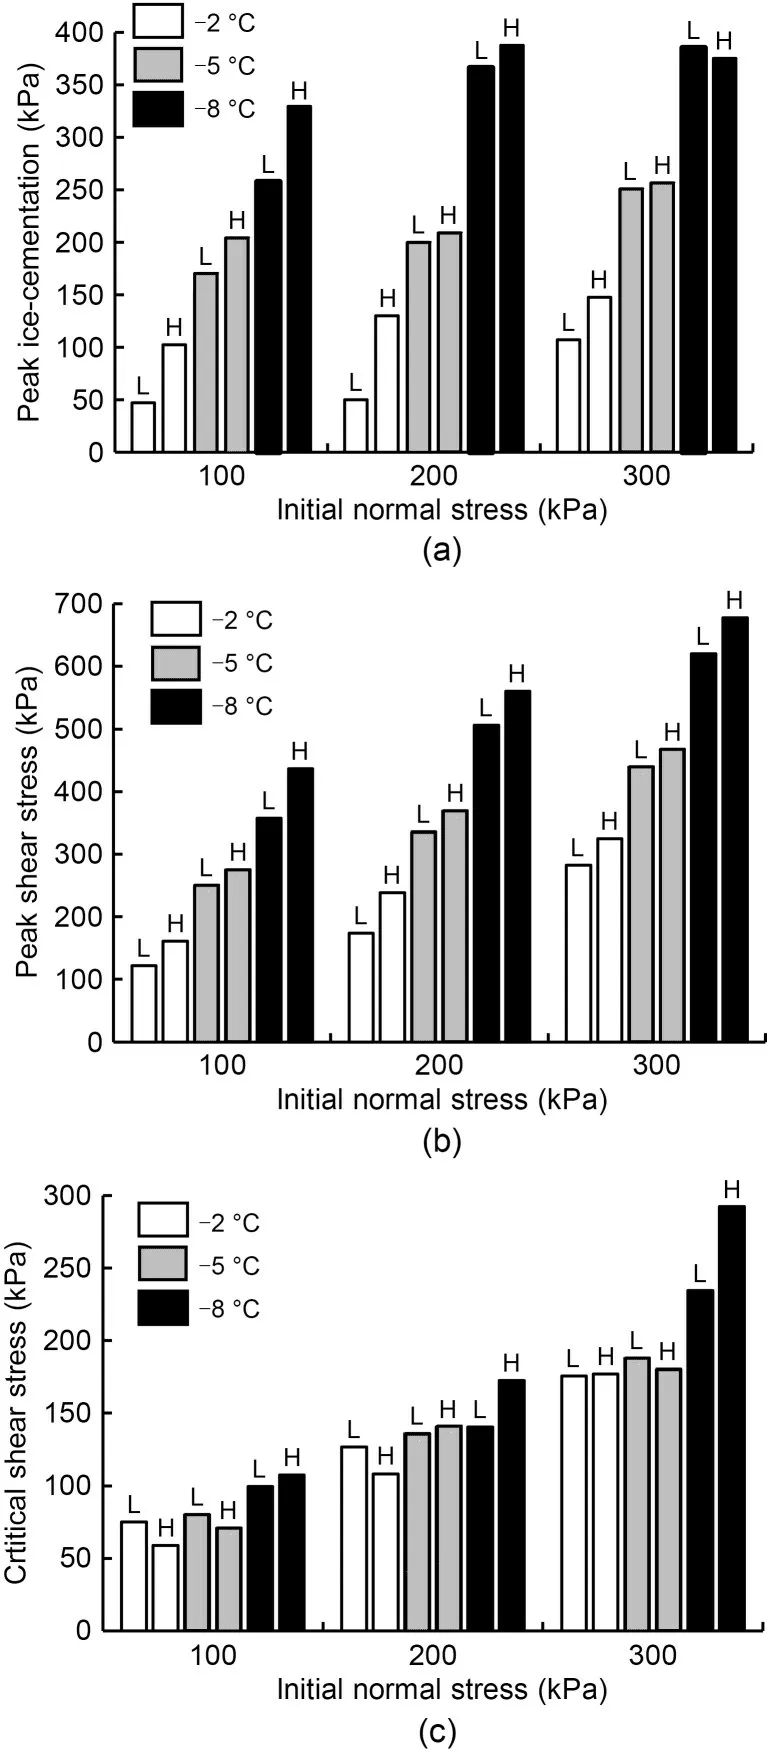
Fig.21 Comparison of shear strength under CNL(L)and CNH (H): (a) peak ice-cementation;(b) peak shear stress;(c)critical shear stress
4 Conclusions
The shear properties and influencing factors on the frozen sand–concrete interface were investigated through a series of large-scale direct shear tests at different temperatures,normal stresses,and boundary conditions(including CNL and CNH).The results can be summarised as follows:
(1)The development trends of shear stress–shear displacement under CNL and CNH were similar.The shear stress–shear displacement relationship displayed a significant softening at negative temperatures.Lower temperature and higher normal stress resulted in an increasing degree of strain softening.
(2) The normal stress–shear displacement rela‐tionship under CNH was dependent on the initial nor‐mal stress and temperature.The feature points were more apparent with higher initial normal stress and lower temperature.
(3)The elastic shear modulus showed a linear increase with decreasing temperature and increasing initial normal stress.
(4)The peak shear stress and critical shear stress showed a linearly increasing trend with increasing initial normal stress,which could be described by the Mohr-Coulomb failure criterion under CNL and CNH.The temperature had an appreciable effect on the cohesion of the peak shear stress and the friction coef‐ficient of the critical shear stress.
(5)Under CNL and CNH,the value and percent‐age of peak ice-cementation in peak shear stress increased with decreasing temperature.The value of peak ice-cementation increased with increasing initial normal stress.Nevertheless,the percentage of peak ice-cementation in peak shear stress decreased with the increase in initial normal stress.
(6) The peak shear stress and ice-cementation were higher,and the critical shear stress was lower under CNH than those under CNL.
Acknowledgments
This work is supported by the National Natural Science Foundation of China(No.41731281)and the Key Foundation of Guangdong Province(No.2020B1515120083),China.
Author contributions
Jian CHANG and Jian-kun LIU designed the research.Jian CHANG and Ya-li LI processed the corresponding data.Jian CHANG wrote the first draft of the manuscript.Ya-li LI helped to organize the manuscript.Jian CHANG revised and edited the final version.
Conflict of interest
Jian CHANG,Jian-kun LIU,and Ya-li LI declare that they have no conflict of interest.
 Journal of Zhejiang University-Science A(Applied Physics & Engineering)2022年11期
- Journal of Zhejiang University-Science A(Applied Physics & Engineering)的其它文章
- Visualizing the dynamic progression of backward erosion piping in a Hele-Shaw cell
- Evaluation of heavy roller compaction on a large-thickness layer of subgrade with full-scale field experiments
- Shaking table tests on a cantilever retaining wall with reinforced and unreinforced backfill
- Model test of the mechanism underpinning water-and-mud inrush disasters during tunnel excavation in sandstone and slate interbedded Presinian strata
- Soil effect on the bearing capacity of a double-lining structure under internal water pressure
- Influence of groundwater level changes on the seismic response of geosynthetic-reinforced soil retaining walls
