Application of remote sensing in the description of fluvial system in dryland: A case study of Golmud distributive fluvial system,Qaidam Basin, NW China
Xiang-Hui Zhang, Chang-Min Zhang, Wen-Jie Feng, Rui Zhu,Qing-Hai Xu
School of Geosciences, Yangtze University, Wuhan, 430100, Hubei Province, China
Abstract Distributive fluvial systems(DFS)are widespread in drylands in the northwestern China.Analyzing differences in fluvial morphology in drylands is beneficial for studying ancient rock records and the extraterrestrial surface environment. The remote sensing image, characterized by real-time and possibility of repeated observations,is a vital tool for recording and comparing fluvial systems in drylands.Satellite remote sensing technology is a method of investigating fluvial morphologies. Due to the limited accuracy of satellite imagery, there are few reports on the detailed description of the fluvial system in drylands of NW China. We analyze the pattern of fluvial morphology changes in the Golmud distributive fluvial system (DFS) in the Qaidam Basin,northwestern China,using satellite remote sensing and unmanned aerial vehicles(UAV).Firstly,we use Google Earth real-time image data, historical image data, and radar digital elevation data to extract geomorphological information;then the UAV remote sensing image data were used to interpret fluvial network information; finally, we use the gray-scale differential vector method to describe the fluvial morphologies.Three zones have been identified in the Golmud DFS: the proximal, the medial, and the distal, by comparing the differences in topographic and geomorphic characteristics, fluvial morphologies, and sedimentary characteristics of the Golmud DFS. The proximal slope is higher than the other two zones, and the geomorphic features are mainly gravel gobi. The proximal fluvial morphologies are mainly large braided rivers, and sediments are more gravelly and less sandy.The medial slope is relatively small,and the geomorphic features are mostly oasis plains. The medial fluvial morphologies are mainly meandering rivers associating with braided rivers, and sediments are more sandy and less gravelly. The distal slope is the lowest, and the geomorphic features are mostly oasis plains, lakes, and marsh plains. The distal fluvial morphologies are mainly meandering rivers, and sediments are sandy and muddy. Comparison of the DFS from proximal to medial to distal in Golmud confirmed the potential of remote sensing image technology in identifying the fluvial morphologies and sedimentary facies distribution in dryland.
Keywords Qaidam basin, Remote sensing, UAV, Distributive fluvial system, Fluvial morphology, Dryland fluvial systems
1. Introduction
With the continuous development of aerospace technology, the sedimentary system's morphological characteristics can be described by high-precision satellite images (Liu et al., 2021; Song et al., 2021;Yao et al., 2021). As early as 2010, Weissmann and Hartley et al. analyzed 724 continental basins in the world through satellite images and put forward the concept of the distributive fluvial system (DFS)(Hartley et al., 2010a; Sambrook Smith et al., 2010;Weissmann et al., 2010), which was defined as “a fluvial system with divergent branch channel style on the plane”.It is deemed that DFS is a common alluvial geomorphologic system that is composed of alluvial fan, fluvial fan, or giant fan and develops in the adjacent mountainous region(Weissmann et al.,2010;Zhang et al.,2020a).Although the concept of DFS has been criticized and questioned (Fielding et al., 2012;Latrubesse, 2015), it has also received attention from the academic community (Pan et al., 2019; Zhang et al., 2020a). Davidson et al. (2013) divided the DFS into 3 or 4 facies belts, after comprehensively analyzing modern DFS sedimentary environments. By studying the sedimentary characteristics of channel sand bodies in different formations, Trendell et al.(2013) recognized a total of 11 lithofacies in the channel sand bodies developed in DFS. Based on the DFS-delta viewpoint, Owen et al. (2015) showed the areal characteristics, vertical sequence and sedimentary architecture of the Morrison Formation-Salt Wash Member.The continuous in-depth study of the concept of DFS has made it possible to realize that the analysis of remote sensing images can grasp the sedimentary systems at a macro level (Zhang et al., 2017, 2019,2020b).Zani et al.(2012)proposed that the traditional Shuttle Radar Topography Mission (SRTM) has limited value in the geomorphic analysis of low-relief topography and used a series of techniques to enhance the original digital elevation model (DEM). As remote sensing can monitor and collect spatial information about playas, Li et al. (2014) analyzed the playa morphodynamics using Landsat time-series data,Bilmes and Veiga (2018) used satellite images to measure the area of DFS and the source area in the endorheic Gastre Basin of Argentina, and quantitatively analyzed the source-to-sink system.
Interestingly,remote sensing image technology has been applied not only on Earth but also on other planets. Cartwright and Burr (2017) used Synthetic Aperture Radar data of terrestrial analogs to test alluvial fan formation mechanisms on Titan. Jacobsen and Burr (2017) used Mars Orbiter Laser Altimeter data and found that the Aeolis Dorsa region of Mars preserves many ancient and topographically inverted fluvial deposits, some of which represent analogs to pre-vegetated meandering fluvial deposits on Earth.Adler et al.(2019)proposed that Hypanis was the most significant potential delta on Mars to date and used high-resolution orbital images,thermal IR images,and topographic data to assess the deposit at the terminus of Hypanis. With the continuous development of science and technology, satellite images are also widely used in sedimentology (Hartley et al., 2010b, 2017).However, these studies generally concentrated on a large scale, mainly on the sedimentary system level.There are few studies on sediments grain size, sedimentary facies belts, and fluvial type evolution using satellite images.The main difficulties may be accuracy of remote sensing image data and data acquisition.
We compared the fluvial morphological changes of the Golmud DFS through satellite images and UAV aerial photography.Firstly,we grasped the changes of the Golmud DFS fluvial morphologies as a whole through satellite image data and historical image data.Secondly, due to the insufficient accuracy of local satellite image data, we used UAV cruise photography to describe the characteristics of fluvial morphologies in detail. Finally, we interpret typical sedimentary structures through field investigations on a smaller scale. Through the exemplary description of the Golmud DFS from the overall large scale to the small local scale, this study deepens the comprehensive understanding of the sedimentary characteristics of modern DFS from macro to micro.The research can better help us observe the formation process of facies distribution in the rocks, and improves the prediction ability of facies connectivity in the development of natural resources.

Fig.1 Geographical location and geomorphic characteristics of the study area.A-B)Location of Golmud area(red rectangle)in the Qaidam Basin,northwestern China.The inset map of China(A)is modified after the Standard Map Service of the National Administration of Surveying,Mapping and Geoinformation of China(http://bzdt.ch.mnr.gov.cn/)(NO.GS(2016)1595);C)Remote sensing image characteristics of Golmud DFS; D) Gravel gobi; E) Oasis plain; F) Salt lake.
2. Study area
2.1. Geographical setting
Golmud area is a typical alluvial fan landform.It is located in the dryland in the Qaidam Basin, northwestern China (Fig. 1), in the hinterland of the Qinghai-Tibet Plateau, with Kunlun Mountains in the south and Dobsun Lake in the north(Geng et al.,2021;Lei et al., 2021) (Fig. 1A, B, 1C). Golmud is a countylevel city located in the central and western part of Qinghai Province, with an area of 119,263 km2(Rural Social and Economic Investigation Department of National Bureau of Statistics, 2021). There are plateau mountains, vast gobi, oasis, salt land, and other natural landscapes from south to north. The study area locates north of the Kunlun Mountains and south of the fine soil plain (36°10'-36°35'N,94°35'-95°11'E; Fig. 1B and C), with an altitude of 2750-3800 m, and the area of 2700 km2(Rao et al.,2021). The altitude near the Kunlun Mountains has the highest value of about 3800 m, which decreases northwards and is about 3300 m near Golmud. The mountain area shows a plateau desert landscape,with a large slope, sparse vegetation, and snow in winter(Huang et al.,2021).In the middle of the study area,it is a vast alluvial fan. From Golmud to the north, the altitude further decreases from 3300 m to about 2800 m gradually(Fig.1C).The alluvial fan plain has a slope of 6%-9% (Slope = tan(Height/Distance); the same below), with exposed gravels on the surface, as well as rare vegetations. The alluvial fan has a complete shape and clear structure. The fan top has an elevation of 3000-3100 m, dominated by the deposition of gravels (Fig. 1D). The middle fan has an elevation of 2800-3000 m, and is composed of sandy gravels.The terrain is relatively flat,which is the main part of the Oasis plain(Guo et al.,2021)(Fig.1E).The fan edge has an elevation of about 2800 m, and is composed of sandy soil and silty clay.The north of the study area evolves from fan margin to lacustrine plain.The groundwater runoff is blocked and overflowed and then converges into the fluvial to nourish the surface vegetation. Further north, along with intense evaporation,the vegetation is mainly reed(Dou et al.,2020;Yang et al.,2020)(Fig. 1F).
2.2. Climate and river discharges
Golmud belongs to the inland basin of an arid plateau, with more wind and less rain all year. Its sunshine duration is longer, and the temperature difference between day and night is larger than that ofthe coastal areas of SE China (Zhu et al., 2019; Wang et al., 2020). The large altitude difference in Golmud results in abundant rainfall in the southern mountainous area, i.e., of 145.8 mm annual average rainfall during the years 1957-1998 as recorded by the Nachitai Meteorological Station (Qiao et al., 2019).This value decreased as it approached the Dabson Lake, and was only 24.1 mm during the years 1960-1989 (Kou, 2006), where, however, the evaporation capacity was 3549.6 mm (Qi et al., 2018). According to the Golmud Meteorological Station, during the years 1956-2015,the annual average temperature in Golmud was 5.16°C, with the annual average rainfall of 42.47 mm, the annual average evaporation of 1540.95 mm,and the annual average relative humidity of 32%, respectively (Guan et al., 2018; Qiao et al.,2019) (Table 1).

Table 1 Changes of annual average temperature and rainfall in Golmud area from 1981 to 2010.T:Temperature;Tmax:Maximum temperature;Tmin:Minimum temperature.Data source:China Meteorological Science Data Center(1981-2010).
Golmud River and some other rivers are distributed in the study area. Other rivers mainly include those formed by the collection of groundwater and some artificial canals built for reservoirs(Wang et al.,2017).The Golmud River sources from the northern slope of Bayankala Mountain in the Kunlun Mountains. As it flows northwards (i.e., towards the lowlands), it converges with many other rivers(Wang et al.,2016),and passes through the Kunlun Mountains and gobi plain.After reaching near the fan edge,it is divided into east and west rivers and then flows northwards together with other rivers formed by the pooling of groundwaters. Golmud River is the second largest river in the Qaidam Basin,with a total length of 458 km and a trunk stream of 325 km.It has abundant runoff of 6.90×10⁸ m3 (annual average), with a maximum flow of 31.75 m3/s in flood season every year (Pan et al., 2015).Golmud River has a close hydraulic connection with groundwater. About 65%-70% of the river flow will infiltrate and replenish groundwater when it passes from mountain to the edge of the alluvial fan, where the latter overflows in spring water and converts into surface water again to form rivers (Zhu et al., 2015).
3. Data and methods
The geographical environment and hydrologic conditions in the Golmud area are so complicated that it is difficult to study by traditional geological investigation methods. Therefore, we conducted a systematic and comprehensive investigation through remote sensing images. The main techniques include satellite remote sensing technology and UAV remote sensing technology.
3.1. Satellite remote sensing interpretation
Before using remote sensing images to extract fluvial morphology,the first step is to acquire satellite remote sensing data,mainly from Google Earth's realtime and historical image data. The second is to process the remote sensing images of the study area.
The research used the gray-scale differential vector method to extract the image texture features,which could map out the surface characteristics of objects in the image area. For relatively uniform textures, the gray transitions of some regions and the distribution of pixels were equal or similar; while for different textures,the gray changes of some areas and the distribution of pixels have significant differences(Hu et al., 2015). The characteristics of rivers in remote sensing images are mainly distributed evenly and cover a wide range. The texture of the river part had a high degree of similarity,but the texture of the background part was completely different.Therefore,the fluvial and the background were effectively distinguished by texture. However, these preliminary inspection results were bound to contain certain errors,which include the false detection not in the water area and the false detection in the water area. We analyzed the initial test results and deleted the parts that were mis-detected, which strengthened the accuracy of the entire test results(Fig.2A).The roughly detected image will sort out morphology through the closing operation. The closing operation can fill in smaller vacancies in the object and link similar things.Therefore, this operation can smooth the object's edges without significantly changing them.The closing operation can eliminate the detection points partially missed by the fluvial in the detection results(Fig.2B).In the rough detection results, there were separate small cells similar to rivers in the background,mistakenly identified as rivers.The opening operation can be used to remove small objects and separate them at thin points while smoothing the edges of larger objects with little change in size (Fig. 2C). This operation can remove small voids in river parts.

Fig.2 Application of satellite remote sensing images in analyses of DFS in the study area.A)Preprocessed satellite remote sensing images by adjusting texture parameters, including contrast, brightness, exposure intensity and other parameters. Different objects show different colors/textures due to different reflection,absorption and transmission of different light;B)Low-level segmented remote sensing images by the closing operation,i.e.,turning off the spectrum of a certain band.Different objects are separated by turning off the spectra of different bands in RGB color mode;C)High-level processing of selection and analysis of remote sensing images by opening operation.After filtering out the spectrum of some bands, some objects show blank area, where then is filled by opening the spectrum of background color band.
3.2. UAV remote sensing interpretation
Satellite images are unable to finely describe typical phenomena, so we use high-definition photography device carried by UAV (Mancini et al., 2013;Immitzer et al.,2016),which is convenient and can get high-efficiency, and high-precision remote sensing data,therefore is widely used in various industries and fields.In this study,we use the DJI Matrice 600 Pro UAV(unladen weight of 9.5 kg, and maximum take-off weight of 15.5 kg), carrying the DJI Zenmuse X5 PTZ(Fig. 3A), which are of retractable landing gear and 360-degree panoramic shooting, respectively. The remote controller enables the user to complete various operations and configurations of aircraft and PTZ camera (optional) within a maximum communication distance of 5 km. It has industry-leading multiple security guarantees and advanced intelligent flight functions. It meets the feasibility of investigation in dryland. Zenmuse X5 PTZ camera adopts the latest generation M4/3 sensor and is compatible with eight professional lenses (including two zoom lenses).The focal segment covers 9-45 mm (the equivalent focal length of the 35 mm frame is 18-90 mm).It can change specific lenses for different shooting scenes to obtain rich visual effects,meeting the requirements of securing high-precision photo information during field investigation (Fig. 3A). When the feasibility and accuracy of the equipment meet the criteria, the primary flight altitude needs to be selected to balance the working efficiency and the precision necessary for geological interpretation.After test flight at altitudes of 25 m, 50 m, and 200 m respectively, to collect images,the primary flight altitude was selected as 200 m.While for difficult areas, the flight altitude is 50 m,where the resolution of collected images reached 6-7 cm, and meets the accuracy requirements of geological interpretation (Fig. 3B and C). The highest resolution of commercial satellite and aerial remote sensing can only reach decimeter level.With the help of UAV cruise photography,it can make up for the lack of satellite image accuracy.

Fig. 3 Application of UAV remote sensing in the study area. A) UAV and related information acquisition equipment; B) 50 m high UAV orthophoto interpretation map; C) Tone harmonic processing of UAV orthophoto interpretation map of B.

Fig.4 DFS zoning and topographic characteristics of Golmud area.A)Radar digital elevation image of the study area; B)Variation trend of source elevation; C) Variation trend of vertical elevation.
4. Depositional characteristics and facies distribution of Golmud DFS
The study area mainly includes three colors according to radar digital elevation data analysis. The source area is yellow, the transition area from the source to the sedimentary area is green, and the sedimentary area is blue (Fig. 4A). On the satellite image map, the landform also has noticeable regional differences. The proximal is gravelly gobi, the medial and the distal are mainly oasis plain,and the toe is salt marsh(Fig.1C).Combined with radar digital elevation data and satellite image data, the Golmud DFS is divided into three regions: the proximal, the medial,and the distal along the apex, with their dividing boundaries also corresponding to the surface contour lines of 2800 m and 2700 m, respectively (Fig. 4A).
In the whole DFS, there is an apparent difference between the altitude along the source and the altitude cutting the source (Fig. 4B and C). Along the source,the altitude decreases as the distance increases,showing an obvious concave shape, while the slope decreases accordingly(Fig.4B).Comparatively,at the section cutting the source, the curve between the distance and the altitude shows an obvious convex shape,with the west(d in Fig.4C)higher than the east(c in Fig.4C).Overall,there are significant differences in fluvial morphological characteristics and sedimentary characteristics in each zone, in addition to geomorphic characteristics and slope differences.
4.1. Morphological and sedimentary characteristics of the proximal
The proximal of the Golmud DFS is located within 20 km off the apex, accounting for 8.3% of the total area, which is a small part of the three regions(Fig. 4A). It is gravelly gobi with a slope of 1.2%(Fig.4B).The proximal fluvial is mainly a large braided river with an average channel width of about 400-600 m in the 30-m-precision satellite image(Fig.5).The upper fluvial at the proximal is restricted to a narrow and long incision valley(Fig.5A and B),and is 70 m wide at the narrowest point. Close to the mountain pass,the slope is steep,and the water flow is fast, with a few small crevasse fan formed by fluvial crevasse (Fig. 5C). Continuing down the apex, the fluvial frees itself from the control of the incision valley and appears as a wide single braided river(Fig.5D).In addition,the blurred temporary river can be observed in the satellite image through RGB toning and harmonizing processing(Fig.5F).Due to the gentle slope, frequent bifurcations, and infiltrations in the lower proximal part,it appears as a bifurcated braided river on the remote sensing image (Fig. 5E).

Fig. 5 The proximal morphological characteristics of the Golmud DFS. A) Evolution trend of the proximal of the Golmud DFS; B) An incised valley is observed near the apex; C) Crevasse fan; D) Single braided river; E) Bifurcated braided river; F) Temporary river.
The incised valley with a depth of more than ten meters provides convenience for the observation and anatomy of sedimentary characteristics of the proximal (Fig. 6 and C). Observation point 1 (location-1 in Fig. 6) is at 36°17'34.86''N, 94°46'52.87''E, about 11 km away from the apex (Fig. 6A and B). Gravel deposits with less sandy content dominate the entire section. It shows obvious periodicity in the vertical profile (Fig. 6A), which divides the profile into five intervals according to the lithological characteristics and sedimentary structures recorded by UAV highresolution images (Fig. 6A). Intervals 1, 3, and 5 are mainly composed of bedding gravel deposits with less sand content. In interval 4, the sandy content significantly increases, and some thin fine sandy bands can be observed.In interval 2,an obvious progradation can observed (Fig. 6A), from which it is inferred that the proximal hydrodynamic force increased along with the slope of the propulsion.
There is an obvious spring line near the proximal and medial boundary from the satellite images(Fig.7).There are apparent color differences on both sides of the spring line. The proximal near the apex is in light color,mainly with gray tones;while on the other side,it is predominantly dark brown(Fig.7A).There are also apparent differences in sand content between the upstream and downstream of the spring line (Fig. 7B and C). The upstream water is turbid with high sediment content(Fig.7C);while the downstream water is clear with low sediment content (Fig. 7C). The spring line is particularly developed near 2800 m altitude contour lines. The spring water from the spring line normally forms a spring river,and multiple spring rivers converge to create a wide fluvial belt(Figs.4A and 7A).

Fig.6 Sedimentary characteristics at the proximal of the Golmud DFS.A)A UAV high-resolution image of the incised valley,showing obvious periodicity of sedimentary characteristics changes(five intervals being divided as marked in the figure);B)A satellite remote sensing image showing the observation points location; C) UAV orthophoto interpretation map of the incised valley.
4.2. Morphological and sedimentary characteristics of the medial
The medial of the Golmud DFS is located within the range of 20-55 km away from the apex,accounting for 38.2% of the total area (Fig. 4A). The landform features of this zone are oasis plains with a slope of 0.3%(Fig.4B).The medial is mainly meandering rivers from satellite images (Fig. 8), which is about 100-200 m wide on average,and about 5 m wide for the narrowest channel (Fig. 8). Along the spring line (Fig. 8A), it is clearly observed that the braided river descending from the proximal turns into a meandering river because of the small slope and flat surface in the medial (Fig. 8C, D, 8E). Except for the main channel(Golmud River), which obviously extends, others are mainly confluent from spring rivers in the remote sensing images(Fig.8A and B).The spring rivers form a lobe (Fig. 8F), and similar lobes are developed downstream(Fig.8G and H).These continuous spring rivers are in black color,while the warm yellow part is mainly flood plain on the processed high-contrast remote sensing images (Fig. 8F). Down the contiguous spring rivers, with further bifurcation and infiltration of the DFS (Fig. 8G), the outline of the fluvial gradually becomes clear, and the obvious meandering river shape can be observed (Fig. 8H).
Compared to the proximal, the medial has no deeply-incised valley, and lacks well-exposed geological sections. It is mainly characterized by modern fluvial characteristics and shallow-water sediments(Fig. 9). Observation point 2 (location-2 in Figs. 6, 9A and 9D) is located at 36°28'49.21''N, 94°53'37.27''E,about 34 km away from the apex (Fig. 9). There are two other observation points of modern fluvial morphology near this location (Angle 1 and Angle 2 in Fig.9C),where the big difference between the medial spring river and the upstream braided river is observed.The braided river has turbulent flow,turbid water, and carries a large amount of sediments(Fig. 9B); while the spring river flows smoothly with clear water, and carries a small amount of sediments(Fig. 9C). On a modern sedimentary profile in the medial(Fig.9D),it is seen that the profile is dominated by sandy and muddy sediments with little gravel content. It also shows a vertical change of sediments. In the high-definition video recording, small troughshaped abandoned rivers can also be observed(Fig. 9D).
On the satellite images, the medial and the distal show clear different tones (Fig. 10A), with the boundary almost consistent with the 2700 m elevation contour(Figs.4A and 10A).Above 2700 m,the medial shows a bright tone which appears gray on the RGB tone harmonic diagram. It distributes less fluvial,which appears as a meandering river(Fig.10B).Below 2700 m, the distal shows a dark tone which is nearly black on the RGB tone harmonic diagram.It has gentle surface slope, which blocks water flow, and results in significantly increased fluvial density (Fig. 10C).Compared with the proximal, the medial has a wide floodplain. Due to branching and infiltration, some rivers dried up in dry seasons and showed temporary channel deposition, which often formed abandoned lobes.These abandoned lobes indicate that they were formed during different periods compared to the present rivers. In the open and flat area of the medial,groundwater seepages are very developed, which converge to form a spring river in some areas.
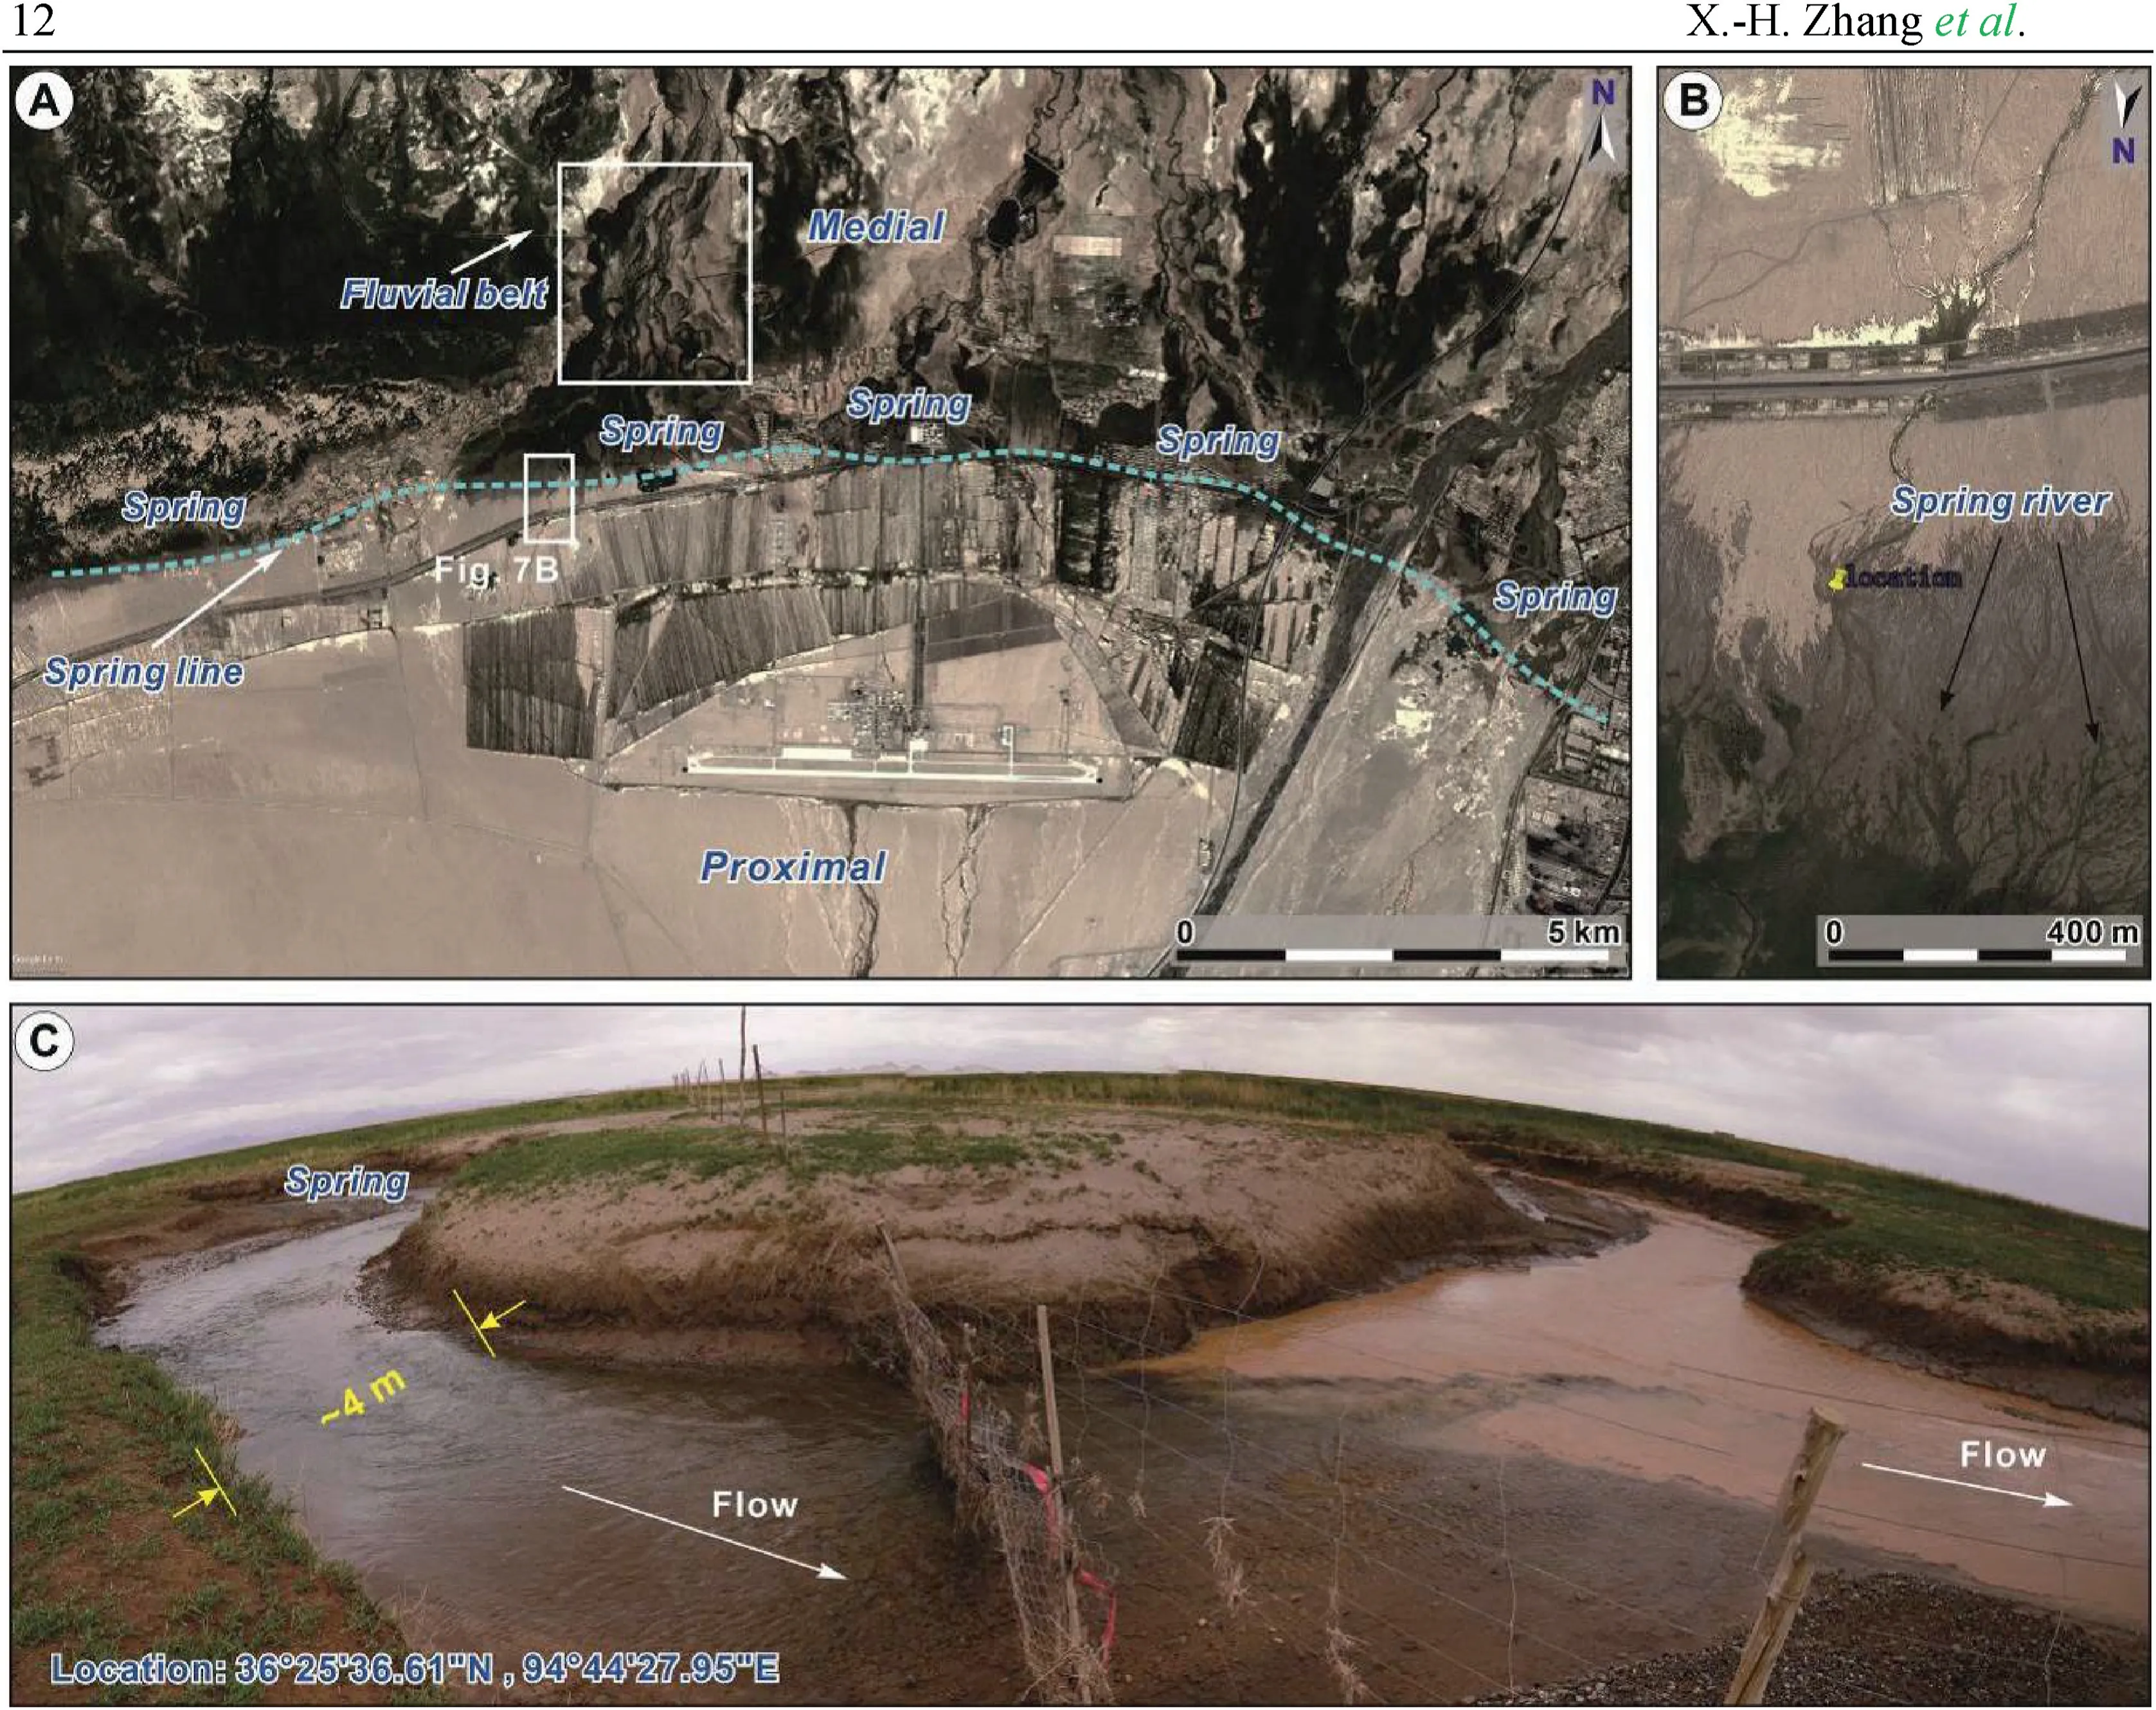
Fig. 7 Determination of the boundary between the proximal and the medial of Golmud DFS. A) Division of the boundary on the remote sensing image, taking the spring line as the boundary; B) High-resolution satellite remote sensing image near the spring line; C) Apparent difference in sediment content between spring river and upstream along the river (location marked in B).
4.3. Morphological and sedimentary characteristics of the distal
The distal of the Golmud DFS is located 55 km away from the apex until it enters the lake,and accounts for 53.3% of the total fan area (Fig. 4A). It has complex topography, and is especially developed with swamps and some small ponds.The slope is particularly gentle at 0.05% (Fig. 4B). The satellite image shows that the distal is mainly a meandering river of 50-100 m wide on average(Fig.11).Near the 2700 m contour line,the fluvial bifurcation is severely downwards and is in the shape of lobes (Fig. 11). Compared with the medial,the distal developed a dense fluvial network,with the fluvial distributed in strips on lobes as seen on the RGB tone harmonic diagram(Fig.11A,B,11C).At the toe,a few narrow terminal rivers enter the lake. The salt ground near the lake shoreline shows fluvially scoured grooves (Fig. 11D).
Using historical satellite images, the evolution of sedimentary system is observed by comparing the changes in fluvial morphology in the same area at different times. In the historical satellite images, it clearly shows that the lobes in the distal keep changing with lake shoreline(Fig.12).In March 2004,the lobe extended far into the lake as a leaf along the lake shoreline (Fig. 12A). In July 2011, as the lake level rose, some of the lobes that entered the lake in the early stage were submerged by the lake water (Fig. 12B). In September 2012 and January 2013, all the early-stage lobes entering the lake were submerged (Fig. 12C and D); however, in September 2012, with different colors between the salt base and the background, obvious small underwater distributary channels can be observed(Fig. 12C). Compared with the proximal and medial zones (Figs. 5 and 8), the distal mainly develops landform features such as swamps and small ponds,making it difficult for road conditions to pass. Due to the difficulty of field investigation, the sedimentary characteristics in the distal were predicted by using the proximal and medial zones as references (Figs. 6 and 9). Combined with the continuity of the sedimentary system, the sediments in the distal should be finer in grain size, mainly sandy.
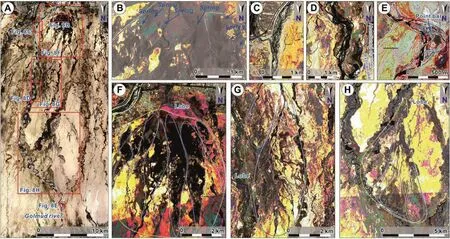
Fig.8 River morphological characteristics in the medial of Golmud DFS.A)Evolution trend of fluvial morphology in the medial;B)The medial is close to the spring line,which is mainly represented by spring rivers;C)Braided river;D)Transition from braided river to meandering river;E) Meandering river; F) Spring river lobe; G) Bifurcated braided river lobe; H) Meandering river lobe.
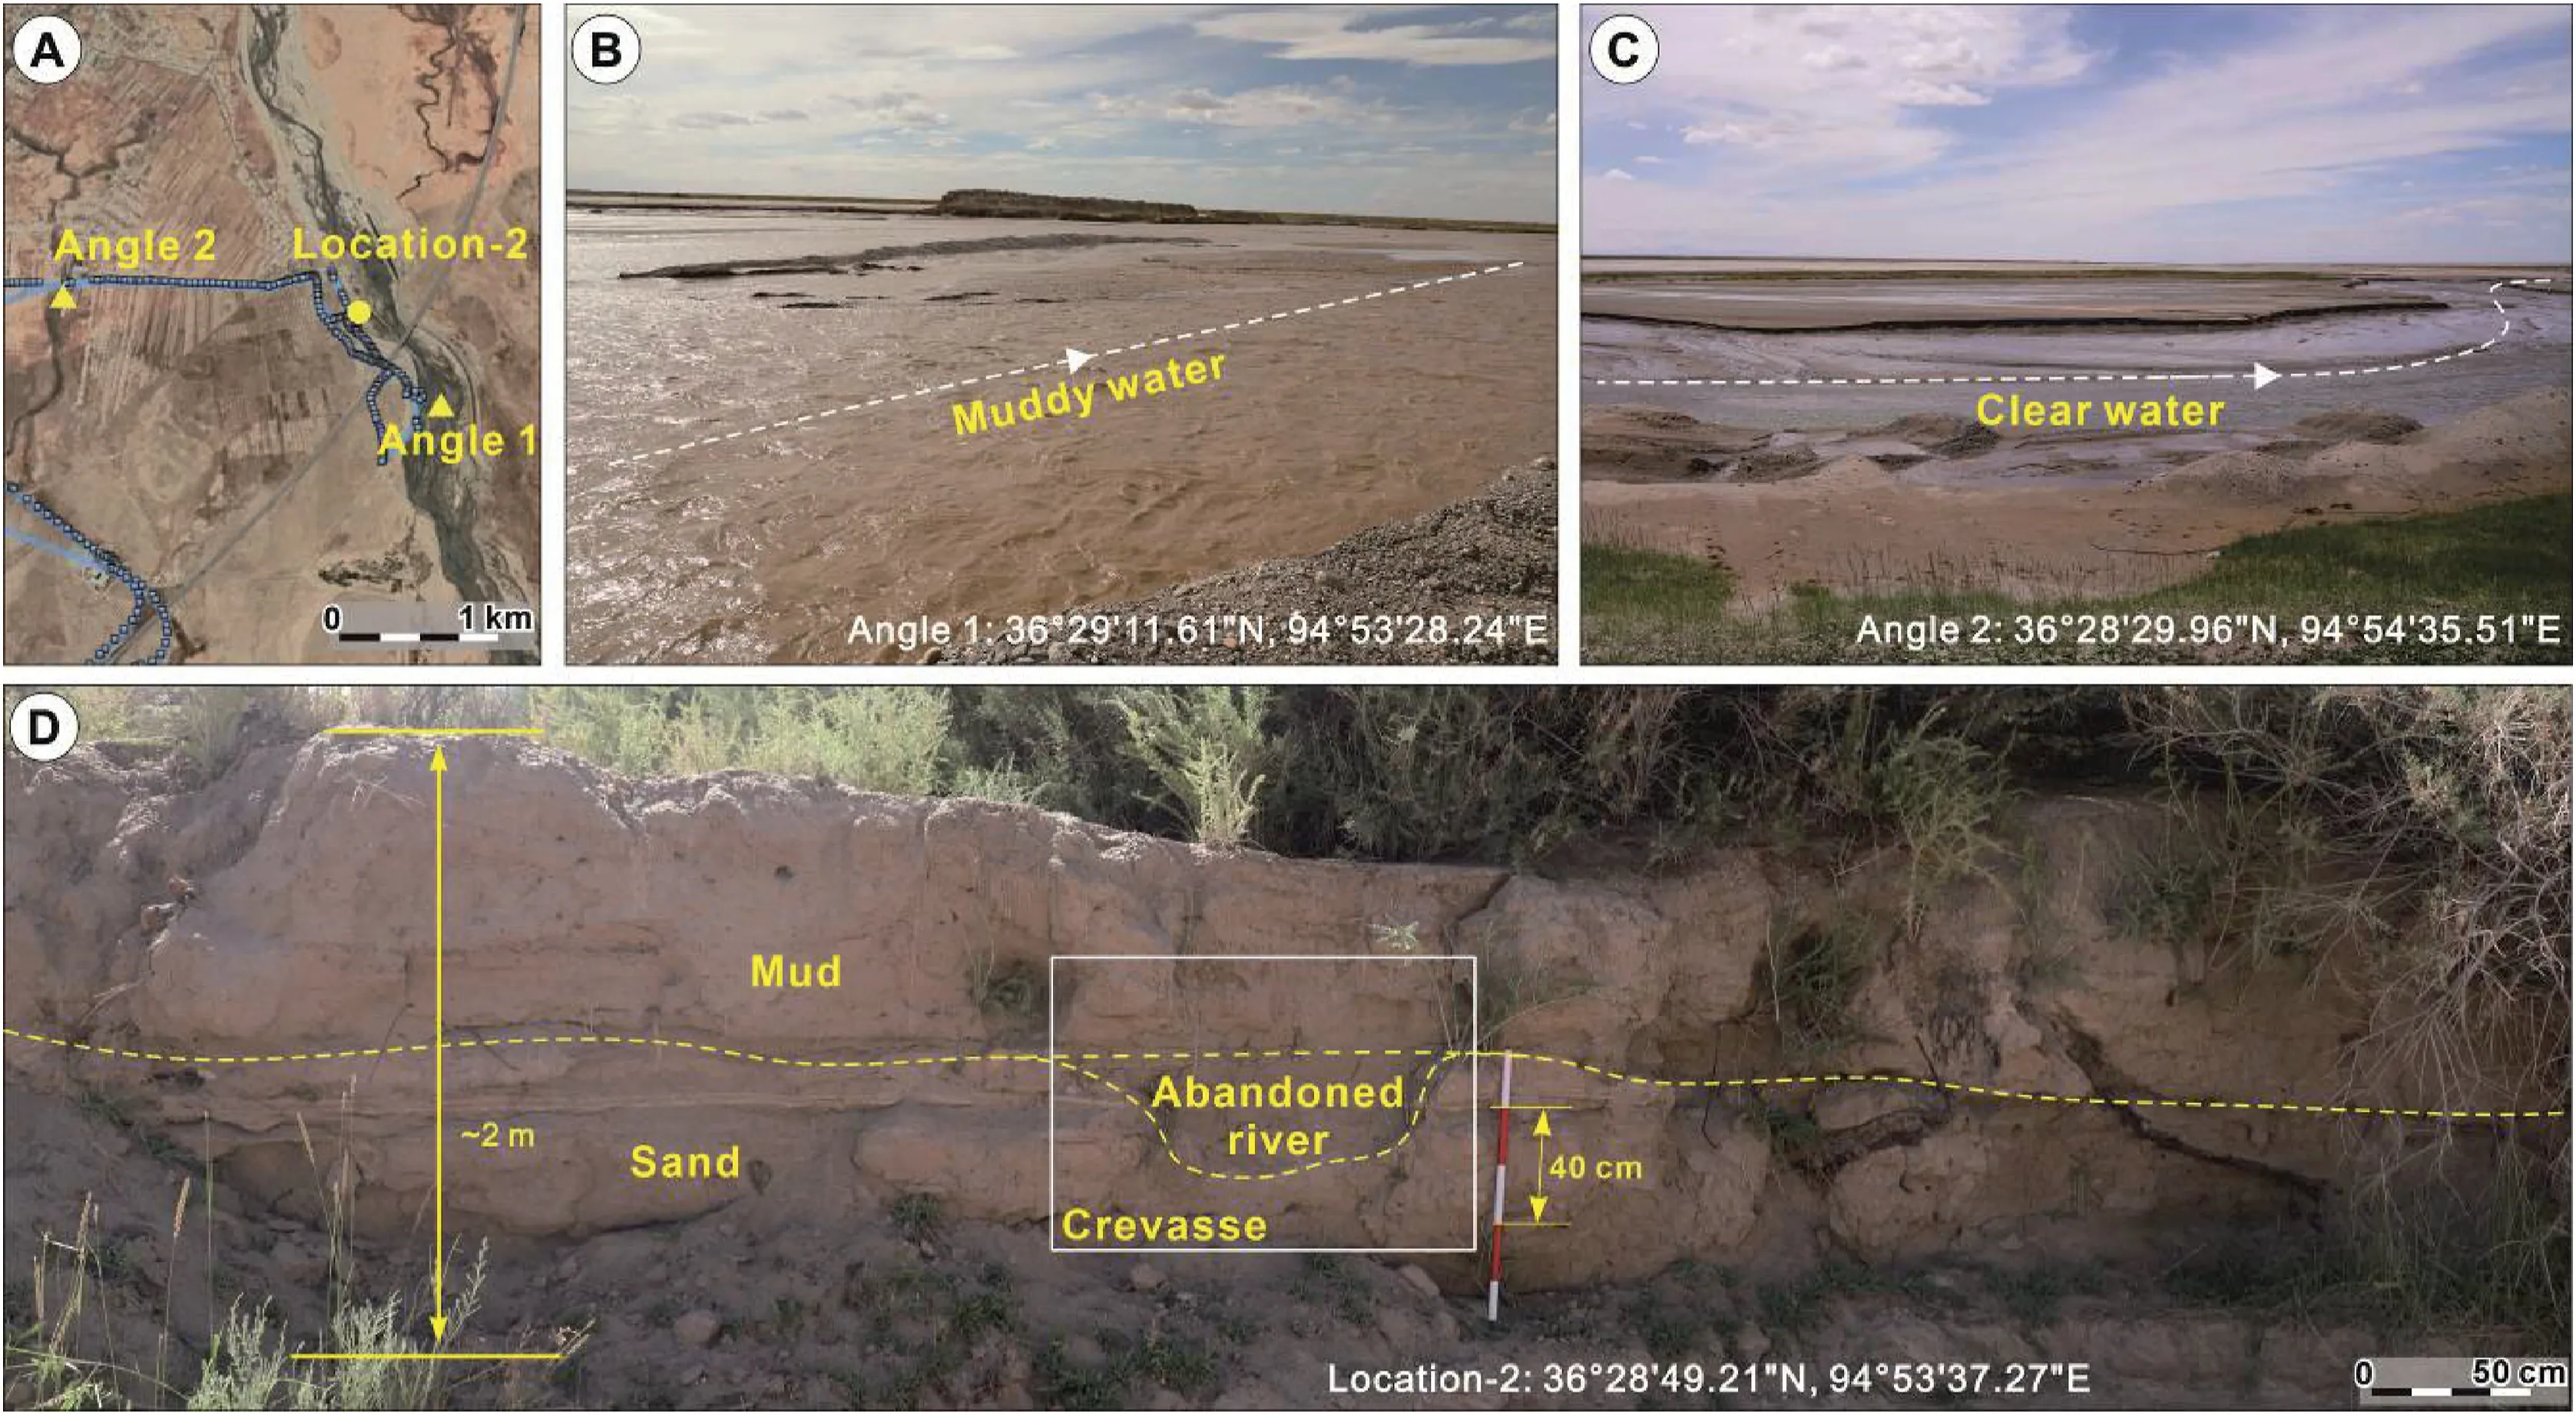
Fig.9 Sedimentary characteristics in the medial of Golmud DFS.A)Map of the location points in the medial;B)Braided river extended from the upstream carries a large amount of sediments and shows turbid waterbody;C)Spring river carries a small amount of sediments and shows clear waterbody; D) The profile is mainly sandy and muddy sediments with small crevasse.
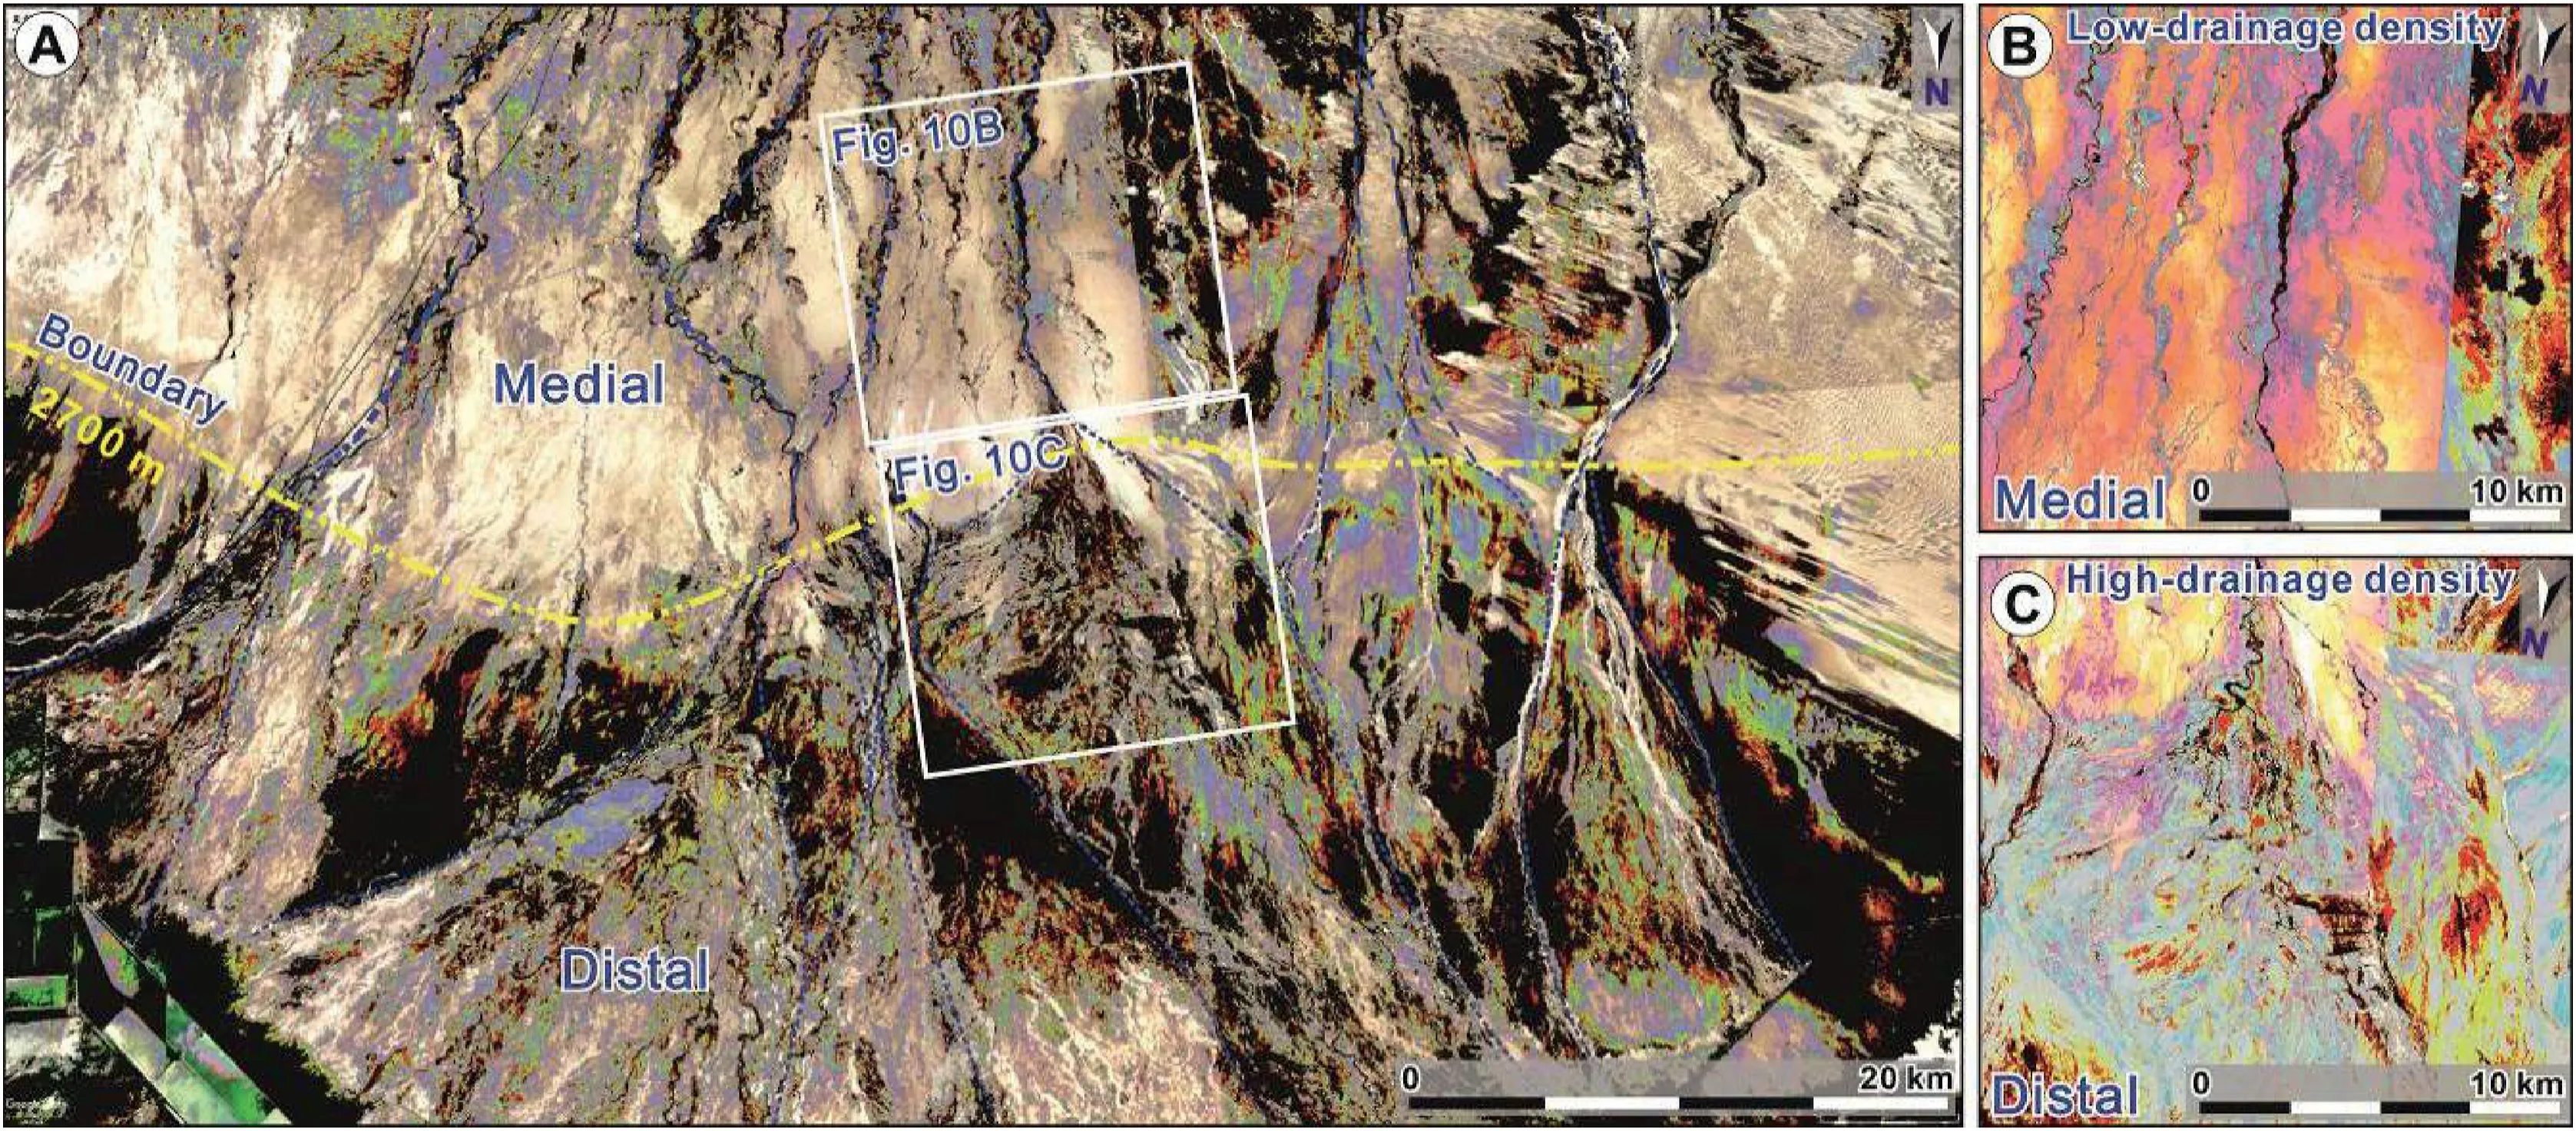
Fig.10 Boundary between the medial and the distal of Golmud DFS.A)The remote sensing image divides the boundary by depicting the river network density; B) The medial is located above the boundary, with low river network density;C) The distal is located below the boundary,with significantly-increased river network density.

Fig.11 Morphological characteristics of the river at the distal of Golmud DFS.A)The fluvial at the distal continues to bifurcate and radiate;B) Abandoned channel belt; C) Active channel belt; D) The terminal channels enter the lake.

Fig. 12 Determination of the distal boundary of Golmud DFS. A-D) Evolution trend of the distal boundary with the lake level in different time periods at the same location.
5. Discussion
5.1. Description of sedimentary system by using satellite remote sensing data
DFS mainly emphasizes the integrity of the continental sedimentary basin system and the relationship among each part. The study of DFS divides the sedimentary system of the continental basin into three types: DFS, axial system, and terminal system(Davidson et al.,2013;Weissmann et al.,2015;Zhang et al.,2021).The axial system includes the axial fluvial system and intersection between DFS. The terminal system includes aeolian, lake, and salt lake sedimentary areas. The theory of DFS holds that from alluvial fan to braided river,meandering river,and flood plain,it is a continuous sedimentary change within the same system, rather than the simple connection between multiple sedimentary systems (Zhang et al., 2020a).The complexity of field environment,e.g.,in this study area, especially near the foot of the high-altitude Kunlun Mountain, makes it difficult for using traditional field investigation methods to meet study needs.In addition,due to the large scope of the depositional system, it is difficult to achieve a characterization of the entire system based on the results of a single-point investigation. Comparatively, the satellite remote sensing images can describe the sedimentary system as a whole. It can be completed indoors, with strong operability and realizability. In addition, satellite images can be saved and played back,which is conducive to studying the evolution of the river system (Buehler et al., 2011; Immitzer et al., 2012). For example,Buehler et al. (2011) used historical images and other data to observe the temporal and spatial evolution of the Taquari rift in the Taquari River. Combining these superior performances of satellite images,in the study area of the Golmud DFS,by comparing the differences of remote sensing images of different wavebands, we can then characterize the terrestrial units (Fig. 13).
Eight sedimentary system units were described using radar digital elevation data and comparing the difference in reflectance spectra of different geological units(Fig.13A).On the vertical elevation profiles cutting the eight sedimentary system units, each sedimentary body's boundaries were identified by comparing the differences in elevation (Fig. 13B). In addition, channels on the satellite image are mainly shown as incised valleys, which respectively are Gayaha River, Hayanx River, and Golmud River in the sedimentary system units 4, 5, and 7 (Fig. 13B). The locations of incised valleys are also portrayed on the elevation map (Figs.5A and 13B).
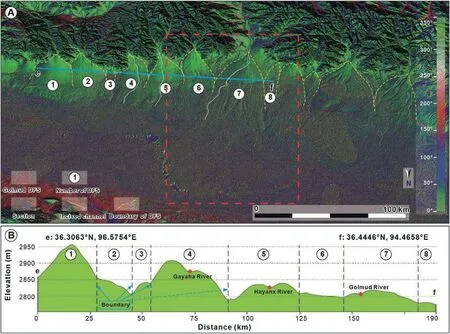
Fig. 13 Depiction of sedimentary system boundary in Qaidam Basin using radar digital elevation image. A) Distribution pattern of DFS on remote sensing images (using slope direction shader to deal with radar digital elevation data); B) Using the change trend of elevation to determine the boundary of sedimentary systems. There are three obvious incised channels: Gayaha River, Hayanx River, and Golmud River.
5.2. UAV remote sensing characterization of sedimentary system characteristics
DFS mainly emphasizes the influence of fluvial action when interpreting a single classical sedimentary system. The change mechanism from the apex to the end of the channel is revealed by studying the change discipline of crevasse,bifurcation,and incision(Zhang et al., 2017, 2020a). Depositional systems are characterized at large scales by satellite remote sensing images; however, it isn't easy to perform detailed description on a small scale due to the accuracy. For example, Zhu (2010) believed that atmospheric correction, as an important part of remote sensing data preprocessing, can restrict the quantitative application of satellite image data.Song and Liu(2021)found that only multispectral and hyperspectral data are available in the passive optical remote sensing data. Although available spectral data can provide spectral information on the surface of an object, it cannot separate objects with similar spectra but different structures. These motivations make us pay attention to the importance of UAV remote sensing in characterizing small-scale sedimentary features. First of all, UAV remote sensing is equipped with information acquisition sensors by UAV, which is simple to operate and easy to use (D'Oleire-Oltmanns et al.,2012; Harwin and Lucieer, 2012). In addition, UAV remote sensing improves the accuracy of research in portraying fluvial systems in dryland (Fig.14).
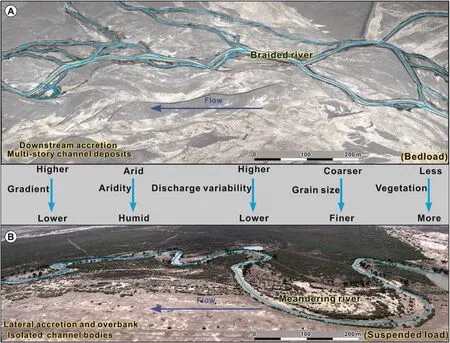
Fig. 14 Interpretation of river type change using UAV remote sensing data. A) Characteristics of braided river; B) Characteristics of meandering river.
In addition to the typical fluvial pattern changes observed in satellite images, the UAV orthographic interpretation map can compare the differences in internal geomorphic features in more detail.At the top of Golmud DFS, the braided river has a higher gradient than the distal meandering river (Fig. 14A). The upper part is relatively arid in terms of surface water content.The lower part is relatively humid. Therefore, the upper part is of less vegetation coverage and is mainly gobi on the geomorphic characteristics from the UAV orthographic interpretation map (Fig. 14A). The lower part is of high vegetation coverage,which is manifested as an oasis plain.In addition,in the cruise photography of each observation point, the proximal braided river sediments are coarser and mainly gravel (Figs. 1D and 14A). While in the medial to distal meandering river section, the deposits are finer (Figs. 9D and 14B) and mainly sand (Fig. 14B). Through a systematic investigation from the apex to the toe of the Golmud River,grain size of sediments in traditional braided river is coarser than that in the meandering river,i.e.,it shows a decreasing trend within the same system.
6. Conclusions
We used the real-time images from Google Earth to describe the geomorphic features and the historical images to explain the lobes evolution of the Golmud DFS. The topography of the Golmud DFS is characterized by radar digital elevation data,including slope and surface elevation changes. In addition to the overall grasp of the depositional systems by remote sensing images, UAV was used to give a fine interpretation of each facies in the depositional system,mainly including river morphologies and sedimentary characteristics.
The slope of Golmud DFS gradually decreases from the proximal to the distal.Influenced by branching and infiltration, the channel width gradually decreases,and the flood plain width increases. The landform features are characterized by gravely gobi desert in the proximal,oasis in the medial,and oasis,lake,and marsh plains in the distal,respectively.
The fluvial morphologies of Golmud DFS vary significantly in different zones. Near the top of the proximal, it is a deeply incised valley controlled by topography on both sides; and near the spring line of the proximal,it is mainly a highly braided river.Below the spring line in the medial to the distal, it transfers from braided river to meandering river, and is dominated by meandering rivers in the distal. Sediment is mainly gravel with coarser grains in the proximal;while below the spring line, the gravel components reduced, and it is mainly sand and clay, with finer sediment grains.
Funding
This work was supported by the National Natural Science Foundation of China (NO.41772094,42130813).
Author contributions
XHZ drafted the manuscript and was responsible for the field study and analysis. CMZ deeply contributed to improving the quality of this manuscript. QHX and WJF provided some of the data and gave relevant technical support. All of the authors contributed to editing and reviewing the manuscript.All authors read and approved the final manuscript.
Conflicts of interest
The authors declare that they have no conflict of interest.
Acknowledgements
XHZ would like to thank the fieldwork sponsors the National Natural Science Foundation,and the School of Geosciences, Yangtze University. At the same time,XHZ also thanked the anonymous reviewers for their comments and suggestions, as well as the help of the editors.
Abbreviations
DEM Digital elevation model
DFS Distributive fluvial systems
IR Infrared rays
SRTM Shuttle Radar Topography Mission
UAV Unmanned aerial vehicles
 Journal of Palaeogeography2022年4期
- Journal of Palaeogeography的其它文章
- Genesis and mechanisms of organic matter enrichment of the Hongshuizhuang Formation in the Zhoukoudian area of Jingxi sag, North China
- Scales in the Early Cretaceous bird Gansus from China provide evidence on the evolution of avian scales
- A new oospecies of Shixingoolithus(Shixingoolithus qianshanensis oosp. nov.)from the Qianshan Basin, Anhui Province, East China
- Sedimentology and foraminiferal paleoecology of the exposed Oligocene-Miocene Ogwashi-Asaba Formation in Issele-Uku area, Anambra Basin, southern Nigeria: A paleoenvironmental reconstruction
- Mid-Cretaceous Hainan back-arc basin: record of the sustained extension of South China margin
- The control of Pleistocene palaeogeography on the distribution of sandy patches in a silty Holocene lagoon (central Netherlands)
