Comparison of 24×20 mm2 swept-source OCTA and fluorescein angiography for the evaluation of lesions in diabetic retinopathy
Qiao-Zhu Zeng, Si-Ying Li, Yu-Ou Yao, En-Zhong Jin, Jin-Feng Qu, Ming-Wei Zhao
1Department of Ophthalmology, Eye Diseases and Optometry Institute, Peking University People’s Hospital, Beijing 100044,China
2Beijing Key Laboratory of Diagnosis and Therapy of Retinal and Choroid Diseases, College of Optometry, Peking University Health Science Center, Beijing 100044, China
Abstract
● KEYWORDS: ultra-widefield swept-source optical coherence tomography angiography; fluorescein angiography;comparison; diabetic retinopathy
INTRODUCTION
Diabetic retinopathy (DR) is the second most common microvascular complication of diabetes and the main cause of preventable blindness in working-aged adults from 20 to 74 years old[1]. Reliable identification of vascular abnormalities promotes early intervention of DR and helps avoid visual impairment.
Fluorescein angiography (FA) has been the gold standard imaging technique for the evaluation of DR for 50y.However, it is invasive, time-consuming and relatively expensive. It may also cause several side effects, including nausea, vomiting, and even anaphylaxis. In addition, an inherent limitation of the technique is the leakage of dye from pathologic vessels, which could mask the underlying fluorescence.
Optical coherence tomography angiography (OCTA) can depict retinal and choroidal microvasculature abnormalities in DR with highly detailed depth-resolved visualization. It is a quantitative, noninvasive, and dye-free technique that allows for the imaging of different layers without obscuration by dye leakage[2-3]. We have been investigating swept-source OCTA (SS-OCTA) extensively since its first report in 2006[4].
The wavelength of infrared light is longer than that of the spectral domain OCT, bringing faster scans and increased tissue penetration[5]. With the advent of widefield sweptsource OCTA (WF SS-OCTA), the field of view (FOV) has significantly increased to 50°-80° of the retina surface.
An ultra-widefield SS-OCTA device is available from TowardPi Medical Technology (TowardPi Medical Technology Co., Ltd, Beijing, China): BM400K. It is a 400 kHz SS-OCTA instrument that uses a laser at a central wavelength of 1060 nm with a bandwidth of 100 nm and FOV of 81°×68°, which may potentially change the paradigm of diagnosis and follow-up of DR based on FA.
To date, there have been limited studies comparing SS-OCTA,especially ultra-widefield SS-OCTA with FA, for the evaluation of DR lesions[5-10], such as the foveal avascular zone (FAZ),nonperfusion area (NPA), microaneurysms (MAs), intraretinal microvascular abnormalities (IRMAs), and neovascularization(NV). Therefore, we aimed to compare ultra-widefield SSOCTA with traditional FA for detecting DR lesions and to explore the substitution possibility of ultra-widefield SS-OCTA for FA.
SUBJECTS AND METHODS
Ethical ApprovalThis study was approved by the Institutional Review Board of Peking University People’s Hospital, and informed consent was obtained from all subjects.All procedures adhered to the tenets of the Declaration of Helsinki.
PatientsThis prospective, observational study was conducted at Peking University People’s Hospital from September 1,2021, until December 31, 2021. Patients with treatment-naïve DR were consecutively recruited. Age and gender matched healthy controls were also incorporated.
Inclusion criteria were patients aged 18 years or more with type 1 or 2 diabetes who were clinically diagnosed with DR. Exclusion criteria included eyes with significant media opacities, other chorioretinal diseases that could impact imaging of the retinal vasculature (e.g., central serous retinopathy, retinal vein occlusions, myopic degeneration,history of glaucoma or uveitis, presence of an epiretinal membrane, or vitreomacular traction syndrome); or history of treatments [e.g., intravitreal therapy with anti-vascular endothelial growth factor (anti-VEGF) or steroids, macular laser treatment, panretinal photocoagulation; pars plana vitrectomy,etc.]; signal strength index of SS-OCTA<7; or images with severe artifacts preventing accurate analysis. DR was graded according to the International Clinical Diabetic Retinopathy Disease Severity Scale[11].
All included patients underwent a full ophthalmic examination,including measurement of best corrected distance visual acuity(BCVA), intraocular pressure (IOP), slit lamp examination, and indirect ophthalmoscopy. Data on baseline demographics (sex,age, type of diabetes, diabetes duration, glycated hemoglobin,etc.) and current ophthalmologic examination findings were collected.
Image AcquisitionPatients were imaged with a 400 kHz SSOCTA instrument (BM400K, TowardPi Medical Technology Co., Ltd, Beijing, China) that uses a laser at a central wavelength of 1060 nm with a bandwidth of 100 nm. Images of 24×20 mm2areas were obtained. Vascular layers were autosegmented using the built-in software. We carefully verified the accuracy of automatic segmentation with B-scans. The slab used for comparison with FA was the superficial capillary plexus (SCP) slab, which is between the inner limiting membrane (ILM) and 9 μm above the inner plexiform layer(IPL).
Color fundus photographs (CFP) and FA imaging were performed using an Optos 200Tx (Optos plc, Dunfermline,United Kingdom). Early-phase FA images captured at 30-45s with high quality were acquired for analysis. SS-OCTA and FA was performed the same day.
Image Processing and AnalysisEn face SCP SS-OCTA images and representative FA images were exported in PNG and TIF formats, respectively. They were aligned using Photoshop CS6 (version 13.0.0.0, Adobe, San Jose, CA,USA). Three user-specified landmarks on both modalities were accurately matched by translation, rotation, and rescaling of the target images. A representative algorithm of registering images is presented in Figure 1.
All images were coded and randomized to avoid measurement bias. Two masked ophthalmologists (Zeng QZ and Li SY)independently evaluated CFP, FA, and SS-OCTA images. A third trained ophthalmologist (Zhao MW) adjudicated cases with discrepancies. CFP and FA were used for DR severity grading. Registered SS-OCTA and FA images were imported into Image J in the format of PNG (bundled with Java 1.8.0_172) for quantitative analysis.
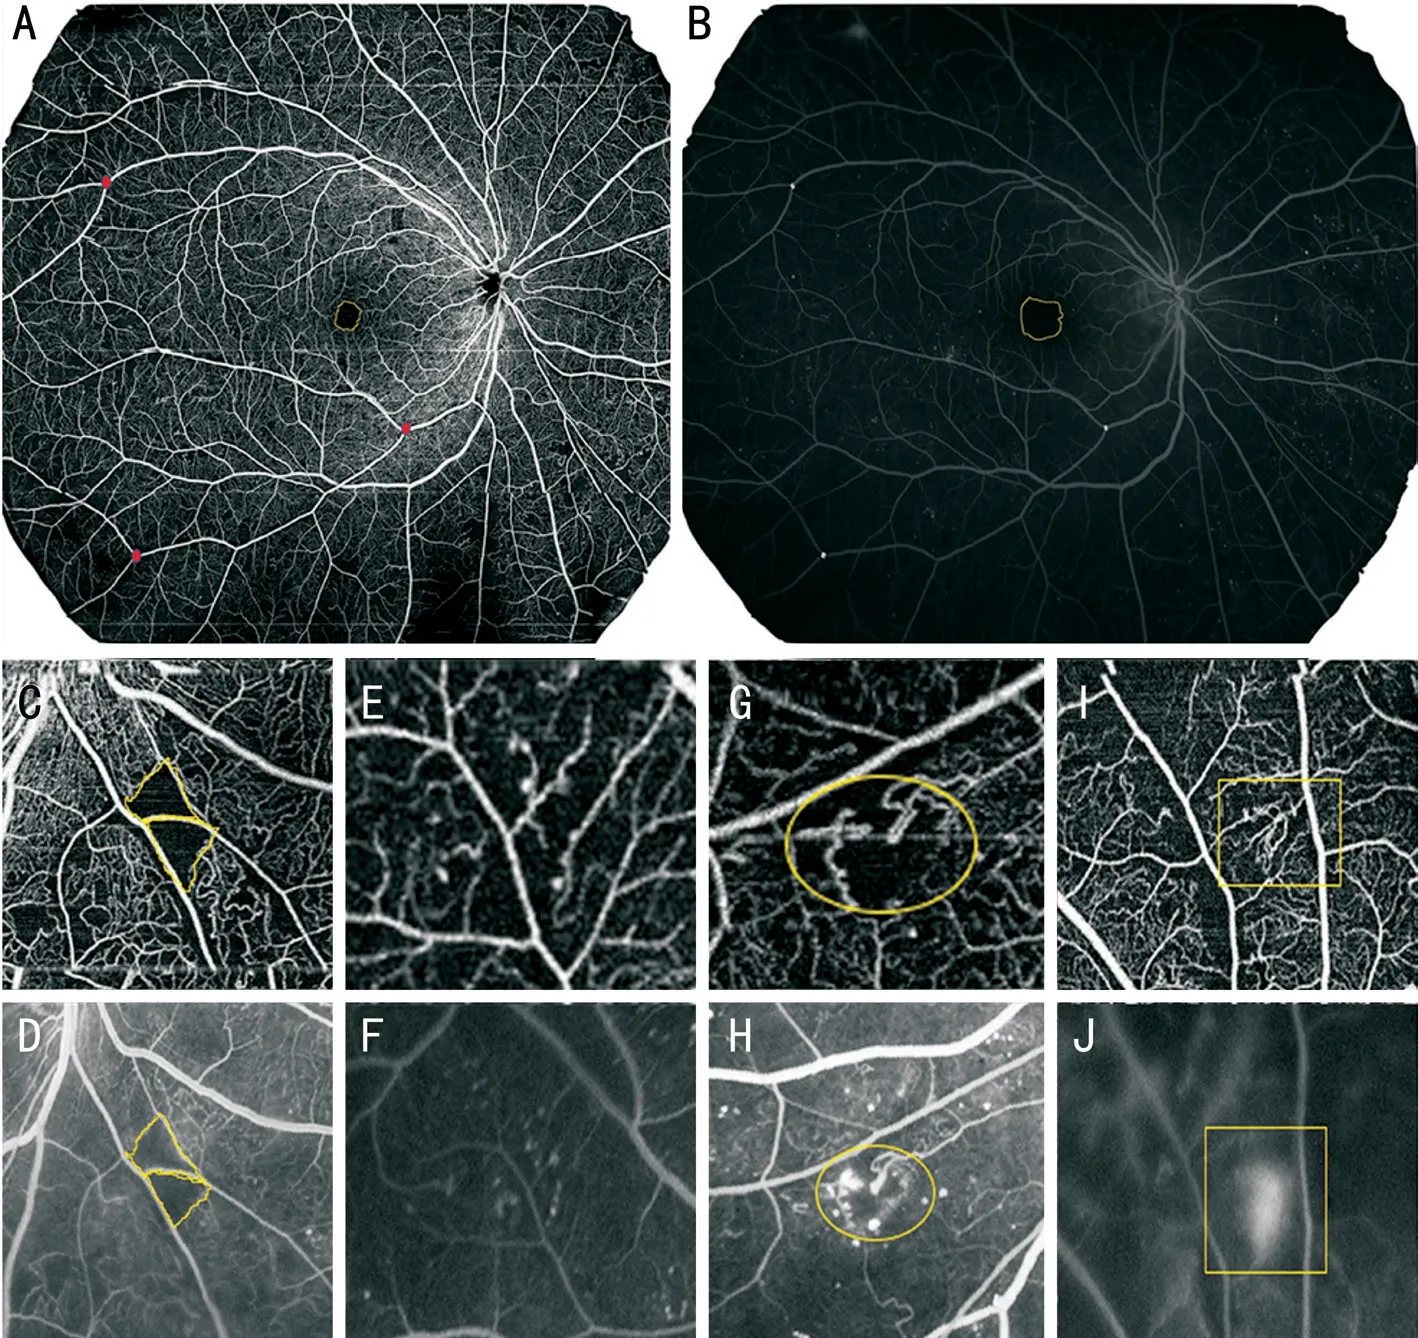
The FAZ area (mm2) and perimeter (mm) were measured by manually outlining the FAZ margin by means of Image J (Figure 2A, 2B). NPA was represented as an area of the fundus lacking retinal arterioles, venules, and capillaries,with a pruned appearance of adjacent vessels on FA, and on SS-OCTA, it was defined as the deficiency of capillary bed between terminal arterioles and a proximal venule or larger vessels[9]. NPAs were manually traced and measured in each image using Image J (Figure 2C, 2D). MAs were defined as pinpoint hyperfluorescent spots with or without leakage on FA and as various morphologic patterns, including fusiform,saccular, curved and rarely coiled shapes, in SS-OCTA images[12](Figure 2E, 2F). IRMAs were intraretinal new vessels adjacent to the areas of capillary loss, which were tortuous, dilated and looped (Figure 2G, 2H). NVs were defined as extraretinal vessels present in the vitreoretinal interface (VRI) slab and shown as Figure 2I-2J on en face SCP and FA.
Statistical AnalysisAll statistical analyses were performed with Stata/SE 15.0 (V.15.0; Stata, College Station, TX,USA). For patient characteristics, descriptive methods, with standard summary statistics including the mean (SD), median,interquartile range (IQR), and proportions were applied. For DR lesion comparisons between SS-OCTA and FA images,Student’sttest was performed to compare normally distributed quantitative variables, while the nonparametric Wilcoxon signed rank test was used for nonnormally distributed quantitative variables. We applied the intraclass correlation coefficient (ICC) and its 95% confidence interval (CI) to assess the agreement between SS-OCTA and FA pairwise for continuous variables. The ICC (range, 0-1) was deemed as good agreement (ICC 0.75 to 1), moderate agreement (ICC 0.5 to 0.75), and poor agreement (ICC<0.5)[13]. Bland-Altman plots were used to assess the agreement between the two imaging techniques.P<0.05 was considered to be statistically significant.
RESULTS
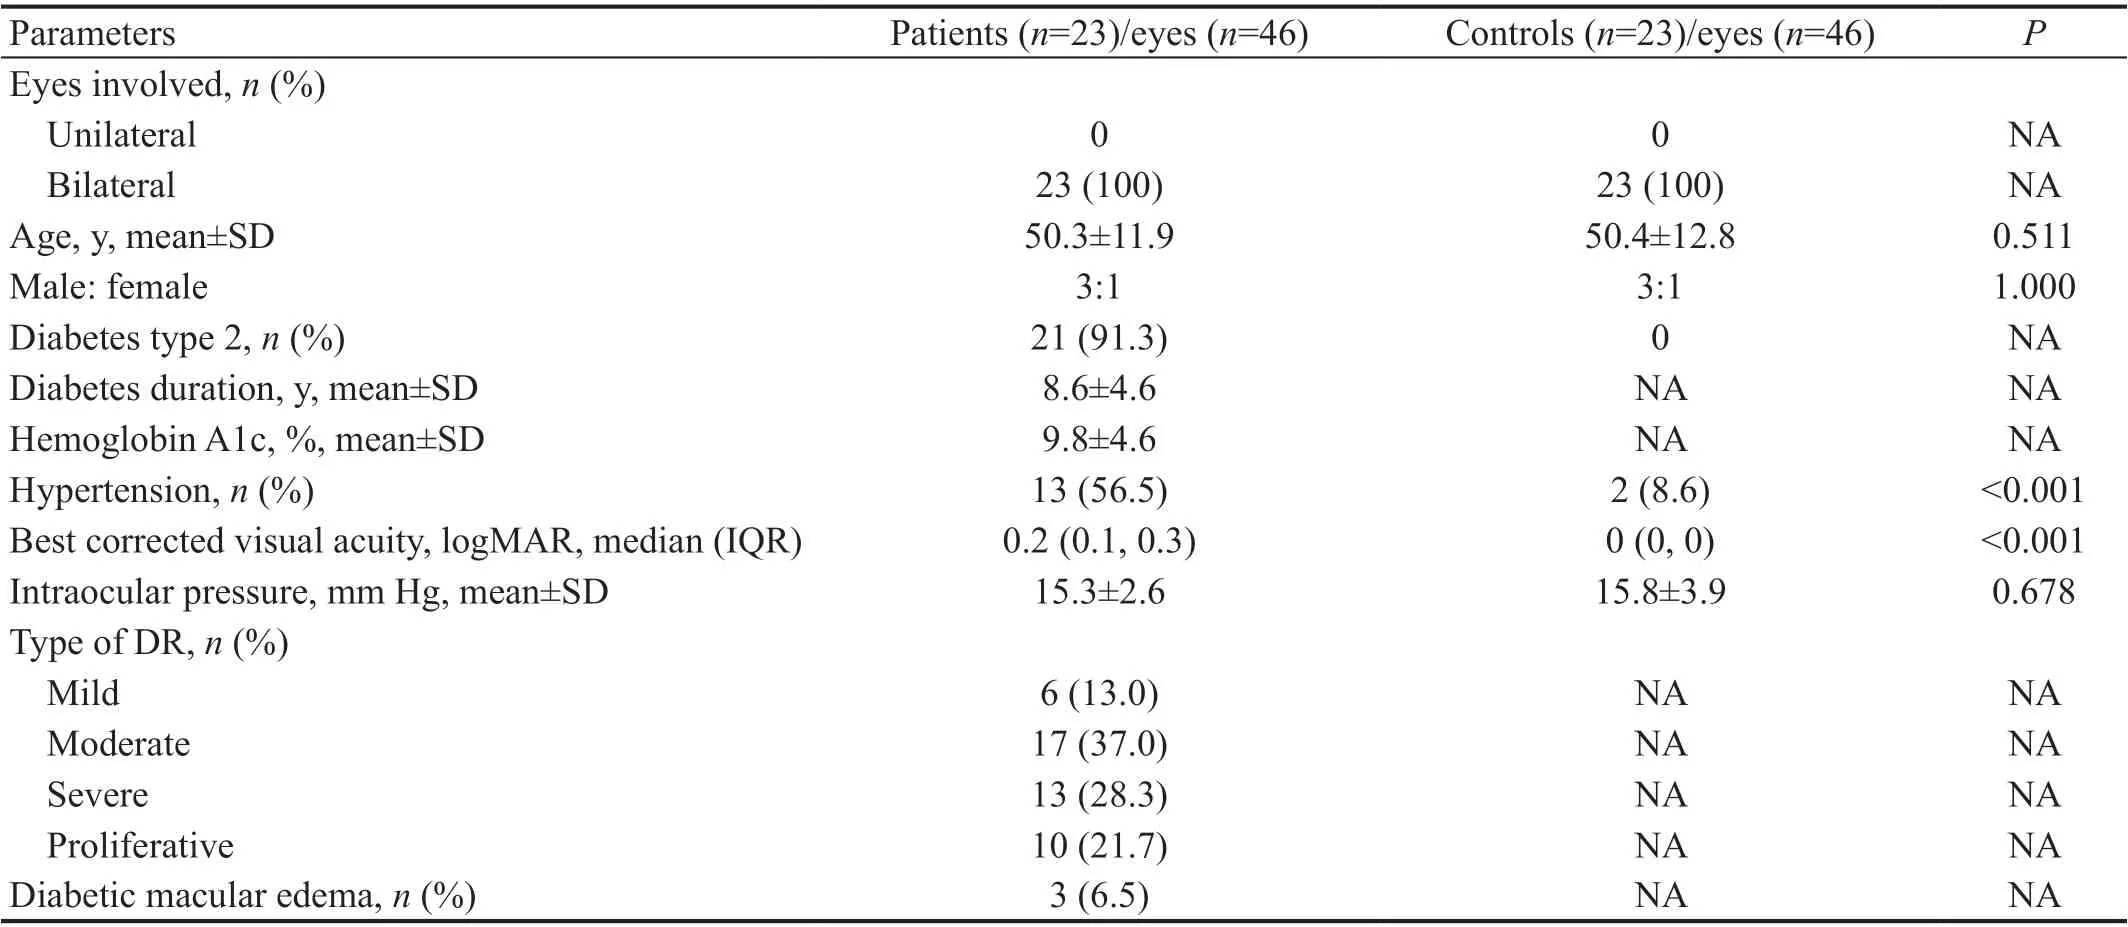
DemographicsForty-six eyes of 23 patients with treatmentnaïve DR were included in the study, as well as twenty-three age and gender matched healthy subjects. Demographics and clinical characteristics are provided in Table 1. There were 10 eyes with proliferate DR (PDR) and 36 eyes with nonproliferate DR (NPDR; 6, 17 and 13 eyes with mild, moderate and severe DR). Mean age of DR patients was 50.3±11.9y.The male:female ratio was 3:1. Twenty-one (91.3%) of the 23 patients had type 2 diabetes mellitus. The mean duration of diabetes was 8.6±4.6y, and the mean glycated hemoglobin(HbA1c) was 9.8%±4.6%. Hypertension was more common in patients with DR than in normal controls (56.5%vs8.6%,P<0.001). Three eyes (6.5%) had diabetic macular edema. The median BCVA in logarithm of minimum angle of resolution(logMAR) was 0.2 (range, 0.1-0.3), and the mean IOP was 15.3±2.6 mm Hg.
Ultra-widefield SS-OCTA and FA images were available in all 46 eyes of 23 participants. FA images were successfully aligned to the 24×20 mm2SCP SS-OCTA images and were included in the subsequent analysis.
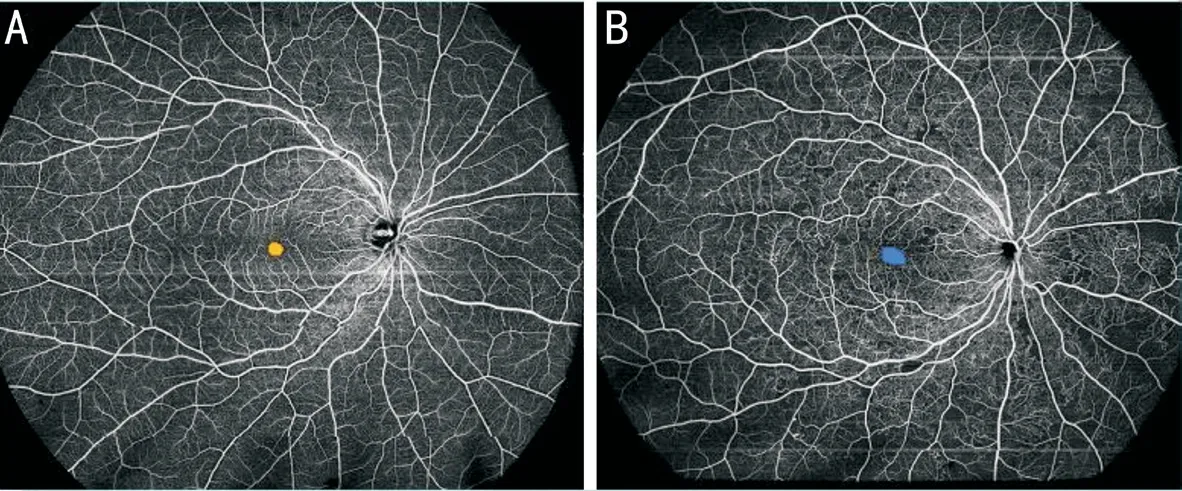
Quantitative Assessment of Diabetic Retinopathy Lesions Foveal avascular zoneRepresentative SS-OCTA of DR patients and normal controls were shown in Figure 3. The size of FAZ on OCTA were compared between normal and DR eyes (Table 2). Area of FAZ was larger in cases than controls(0.34±0.069 mm2vs0.287±0.108 mm2,P=0.006).
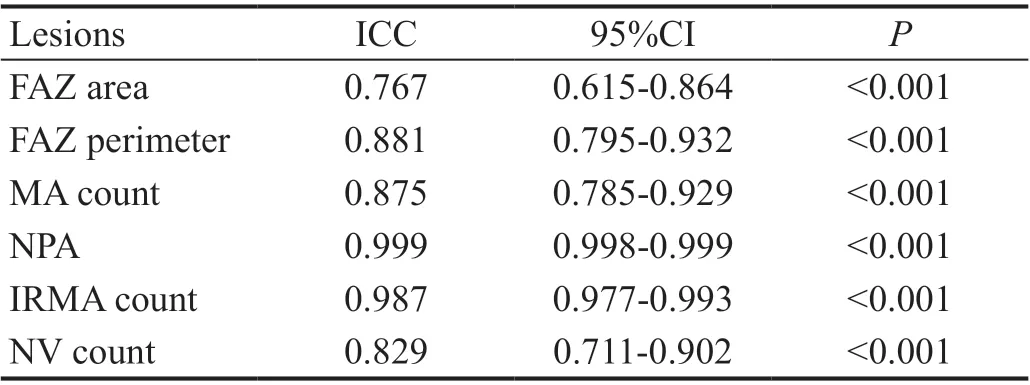
In DR eyes, the mean FAZ area was 0.34±0.069 and 0.334±0.087 mm2on SS-OCTA and FA, respectively(P=0.428), while the median FAZ perimeter was 2.382(IQR, 2.201-2.59) and 2.333 (IQR, 2.138-2.6) mm on SSOCTA and FA images (P=0.733; Table 3). FAZ area ICCs were significant between SS-OCTA and FA [0.767 (0.615-0.864),P<0.001], suggesting good agreement between the two imaging techniques. The ICCs of the FAZ perimeter were also statistically significant between SS-OCTA and FA [0.881(0.795-0.932),P<0.001], which indicated that the repeatability was good (Table 4). The above reproducibility results were also demonstrated using Bland-Altman plots (Figure 4A, 4B).Nonperfusion areaNPAs were detected in 22 patients(95.7%). There was no significant difference in the size of the NPA between the images on SS-OCTA and FA (12.389, IQR 4.96-28.3vs11.125, IQR 5-28.31 mm2,P=0.197), as presented in Table 3. The ICC of NPA size was also high [0.999 (0.998-0.999),P<0.001]. A Bland-Altman plot comparing the NPA between SS-OCTA and FA is shown in Figure 4C.

Figure 2 Representative DR lesions on corresponding FA and SS-OCTA images A, B: FAZ; C, D: NPA; E, F: Cluster of MA; G, H: IRMA; I, J:NV. DR: Diabetic retinopathy; FA: Fluorescein angiography; SS-OCTA: Swept-source optical coherence tomography angiography; FAZ: Foveal avascular zone; NPA: Nonperfusion area; MA: Microaneurysms; IRMA: Intraretinal microvascular abnormalities; NV: Neovascularization.

Table 1 Demographic and clinical characteristics of included patients and controls

Table 2 Comparison of FAZ on SS-OCTA between DR eyes and controls

Figure 3 Representative SS-OCTA of healthy controls (A) and DR eyes (B).

Figure 4 Bland-Altman analysis of FAZ area (A), FAZ perimeter (B), NPA (C), counts of MA, IRMA and NV in SS-OCTA and FA (D-F)FAZ: Foveal avascular zone; NPA: Nonperfusion area; MA: Microaneurysms; IRMA: Intraretinal microvascular abnormalities; NV: Neovascularization; SS-OCTA: Swept-source optical coherence tomography angiography.

Table 3 Detection of DR lesions on SS-OCTA versus FA
Counts of microaneurysms, intraretinal microvascular abnormalities, and neovascularization Measurements of MA,IRMA and NV count are also shown in Table 3. MAs were detected in all eyes using the two techniques. The median total MA count was 35 (IQR, 19-46) and 73 (IQR, 43-93) on SS-OCTA and FA, respectively (P<0.001). The ICC of MA count indicated that the repeatability of the difference between SS-OCTA and FA was stable [0.875 (0.785-0.929),P<0.001; Table 4].

Table 4 The ICCs of DR lesions between SS-OCTA and FA
The detection rate of IRMAs was 80.4% on both the modalities.There were 31 and 29 eyes with NV in SS-OCTA and FA,respectively. No significant difference in IRMA count was found between the images on SS-OCTA and FA (4, IQR, 1-7vs4,IQR, 1-8,P=0.061), as well as the NV count (0, IQR 0-1vs0, IQR 0-1,P=0.561). The repeatability of IRMA and NV count was good (ICC=0.987 and 0.829) in SS-OCTA and FA (Table 4). All the results are also presented as Bland-Altman plots in Figure 4D-4F.
DISCUSSION
In this study, we compared the differences between ultrawidefield SS-OCTA (24×20 mm2) and traditional FA in detecting microvascular lesions in treatment-naïve DR patients,including FAZ, NPA, MA, IRMA and NV.
Ophthalmic imaging modalities are increasingly significant in the screening, diagnosis, and monitoring of DR. For several decades, FA has been the gold standard in the clinical assessment of DR lesions. With advances in imaging techniques, OCTA may serve as a three-dimensional, depth-resolved, rapid, and noninvasive imaging modality as an adjunct for assessing microvascular changes[14]. Due to a fast-tuning laser source and balance detection, SS-OCT can achieve higher spectral resolution than SD-OCT and therefore leads to increased tissue penetration[5,15-16]. In this study, a scan size of 24×20 mm2area was obtained with a 400 kHz ultra-widefield SS-OCTA instrument (BM400K, TowardPi Medical Technology Co.,Ltd., Beijing, China). Among all the commercially available SS-OCTA devices, BM400K can achieve the largest scan range, which may potentially change the current paradigm of FA-based diagnosis and follow-up of DR.
To our best knowledge, this is the first prospective report to assess the potential use of ultra-widefield SS-OCTA as a noninvasive adjunct to traditional FA in DR and to explore the substitution possibility of ultra-widefield SS-OCTA for FA.
Our findings indicated that there was no significant difference in the FAZ area, FAZ perimeter, NPA, IRMA count or NV between SS-OCTA and FA. Good agreement between FA and SS-OCTA in the evaluation of those lesions was also confirmed. It is admitted that the FOV in FA is wider than that of ultra-widefield SS-OCTA; however, SS-OCTA may be clinically useful enough because the majority of lesions in PDR cases are observed within the mid periphery of the retina,which is covered by OCTA images[17]. In addition, SS-OCTA could be performed as a first-line examination in all diabetic patients without a risk of adverse effects. Moreover, SS-OCTA could be an important tool with segmentations for follow-up,which can provide quantitative indexes.
Consistent with previous studies, FAZ measurement was found to be similar between the two imaging modalities[18]. In a study including 20 eyes of 14 patients with non-proliferative and proliferative DR, Couturieret al[19]proposed that compared with FA, OCTA allowed better visualization of the FAZ,although their study did not quantitate this observation. As our results showed, the mean size of the FAZ in the same eye was measured to be slightly larger in SS-OCTA than in FA,which was comparable to that of other studies[16,20-22]. Overall,measurement of the FAZ with SS-OCTA is valuable in the clinical routine in detecting ischemic maculopathy and DR progression.
NPA was another common finding on both imaging techniques.The published literature has proposed that OCTA detects NPA to nearly the same or even better extent than FA[7,9,23-27].Nevertheless, the FOV for traditional OCTA is restricted compared with that for FA. The SS-OCTA employed in our study widens the FOV to 24×20 mm2, which is the largest yet.In the study by Sawadaet al[7], they applied panoramic OCTA images (OCTA, PLEX Elite 9000 system) for NPA assessment in DR patients, with 2.4 times enlargement of the single-center OCTA FOV. It was concluded that wide-angle OCTA was likely to be clinically useful to detect NPAs, although they did not quantitate the size of NPAs. For the detection of IRMA and NV, SS-OCTA also showed similar counts to FA, consistent with some previous studies[8]. FA could differentiate NVs from IRMA because the latter shows no signs of leakage[28].However, it is not necessary to perform invasive FA simply to distinguish between IRMAs and NVs.
MAs are the first detectable sign of early DR, manifested as hyperfluorescent spots in FA. The extent and location of MAs are an essential component of the fundus evaluation when assessing DR severity and progression risk. MAs at the posterior retina have been extensively investigated, and ultra-widefield SS-OCTA (UWF-SS-OCTA) has also gained added importance due to the ready visualization of the retinal periphery. To date, the relative ability of UWF-SS-OCTA versus UWF-FA to visualize MAs has not been fully evaluated. In our study, MA count differed significantly between images on SSOCTA and FA. FA identified more MAs than SS-OCTA, which was consistent with some previous studies[15-16,23-24]. Elnahry and Ramsey[15]reported that significantly more MAs were identified on FA images (102±27.5) compared with OCTA(47.5±11.7,P<0.0001). Salzet al[23]also found that OCTA was able to identify a mean (SD) of 6.4 (4.0) MAs, while FA identified a higher mean (SD) of 10 (6.9) MAs. In Enderset al[16]study, the mean MA count was 14 in FA and 13 in OCTA.
There could be several reasons for the discrepancies in MA identifications in FA and UWF-SS-OCTA. In FA, the dye remains in the abnormally dilated blood vessel, leading to the brightly hyperfluorescent appearance of MAs; leakage of some MAs can also highlight and exaggerate their appearance[23],resulting in more MAs detected in FA. However, the SS-OCTA segmented images do not show leakage, which may explain the smaller and less prominent MAs on SS-OCTA than FA. In addition, high-speed SS-OCTA could limit the identification of low-flow lesions such as MAs, some of which are completely occluded[29]. Histopathologic studies reported that the lumen configuration in MAs consists of thickened, hyalinized, fibrous,laminated, and lipid-containing basement membrane, as well as hypercellular or multilayered endothelial cells[29]. Hence,the turbulent blood flow inside some types of MAs may not be perfectly displayed in OCTA[24]. It has to be admitted that FA appears to be the preferred modality over UWF-SS-OCTA for the assessment of MAs. When using SS-OCTA, MAs may be detected more readily with 6×6 mm2angiography rather than montage or UWF-SS-OCTA[30-31]. Continued evolution of UWF-SS-OCTA is needed with further research. UWFSS-OCTA and FA should be combined to better evaluate DR microvasculature lesions. On the other hand, the agreement between MAs in SS-OCTA and FA was good, suggesting that the difference in visualizing MAs between the two techniques was stable and reliable.
There are several limitations in our study. First, we included only a small number of eyes, and larger prospective series are needed to further confirm our encouraging results. Second,only taking the SCP into account in SS-OCTA may limit the significance of our results. Third, SS-OCTA has its intrinsic restrictions. In clinical practice, bias could be introduced due to increased heterogeneity with diverse axial lengths and patient cooperation, which could be studied in our future research[32].The manual segmentation and registration methods could also be a factor that may have introduced bias in the results.Additionally, we could carry out further studies to examine not only the differences in evaluation of retinal microvasculature using SS-OCTA and FA imaging but also assess both interand intra-observer variability of interpretation by graders with diverse levels of experience, the impact of SS-OCTA guided treatment for DR andetc.
In conclusion, ultra-widefield SS-OCTA (24×20 mm2) can clinically assist in evaluating FAZ, NPA, IRMA and NV counts compared with traditional FA. Good or moderate agreement between FA and SS-OCTA in the evaluation of those lesions was also confirmed. Due to the limitations of signal processing and thresholding techniques, SS-OCTA detects fewer MAs.Overall, SS-OCTA represents a reliable, noninvasive, timesaving, easy-to-use and quantitative imaging technique in the assessment of microvasculature in DR, which offers a potential substitute for FA in DR evaluation.
ACKNOWLEDGEMENTS
Authors’ contributions:Conceptualization (Zhao MW);Data curation (Zeng QZ); Formal analysis (Zeng QZ, Li SY); Funding acquisition (Zhao MW); Investigation (Qu JF);Methodology (Zeng QZ, Li SY, Yao YO, Jin EZ); Project administration (Zeng QZ, Li SY); Resources (Zhao MW);Software (Zeng QZ, Li SY); Supervision (Qu JF, Zhao MW);Validation (Yao YO, Jin EZ); Visualization (Zeng QZ, Li SY);Roles/Writing - original draft (Zeng QZ, Li SY); Writingreview & editing (Zhao MW).
Foundation:Supported by the National Key R&D Program of China (No.2020YFC2008200).
Conflicts of Interest: Zeng QZ,None;Li SY,None;Yao YO,None;Jin EZ,None;Qu JF,None;Zhao MW,None.
 International Journal of Ophthalmology2022年11期
- International Journal of Ophthalmology的其它文章
- Paracentral acute middle maculopathy after diagnostic cerebral angiography in a patient with a contralateral carotid-cavernous fistula
- Assessment of knowledge, perception, and practice patterns of Jordanian optometrists during COVID-19 pandemic: a cross-sectional online survey
- Comprehensive assessment of growth factors,inflammatory mediators, and cytokines in vitreous from patients with proliferative diabetic retinopathy
- A Trojan horse biomimetic delivery system using mesenchymal stem cells for HlF-1α siRNA-loaded nanoparticles on retinal pigment epithelial cells under hypoxia environment
- Association of CFH and MAP1LC3B gene polymorphisms with age-related macular degeneration in a high-altitude population
- A modified 3D stereophotogrammetry-based distraction test for assessing lower eyelid tension
