Electronic Supplementary Materials to:The Super-large Ensemble Experiments of CAS FGOALS-g3*
Pengfei LIN, Bowen ZHAO, Jilin WEI, Hailong LIU, Wenxia ZHANG, Xiaolong CHEN,Jie JIANG, Mengrong DING, Wenmin MAN, Jinrong JIANG, Xu ZHANG,Yuewen DING, Wenrong BAI, Chenyang JIN, Zipeng YU, Yiwen LI,Weipeng ZHENG, and Tianjun ZHOU
1State Key Laboratory of Numerical Modeling for Atmospheric Sciences and Geophysical Fluid Dynamics (LASG),Institute of Atmospheric Physics, Chinese Academy of Sciences, Beijing 100029, China
2College of Earth and Planetary Sciences, University of Chinese Academy of Sciences, Beijing 100049, China
3Computer Network Information Center, Chinese Academy of Sciences, Beijing 100190, China
4Group of Alpine Paleoecology and Human Adaptation (ALPHA), State Key Laboratory of Tibetan Plateau Earth System,Resources and Environment (TPESRE), Institute of Tibetan Plateau Research,Chinese Academy of Sciences, Beijing 100864, China
5Key Laboratory of Western China’s Environmental Systems (Ministry of Education), College of Earth and Environmental Science, Lanzhou University, Lanzhou 730000, China

Table S1. The names of 29 CMIP6 models whose historical and SSP5-8.5 simulations are used in the study.
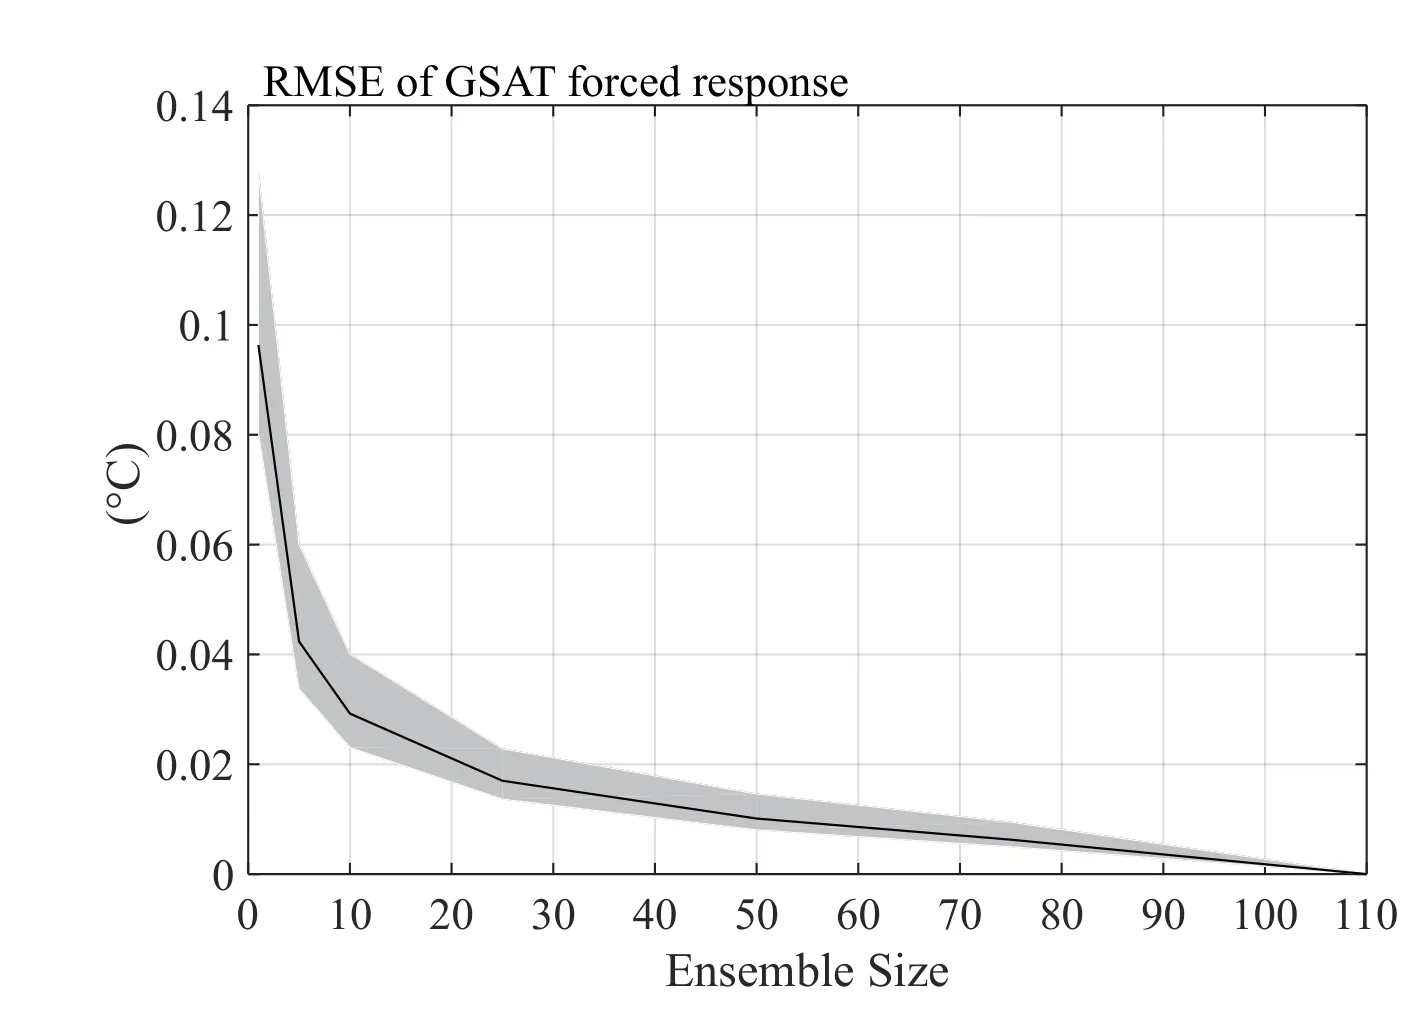
Fig. S1. The RMSE of annual global SAT (GSAT) compared with the 110-member ensemble mean of FGOALS-g3. The x-axis label is the sample size of subsets from the 110 members, and the y-axis label is the RMSE from subset-estimated GSAT compared with the 110-member estimated “true” GSAT forced response. The black line is the mean RMSE for GSAT for subset members 2 to 110. The RMSE is computed 10000 times, so the gray shaded area shows the range of 10000 RMSEs for each subset.
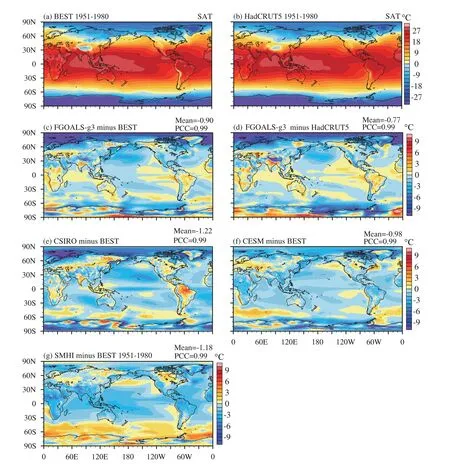
Fig. S2. The observed SAT in (a) BEST and (b) HadCRUT5 for 1951-80. The simulated SAT bias in FGOALS-g3 relative to (c) BEST and (d) HadCRUT5 for 1951-80. The simulated SAT bias in (e) CSIRO large ensembles, (f)CESM large ensembles, and (g) SMHI large ensembles relative to HadCRUT5 for 1951-80. The global mean SAT bias (ensemble mean minus observstion) and PCC for climatology between observations and the large ensemble mean of model are shown.
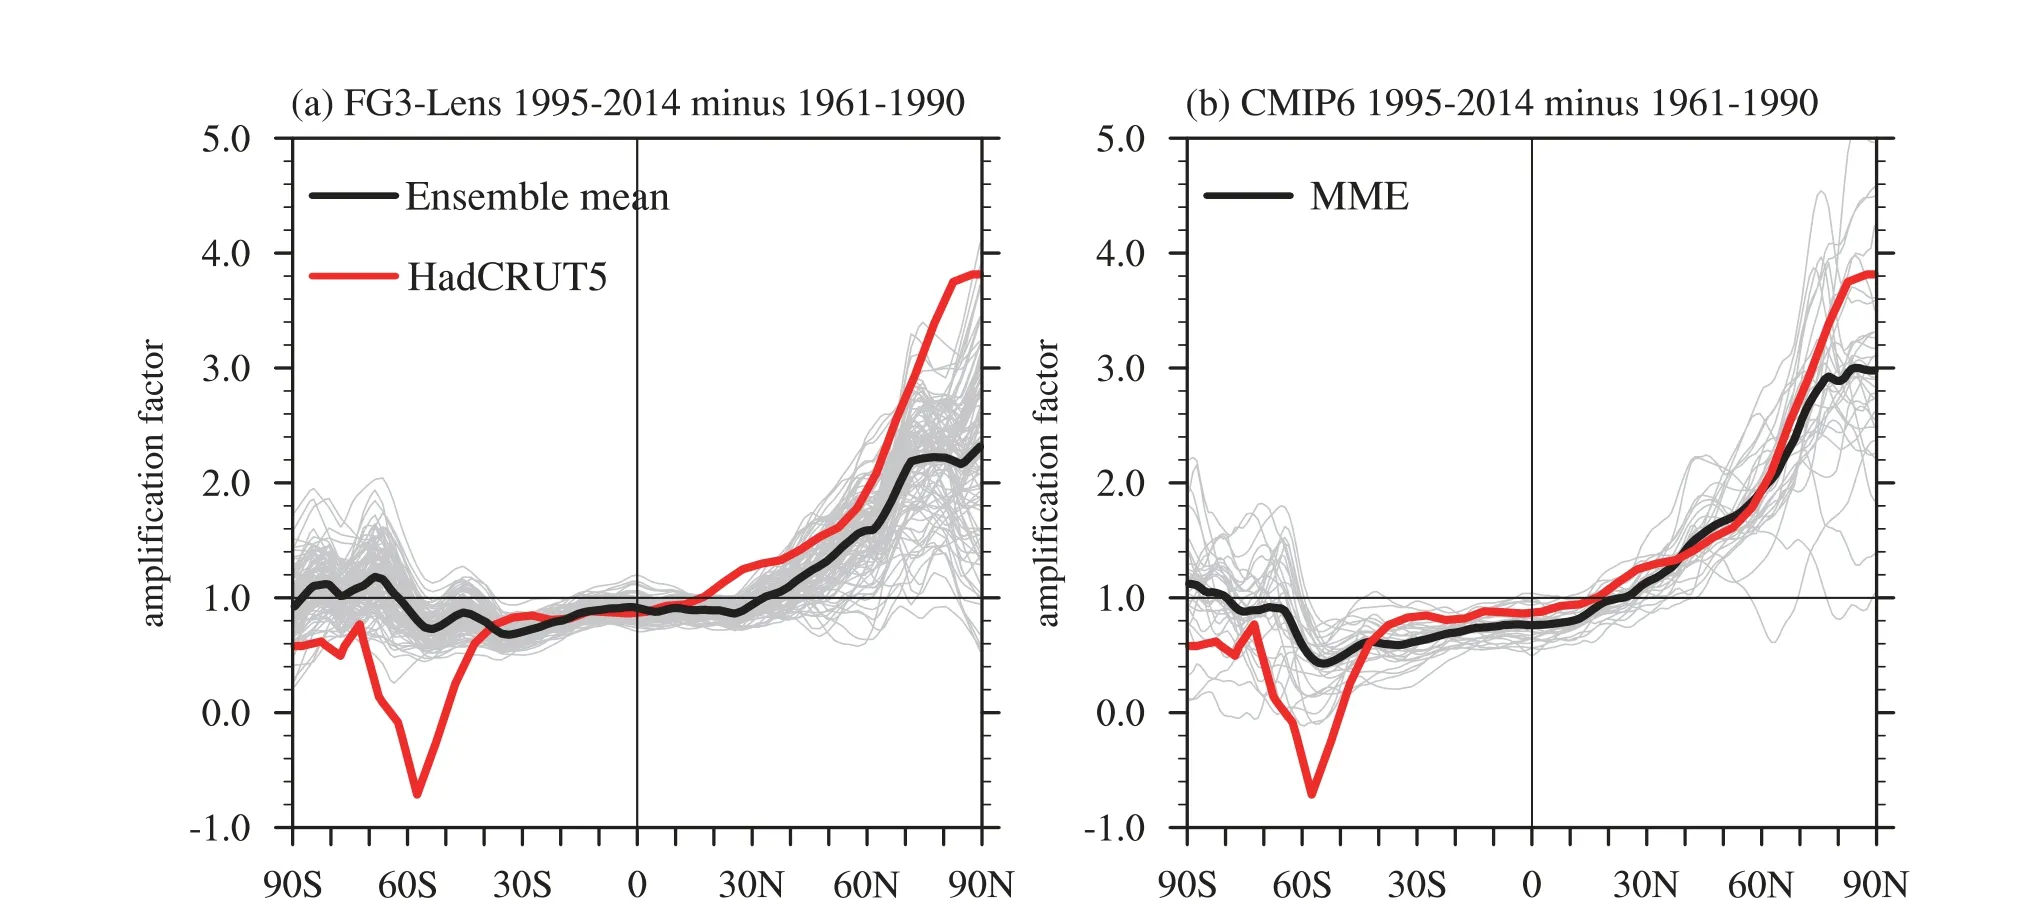
Fig. S3. The zonal averaged warming amplification factor, defined as the change in zonal average temperature relative to the global mean temperature change (Holland and Landrum 2015), for FGOALS-g3 and 29 CMIP6 models. The change is computed as the average for 1995-2014 minus the average for 1961-90. (a) FGOALS-g3 super-large ensembles, (b) 29 CMIP6 models (Models’ name see Table S1). The black line in (a) is the ensemble mean in FGOALS-g3 large ensembles, and (b) is the multi-model ensemble mean (MME) in CMIP6, respectively.The red line is the HadCRUT5.
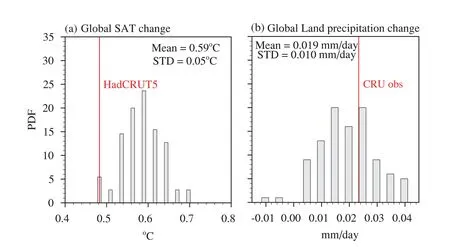
Fig. S4. The simulated (a) SAT and (b) land precipitation change (1995-2014 minus 1961-1990) over the globe in FGOALS-g3 large ensembles and observations. The observed SAT and land precipitation are from HadCRUT5 and CRU, respectively.
 Advances in Atmospheric Sciences2022年10期
- Advances in Atmospheric Sciences的其它文章
- Electronic Supplementary Material to:Transport Patterns and Potential Sources of Atmospheric Pollution during the XXIV Olympic Winter Games Period*
- Electronic Supplementary Material to:How Well do CMIP6 and CMIP5 Models Simulate the Climatological Seasonal Variations of Ocean Salinity?*
- Electronic Supplementary Materials to:Distinguishing the Regional Atmospheric Controls on Precipitation Isotopic Variability in the Central-Southeast Portion of Brazil*
- Electronic Supplementary Material to:How Frequently Will the Persistent Heavy Rainfall over the Middle and Lower Yangtze River Basin in Summer 2020 Happen under Global Warming?*
- Erratum to: Observational Study of Surface Wind along a Sloping Surface over Mountainous Terrain during Winter
- Importance of Air-Sea Coupling in Simulating Tropical Cyclone Intensity at Landfall
