Terahertz spectroscopy and lattice vibrational analysis of pararealgar and orpiment
Ya-Wei Zhang(张亚伟) Guan-Hua Ren(任冠华) Xiao-Qiang Su(苏晓强)Tian-Hua Meng(孟田华) and Guo-Zhong Zhao(赵国忠)
1Institute of History for the Science and Technology,Inner Mongolia Normal University,Hohhot 010022,China
2School of Yungang Ology,Shanxi Datong University,Datong 037009,China
3Department of Mathematics and Physics,North China Electric Power University,Baoding 071003,China
4Institute of Solid State Physics,Shanxi Provincial Key Laboratory of Microstructure Electromagnetic Functional Materials,Shanxi Datong University,Datong 037009,China
5Department of Physics,Capital Normal University,Beijing 100048,China
Keywords: THz-TDS,lattice vibrations,solid-state density functional theory(ss-DFT),pararealgar,orpiment
1. Introduction
Sulfur-containing pigments are a relatively universal decoration material utilized in Chinese mural paintings,ceramics,oil-decorated paintings of ancient buildings,lacquerware,and other crafts. Among these pigments,pararealgar and orpiment are both arsenic-containing sulfides, which are held together by van der Waals forces but the chemical proportion is slightly different.Pararealgar is composed of distinct As4S4molecules that are covalently bound together,[1]and orpiment consists of arsenic trisulfide with the chemical formula As2S3, which runs parallel to the(010)direction.[2]Owing to the influence of age, self-fading, discoloration, and the external environment,it is difficult for the pigments to be properly preserved.A variety of spectroscopic techniques are utilized to analyze the composition,origins,and craftsmanship of pigments,thus providing a better understanding of artists’ palettes in original works and monitoring degradation of pigments over time.Related measurements were commonly employed by versatile spectroscopic approaches, including x-ray fluorescence spectroscopy (XRF),[3–5]Raman spectroscopy,[6,7]x-ray diffractometer (XRD),[8]Fourier transform infrared spectroscopy(FTIR),[9,10]particle-induced x-ray emission (PIXE),[11]and scanning electron microscopy-energy dispersive x-ray(SEMEDX).[12–14]Although the aforementioned techniques can be sensitive and qualitative, they are time-consuming, invasive,and require sophisticated sample preparation processes carried out by specialists.
As an emerging technology, terahertz spectroscopy has shown great application prospects for the analysis of cultural relics based on its high penetration, coherence, broadspectrum,and non-ionization characteristics,which is desired for measuring the pigments in cultural relics. In recent years,terahertz technology has been exploited to study the pigments in oil paintings,[15,16]medieval manuscripts,[17]and mural paintings.[18]In addition, this technology has been applied to the fields of biology, chemistry, biomedicine, agriculture,and sensing applications.[19–23]Yanget al.[24]confirmed the implementation of terahertz time-domain spectroscopy(THz-TDS) and THz-imaging techniques for distinguishing seven red mineral pigments and estimating pigments in ancient Chinese artworks. Leeet al.[10]developed an optimal method for terahertz spectroscopic analysis of the vermilion pigment in free-standing and polyethylene-mixed forms with temperature control. Kleist and Korter[25]demonstrated that lowfrequency vibrational spectroscopy can be applied to successful quantitative research of minium and vermilion pigment mixtures. However, the majority of the preceding investigations focused only on the quantitative data of various crystalline pigments, detailed explanations are lacking in the provenance of spectral features. Consequently, the use of advanced computational models is particularly necessary for diagnosing the vibrational spectroscopy of solids, and for elucidating the connections between crystal structure and the intermolecular oscillations that collectively contribute to the terahertz spectra of these materials. Both organic pigments and inorganic pigments have been successfully demonstrated through using this method.[5,26]
In this work, arsenic-containing sulfides pigments pararealgar(As4S4)and orpiment(As2S3)are investigated by using THz-TDS system in a frequency range of 0.2 THz–2.2 THz,and the corresponding characteristic absorption spectra are obtained. Meanwhile,Raman spectroscopy is also used as a complementary technique. To further understand the relationship between the terahertz characteristic absorption peaks and the lattice vibrational modes of pararealgar and orpiment,the quantum mechanical simulations are performed based on solid-state density functional theory (ss-DFT). This approach will definitely enhance the terahertz spectral database of arsenic-containing sulfide pigments for intrinsic identification and guided restoration of historical artifact.
2. Materials and methods
Two arsenic-containing sulfides pigments pararealgar and orpiment were purchased from J & K Industrial Inc. (China)and utilized directly without further purification. Polytetrafluoroethylene(PTFE)was acquired from Aladdin Industrial Inc.(China), and the utilization of PTFE powder meant that the measurements were taken in the optimum absorption range because PTFE has a relatively constant refractive index and low loss in a low-frequency terahertz region.[27]Pararealgar and orpiment were mixed with PTFE at a mass ratio of 1:3, respectively, and ground lightly into fine particles with a pestle and mortar. Under the pressure of 2.0 MPa,the powder samples were pressed into a tablet with a diameter of 13 mm and a thickness of about 1.3 mm.As shown in Fig.1,the transmitted signals of the samples were measured by a fiber-optic THz-TDS system with an effective bandwidth of 0.2 THz–2.2 THz and a spectral resolution of 2.5 GHz. The sample chamber was purged with dry air to prevent the disturbance from atmospheric water vapor during the experiments. Each spectrum was averaged over 100 scans to improve the signal-to-noise ratio(>103:1),and the air was used as the reference signal.The absorption coefficientα(ω) could be extracted through the ratio between the spectra of the sample and the reference,the detailed formula is as follows:[28–31]wherecis the speed of light,ωis the wave frequency,n(ω)is refractive index,A(ω)andφ(ω)are the amplitude ratio and phase difference between the reference and sample, respectively,anddis the sample thickness.

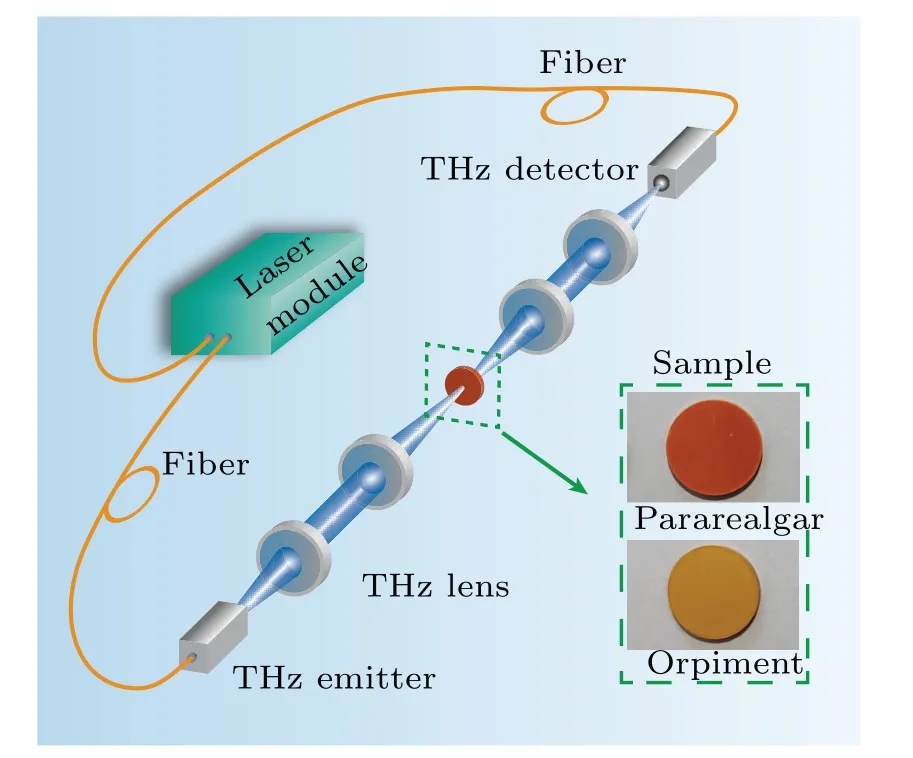
Fig.1. Illustration of experimental setup,with enlarged frame showing the photos of two samples.
The Raman signals were sampled by confocal Raman microscope(Renishaw,InVia,UK)and the surface ingredients of the pigments were qualitatively determined point-by-point by the scanning method under a 50×objective lens using the pinhole confocal method.The excitation wavelength was 532 nm,and the spectral resolution was 0.81 cm-1. The corresponding grating specification was 1800 lines L/mm, and the spectral scanning range was 100 cm-1–3200 cm-1.
Quantum chemical calculations based on the ss-DFT were conducted to analyze the observed terahertz spectra. The calculation package was performed by using the Cambridge Sequential Total Energy Package (CASTEP),[32]and the results were obtained within the generalized gradient approximation (GGA) with the help of Perdew–Burke–Ernzerhof(PBE) correlation function.[33]Tkatchenko–Scheffler (TS)dispersion correction and norm-conserving pseudopotential were used for CASTEP.
3. Results and discussion
The measured terahertz absorption spectra of the two pigments are presented in Fig.2. The blue curve in Fig.2(a)represents the measured terahertz absorption spectra of pararealgar with two distinct peaks at 1.33 THz and 1.48 THz, and broad absorption bandwith is around 1.83 THz. The orange curve in Fig.2(b)depicts the terahertz spectrum of orpiment,which contains two distinct absorption peaks at 1.59 THz and 1.98 THz. There is a shoulder peak in the region of 1.8 THz–1.9 THz which can be identified by the shape of the peak. The two samples have different spectrum characteristics, indicating that the material ingredients that generate terahertz resonances are different. From the Raman spectroscopy indicated in Fig.3 it follows that the characteristic peaks of pararealgar located at 135, 188, 234, 274, 312, 345, and 362 cm-1are consistent with the reported Raman database of chemical formula As4S4,[34]while the distinct peaks of orpiment located at 139, 158, 206, 295, 314, 357, and 385 cm-1correspond to the chemical formula As2S3described in the literature.[35]These results demonstrate that the terahertz responses of two pigments mainly derive from the major component of As4S4and As2S3,respectively.
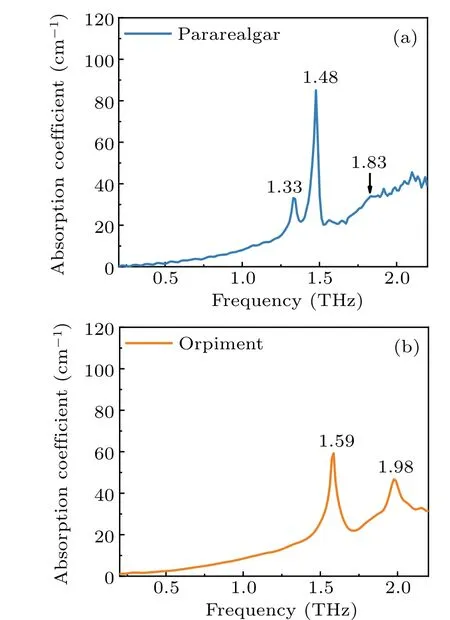
Fig.2. THz absorption spectrum of(a)pararealgar and(b)orpiment.
The terahertz absorption peaks are intrinsically attributed to the lattice vibrations of constituent elements. To gain an insight into these measured terahertz responses,quantum chemical calculations based on ss-DFT are performed by using the CASTEP program. The initial parameters used for the calculation are based on previously reported crystal structures.[2,36]Although pararealgar(As4S4)and orpiment(As2S3)both belong to space groupP21/cand the corresponding space lattice is monoclinic, their lattice parameters are different markedly.Specifically, the crystallographic unit cell diagram of As4S4and As2S3are shown in Fig. 4, respectively. [As4S4:a=9.930,b=9.657,c=8.510,β=97.3°,[36]As2S3:a=4.256,b=9.577,c=12.191,β=109.76°.[2]It can be seen that the two crystals have completely different unit cell crystallizations. In a unit cell of the As4S4crystal, there are four As4S4molecules.One arsenic(As)atom connects two arsenic atoms and one sulfur(S)atom,and another connects three sulfur atoms,while the remaining other two connect one arsenic atom and two sulfur atoms. In comparison, the atoms in the As2S3crystal exhibit chain-like connections and layered structures. Meanwhile, the horizontal layers are perpendicular to the figure plane and corrugated in the shape of trapezium.
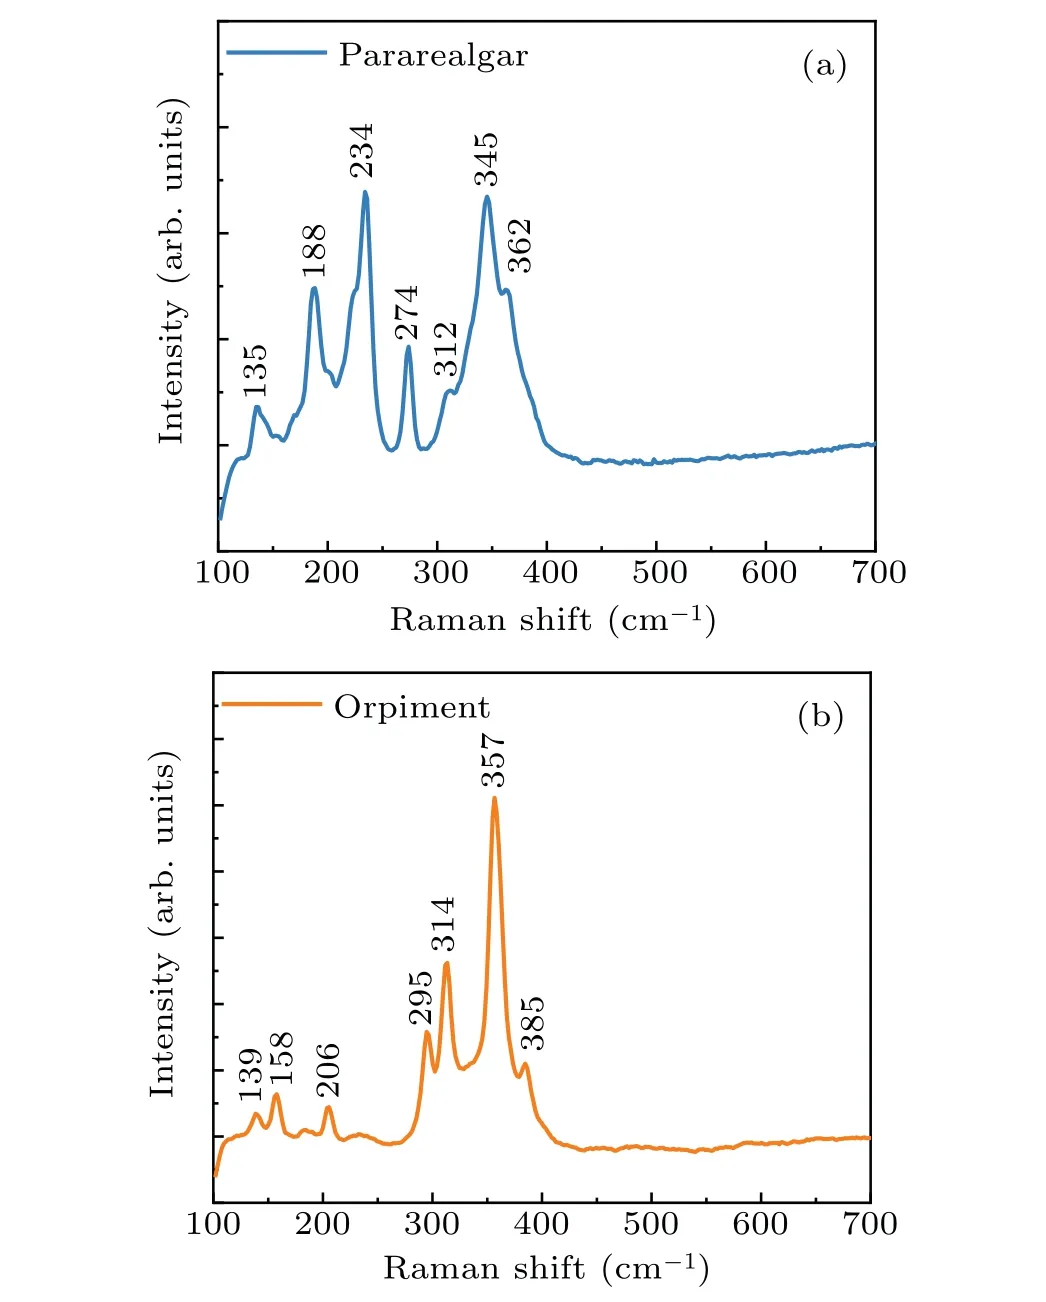
Fig.3. Raman spectrum of(a)pararealgar and(b)orpiment.
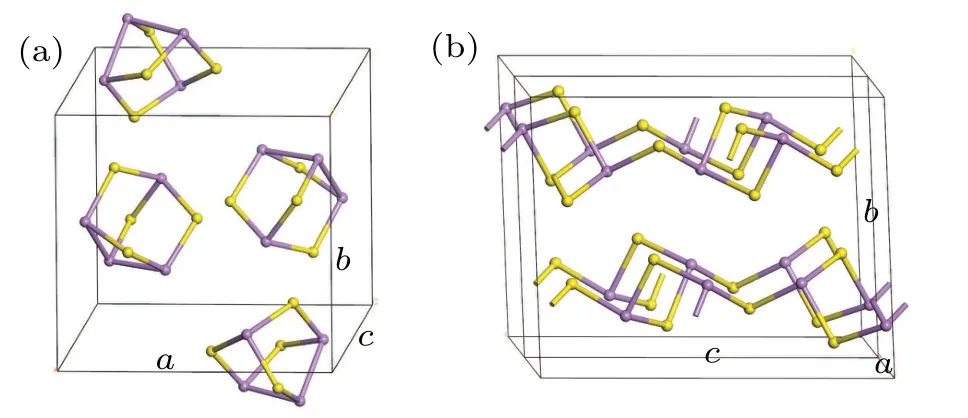
Fig.4. Unit cell diagrams of(a)As4S4 and(b)As2S3 crystals,with yellow balls representing sulfur atoms,and purple balls denoting arsenic atoms.
The calculated results are shown as the green dotted lines in Figs. 5 and 6. For pararealgar (As4S4), there are two distinctive vibration modes at 1.18 THz and 1.37 THz as shown in Fig.5(a),corresponding to the measured peaks at 1.33 THz and 1.48 THz. The slight deviations arise mainly from the temperature effect.[37]To be specific, the temperature difference will result in the frequency shift and split of the characteristic peaks, which have been considered as the consequence of multiple mechanisms, including the anharmonicity of vibrational potential,[38]the temperature-dependent change of the volume,[39]and the interaction of weak intermolecular bonding forces such as hydrogen bonds and van der Waals forces.[40]In this work, the simulations are performed at 0 K while the experiments are completed at room temperature,thus leading to the deviations. Actually, the measured results are also restricted by humidity and purity of crystal. Theoretically,the pararealgar should also contain three vibrational modes at 1.72 THz, 1.87 THz, and 2.02 THz. As discussed above,these three vibrational modes may arise from the splitting of the 1.83 THz absorption peak due to temperature effects or the frequency shift of the high-frequency absorption peak beyond the measurement range. The specific reasons need further studying. In order to obtain the vivid and graphic interpretation,the five vibrational modes of pararealgar are revealed in Figs.5(b)–5(f),in which the green arrows represent the vibration directions and intensities of the atoms.The vibrational modes intrinsically derive from the collective oscillation of all the As4S4molecules and the orientations are illustrated with blue arrows for clarity, respectively. It can be seen that the movements of unit cell rotate along the particular axis at 1.18 THz,1.37 THz,1.72 THz,and 2.02 THz,while the tendency is translational along thebaxis at 1.87 THz. It is worth noting that the vibration planes of the two modes at 1.72 THz and 2.02 THz are comparable, but the specific vibrating directions of internal As4S4molecules are different, which are illustrated in Figs.5(d)and 5(f). This effect definitely verifies that there is an interaction force(van der Waals force)between the adjacent molecules,[41]resulting in the integral resonances contributing to the diverse absorptions at those characteristic frequencies.

Fig. 5. Calculated spectra and vibrational modes of pararealgar, with yellow balls representing sulfur (S) atoms, and purple balls denoting arsenic(As)atoms.
The vibration style of orpiment(As2S3)is drastically different from that of pararealgar as shown in Fig. 6. Since the crystal framework of orpiment does not contain independent molecule units, its lattice vibrational formalization does not show a collective behavior of movement but a local torsion of the chain-like architecture. There are three vibrational modes for crystal As2S3at 1.45 THz,1.79 THz,and 1.88 THz,which are generally consistent with the experimental results. Specifically,the vibrational mode at 1.45 THz arises mainly from the oscillations of sulfur atoms and part of arsenic atoms parallel with the crystallographicbcplane. Conversely,the vibrational mode at 1.79 THz is caused mostly by two atoms vibrating perpendicular to the crystallographicbcplane. The movement at 1.88 THz is similar to that at 1.45 THz,but the contribution of arsenic atoms increases. Compared with collective resonances of unit in pararealgar,the layered vibrations depend on chain-like connection of atoms in orpiment,leading to higher resonant frequencies.
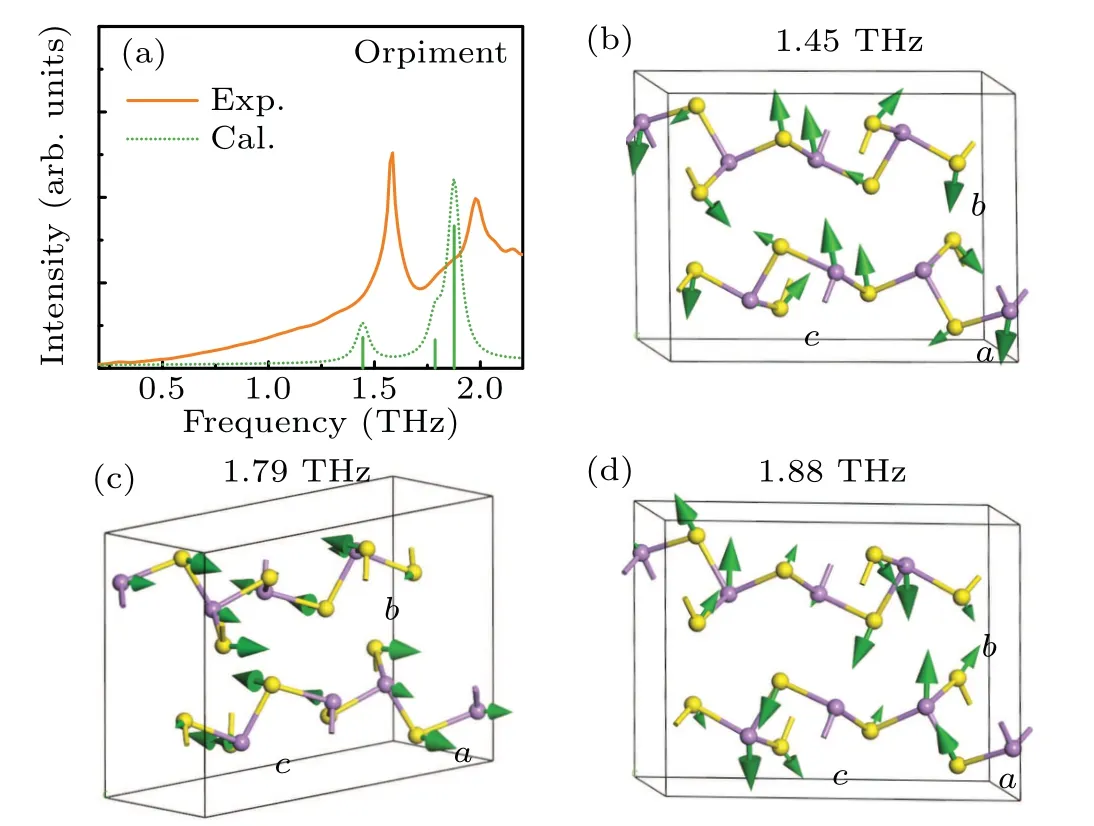
Fig. 6. Calculated spectra and vibrational modes of orpiment, with yellow balls representing sulfur (S) atoms, and purple balls denoting arsenic (As)atoms.
Owing to distinct crystal lattices and molecular structures constructed with the same elements arsenic and sulfur for pararealgar and orpiment,the apparently different spectral features are observed within the terahertz range of 0.2 THz–2.2 THz. The peak positions and intensities for pararealgar are attributed predominantly to the collective oscillation of all molecules in one unit cell, while atoms linked by chain-like shape in orpiment yield the torsional motions parallel or perpendicular to the crystallographicbcplane that dominates a unique absorption pattern of spectral assignments. From an analytical perspective, the latter has a higher vibrational frequency than the former.
4. Conclusions
In this work,the transmissive THz-TDS,ss-DFT,and Raman spectroscopy made a fine combination of measurement and analysis for characteristics of pararealgar(As4S4)and orpiment(As2S3). According to the THz-TDS data in the region of 0.2 THz–2.2 THz,evident absorption peaks are observed in two arsenic-containing sulfide pigments explicitly, which are further identified with Raman spectroscopy.These distinct and characteristic absorption spectra are definitely assigned with rigorous ss-DFT calculations of the crystalline pigments, revealing the essence of lattice vibration at different frequencies.The chemical identity, crystalline structure, and interactions from adjacent molecules collectively contribute to the characteristic vibrational spectra of these pigments. The described method will greatly deepen the understanding of the origin for terahertz spectra of arsenic-containing sulfides pigments, and can be extended to the study of a variety of other artwork pigments.
Acknowledgements
Project supported by the National Natural Science Foundation of China (Grant Nos. 61805129 and 11874245),the National Key Research and Development Program of China (Grant No. 2021YFB3200100), and the Yungang Special Fund of Shanxi Datong University, China (Grant No.2020YGZX005).
- Chinese Physics B的其它文章
- Design of vertical diamond Schottky barrier diode with junction terminal extension structure by using the n-Ga2O3/p-diamond heterojunction
- Multiple modes of perpendicular magnetization switching scheme in single spin–orbit torque device
- Evolution of the high-field-side radiation belts during the neon seeding plasma discharge in EAST tokamak
- Phase-matched second-harmonic generation in hybrid polymer-LN waveguides
- Circular dichroism spectra of α-lactose molecular measured by terahertz time-domain spectroscopy
- Recombination-induced voltage-dependent photocurrent collection loss in CdTe thin film solar cell

