Effects of temperature on drag reduction in a subsonic turbulent boundary layer via microblowing array
Lan XIE, Binghua LI, Yang ZHANG, Yao ZHENG, Jianfeng ZOU
Center for Engineering and Scientific Computation, and School of Aeronautics and Astronautics, Zhejiang University,Hangzhou 310027, China
KEYWORDS Drag reduction;Dynamic mode decomposition;Micro-blowing;Turbulent boundary layer;Vortex
Abstract A comparative study of two micro-blowing temperature cases has been performed to investigate the characteristics of drag reduction in a subsonic flat-plate flow (where the freestream Mach number is 0.7) by means of Direct Numerical Simulation (DNS). With minute amount of blowing gas injected from a 32×32 array of micro-holes arranged in a staggered pattern,the porosity of micro-holes is 23%and the blowing coefficient is 0.125%.The simulation results show that a drag reduction is achieved by micro-blowing, and a lower wall-friction drag can be obtained at a higher blowing temperature. The role of micro-blowing is to redistribute the total kinetic energy in the boundary layer, and the proportion of stream-wise kinetic energy decreases, resulting in the thickened boundary layer. Increasing micro-blowing temperature can accelerate this process and obtain an enhanced drag reduction. Moreover, an explanation of drag reduction by microblowing related to the micro-jet vortex clusters is proposed that these micro-jet vortex clusters firmly attached to the wall constitute a stable barrier,which is to prevent the direct contact between the stream-wise vortex and the wall. By Dynamic Mode Decomposition (DMD) from temporal/spatial aspects, it is revealed that small structures in the near-wall region play vital role in the change of turbulent scales. The high-frequency patterns are clearly strengthened, and the lowfrequency patterns just maintain but are lifted up.
1. Introduction
In the field of aerodynamics, one of the biggest challenges is the reduction of wall friction, especially for turbulent flow.In order to obtain a good effect of drag reduction on the aircraft surface, a Micro-Blowing Technique (MBT) for the active control was proposed by Hwangof NASA Glenn Research Center (GRC). By means of artificially introducing an extremely small amount of air injected through a series of micro-scale holes into the near-wall turbulent flow field, the skin-friction drag reduction can be achieved.
In the recent decades, a series of experiments conducted by Hwang and coworkers,show that the MBT can provide significant turbulent skin friction reduction for both subsonic and supersonic flows. Especially, the amount of reduction (up to 90%) is much greater in supersonic flow than that in subsonic flow.The effect of different geometric parameters from perforated plate configurations(e.g.porosity,hole-diameter,roughness, hole-shape, etc.) has been studied extensively.The experimental results prove that the skin friction drag of perforated plate PN2 and PN3 is much smaller than that of GAC1897 plate without blowing.In the case of low freestream Mach number, the PN2 plate has better efficiency in drag reduction. With the enhancement of blowing fraction from 0 to 0.00287 through a porous plate, the drag reduction rate of skin fiction increases gradually, but it will eventually tend to be steady. Furthermore, a skin friction reduction of 50%-70%is confirmed on an aircraft engine nacelle which operates at Mach number of 0.8 and an altitude of 35000 feet(1 feet=30.48 cm).Kornilov & Boikoof Russian Academy of Sciences found the similar conclusion of drag reduction in the subsonic low-turbulence wind tunnel experiments. They reported that the micro-blowing uplifts the average velocity profile of the boundary layer and the displacement thickness grows linearly along the blowing area.A consistent reduction of the local skin friction drag in the downstream area without micro-blowing control is still observed.This is explained to be the ‘‘memory” of the micro-blowing gas. Thus, by arranging non-continuous micro-perforated plate, it can significantly improve control efficiency and the overall drag reduction rate can be increased to about 15%–25%.
The understanding of micro-blowing mechanism in drag reduction is quite necessary for further engineering application. In the limitation of experimental measurement and visualization technology in current, a few small-scale flow structures like micro-jet or vortex below 0.1 mm scale cannot be effectively identified in the turbulent boundary layer. The interactions between those micro-hole jets and the near-wall turbulent structures are difficult to be directly explained from the limited experimental results. Numerical simulation provides a good means to enrich the data used to describe the temporal and spatial evolution of wall turbulences.
Numerical parametric investigations of MBT through micro-porous walls were simulated to try to characterize aerodynamic features and the law of drag reduction by Li et al.Their numerical results reveal that the effect of micro-blowing is only limited in the viscous sub-layer,and the area affected by blowing not only surrounds the micro-holes, but also will extend a short distance downstream, when the blowing intensity enhances.Further, numerical studies on the applications of MBT to a supercritical airfoil were performed in their works.It is found that the micro-blowing reduces the skin friction through decreasing the velocity gradient of viscous sublayer,and a larger drag reduction will be achieved if the blowing is on the leading edge of the airfoil instead of the trailing edge.While reducing drag,it also increases lift in the typical micro-blowing configuration with a blowing fraction 0.05.Different from Favre´-averaged method with the Shear Stress Transport(SST)turbulent model,a Direct Numerical Simulation (DNS) of turbulent flat-plate boundary layer was performed in our previous works.Without considering the micro-blowing channel,the blowing can be easily implemented by imposing boundary condition. Compared with the smooth flat-plate flow, the micro-blowing thickens the viscous sublayer and uplifts a few properties of boundary layer such as mean velocity profile, stream-wise vorticity and stream-wise velocity fluctuation. It brings out the drag reduction of local skin friction,and the increase of the stream-wise turbulent fluctuation.Additionally,the micro-jets create an impingement on the near-wall vortices,so a large number of small-scale broken vortices are observed.
In current study, the impact of micro-blowing temperature on the drag reduction is simulated by DNS through the comparison of two temperature conditions. The difference of heat boundary layer caused by micro-blowing temperature and its impact on the turbulent velocity boundary layer and associated skin friction drag should be emphasized. Based on Newton’s internal friction law, the wall friction drag is dominated by gas viscosity and near-wall velocity gradient. Our initial idea is to change the gas viscosity by controlling temperature,in order to improve the efficiency of micro-blowing control.However, temperature will not only affect the gas viscosity,but also restrict the transfer and exchange of energy in the boundary layer, which complicates the optimization of drag reduction.
Zonta et al.numerically studied the effects of temperature-dependent fluid viscosity on turbulent behavior in a turbulent channel flow.The cold and heated temperatures were imposed on the upper and bottom wall of a channel,respectively. Their results showed that the raising viscosity near the cold wall promotes turbulence. The near-wall turbulent characteristics such as streak and sweep/ejection events were dramatically altered. Different from the turbulent channel flow, Lee et al.conducted a DNS study to investigate the influence of wall heating on the spatial developing turbulent boundary layer with temperature-dependent viscosity.The viscosity inside the thermal boundary layer is decreased over heated wall caused by the liquid water. Despite this, the near-wall dissipation is enhanced due to the viscosity stratification, resulting in a larger energy transfer towards the wall.They found that the skin friction drag is reduced by an increment in the wall temperature. The turbulent Reynolds shear stress makes a biggest contribution to the drag reduction by Fukagata Iwamoto Kasagi (FIK) identity of drag decomposition.This is also concluded from the weakening of Q2 and Q4 events of the Reynolds shear stress and the outer vortical structures over the heated walls based on quadrant and octant analysis.For the compressive turbulent boundary layer,Shadloo et al.found that although the cold wall temperature brings about a low viscosity, the mean stream-wise velocity gradient near the wall is significantly enhanced. The skin friction coefficient increases by a decrease of wall temperature.The similar conclusion can also be drawn by Duan et al.,Shahrb et al.and Sharma et al.However,their works did not focus on the analysis of drag reduction.
The purpose of the current study is to investigate the drag reduction by changing the temperature of micro-blowing gas,and how to affect the physical properties of the near-wall fluid.The flat-plate turbulent boundary layer in subsonic is resolved by DNS.The micro-blowing control is conducted in the developed turbulent region where a certain momentum gas is ejected from an array of micro holes.Two temperature conditions for micro-blowing gas are considered, which are both lower than the temperature of free inflow. The influence of blowing heating on the skin friction drag, flow average properties and turbulent behavior are examined thoroughly.
2. Methodology
2.1. Control equations of Newtonian fluid
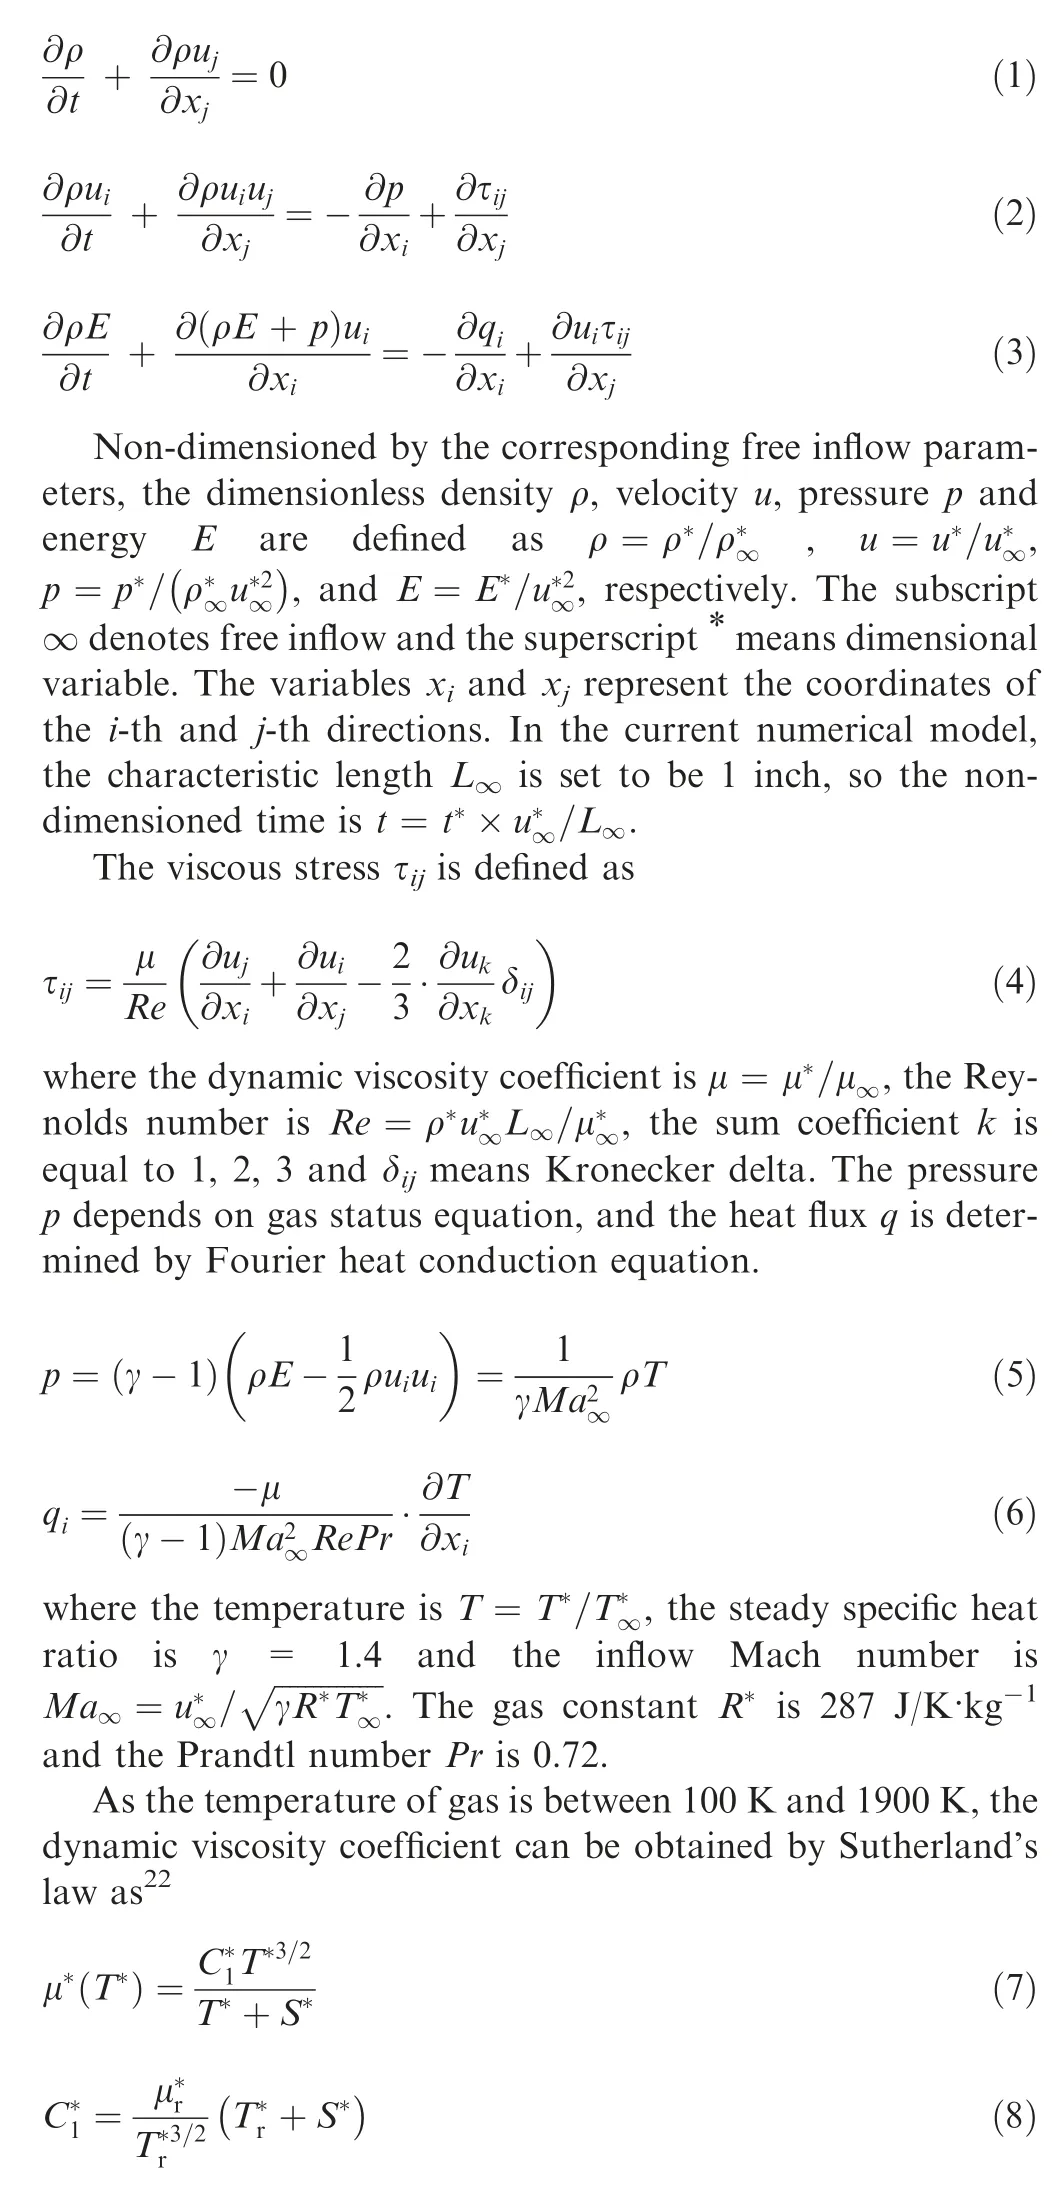
The law of Newtonian fluid motion can be characterized by Navier-Stokes (N-S) equations, including mass equation,momentum equation and energy conservation equation, as follows:

2.2. Physical problem
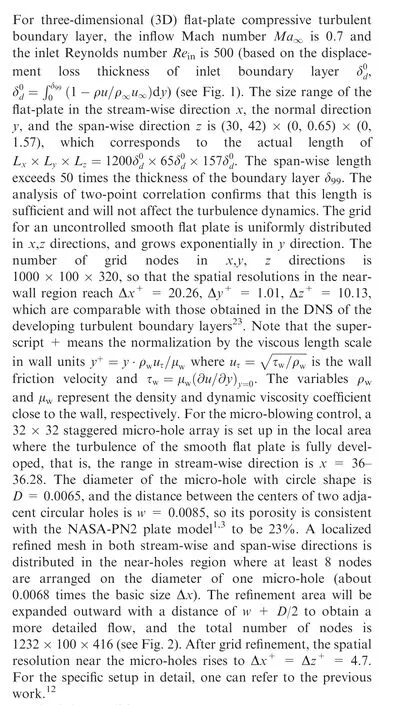
The inlet conditions are ρ= 1.0, u= 1.0, v= 0,w= 0, T= 1.0. The non-slip wall temperature Tis 1.098 which exceeds the inflow temperature,and thus a heated boundary layer will generate near the wall. The wall-normal boundary and the flow outlet boundary are set as nonreflective conditions, and the span-wise direction is periodic.The density ratio of micro-blowing gas to free inflow is ρ/ρ= 1.2. The blowing coefficient F is taken as 0.0015(F = ρv/ρu, where vrepresents the normal blowing velocity), which is equal to 0.125% of the inflow velocity.Two different blowing temperatures T= 0.868 and 0.937 are chosen to compare with the uncontrolled case.The change of gas molecular viscosity with temperature satisfies the Sutherland’s law.
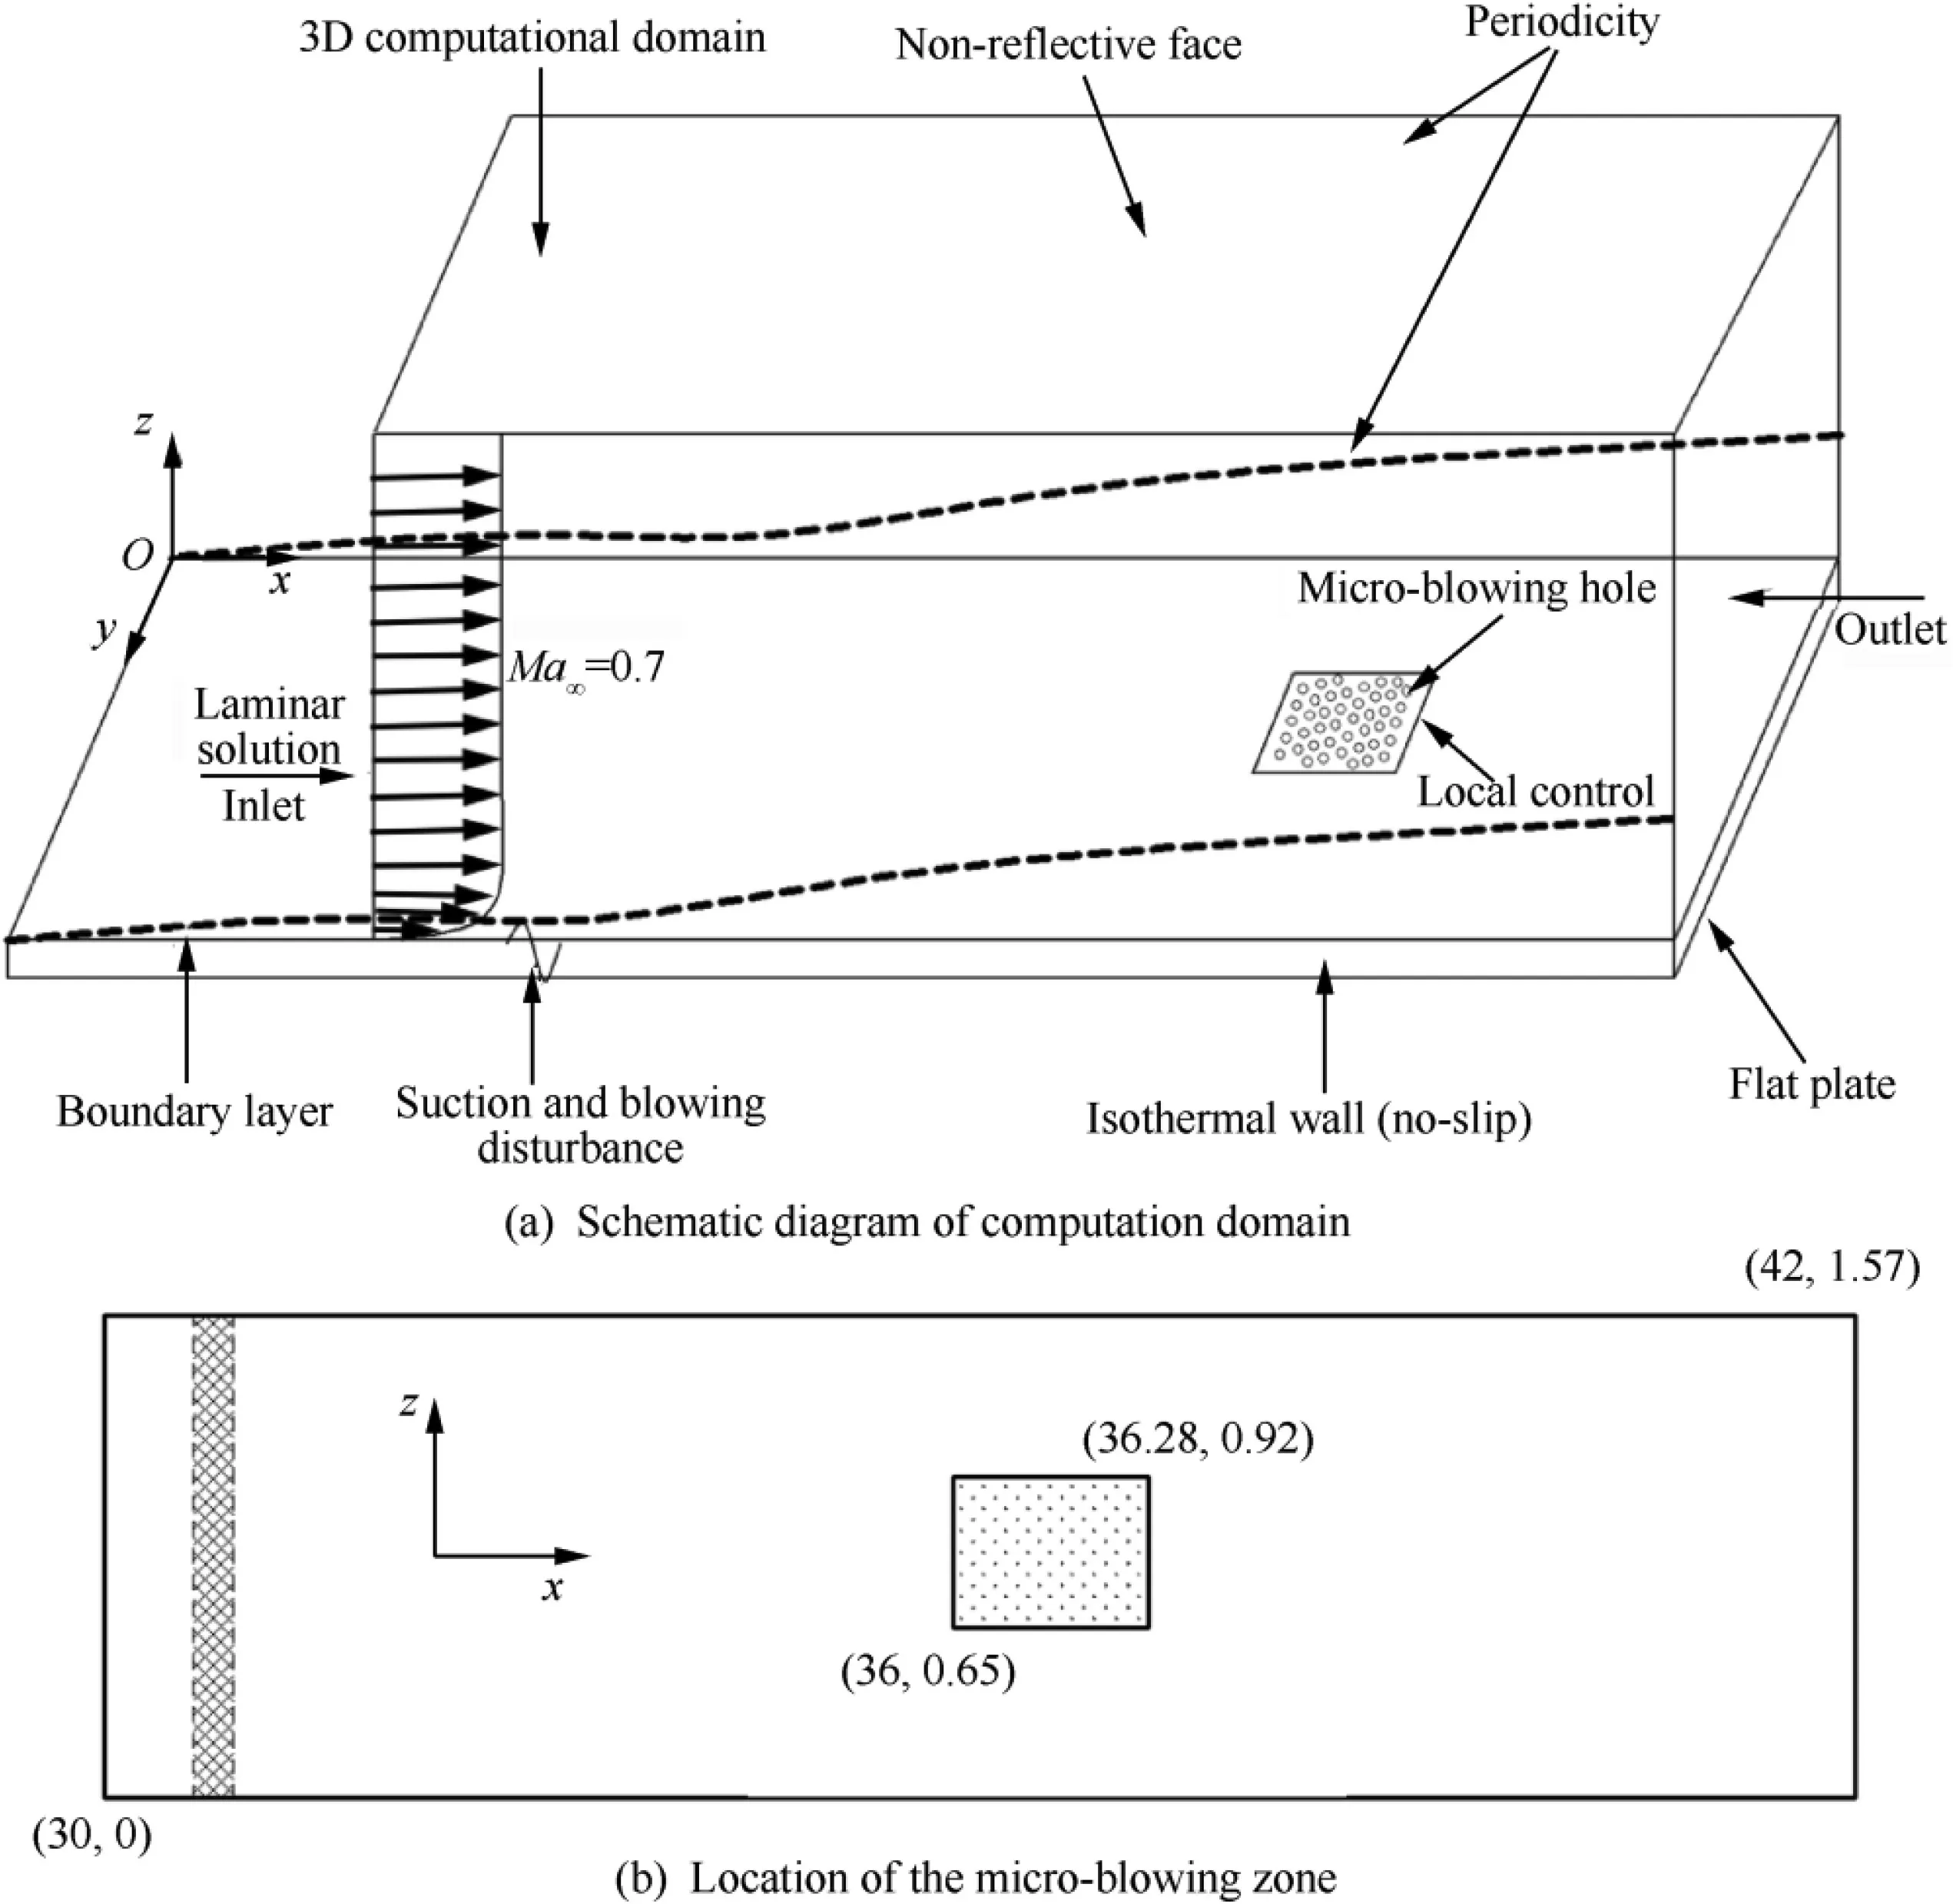
Fig. 1 3D flat plate model.
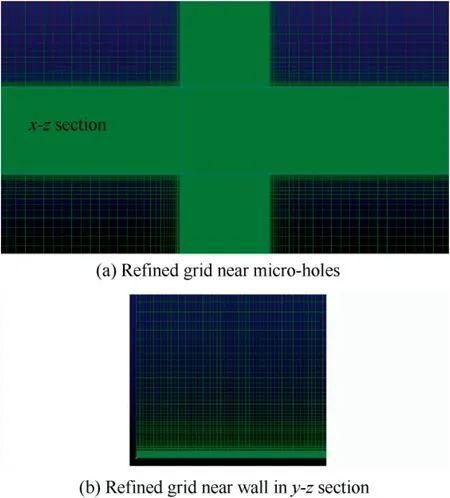
Fig. 2 Schematic diagram of grid distribution in different sections.
The calculation procedure adopts the compressible highorder finite difference solver Hoam-OpenCFD developed by Li et al.from Institute of Mechanics, Chinese Academy of Sciences. The convection term and diffusion term are processed by a 7th-order upwind scheme and 8th-order central difference scheme respectively,and a three-step 3rd-order Runge-Kutta method is conducted for time advancement. For the details of numerical algorithms and run code, please refer to previous studies.
2.3. Dynamic mode decomposition
A data dig and feature extraction technique of DMD(Dynamic Mode Decomposition) is utilized here to deeply study the coherent structures and their reforms with different temperatures of MBT.DMD technique,which emerged about ten years ago with the seminal contributions of Schmidand Rowley & Dawsonet al., is a well-known feature identification method in the field of fluid dynamics,and importantly it is a pure data-driven(equation free)manner.A lot of variants of DMD have been developed to identify the meaningful flow patterns in both the experimental and numerical flow data.The process of information extraction and flow reconstruction is introduced in details.
Consider a sequence of instantaneous flow fields, or data snapshots v(t)of magnitudes, e.g. velocity, pressure, Reynolds shear stress, etc., indexed from 1 to N. These snapshots are often the solutions of a (possibly non-linear) dynamic system given by



Both the reduced DMD modes yand the associated eigenvalues/Ritz values μare obtained by solving the eigenvalue problem Ay=μy. Approximated eigenmodes of the matrix A are recovered through projection onto the original space,that is, φ= Uy. With uniform time interval Δt, the growth rates and frequencies in the complex half-plane are given as λ= lg (μ)/Δt, which we obtain from relation μ= e.
The j-th snapshot can be expanded on the DMD basis as

The matrix counterpart of the previous expression is given by

As for the spatial DMD,to avoid repetition,t in Eq.(9)can also stand for the snapshots distance in spatial view. Thus, all tcan indicate the spatial coordination along the developing direction of the flow field, and then the frequency can be converted as the wave-number from the space perspective.
3. Results and discussion
3.1. Skin friction drag

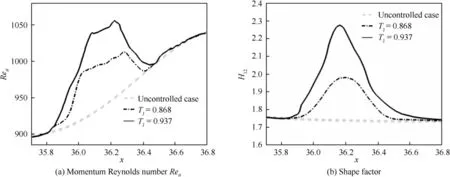
Fig. 3 Spatial evolution of the turbulent boundary layer at different micro-blowing temperatures.
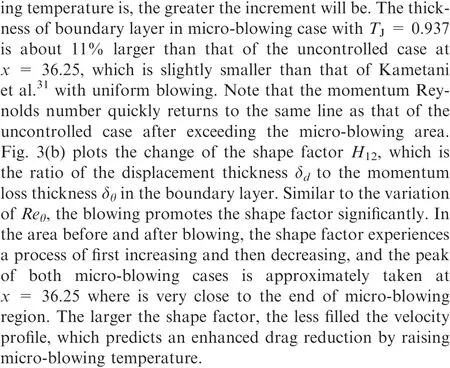
The wall-friction drag coefficient c=τ/(ρu/2),where τstands for the wall shear stress,is plotted in Fig.4.For the uncontrolled case,with the transition from laminar to turbulence at the beginning stage,the skin friction drag gradually increases(see Fig.4(a)).When the flow develops into a full turbulence, the friction coefficient slowly decreases along the stream-wise direction. The simulation results match well with the empirical formula, c= 0.0024Re, but are slightly lower than that of Wu&Moin.This is due to the coarse grid scale Δxused in our calculation.Their relative error is within 3%.The detailed analysis of uncontrolled case can be found in Ref.12.In Fig.4(b),the comparison of the friction drag coefficient displays that the micro-blowing reduces the wall surface friction drag, and its local maximum drag reduction rate, R,reaches 40%, just like the statistics in Refs. 1,3,5. As the micro-blowing temperature rises, the drag reduction will be enhanced further. Moreover, the impact of drag reduction is not only limited to the control area, but also extends downstream,so that some discontinuous blowing methods were proposed to improve energy-saving efficiency.It is because the friction drag cannot be restored to its original state immediately when the blowing control is lost.The total drag reduction rate on the whole flat plate, R, is defined by using the global skin friction drag coefficients, C, as

where Cand Cdenote the integral friction coefficients on the whole flat plate with and without micro-blowing, and the product of Land Lis the area of the plate. In Table 1,approximately 2.6%total drag reduction rate in the whole flat plate flow is achieved by micro-blowing with T= 0.868 in present study, and it will improve to be 2.9% when the micro-blowing temperature increases to be T=0.937.Kornilov and Boikotested the permeable flat-plate and acquired the local maximum drag reduction rate of 71%, which is larger than the current DNS results due to their use of greater blowing fraction 0.182%-0.228%.
3.2. Average velocity field
The Van Driest transformed mean velocity profiles U-yin three cases are shown in Fig. 5. The capital letter U indicates the average variable, which is obtained by averaging both in time and span-wise space. The grey circle symbols are the DNS result of uncontrolled flat-plate flow, which follow the linear profile(U=y)in the viscous sub-layer and the classical logarithmic law(U=2.5lny+5.0).However,the logarithmic profile is not proper for the micro-blowing cases.The trend of upward shift is observed in the logarithmic layer,and the higher the micro-blowing temperature, the greater the offset. As Tgrows, a pronounced increase of Uin the same location yof logarithmic layer compared with the basic uncontrolled distribution occurs,the increase being stimulated by a large decrease of the wall friction velocity u. Naturally the wall shear stress τdecreases,and an enhanced drag reduction is obtained in the high micro-blowing temperature. The contours of average velocity in the near-wall region are plotted in Fig.6.The statistical variables(U,V,W)denote the average velocities in x,y, z direction.
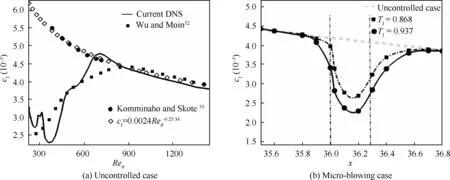
Fig. 4 Local skin friction coefficients.

Table 1 Local and total drag reduction rate.
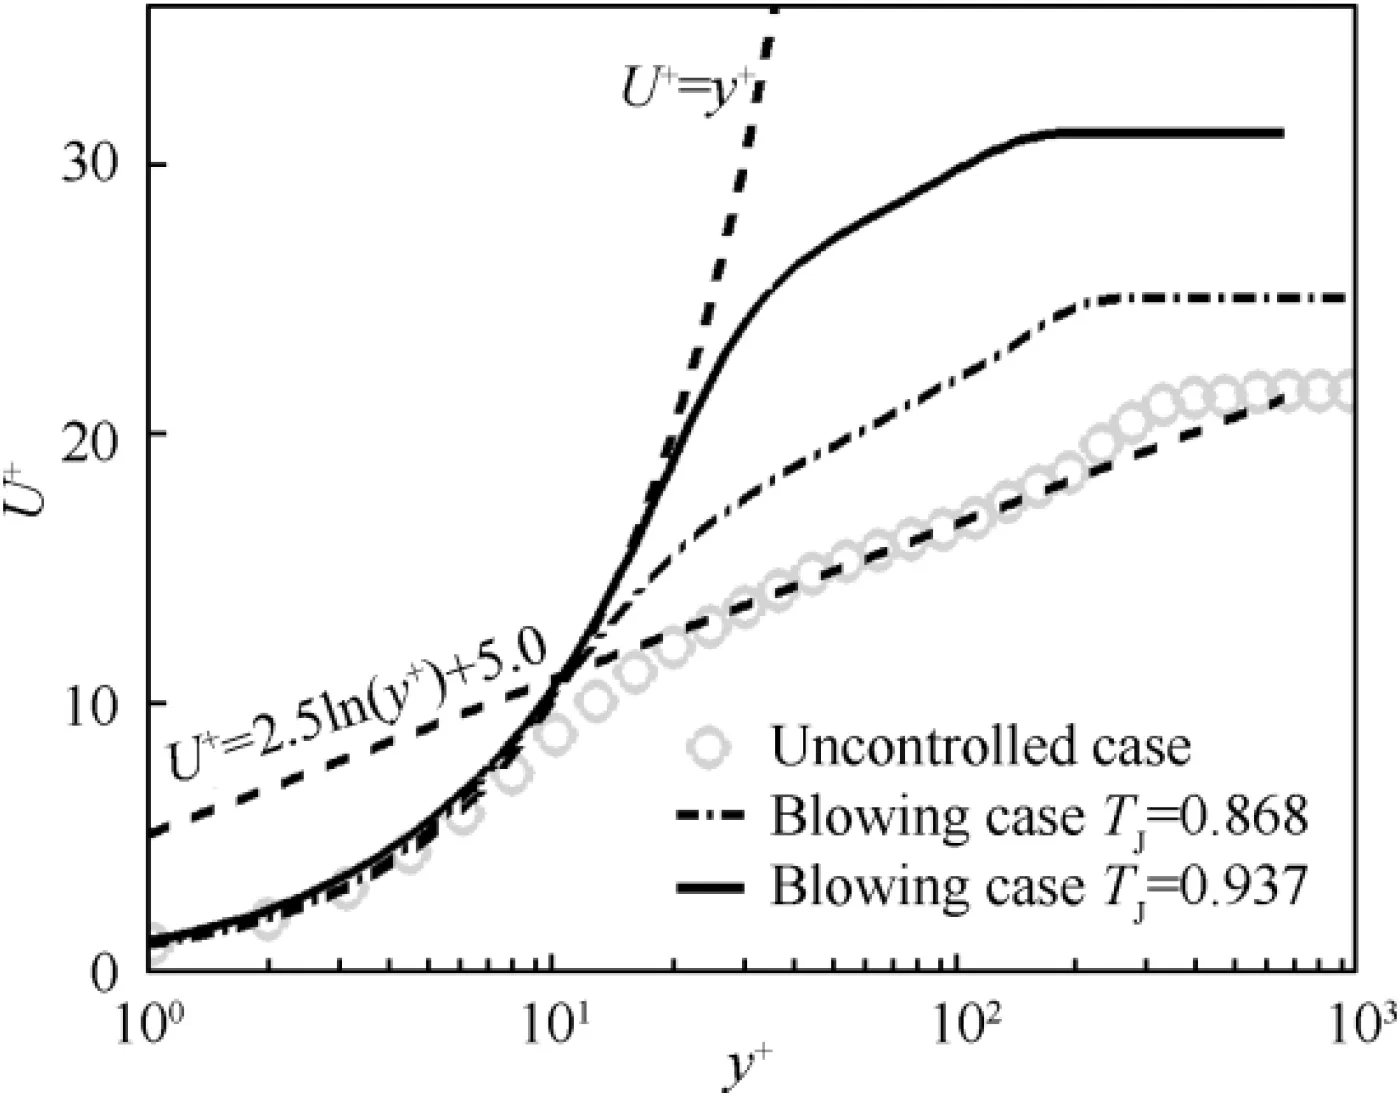
Fig. 5 Van Driest transformed mean velocity profiles in local wall units.
From the visualization of U, the rise of the micro-blowing temperature significantly thickens the boundary layer.It brings about a decrease of the velocity gradient in the boundary layer,and thus the drag reduction will be improved when the microblowing temperature increases. It is a very intuitive explanation given in terms of the shape and thickness of the boundary layer. In the research of Lee et al.and Kramer et al.,the increase in the thickness of the boundary layer caused by the heating of the wall is proved to be a key factor in the reduction of friction drag. The shape of boundary layer appears to be a trend of‘‘rising first,and then falling”along the flow direction.This is because the vertical force by micro-blowing causes the near-wall gas to deflect upwards.When the inflow gas encounters the vertical drag force of blowing area, its stream-wise velocity becomes slow. Thus, the low-speed air flow gradually accumulates in the near-wall region,resulting in the thickening of the viscous sub-layer and a decrement of wall skin-friction drag. Moreover, the higher the micro-blowing temperature is, the more the stream-wise kinetic energy component of boundary layer decreases, which indicates an enhanced drag reduction. In the contours of V, a ‘‘wick-like” high-speed region appears above the micro-blowing area obviously. The maximum normal velocity is 0.017 and 0.047 in two cases of T= 0.868 and 0.937, respectively. It far exceeds the normal velocity of micro-blowing with v= 0.00125. This means that with the injection of a small amount of energy by microblowing, the total kinetic energy in the boundary layer has been redistributed, and the proportion of normal kinetic energy is increased, which is far more than the normal input energy. Moreover, the higher temperature of micro-blowing brings about a larger ‘‘wick-like” area and a stronger normal kinetic energy. The span-wise velocity W also has a similar change by increasing the blowing temperature, but the spanwise momentum component in the boundary layer is relatively small overall, so the difference is not obvious.
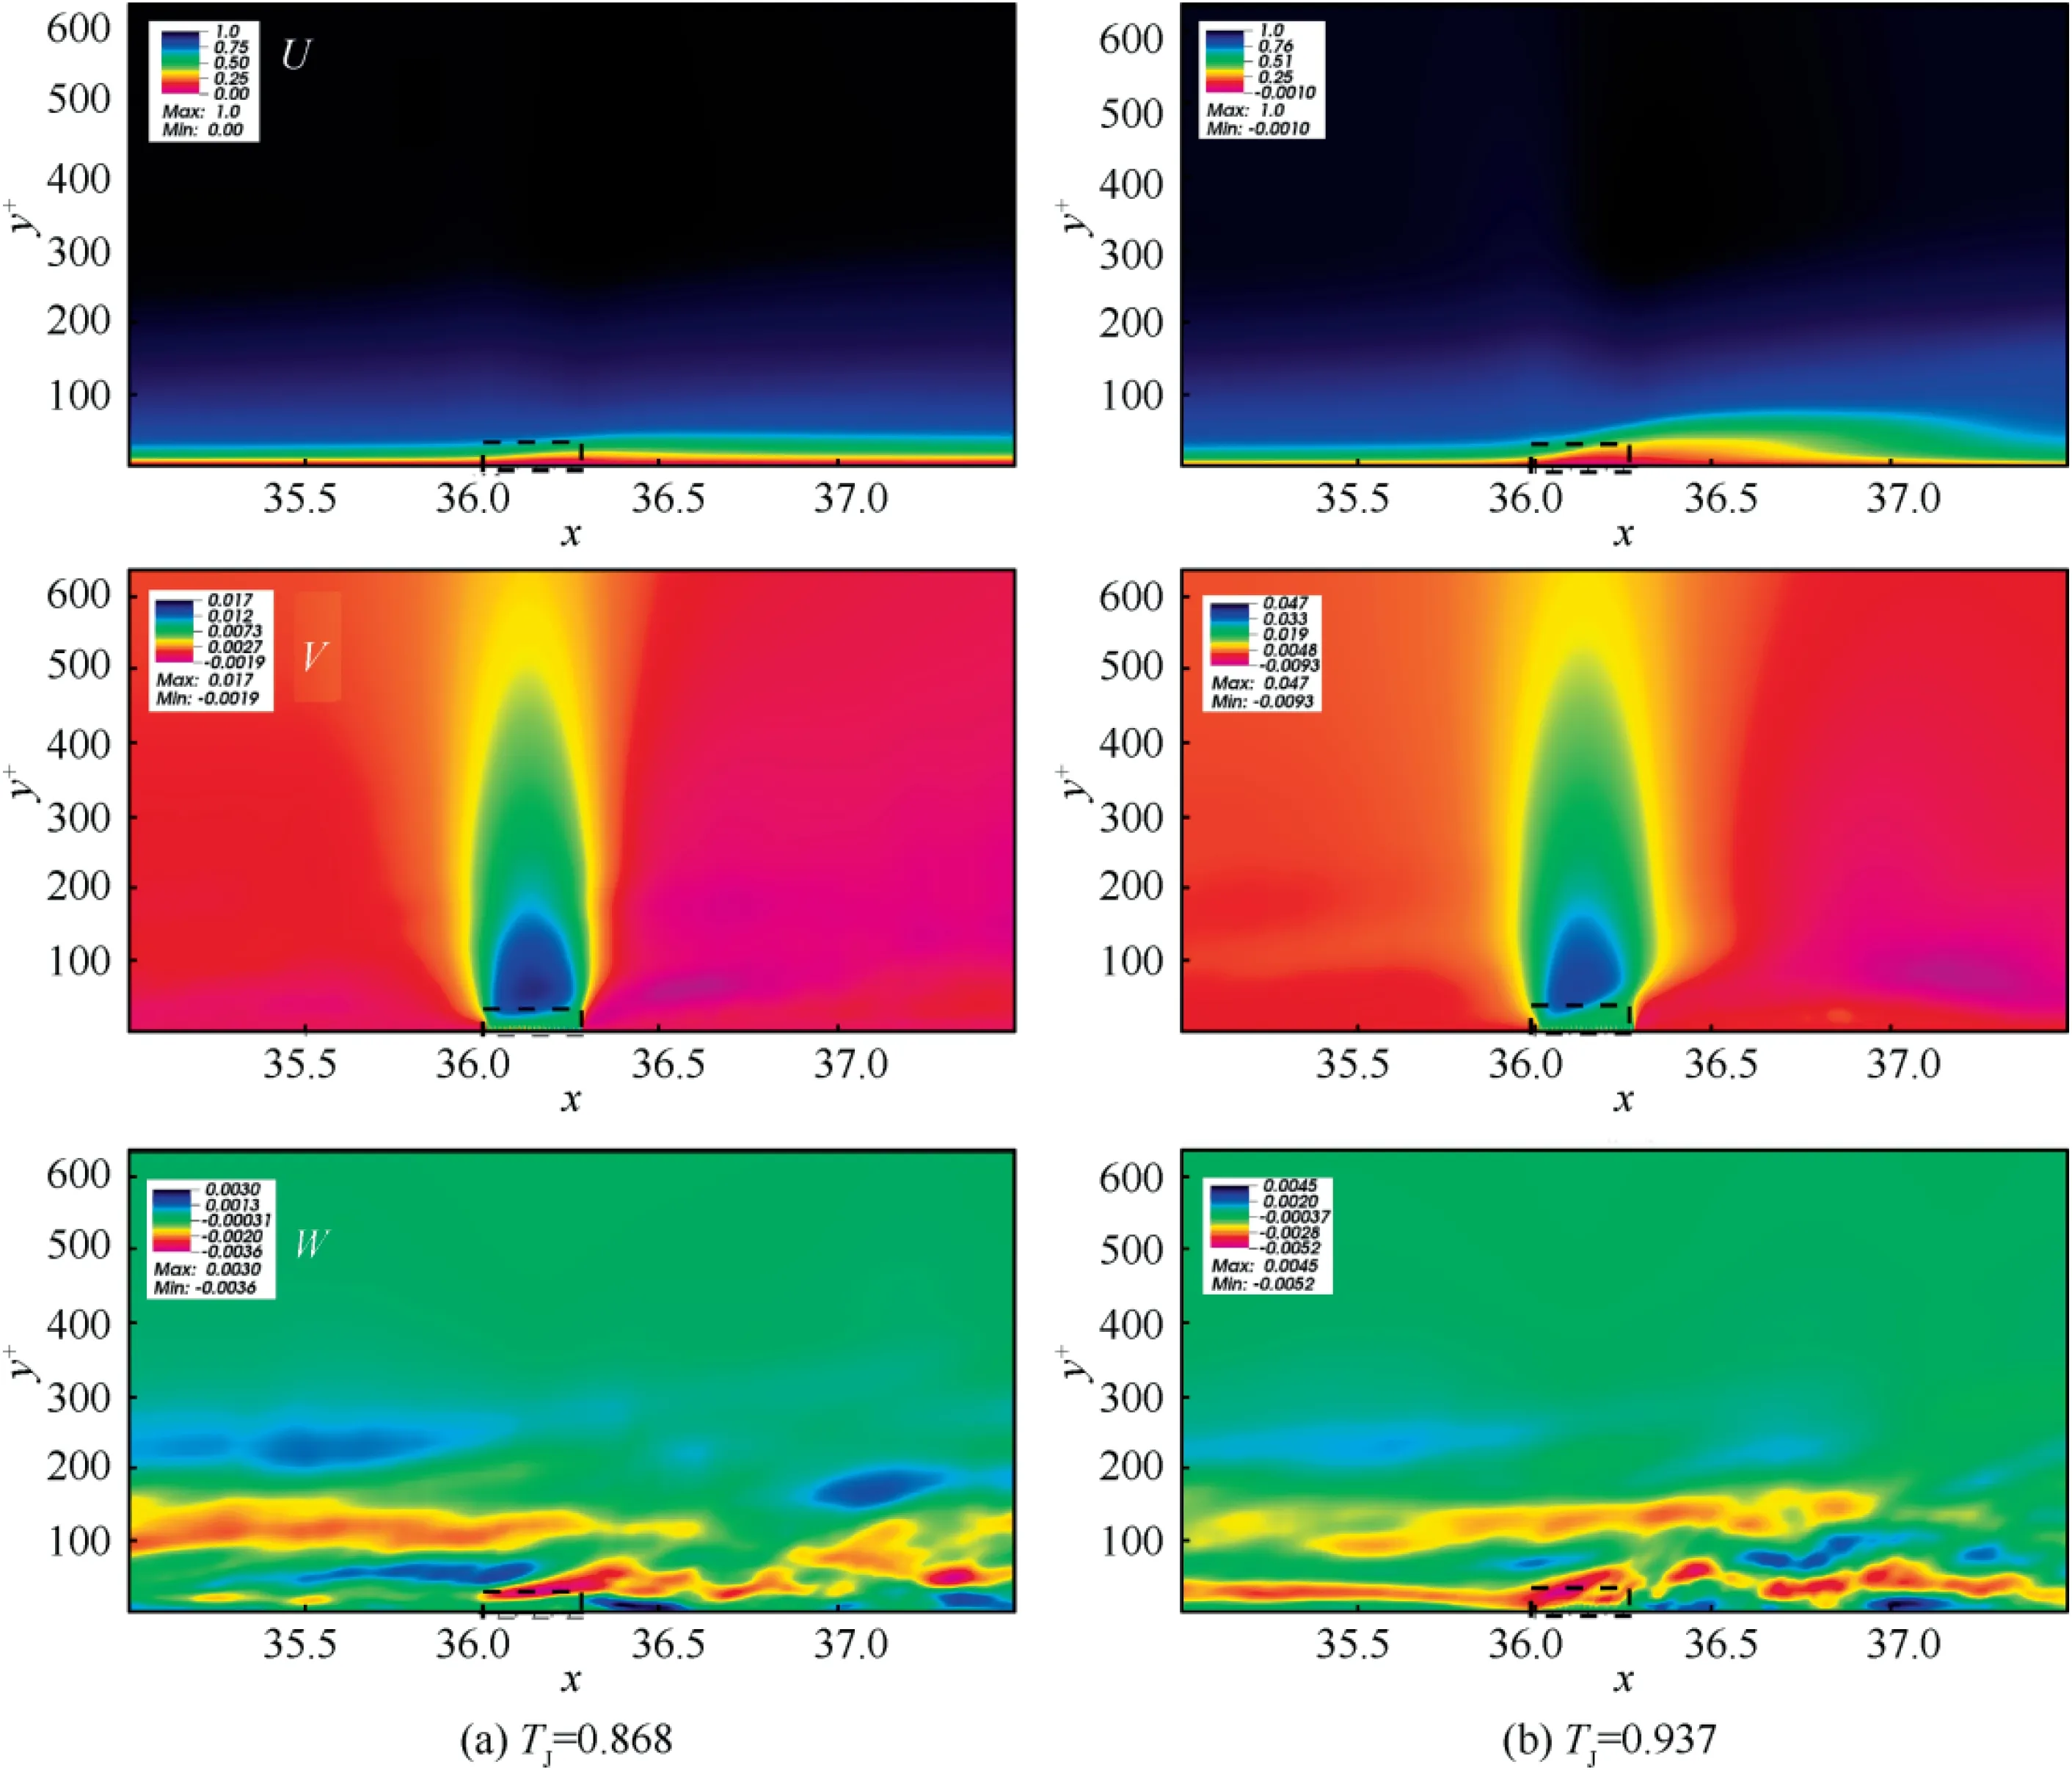
Fig.6 Contours of average velocity (the black dotted line represents the micro-blowing area;the vertical coordinate y+normalized by the viscous length scale at x = 35.4 before blowing area).

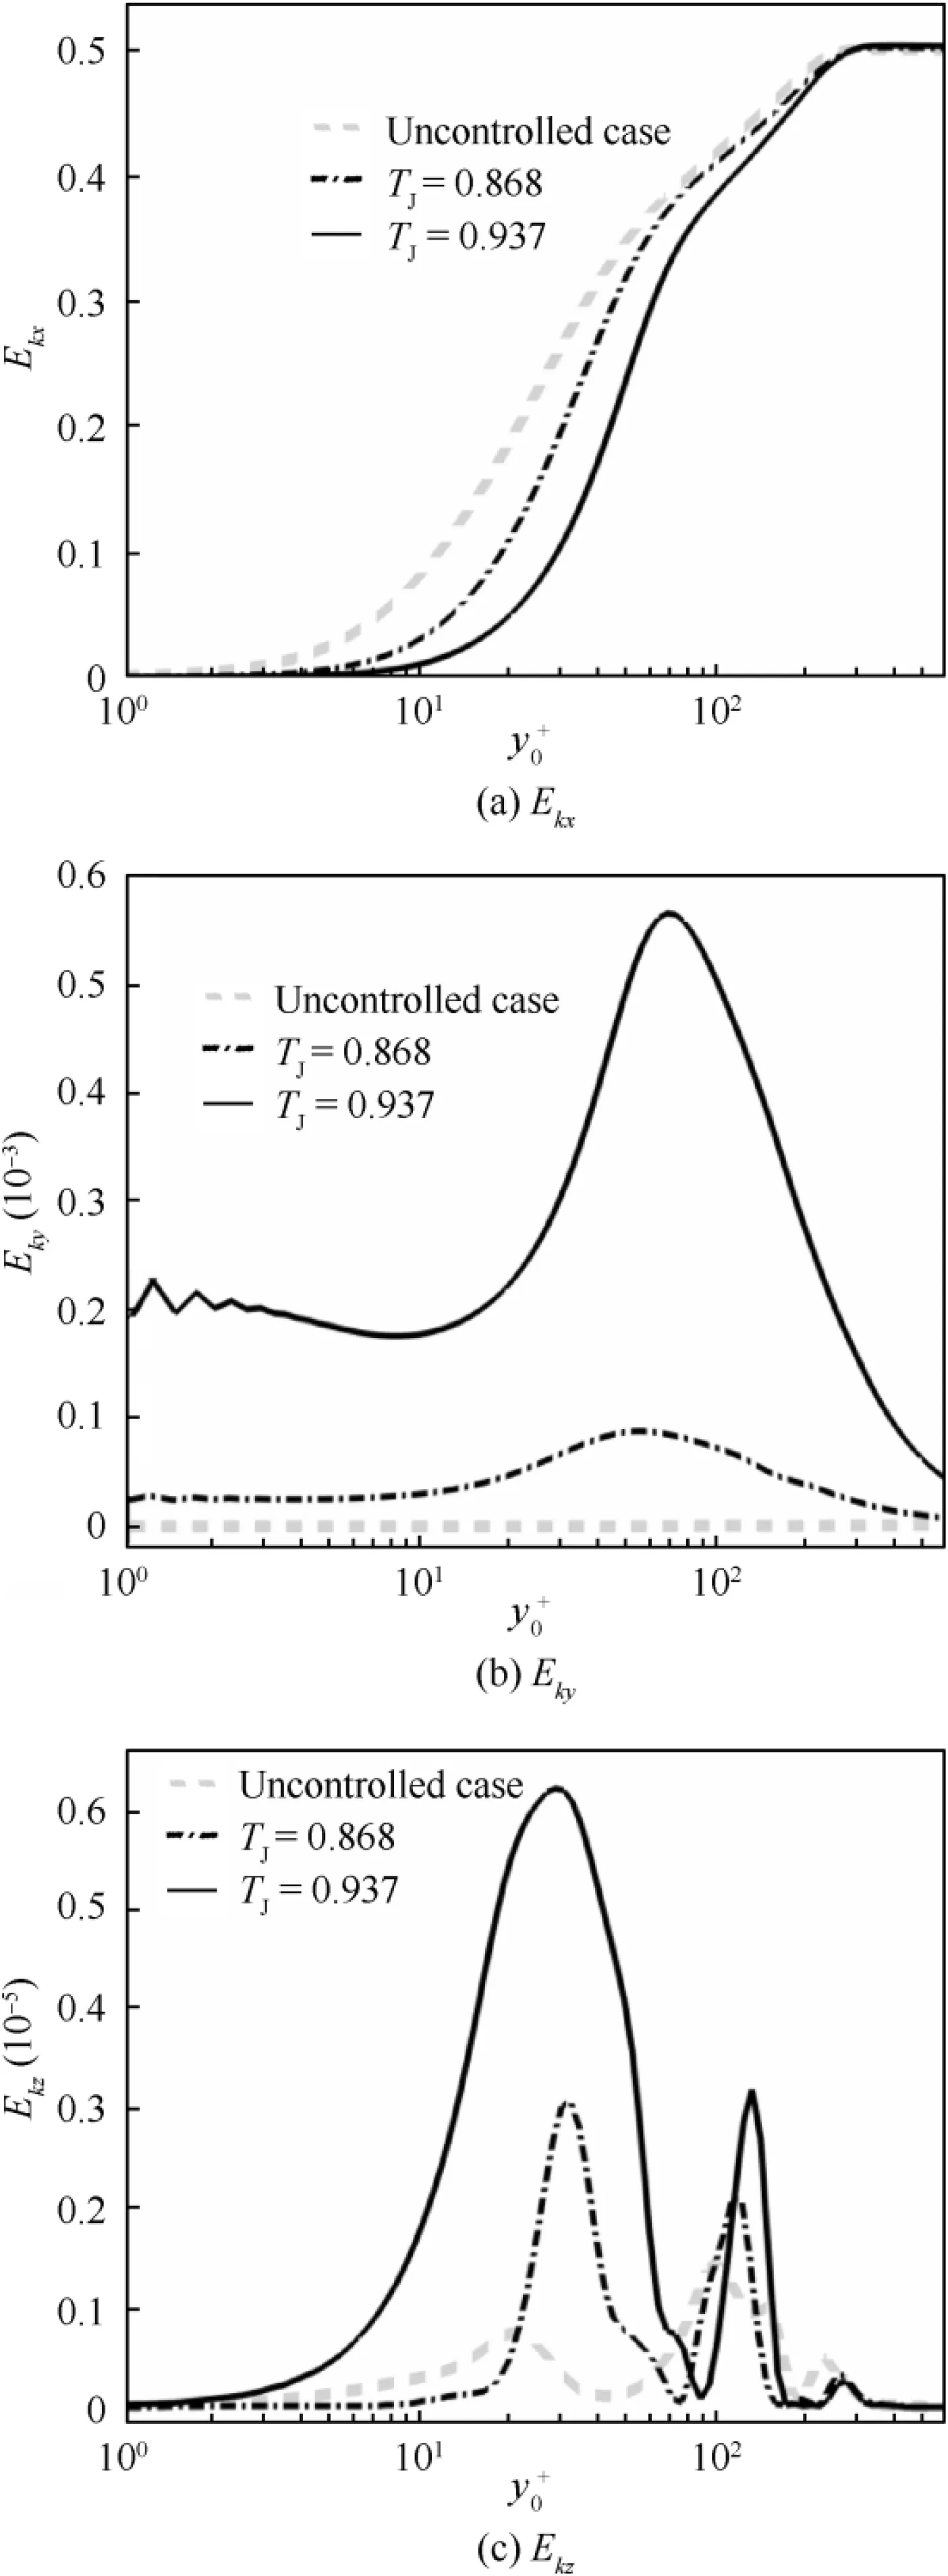
Fig. 7 Distribution of kinetic energy components.
The components of flow kinetic energy in three directions,E(i = x, y, z), are statistically averaged in the microblowing area S,plotted in Fig.7.In Eq.(18),the variables,sand s, are the side lengths of blowing area and t is average time. The x-coordinate yis normalized by the viscous length scale in wall unit at x = 35.4 before blowing area. It is found that the stream-wise component, E, is decreased by microblowing and the heated blowing with high temperature will aggravate this decline. Moreover, the gradient of stream-wise kinetic energy in the viscous bottom becomes smaller in T= 0.937, and thus the wall shear stress is reduced more.Instead, the normal and span-wise components (E, E) are greatly enhanced, although their values are still very small relative to E.For the two micro-blowing cases with T=0.868 and 0.937, their peak points of normal component are obtained at y= 55 and 70, respectively, and their peak values differ by about 5.5 times. This means that the heated micro-blowing gas with T=0.937 has a stronger penetration depth to the mainstream, so the vertical blowing at high temperature prevents the inflow from moving downstream more intensely.
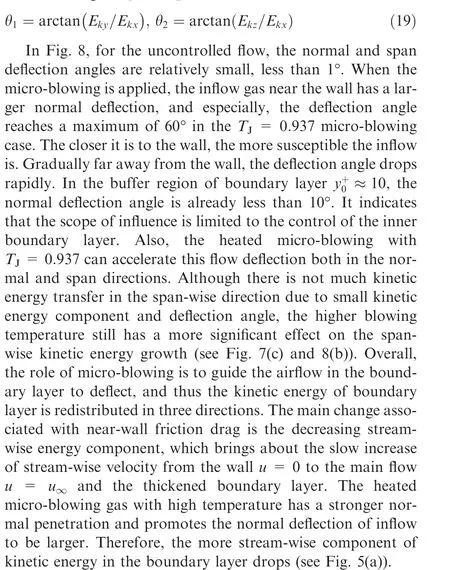
In order to describe the deflection of inflow towards the normal and span-wise directions with micro-blowing,two flow deflection angles θand θare defined as
The streamline distributions near the micro-blowing region are shown in Fig. 9. As analyzed above, the micro-blowing streamlines with higher temperature have a larger normal velocity component in the same blowing velocity. Spontaneously, it brings about a deeper penetration in the wall normal direction. Moreover, the energy of the front jet gradually accumulates and superimposes in the back, which causes a greater normal penetration of the back jet. That’s why the normal distribution of kinetic energy rises with the heated micro-blowing.
3.3. Average temperature field
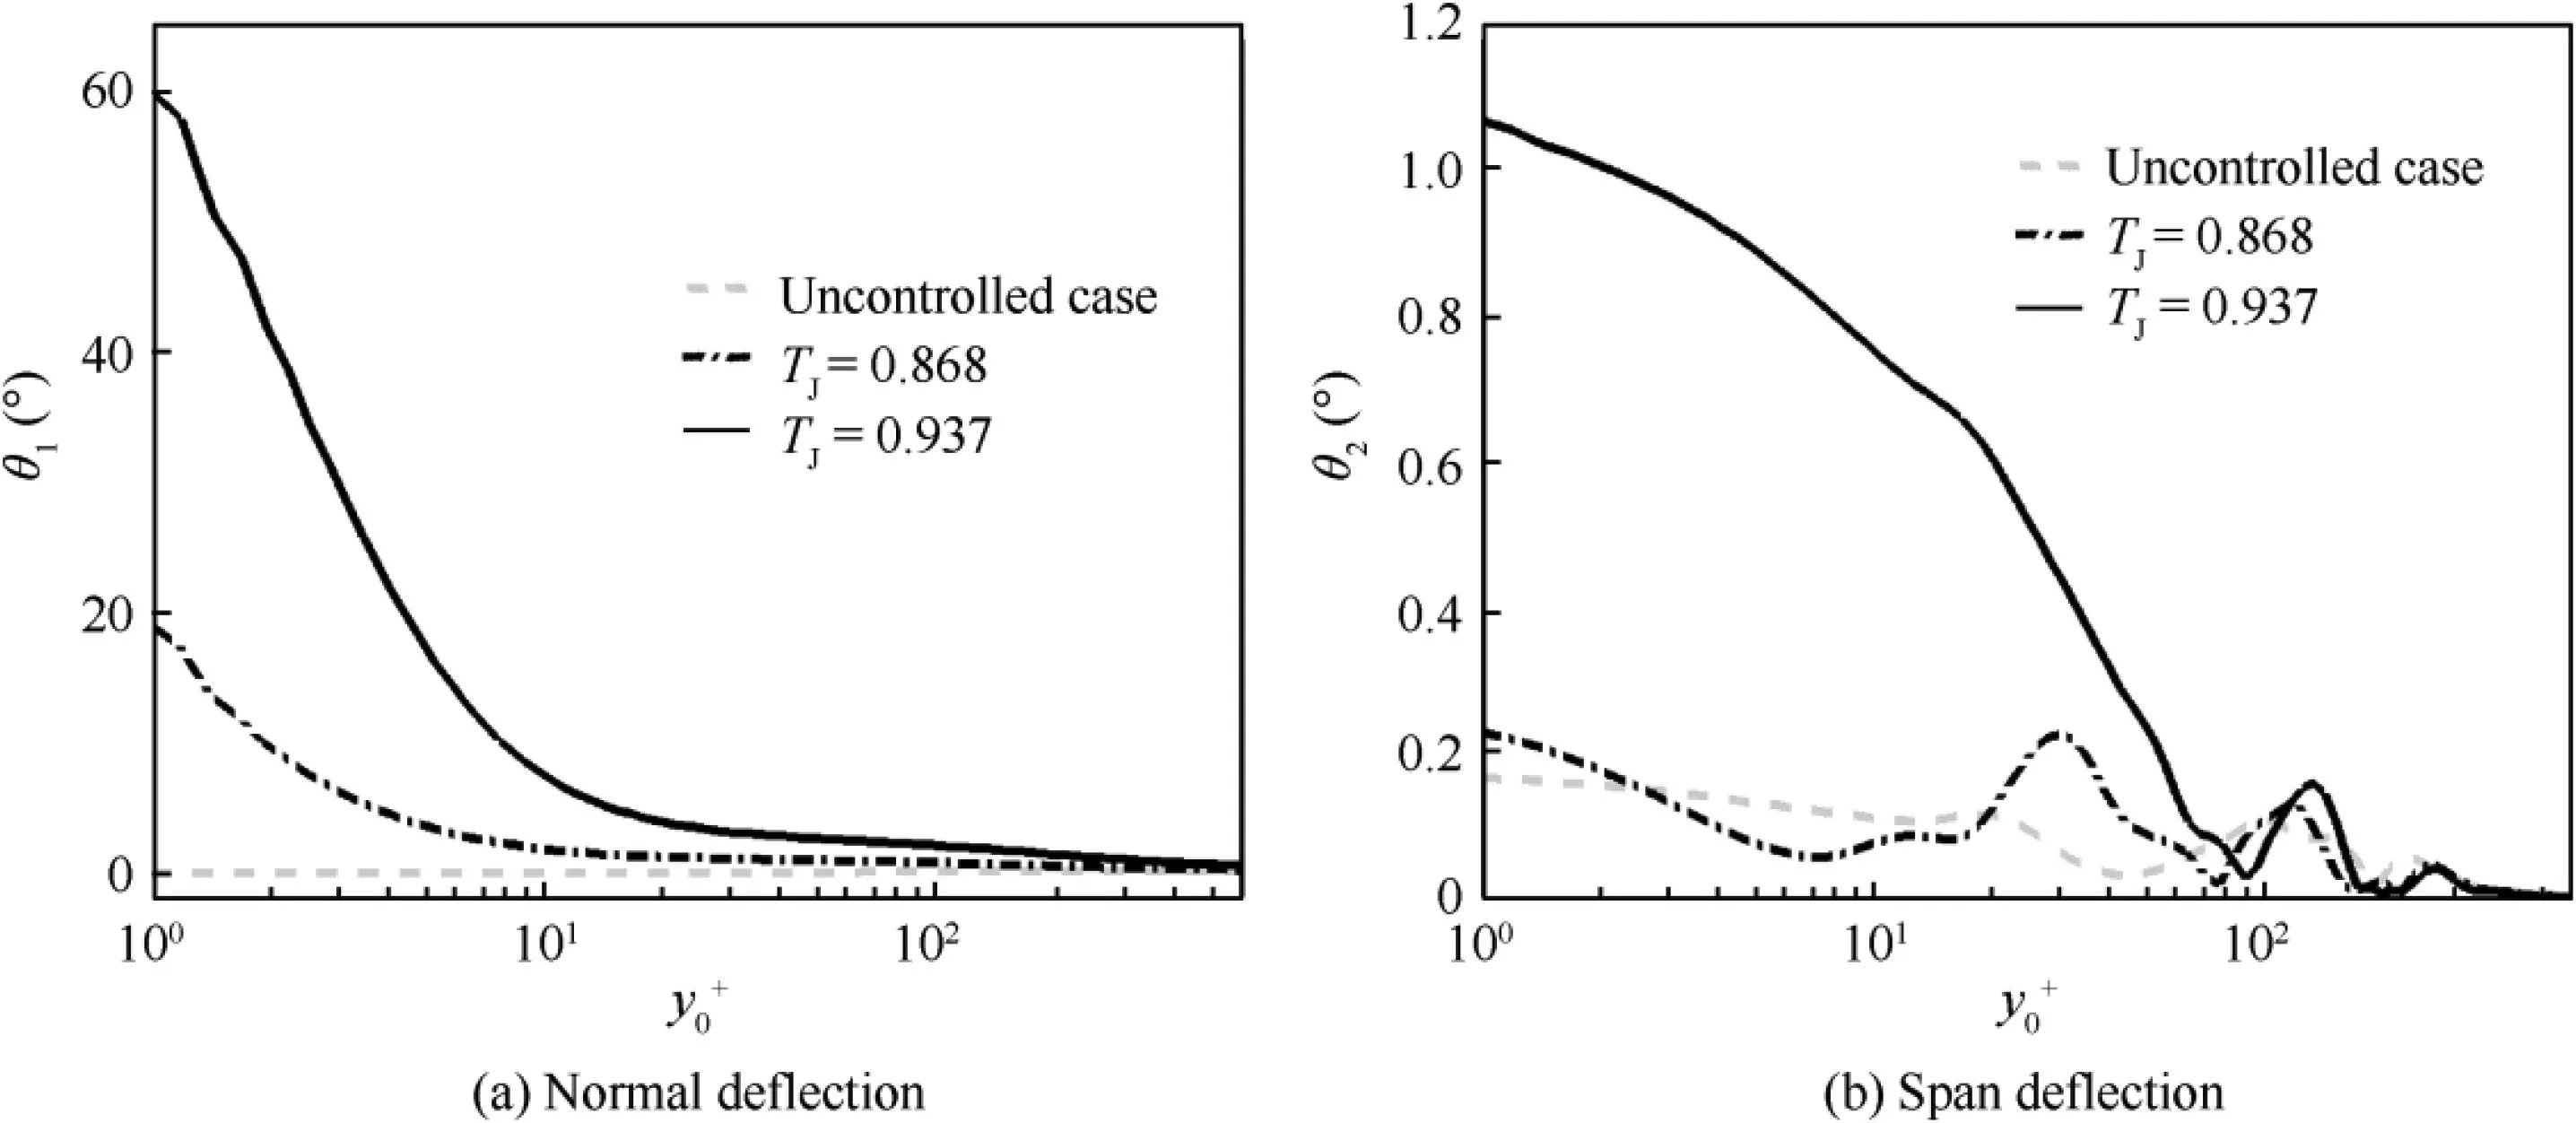
Fig. 8 Inflow deflection angle.
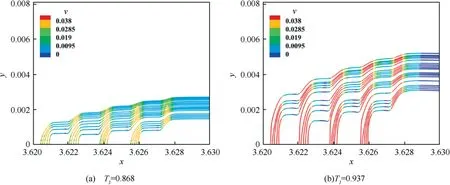
Fig. 9 Instantaneous streamline distribution in z = LZ/2 section.
The evolution of temperature field involves the transfer of heat in the boundary layer and the difference in the viscosity of gas molecules,which may affect the skin friction drag,as shown in Fig. 10. Since the micro-hole arrays are staggered in x and z directions and the temperatures satisfy the relationship of wall temperature T>inflow temperature T>micro-blowing temperature T, the minimum value in the contours of flow field is still higher than the original micro-blowing temperature. Due to the temperature differences, a thin temperature boundary layer forms near the wall, but it is still thicker than the velocity boundary layer (see Fig. 6). The temperature boundary layer is seriously destroyed by the micro-blowing,which leads to a large amount of low-temperature gas gathering at the bottom of the temperature boundary layer.The enclosed low-temperature gas exchanges heat violently with the surrounding gas. Additionally, the role of microblowing motivates the kinetic energy of the inflow to redistribute in the three directions, and the striking enhancement of the normal component causes the deflection of lowtemperature gas towards the normal direction (as the aforementioned θcan reach 60°). Increasing the micro-blowing temperature can enlarge the area of the low-temperature area in the boundary layer and lead to a larger deflection angle of the cool gas.

Fig. 10 Contours of average temperature field.
The profiles of the normalized temperature, (T-T) / (T-T), with the wall normal distance, y, at the microblowing location x = 36.17 are plotted in Fig. 11(a). For the uncontrolled case(grey line), the temperature in the boundary layer increases gradually, similar to the velocity profile. However, a changeable temperature distribution observed in both micro-blowing cases displays a curve that fluctuates up and down along the wall normal distance.Such a huge temperature change brings about the strong heat flux exchange in the normal(see Fig.11(b)).This is all due to the relationship of T>-T>T. When y>200, the temperature in three cases is close to the inflow temperature T= 1.0 and the thickness of their temperature boundary layers is approximately equal to each other.
Based on the Sutherland’s law,the dynamic viscosity, μ,of gas molecules can be obtained from the temperature distribution in the boundary layer,as shown in Fig.12.Obviously,due to the cooler micro-blowing gas,the viscosity of the gas molecules in the micro-blowing area is lower than that in the areas before and after control. Low-viscosity gas molecules ejected upward into the free incoming flow promote the reduction of wall surface friction drag, and as the micro-blowing temperature adds, the low-viscosity area will expand outward. But it is worth noting that the reduction rate of gas viscosity in the near-wall region is less than 7%, compared to uncontrolled case. However, the local reduction rate of skin friction drag can arrive at 40%. It indicates that by changing the blowing temperature, the impact of viscosity, μ, is not dominant for the drag-reduction enhancement based on the wall viscous shear stress, τ=μ·∂u/∂y|, but the effect of temperature on velocity field is the most important factor. Kramer et al.tested the heated wall surface resulting in a loss of turbulent skin friction drag in the aircraft configurations, although the gas viscosity near the wall increases due to the higher temperature than the inflow. Moreover, by evaluating the effect of heating wall on the turbulent boundary layer in the water,Lee et al.demonstrated that drag reduction is primarily due to the changes in the Reynolds shear stresses across the boundary layer. Therefore, for micro-blowing, if the blowing temperature exceeds the inflow temperature resulting in the rise of gas viscosity in the near-wall region,the drag reduction is still acquired. Because the effect of viscosity by heating is limited and the variation of velocity properties is dominant.
As analyzed before,the increase in the thickness of the boundary layer caused by heating is a key factor in the reduction of friction drag.
3.4. Turbulent fluctuation field
The distributions of stream-wise velocity fluctuation u’at three x-z sections show the change of turbulent streaks in the nearwall region,as plotted in Fig.13.At y=2.75(see Fig.11(c)),the low-speed streaks of viscous sub-layer are alternately arranged in the span-wise z direction in the uncontrolled region. With micro-blowing, these streaks are crashed by the jet array and broken into discrete and tiny structures. These structures gather together and then generate a turbulent pulsating block in the near-wall control area; in the buffer zone(y= 14.26), the slender streaks gradually begin to be distorted and entangled with each other by micro-blowing; far away from the wall(y=39.1), the streak structures become thicker and turn into a chaotic structure. Note that at y=14.26 in the micro-blowing T= 0.868 case, the streaks in the region before and after micro-blowing are basically unaffected. It indicates a limited penetration depth in the cool micro-blowing case.
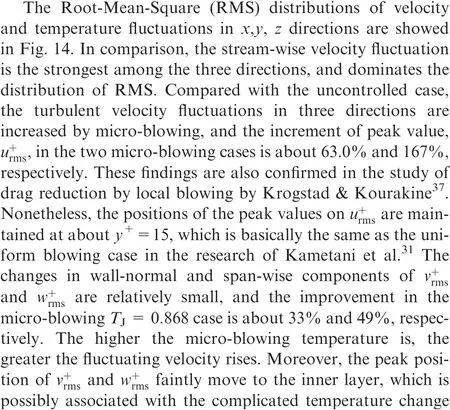
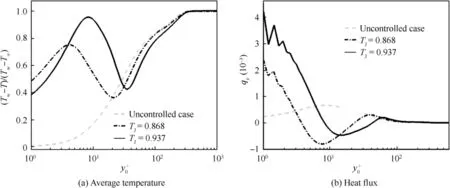
Fig. 11 Profiles of temperature and heat flux along the normal wall.

Fig. 12 Distribution of molecular dynamic viscosity near the wall.

Fig. 13 Contours of stream-wise velocity fluctuation u’ (top: TJ = 0.937; bottom: TJ = 0.868).

3.5. Vortex structure analysis
When the micro-blowing with staggered arrangement is applied, a regular array of vortex clusters is formed in the near-wall region. Their interactions with the spatialdeveloping turbulent structures in the boundary layer affect the wall friction drag. The character of turbulent vortices is described by the second-order invariant Qof the velocity gradient tensor as follows:

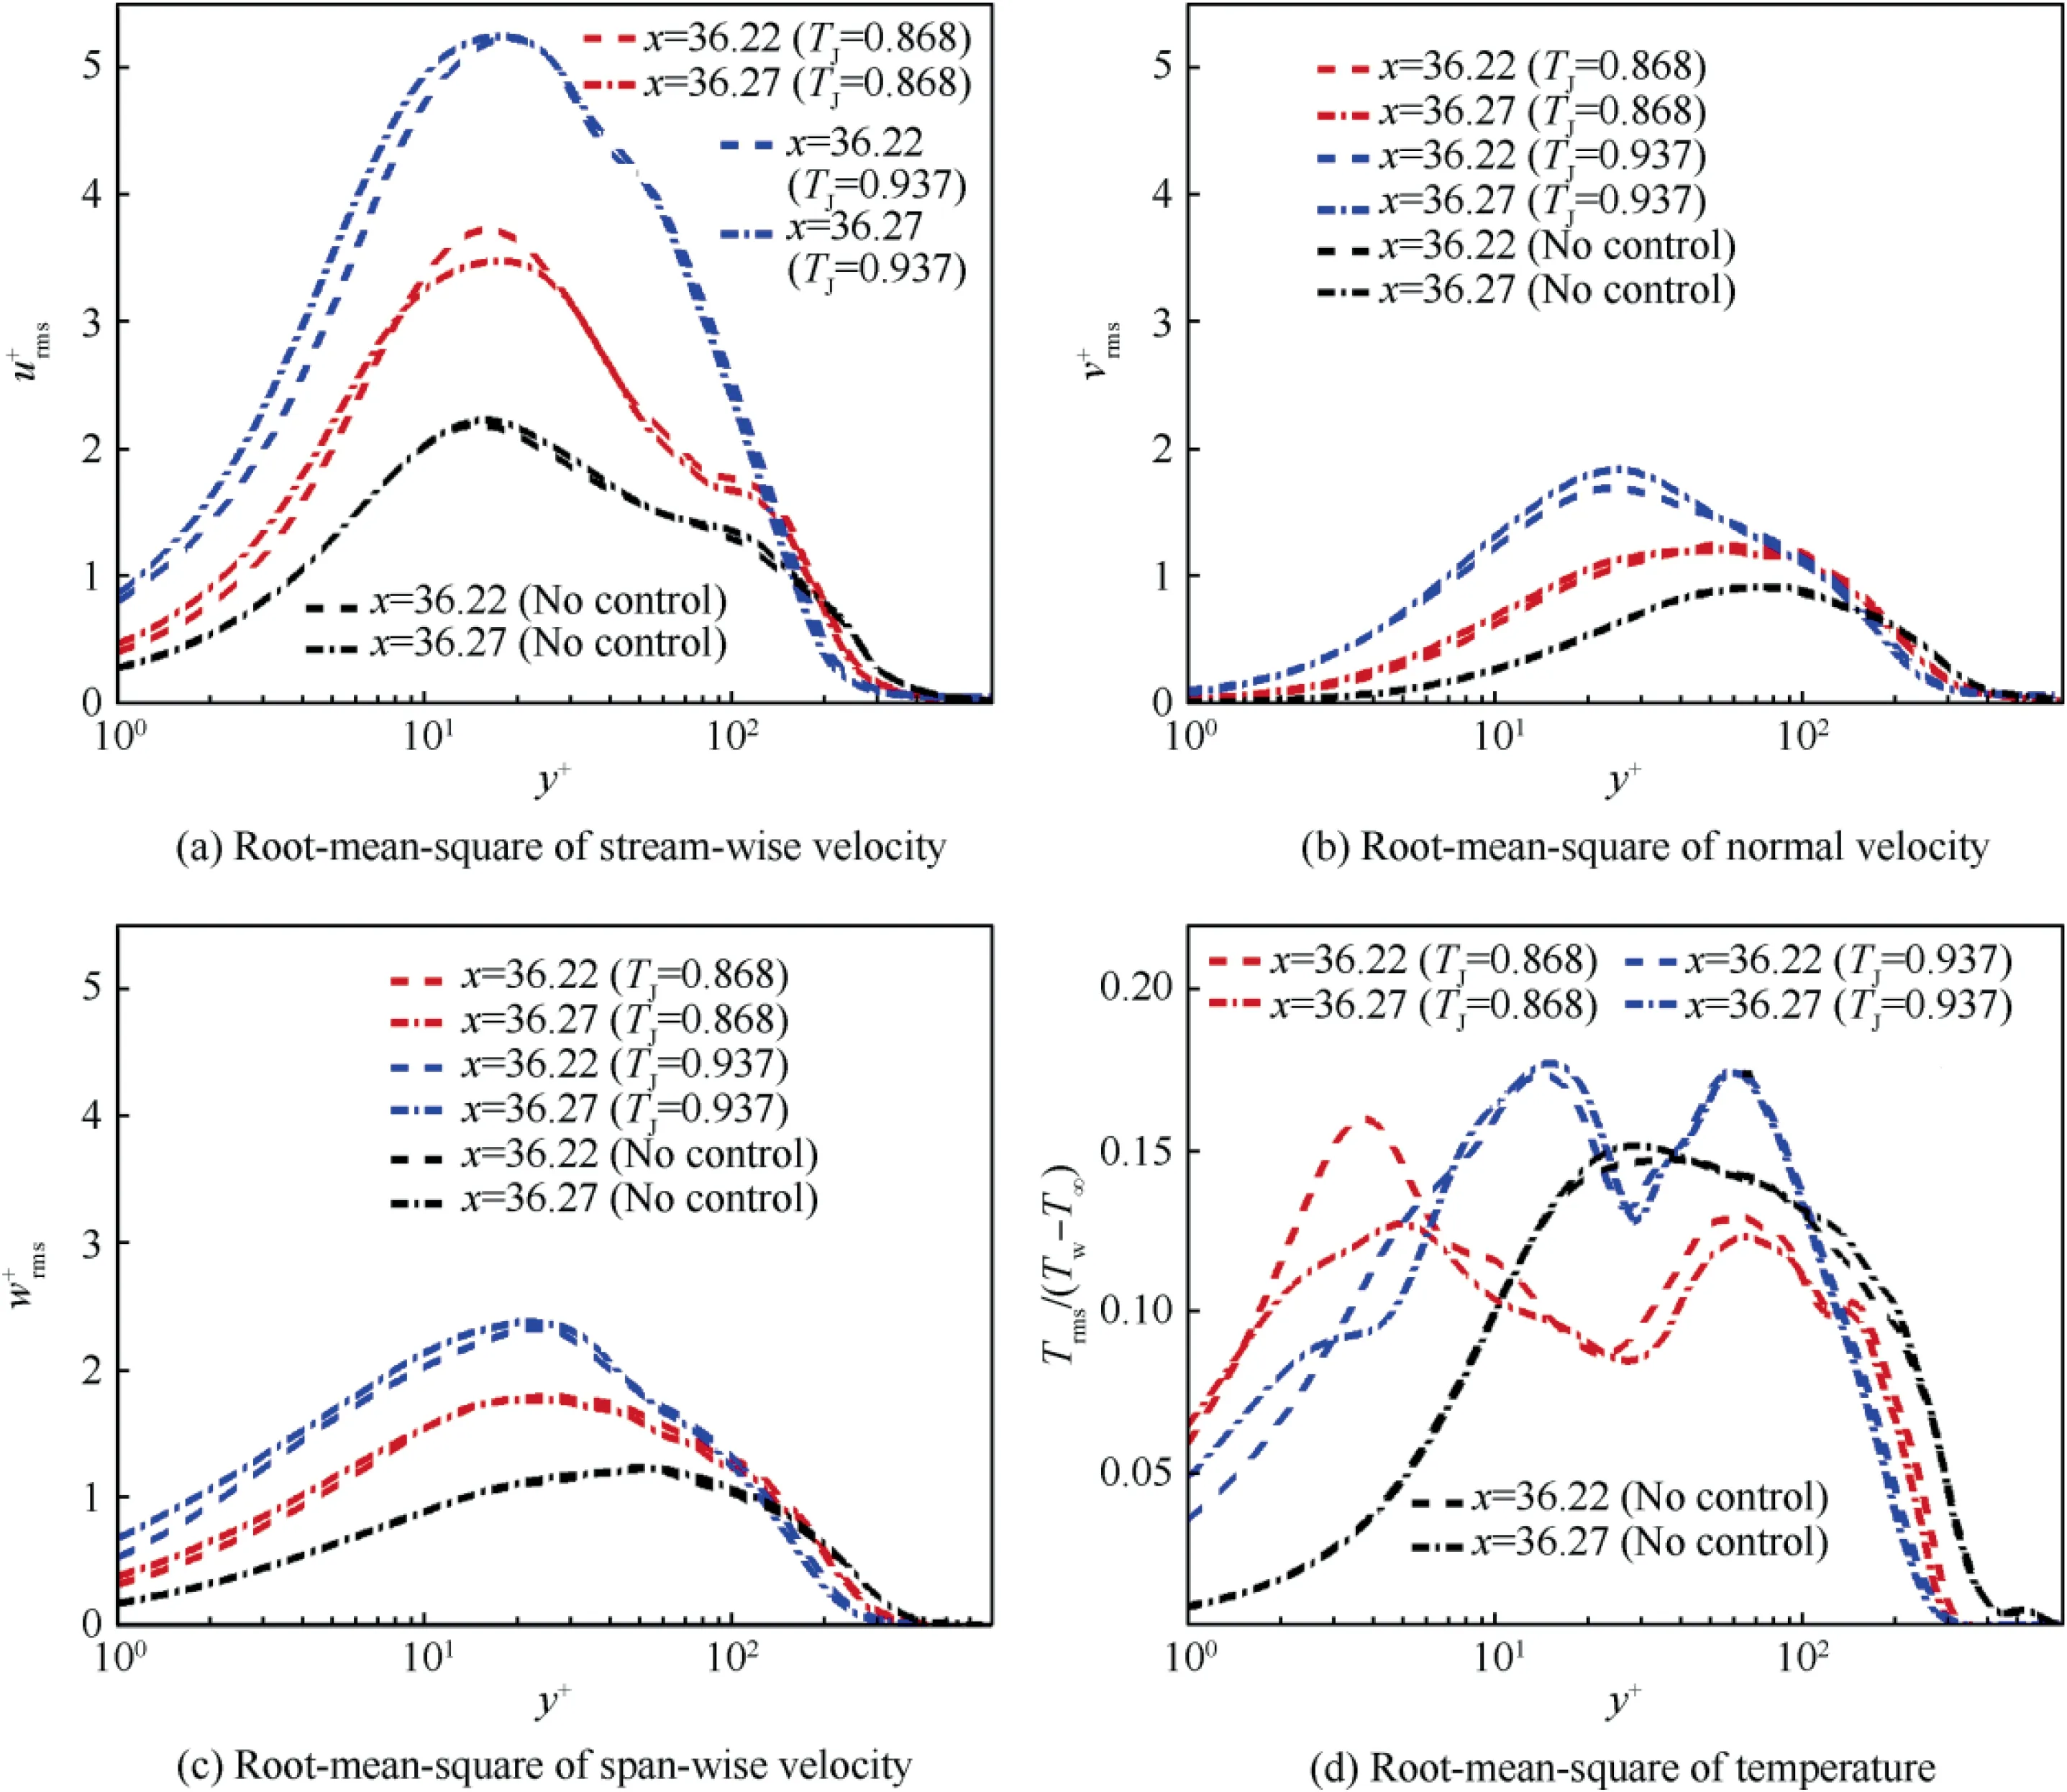
Fig. 14 Profiles of the root-mean-square of velocity and temperature fluctuation.

Fig. 15 Iso-surface vortex distribution (Q2 = 200).
Fig. 15 shows the iso-surface distribution of 3D vortices with Q=200.It is found that the shape of jet vortex clusters becomes ‘‘crescent” and ‘‘circular” near the wall in the microblowing cases of T= 0.868 and 0.937 respectively, and the direction of the crescent arch is consistent with the flow direction.Apparently,with the same vorticity Q=200,the size of jet vortex attached to the wall in T=0.937 case is larger than that in the cooler micro-blowing case. These discrepancies are due to the velocity properties of jets in the boundary layer.As previously analyzed,the temperature accelerates the redistribution of the kinetic energy in three directions caused by microblowing that at higher blowing temperature the stream-wise and normal kinetic energy decrease and increase more,respectively.Especially,the gradient of stream-wise kinetic energy in the near-wall region becomes slow, resulting in the thickened viscous sub-layer. Therefore, more small-scale vortices are easier formed and gather around the micro-holes. Furthermore, from the color view of the vortex surface, the streamwise velocity of these jet vortices firmly attached to the wall is lower in the higher-temperature micro-blowing case due to the slower viscous sub-layer. But for both of the two cases,the motion velocity of the blowing gas ejected from each micro-hole is almost less than 0.1. With the evolution of the flat-plate turbulent flow in space and time, although the near-wall vortex changes, the position and shape of the micro-blowing jet vortex remain relatively stable. Therefore,these jet vortices constitute a stable barrier on the wall. Their role is to prevent the direct contact between the stream-wise vortex and the wall, so that the skin friction drag is mainly dominated by the jet vortex. It can be explained from Fig. 16, which shows the Qdistributions at three streamwise positions in the upstream area (x = 35.86), microblowing area (x = 36.2) and downstream area (x = 36.56).By comparison, the vortices in the upstream of the blowing area move closely to the wall surface, so a direct force on the wall will be achieved; but in the micro-blowing section,there exist a large number of small-scale vortices arranged in intervals on the wall surface, acting as a barrier to avoid a direct impact on the wall from the large-scale vortices in the outer layer; in the downstream region, due to the loss of the blowing jets, those large vortices restart to move close to the wall. As shown in Fig. 17, the red spots denote the vortex at Q= 200 and the near-wall vortices caused by microblowing are adsorbed on the wall. Whether the stream-wise vortices (large-scale structure identified by streamlines) can move above the jet vortices or not, is determined by the size of stream-wise vortex, space between micro-holes, blowing fraction, etc. When the distance between the adjacent blowing holes is smaller than the size of the stream-wise vortex,the vortex cannot be accommodated. Naturally, the ability of vortex to generate the motions of burst and sweep is decreased, and thus, a drag reduction is obtained.
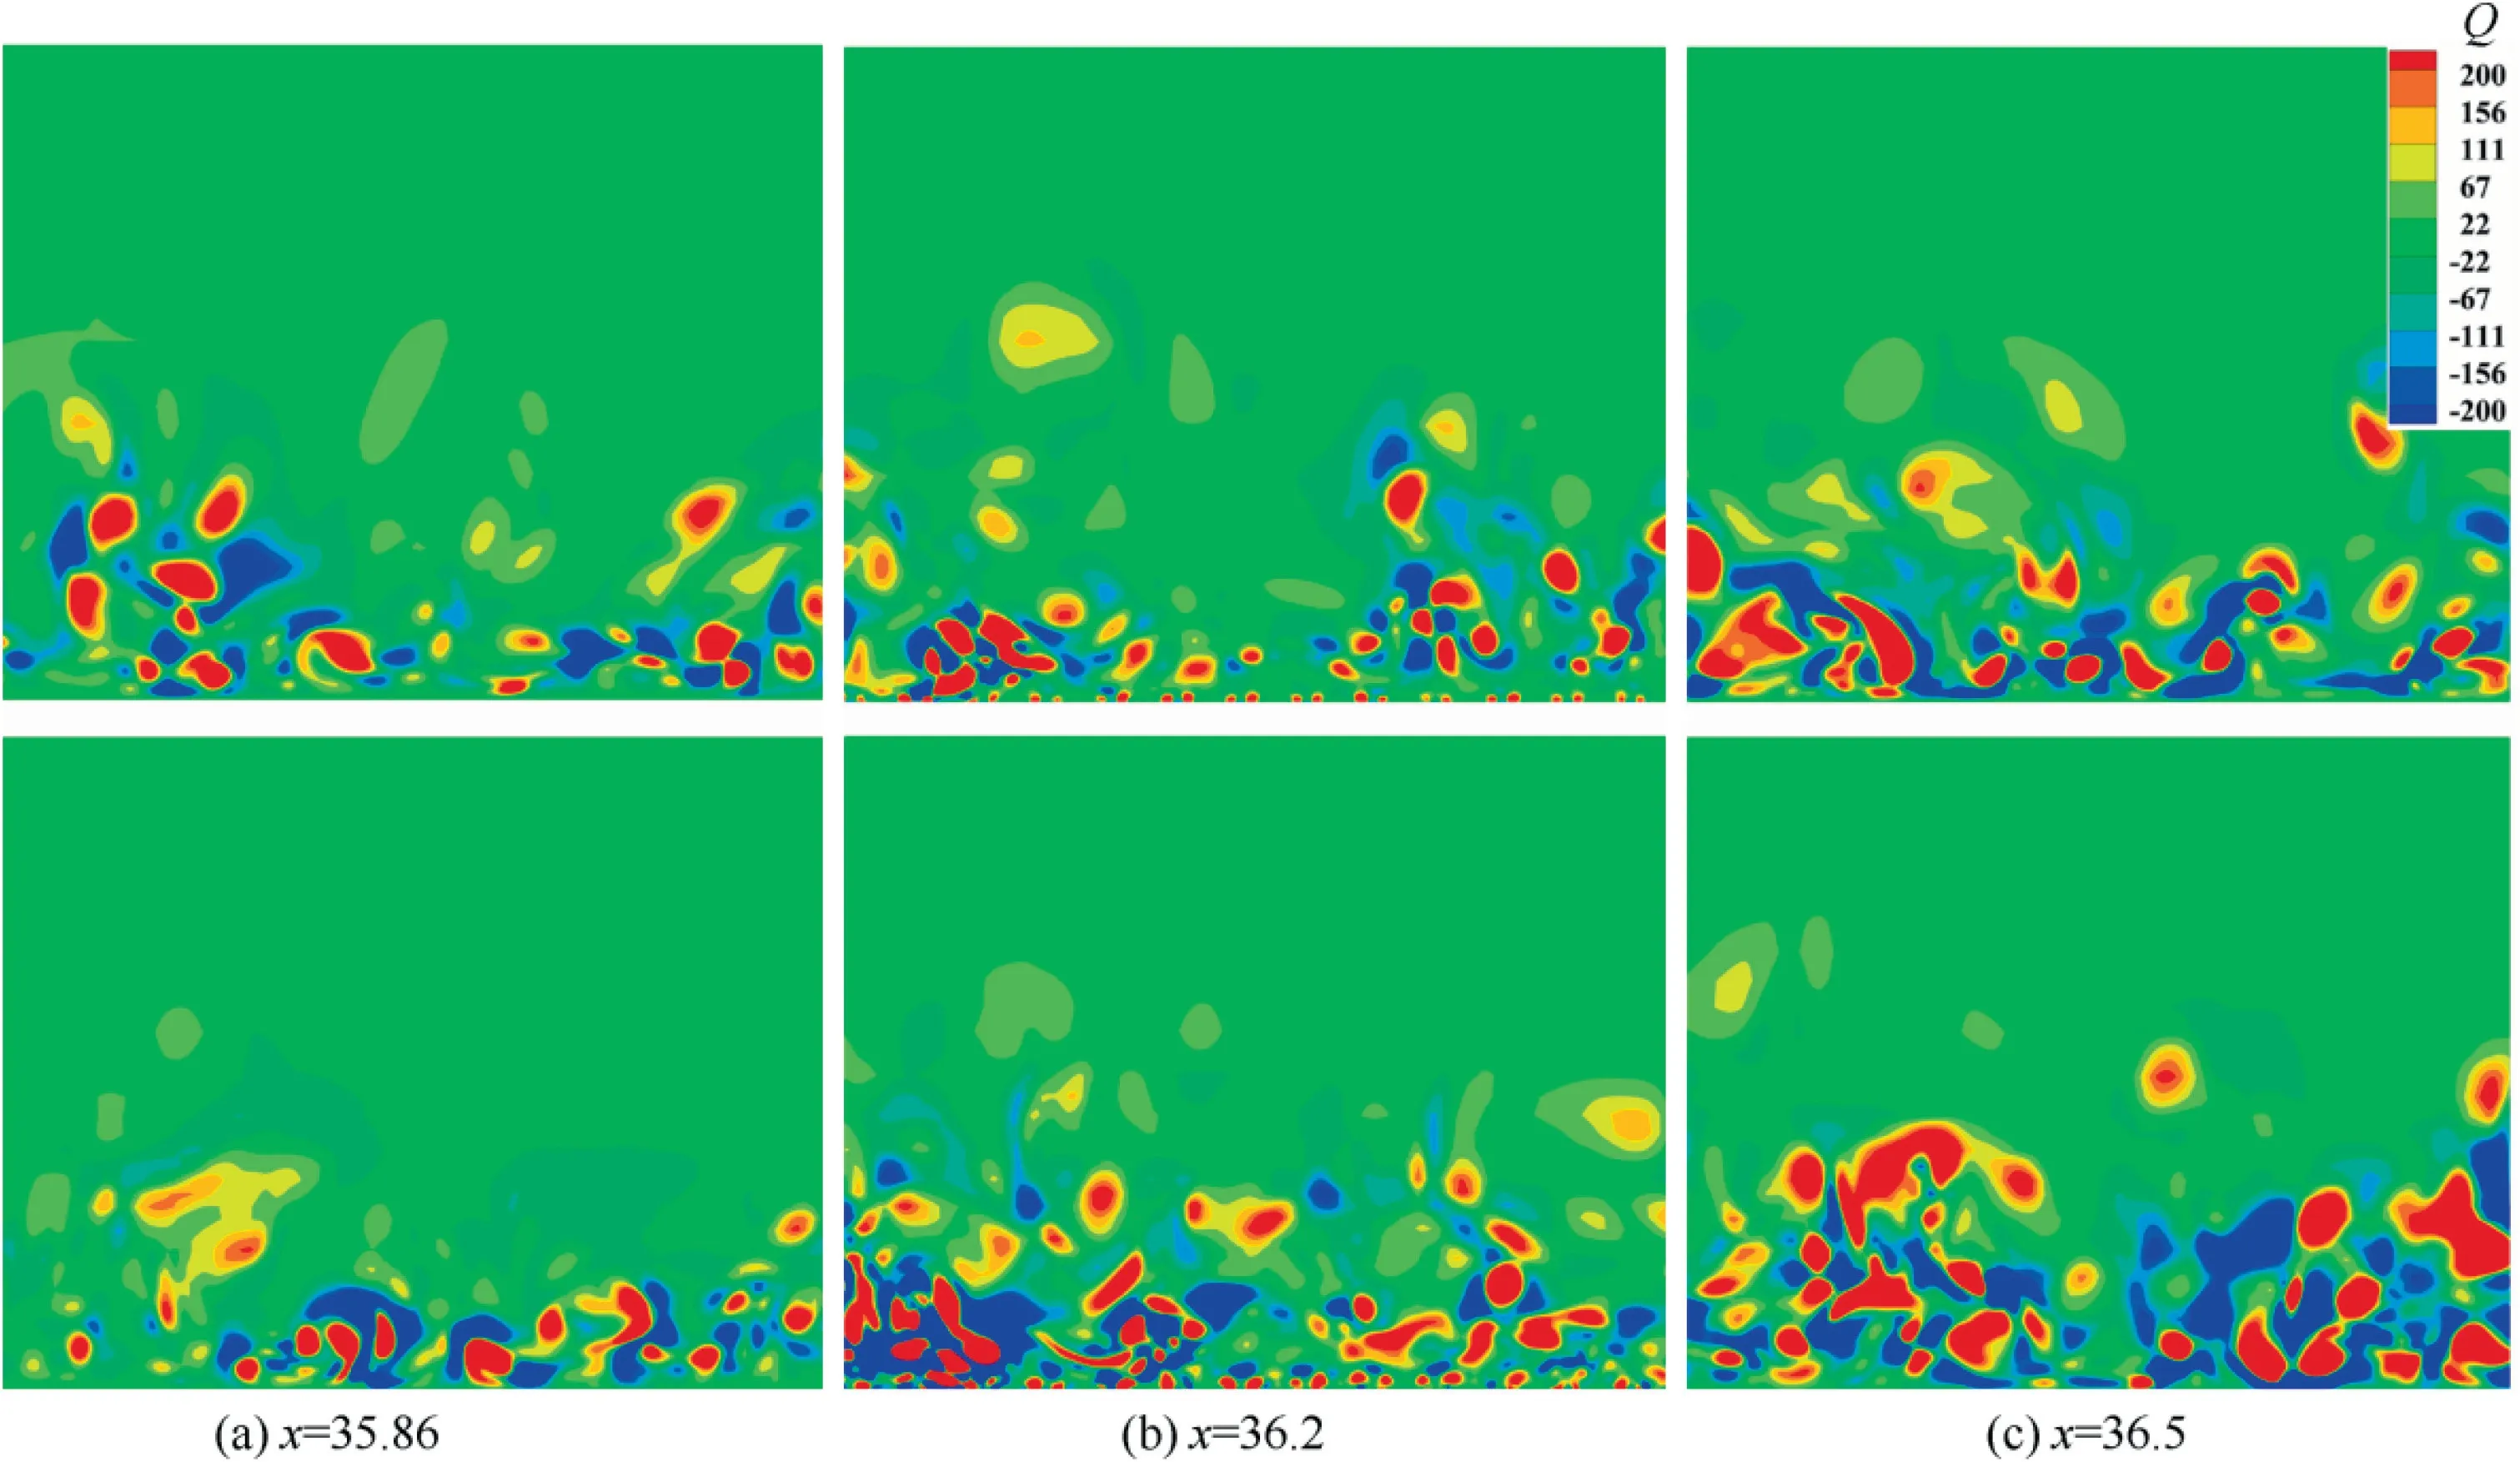
Fig. 16 Contours of Q2 distribution in three x-sections (top: TJ = 0.868; bottom: TJ = 0.937).
In addition, it can be found that with the impingement of the small-scale vortex clusters of the micro-jets, the largescale vortices turn into relatively tiny pieces, resulting in an obviously increasing number of small-scale vortices,which distribute in the micro-blowing control region,compared with the vortices before and after blowing.Moreover,the size of the micro-jet vortex at T= 0.937 is slightly larger than that at T= 0.868.
3.6. Spatial/temporal DMD analysis
In this part, the DMD analysis will be applied spatially and temporally on the velocity field of these cases.By applying spatial DMD on a single instantaneous flow field,we can find the dynamic information and structures that dominate the turning of the flow with control of MBT. And with temporal DMD analysis, high- and low-frequency flow structures will be separated and compared.
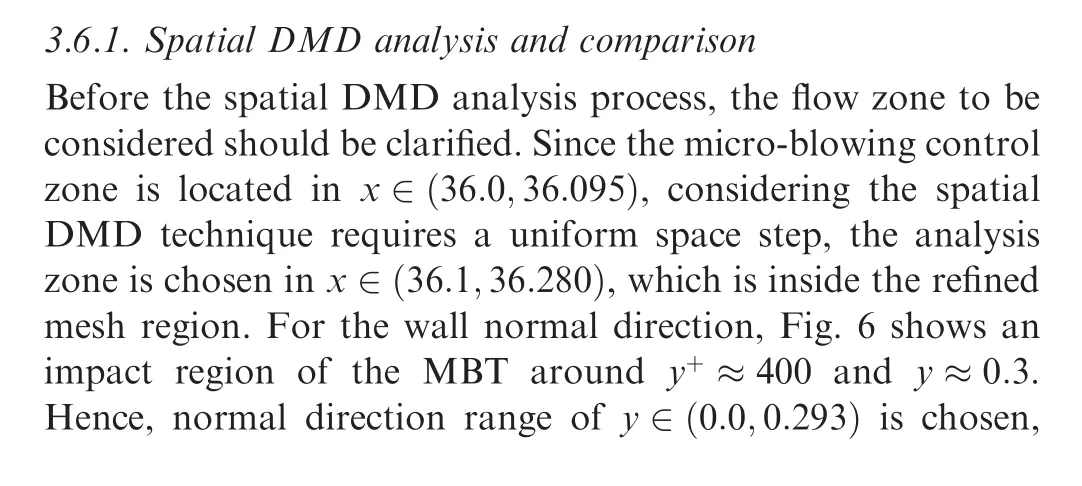
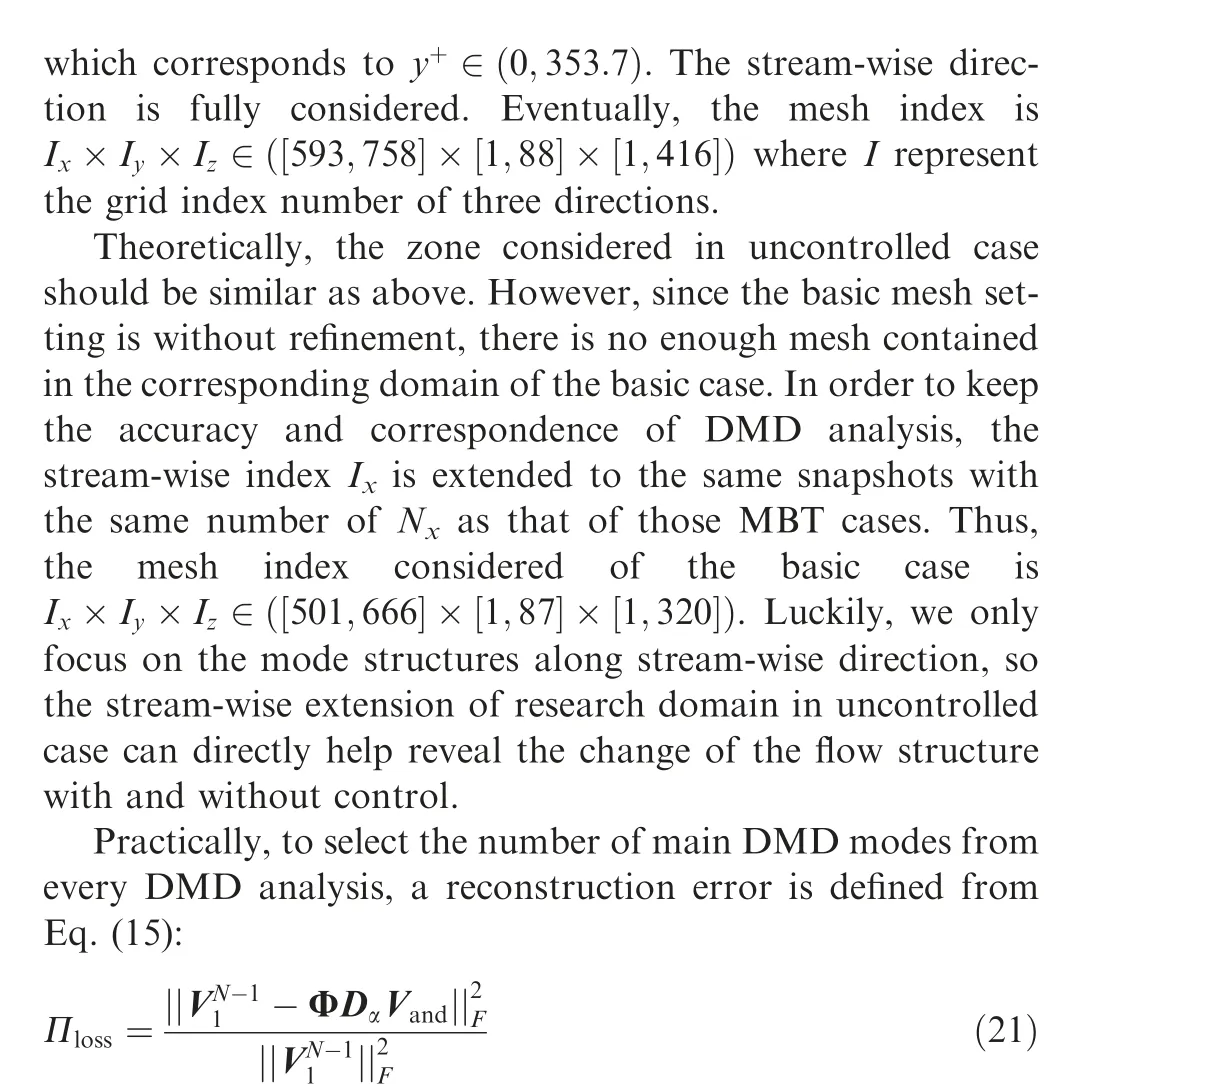
where with different number of DMD modes,the mode matrix and Vandermonde matrix will only keep the corresponding columns or rows, and thus we can reconstruct the flow with partial modes.
Based on the reconstruction error curves in Fig.18,we can see that for all three cases, there are bumps at the first several modes, which indicates that apart from the first mode (means average flow), there are some modes that behave directly contrasting with the main flow.It is extremely sharper in the controlled cases.This may come from the dominant modes which strongly influence the main flow. It can also be found in the DMD spectrum in Fig. 19. To match the modes along the DMD analysis and select the modes that we especially concern,a reconstruction error criterion of Π≤5% is chosen here.Thus,we can obtain the smaller number over the three cases as n=59,11 and 16.The sharp decline of nfrom uncontrolled case to controlled ones also shows that the MBT has a direct impact on the base flow,and apparently changes the structures with wide range of wave-numbers.
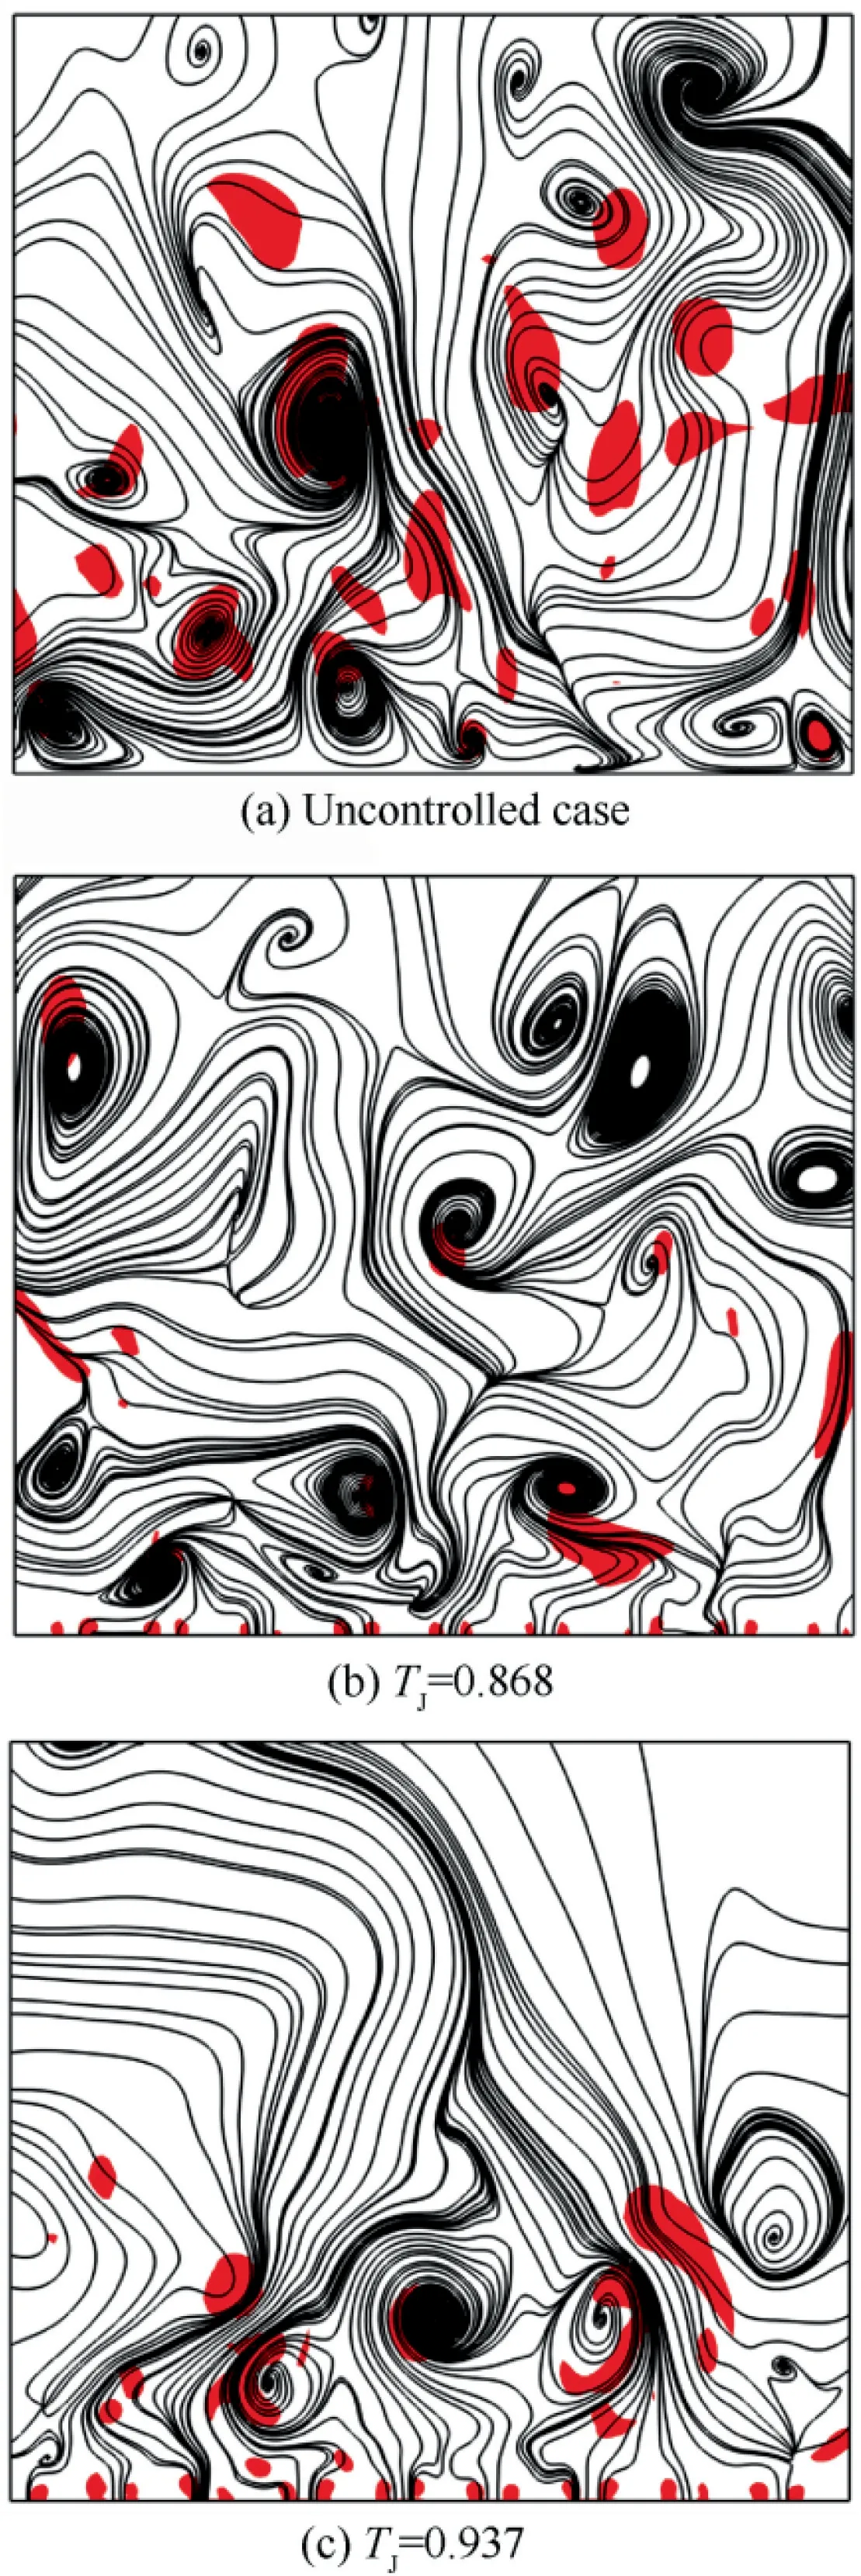
Fig. 17 Instantaneous streamline distribution in x = 36.2 section (color: Q2 = 200).
With the selected modes, we can then give the dynamic spectrum as follows, and the selected modes are also marked by red-cross. From the left of Fig. 19, we can observe that most of the modes are located on the unit circle,which proves that the flow had already developed into a pseudo-stable state from distinct perspective. For the basic flow without control,the selected modes distribute over the whole right half of the phase, showing the wide-band wave-number of the basic flow.However, the modes with high amplitudes are selected by DMD in controlled cases that ‘remove’ structures with long wave-number. This on one side explains the noise-canceling function of DMD as a model order reduction technique, and demonstrates the effect of the control on the other side.
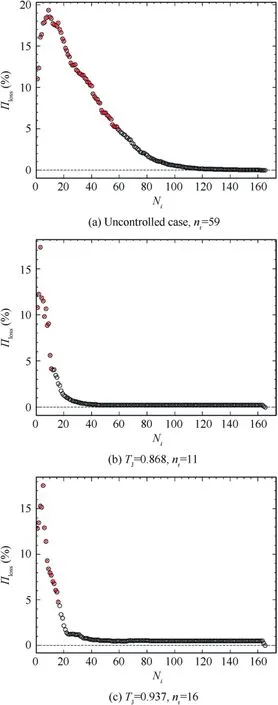
Fig. 18 Reconstruction error distribution along the number of DMD modes Ni, with red-cross marking the modes nr selected with criterion Πloss ≤5%.
From the right column of Fig.19,we can see that all of the three cases have a stable mode with similar absolute amplitude at the peak of the distribution, which is related to the main average flow of the flat-plate boundary flow. From the peak mode, controlled cases own sharper bump compared to the uncontrolled one, which confirms with the eigenvalue spectrum that the controlled cases gather or ‘modulate’ the flow into a more ruled way. But at the meantime, the range of wave-number is also extended with the micro-blowing injected into the flow.
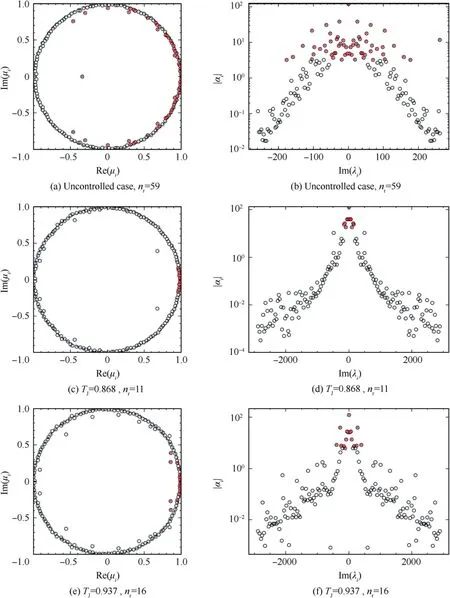
Fig.19 DMD spectrums of three cases.(Left:the eigenvalues/Ritz values;Right:wave-number over absolute value of amplitudes;redcross: selected DMD mode nr).
Furthermore,with the selected DMD modes,we can reconstruct the flow field which only retains the main modes and removes the rest modes, resulting in noise canceling. In Fig. 20, we obtained the main flow structure filtered by the DMD technique. It shows an almost flat distribution over the velocity in basic case, and its boundary layer is beyond y=350. However, the thickness nearly doubles that of the MBT cases. This can be explained by the fact that with smaller wall sheer stress τin controlled cases, corresponding smaller uwill lead to larger Kolmogorov scale. This change results in bigger length of a single ‘+’ unit, and thus compresses the thickness of controlled cases in the wall unit normalized coordinate.
At the meantime, the velocity gradients in the near-wall region(y∈[0,10])in three cases are with similar range,which also indicates a smaller velocity gradient in the controlled cases in reality. The gradient is even smoother in case with T=0.937.On the other side,the reconstruction of controlled cases shows a thicker velocity gradient layer(U ∈[0,0.4])near the wall with impact range within the controlled zone(located in z∈[7 85,1123]), which clearly illustrate the phenomenon that the near-wall flow layer is risen, and conclusively lead to a drag reduction. As for the controlled cases with different temperatures,the width and level of this effect are more apparent in the high temperature one, which undoubtedly means a better drag reduction performance. Furthermore, the change of the near-wall counterpart structures may also indicate that the micro-blowing dominates the near-wall flow. The ROM reconstruction digs out the short wave-length modes (with smaller flow size) from the modes generated. For this point,with more uniform distribution of the small-scale flow patterns near the wall compared to lower temperature case, the high temperature case reflects relatively shorter wave-length modes contained in the flow reconstruction.
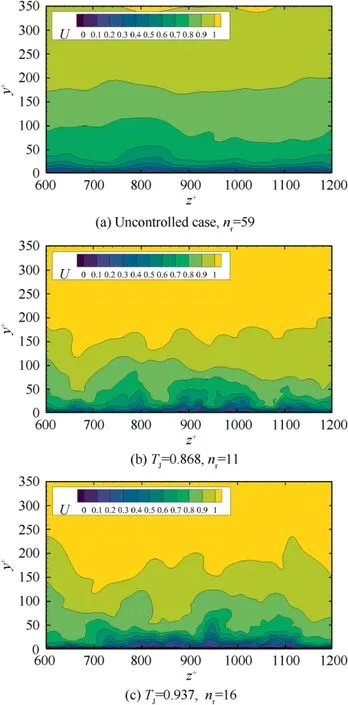
Fig. 20 DMD modes reconstruction with selected nr modes,partial view focusing on the control zone at z+∈[7 85,1123]
3.6.2. Temporal DMD analysis by agglomeration strategies
For the temporal DMD analysis, we choose N = 101 instantaneous stream-wise velocity fields of each flow case as the input of DMD analysis. However, since the grid points N×N×N=1232×100×416 ≈5×10with 101 snapshots are prohibitive for a typical workstation, we do have to adopt agglomeration strategies in Refs. 38,39 to reduce the computational and memory cost. To achieve this goal,there are two ways: one is to represent the temporal dynamics of the data sequence with a reduced number of snapshots,and the other is to identify a compressed data space from original flow field.
Hence, we unfold our research by two parts. The first part starts with N=101 snapshots but agglomerates on space.The second analysis is based on the longer time length but a shorter snapshot sequence, trying to find temporally wider but corresponding fundamental flow patterns in T= 0.937 case. Note that the flow domain investigated in this subsection is selected as the same with the spatial DMD analysis in Section 3.6.1.
· Comparison of three cases on N = 101 snapshots
For the N = 101 snapshots, we choose a time range of t= 2.5 in each case, which means a time interval of Δt = 0.025. This dataset can help to reveal high-frequency flow pattern in these flow cases.
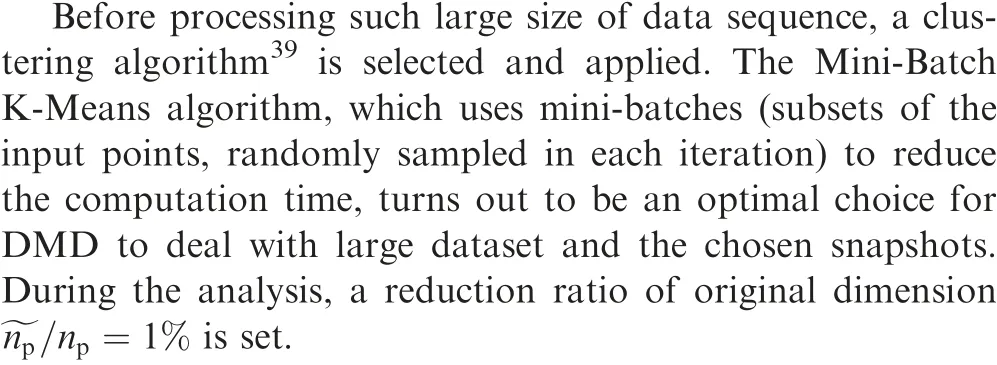
Fig. 21 shows the comparison of DMD spectrum among three cases.We can see that there are obvious changes between the reference case and controlled cases. Apparently, the spectrums of controlled cases show a sharper summit in the middle of the figure and a smoother spreading in higher-frequency domain. The thinner distribution of the DMD spectrum indicates the modulation of the control effect on the basic flow.This phenomenon is more visible in T= 0.937 case which shows a stronger control ability of MBT with higher temperature.At the meantime,the flat and dense distributions of highfrequency modes, compared to the uncontrolled case, demonstrate a strongly promotion of high-frequency flow by the control technique, rather than the low-frequency domain. Indeed,we can find similar behavior in Fig. 17 that the active control helps to restrain the interaction between large flow structures by importing smaller vortices (which is with higher frequency)into the near-wall area. We can also find similar situation,that actuation on the boundary will lead to a simpler representation of the flow, if we only focus on high amplitudes modes(e.g. |α|>100) to derive a ROM.
To illustrate an overall flow pattern of three cases over this t=2.5 time scope,we again set a threshold of Π≤20%in Eq.(20)to reconstruct each flow.Since there is a wide band of dynamics over such long period of turbulent flow field, it is necessary to set a higher criterion than that in spatial DMD analysis,in order to include enough vital flow patterns.Almost same number of dominant modes are selected, which are n= 38, 42, 41, respectively. From Fig. 21 where selected modes are marked with cross,we can still find that the selected modes are mainly concentrated at low to middle frequency,which makes it better to demonstrate the main flow pattern in these cases.
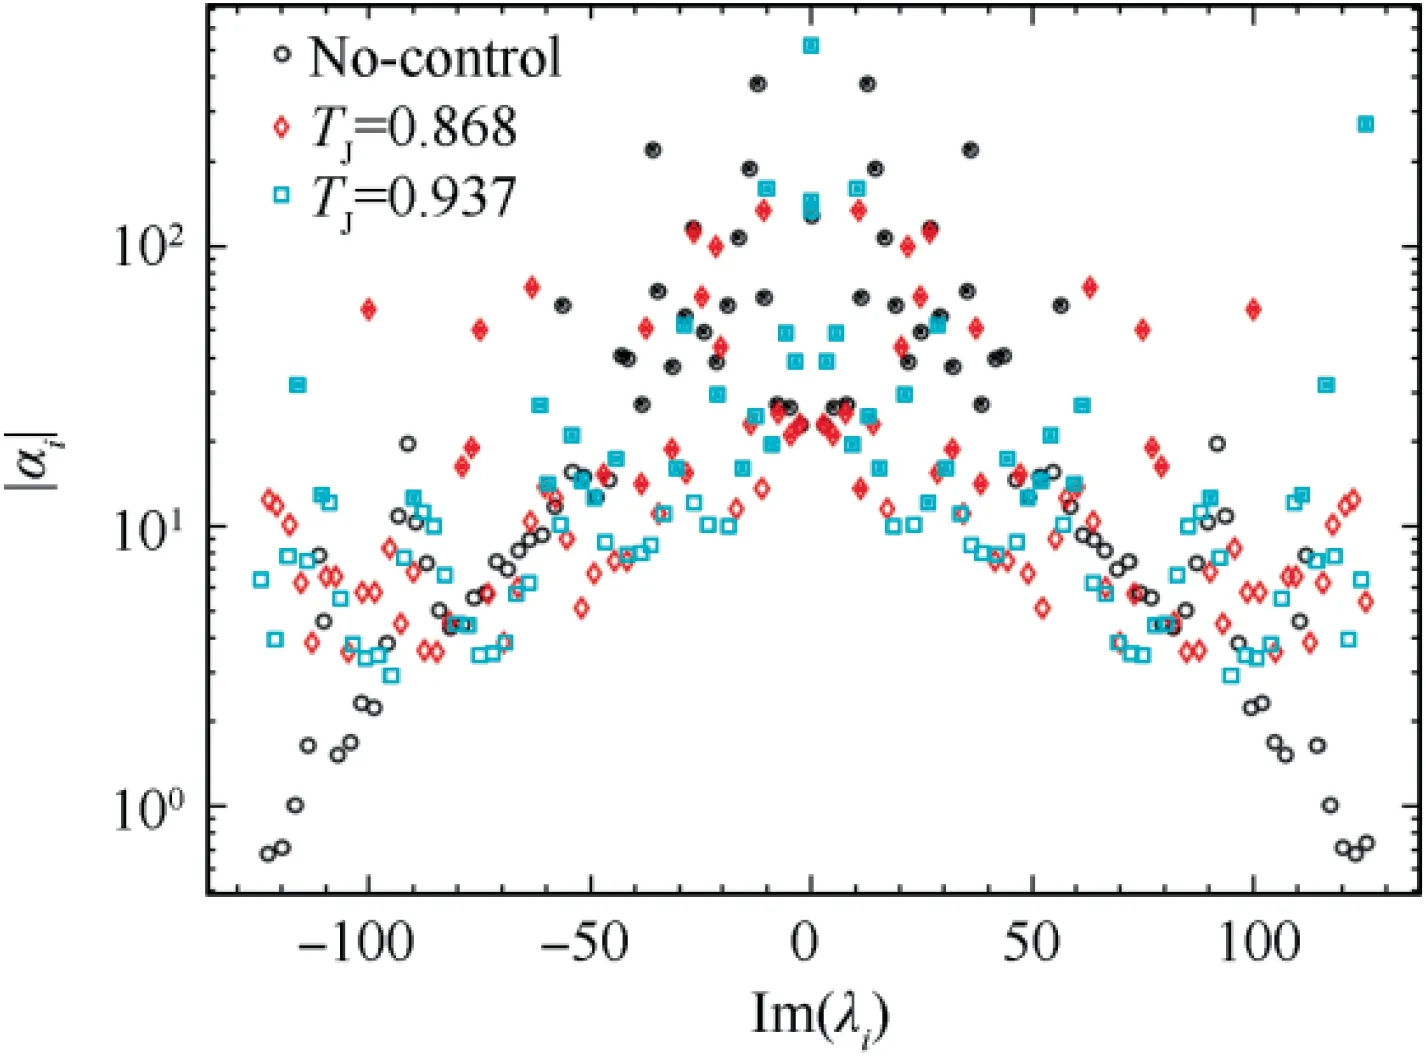
Fig.21 Temporal DMD spectrum of three cases:flow frequency over absolute value of amplitudes of each mode.Cross makers are used to mark selected modes in each case.
Fig. 22 illustrates the flow field reconstructed with selected number of modes by the criterion,which,to simplify the comparison,are averaged over the stream-wise direction(the same to the following reconstructions).Compared to the reconstruction field in Fig.20,the temporal DMD does not show clearly the existence of small size flow structures in controlled cases,even though we can directly find the rise of the near-wall flow layers.
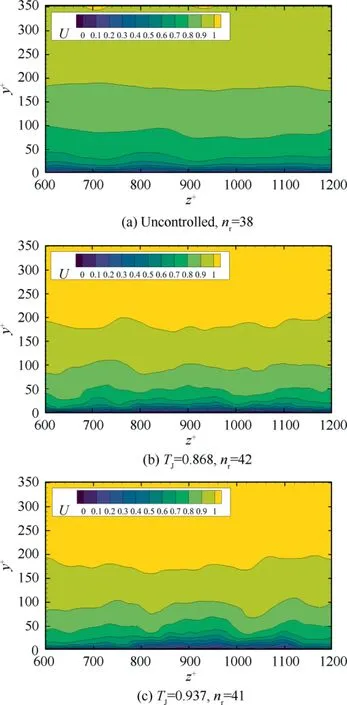
Fig. 22 Temporal DMD modes reconstruction with selected nr modes, partialview focusing on the control zone at z+∈[785,1123]
Furthermore, from the rankings of selected modes in three cases, we can also find that modes pair are # 39–40 in uncontrolled case, but are # 11–12 and # 12–13 in controlled cases,which indicates the importance of high-frequency modes in controlled case compared to the basic flow.The ranges of contour map in the three figures also demonstrate that the flow structures are 10 times stronger than those in the uncontrolled one.
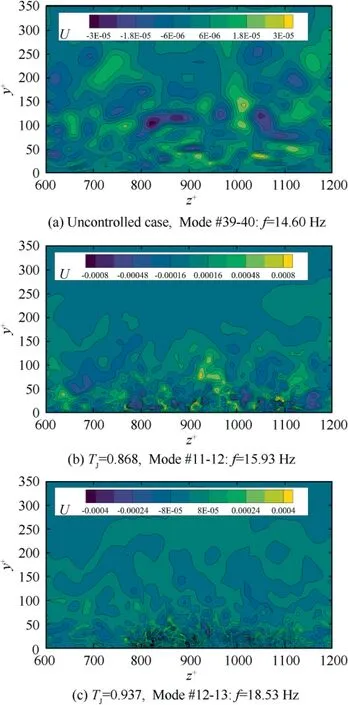
Fig. 23 Temporal DMD modes reconstruction with selected high-frequencymodes,partial view focusing on the control zone at z+∈[785,1123].
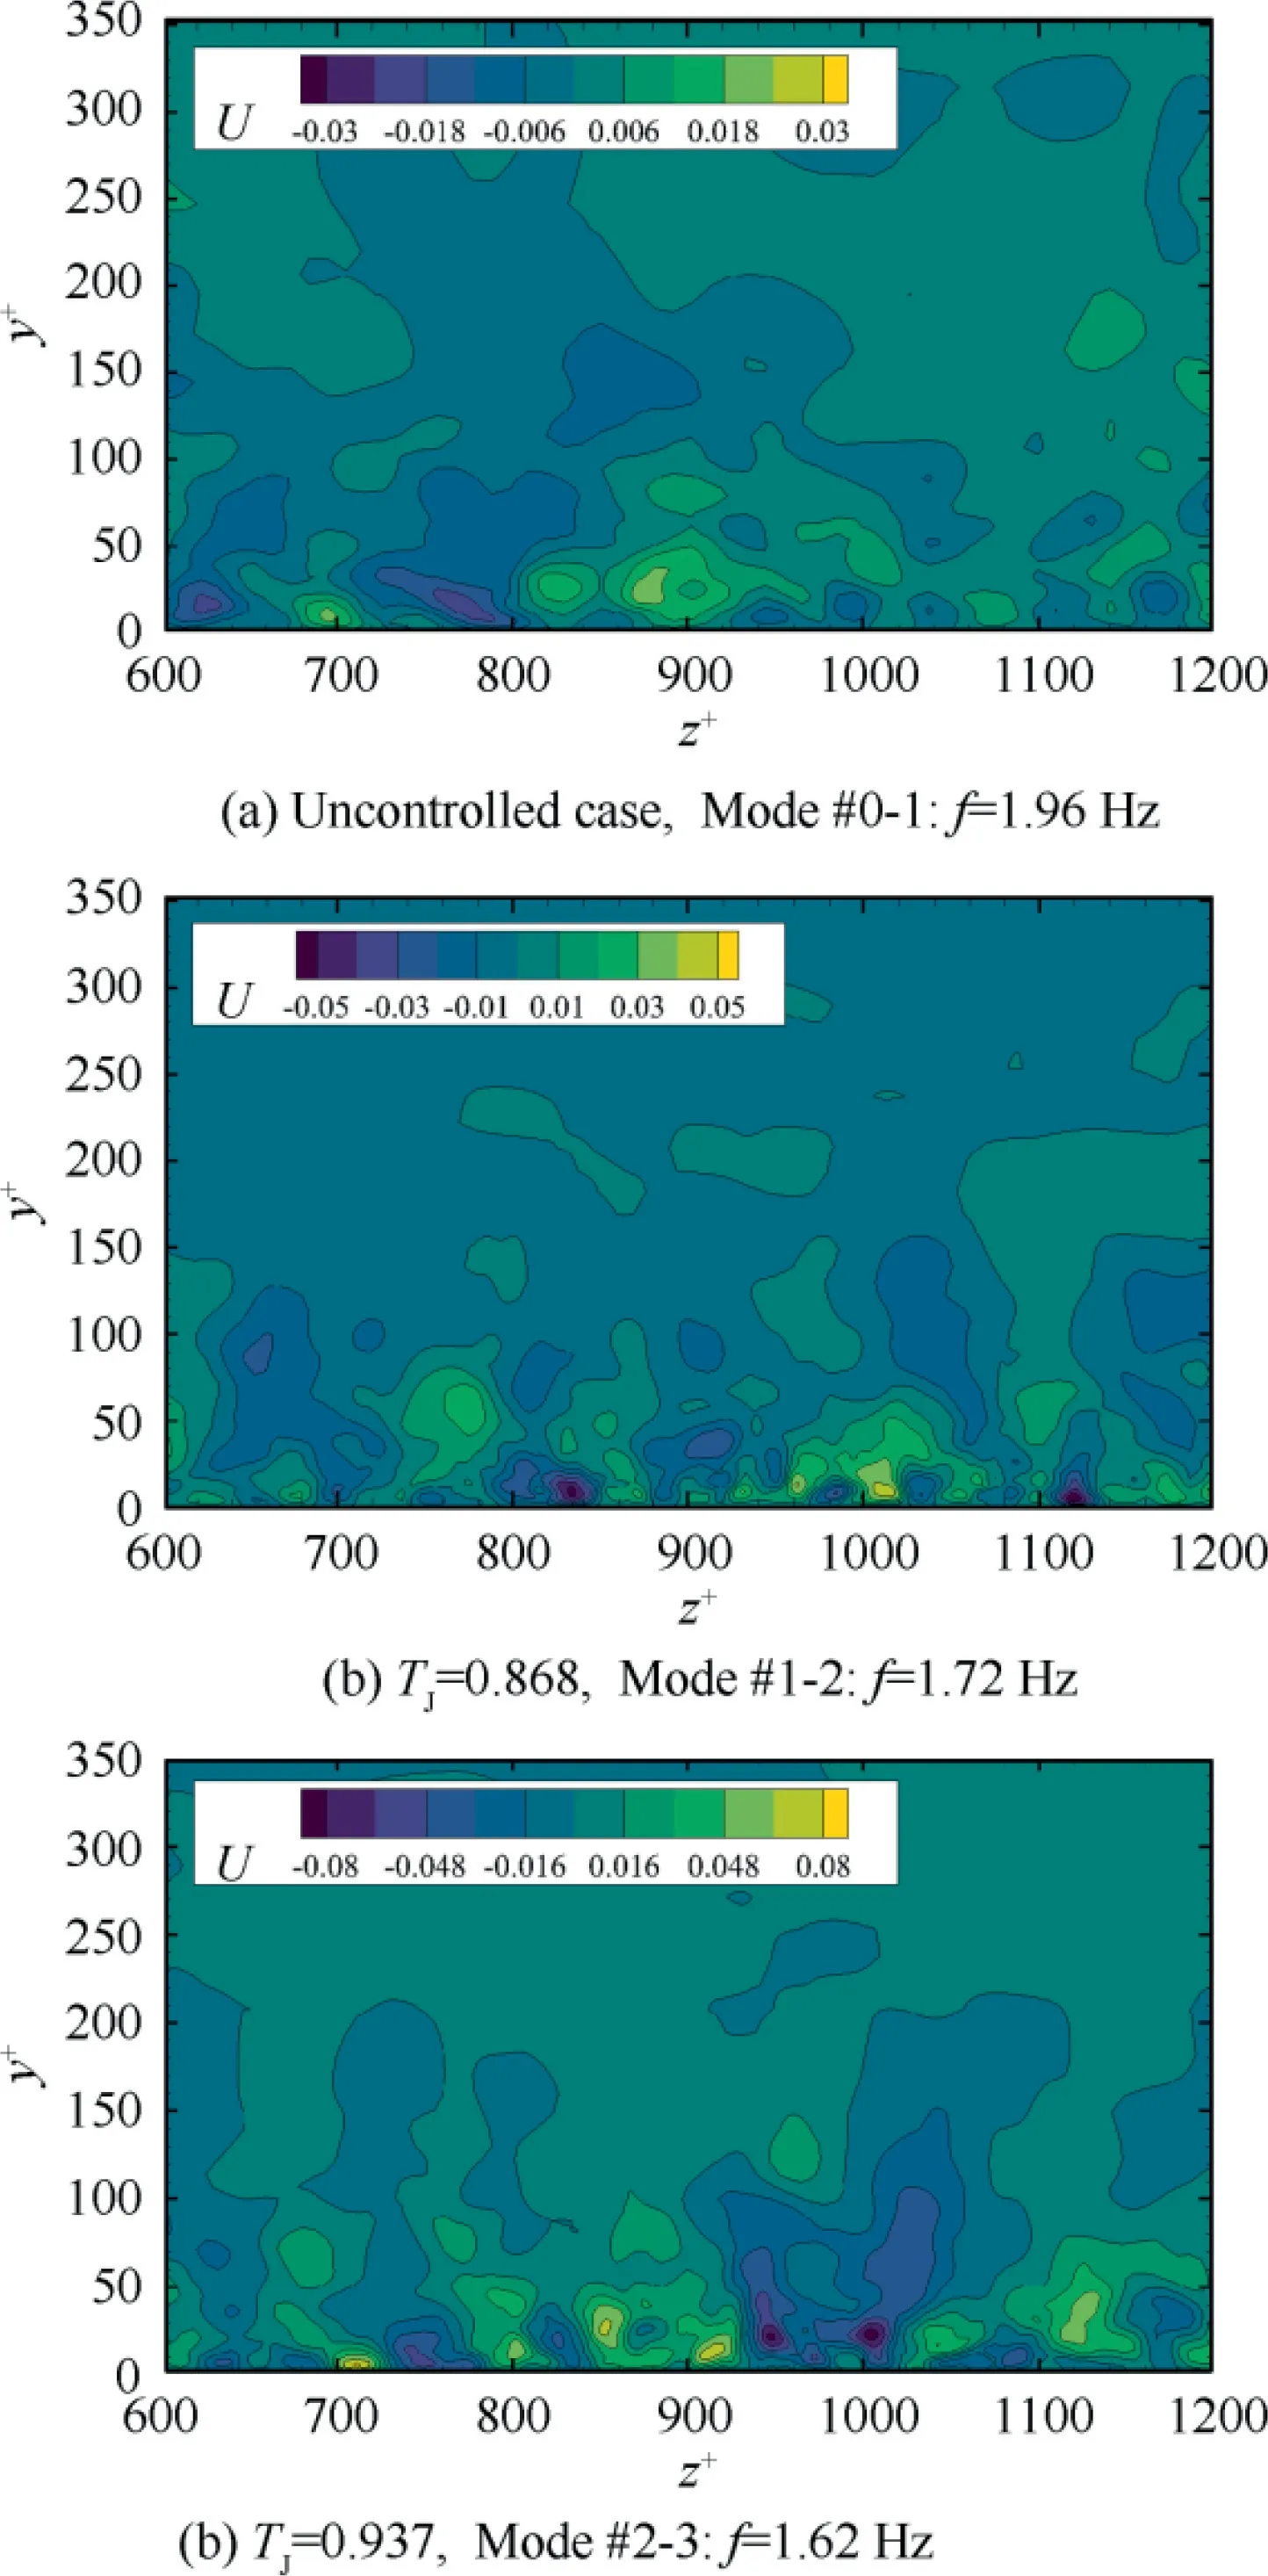
Fig. 24 Temporal DMD modes reconstruction with selected low-frequencymodes,partial view focusing on the control zone at z+∈[785,1123].
Similarly,low frequencies of f <2 Hz are chosen to make a comparison in Fig.24.The selected modes are located near the mean flow mode in Fig.21,with higher amplitudes than that of high-frequency modes selected above.Comparatively,the flow patterns of three cases are with almost identical size (z~50),distributing in the y<100 region. This is more apparent in high temperature case with only small difference in the counterpart structure near the wall. At the meantime, the ranges of their contour map are also in the same magnitude,with similar mode rankings.
Hence, we can summarize from Fig. 23 and Fig. 24 the underneath effect of the flow control technique on the basic flow: the micro-blowing, by importing numerous small flow structures into the boundary layer, maintains the lowfrequency flow pattern near the wall but strongly enhance the high-frequency flow structures,and the higher temperature the blowing has, the clearer these phenomena are.
· Investigation of T= 0.937 case on shortened N = 25 snapshots
To compare with the agglomerated results and to validate the conclusions above, the shortened 25 snapshots are considered. However, with a longer time step of Δt = 0.25 which attach wider time range of 6, it can help us to seek lowfrequency flow over longer time development.In this part,case with T= 0.937 is selected as a contrast study with previous results.
In Fig. 25, since the range of snapshots is long enough(although it is with limited time resolutions), we obtain information more likely related to the long period modes.In Fig.25(a), we notice that only with almost all of the modes can we reach the 5%reconstruction error.Hence,the first mode could be a better object to investigate this flow,and n=1 is chosen.The reconstruction error then is Π≈13.6%. We can find from the spectrum that most of the modes are located inside low-frequency range, which could help reveal low-frequency modes characteristics. The reconstruction of mode #0 in Fig. 26(a) matches well with that of N = 101 temporal DMD analysis in Fig. 22, which shows the lift-up of the near-wall velocity profile.
However, we can further look into the conjugated Modes#1–2 with their mode reconstruction. Fig. 26(b) and 26(c)clearly give the flow structures that show the interaction of micro-blowing flow with the turbulent boundary flow in a strong pattern(|a|>10).Compared to the zone without control, the flow with micro-blowing injected from the wall is interrupted and broken into smaller structures, which validate the streak phenomenon showed in Fig. 13 and Fig. 16.Namely, the micro-blowing hits the streaks and raises the boundary to a more chaotic state.
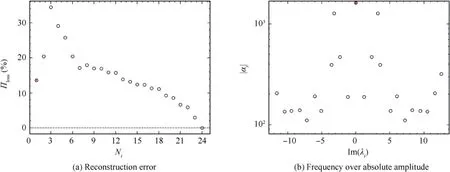
Fig. 25 Temporal DMD spectrum of case TJ = 0.937, with nr = 1.
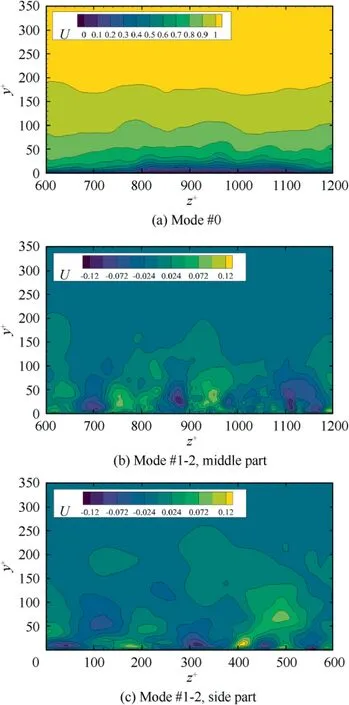
Fig. 26 Reconstruction of DMD Mode #0 and #1–2.
4. Conclusions
This paper uses DNS to numerically study the drag reduction of the local micro-blowing array control in the spatially developing turbulent flat-plate boundary layer, aiming to explore the influence of micro-blowing temperature on the turbulent near-wall structure and skin-friction characteristics. The primary conclusions could be drawn as follows:
(1) The local skin-friction drag is greatly reduced in the micro-blowing control area, and with the relatively higher temperature of blowing, it is more significant in drag reduction, which proves the effectiveness of MBT in restraining friction resistance. The role of microblowing is to redistribute the total kinetic energy in the boundary layer, and the proportion of normal and stream-wise kinetic energy increases and decreases respectively, which causes the near-wall gas to deflect upwards. The higher temperature of micro-blowing brings about a stronger normal flow deflection and a slower gradient change of stream-wise energy.Although high temperature by micro-blowing affects the gas viscosity near the wall, the impact of viscosity is limited for the drag-reduction enhancement, because the effect of temperature in velocity properties is the most important factor.
(2) An explanation of drag reduction by micro-blowing associated with the micro-jet vortex clusters is proposed that although the turbulent stream-wise vortices change with the evolution of the flat-plate turbulent flow in space and time, the micro-jet vortex clusters firmly attached to the near-wall region constitute a stable barrier on the wall and their role is to prevent the direct contact between the stream-wise vortex and the wall.The higher the micro-blowing temperature, the stronger the lifting effect.
(3) By spatial DMD analysis, n= 59, 11 and 15 were selected by the criterion of reconstruction error Π≤5%. The decline of the selected modes number nand the DMD spectra both reflect that the microblowing affects and dominates the base flow, leading to an apparent drag reduction, and the boundary flow turns to a more chaotic state.The thickness of boundary layer near the wall is raised,and the influence extends to a wider range than the control zone itself.
(4) In the temporal DMD analysis, for the dataset of time range t= 2.5 and snapshots number N = 101, a smoother stream-wise velocity gradient near the wall is obvious in the controlled case, which leads to the drag reduction. The micro-blowing array imports numerous small flow structures, maintaining the main characters of low-frequency flow patterns(f <2 Hz)near the wall,but strongly intensifying the high-frequency flow structures (f >14 Hz). The higher the temperature is, the stronger the effect is in these phenomena.
The authors declare that they have no known competing financial interests or personal relationships that could have appeared to influence the work reported in this paper.
This work was supported by the European-China Joint Projects ‘Drag Reduction via Turbulent Boundary Layer Flow Control (DRAGY)’ (No. 690623). The National Supercomputing Center in Guangzhou provides the computing resources for the simulations in this paper.
