Responses of terrestrial bryophytes to simulated climate change in a secondary evergreen broad-leaved forest in southern China
Jiewei Hao·L.M.Chu
Abstract Tropical regions are biodiversity hotspots and are well-suited to explore the potential influence of global climate change on forest ecosystems.Bryophytes have essential ecological functions in tropical forest ecosystems,but knowledge of the potential impact of global warming and possible changes in water availability patterns on terrestrial bryophytes is limited.We transplanted eight terrestrial moss species from two elevations (900 and 500 m) to warmer and drier elevations (500 and 100 m) during a halfyear observation period on Tai Mo Shan,southern China.The simulated climate change resulted in severely declined health status and marked decrease in growth of the transplanted species when compared with their performance at the original elevations.Five of the eight selected species survived for six months after being transplanted to the warmer and drier lowlands,though their health status deteriorated severely.Sematophyllum subhumile,Pseudotaxiphyllum pohliaecarpum and Brachythecium buchananii were highly susceptible to changes in temperature and rainfall patterns and might be used as suitable bioindicators.As the tropics are expected to become hotter and drier,terrestrial mosses might be negatively affected or even be at risk of extinction.Bryophytes in the tropics could represent one of the best biological communities to reflect the direct adverse impact of climate change and provide early warning of the biological outcomes induced by ongoing climate crisis.
Keywords Bioindicator·Bryophytes·Climate change·Secondary forest·Terrestrial mosses
Introduction
The global land surface temperature has warmed by approximately 1°C since 1880 (IPCC 2018),resulting in welldocumented shifts in species distribution with far-reaching implications for biological communities.Yet current international agreements will accept more than double of this magnitude of warming compared to pre-industrial levels by 2030 (2°C target according to the Paris Conference of Parties (COP 21)).By the end of this century,temperature in the tropical regions is predicted to increase by about 3°C in the absence of ambitious efforts to combat global warming(Müller et al.2017).Changes in precipitation patterns that are likely linked to increased greenhouse gas concentrations have also been observed on a global scale;these patterns are spatially and temporally heterogeneous,and predictions of future trends are generally uncertain and often difficult to coherently relate to climate change (Paeth et al.2008).Tropical regions are suffering intensely from climate change,which present some of great challenges to tropical forest ecosystems.
Tropical regions harbor the highest biodiversity among all terrestrial habitats,as described by the latitudinal diversity gradient theory (Hillebrand 2004;Sahney and Benton 2008;Dowle et al.2013).Two-thirds of bryophytes occur in the tropics (Frahm et al.2003),which are biodiversity hotspots and well suited to explore the potential influence of global climate change on bryophyte biodiversity (Gaston 2000) based on unexpectedly high rates of habitat degradation and biodiversity loss (Mantyka-Pringle et al.2013),which are also strongly impacted by anthropogenic activities(Glime 2019).
Extinction risk related to climate change has been widely studied and scientifically estimated (Malcolm et al.2006;Maclean et al.2011;Urban 2015),and species extinction risks for the twenty-first century are considerable (Pereira et al.2013;Glime 2019).Climate change,mainly global warming,is driving many species towards higher latitudes and elevations (Pecl et al.2017).Uphill migration allows montane species to search for suitable microclimates and microhabitats,but habitat fragmentation and range contraction sometimes lock species into separated and eventually unsuitable habitats (Dullinger et al.2012).
Bryophytes are critical components of tropical forest ecosystems due to their high biodiversity (Gradstein et al.2001;Grytnes et al.2006;Frego 2007;Grau et al.2007;Glime 2017) and fulfill essential ecological functions (Longino and Nadkani 1990;Nadkani and Longino 1990;Hölscher et al.2004;Yanoviak et al.2007;Jeschke et al.2008;Zhao et al.2009;Seitz et al.2017).Bryophytes can reflect climate changes more quickly than vascular plants due to their poikilohydry,which makes them ideal bioindicators for climate monitoring (Markert et al.2003;Tuba et al.2011;Ares et al.2012;Nickel et al.2018;Wang et al.2019).They have a wide geographic distribution,rendering them suitable candidates for both latitudinal and elevational range shift studies,as they are found from the poles to the equator (latitudinal diversity gradient) and from sea level to mountain peaks (elevational diversity gradient) (Andrew et al.2003;Glime 2017).
Tropical regions are expected to be marginal localities for bryophytes principally because of their negative carbon gain induced by high temperatures (Zotz and Bader 2009;Song et al.2012).Bryophytes have to equilibrate their daily carbon dioxide acquisition with night respiration to avoid net biomass loss or even dieback,especially in warm and humid seasons.Several studies have focused on the ecophysiology of tropical bryophytes (Wagner et al.2014a),such as desiccation and temperature tolerance (Johnson and Kokila 1970;Zotz and Bader 2009;Song et al.2012;Bader et al.2013;Wagner et al.2014b),photosynthetic light response and related functional traits (Marschall and Proctor 2004;Waite and Sack 2010),and photosynthetic light,water and temperature responses (Wagner et al.2013).
However,these empirical studies on the impact of climate change on bryophytes focused mainly on non-vascular epiphytes and even included lichens.Knowledge of the potential influence of global warming and possible changes in water availability patterns on the health,growth and survival of terrestrial mosses is limited,especially for species inhabiting mountain peaks,which have no higher elevations to migrate.In this study,we transplanted eight terrestrial moss species from highland areas to two lower elevations on Tai Mo Shan,Hong Kong,and observed their health condition,growth,and survival rates.During the observation period,Hong Kong experienced the warmest year since records began in 1884;the mean annual temperature was 1.2°C higher than that during the 1981-2010 period (Hong Kong Observatory 2020).The objectives of this study were:(1) to explore the potential influence of higher temperatures,lower relative humidity and rainfall on the health status,growth and survival rates of eight bryophyte species,and(2) to determine whether the selected bryophyte species are ideal bioindicators of climate change.
Materials and methods
Study area
Hong Kong is situated in the eastern Pearl River Delta of the South China Sea,22°9′-22°33′ N,113°50′-114° 26′ E,with a territory of 1104 km2.It lies 130 km south of the Tropic of Cancer and features a humid subtropical climate with distinct hot humid and cool dry seasons.Despite its small area,there are distinct horizontal and vertical climatic gradients in Hong Kong.The primary evergreen or semi-evergreen monsoon forests that used to cover Hong Kong were cleared 400 years ago,except for some tiny,undisturbed patches in elevated,remote,and steep regions (Corlett 1997;Zhuang and Corlett 1997).
Hong Kong is one of the most densely populated places in the world,with less than 25% of the total land area being urbanized.Generally hilly to mountainous terrain with steep slopes occupies approximately 75% of the total land area.Undeveloped land has very few flat areas and consists mostly of secondary forests,grassland,shrubland or farmland(Ashworth et al.1993;Corlett 2000;Owen and Shaw 2007;Planning Department 2017).About 40% of the undeveloped land area is country parks and nature reserves (Morton and Harper 1995).Despite the small total extent of Hong Kong and massive human disturbance,diverse flora and fauna still survive (Corlett 2000;Dudgeon and Corlett 1994),with more than 3,000 species of vascular plants,of which 300 are endemic to Hong Kong (Hu 2003;Agriculture,Fisheries and Conservation Department 2020).The known bryophyte flora of Hong Kong consists of 372 species from 70 families and 159 genera,of which 238 are mosses and 134 are liverworts and hornworts (Zhang 2003).
Tai Mo Shan is the highest peak in Hong Kong,with an elevation of 957 m.It has an area of 1440 ha and is situated in the Tai Mo Shan Country Park in the center of the New Territories,Hong Kong.Due to the height of the mountain,Tai Mo Shan is claimed to be Hong Kong’s most misty area,as it is often covered in clouds.It is not uncommon for temperatures to drop below the freezing point during winter(Hong Kong Observatory 2017).The vegetation types on our study sites along the elevation gradient change greatly from lowland to the peak.Dense broad-leaved lowland woodlands are mainly distributed in hilly areas below 400 m,withGlochidion hongkongenseandSyzgium levineidominating at 100 m and 300 m,respectively.Dense broad-leaved lowhill forests are mostly located on uplands between 400 and 550 m.Cinnamomum porrectumis dominant at 500 m.Grasslands are widely found at upper slopes above 550 m to the peak.At 700 m,small montane shrub patches are distributed in the dense grasslands with the grass speciesMiscanthus sinensisbeing dominant.At 900 m and near the peak,montane shrub patches or montane forest patches exist,withM.sinensisagain the commonest species.The area has become one of the major forest plantations with mainly native species in Hong Kong,starting from 2013 (BGCI webinar series 2021).Trees planted here are mostly native species,such asFicus microcarpa,Endospermum chinense,Syzgium levinei,Antidesma bunius,Psychotria asiaticaandAquilaria sinensis,with a few non-natives,such asPinus massoniana,Acacia confusa,Lophostemon confertusandMelaleuca quinquenervia.Forests are limited to a maximum altitude of 550 m,while the upper slopes are dominated by shrubs and grasses (Zhuang and Corlett 1997).
Experiment design and measurement
Eight terrestrial moss species from two elevations (six species from 900 m,two species from 500 m) were selected from the northern slope of Tai Mo Shan (Table 1).All eight species were common at the original elevation,and a few or no species were found at the three other altitudes.In April 2019,fresh and healthy samples of the moss species were collected and air-dried for 24 h to a constant weight in the laboratory,and litter and non-target species were removed from each sample.A total of 198 bags were used for the treatments (3 elevations×6 species×3 replicates×3 observation times+2 elevations×2 species×3 replicates×3 observation times).Samples (1.0±0.01 g for each treatment)were prepared and placed in 5 cm×5 cm stretchy plastic bags.
On the first day of May 2019,samples were transplanted to the various elevations,and the original elevation served as the control (six species from 900 to 500 and 100 m,two species from 500 to 100 m).Before the samples were randomly planted or placed in each plot,the litter layer and other bryophytes were removed to make sure that each sample was in direct contact with the mineral soil.The plots at each site were fenced by a plastic board to make sure the samples were not washed away by moving water caused by heavy rain.After placement,the samples were moistened to their normal state.
The health status,survival rate,and growth of all study species both in situ and after transplanting were monitored.Samples were collected for analysis after two,four,and six months.In total,66 treatments were collected into plastic bags and transported to the laboratory at each observation time.The health status of all samples at each elevation was assessed at the study sites.Twenty-four sacrificial samples(3 for each species) were placed in a 60°C oven for 24 h and reweighed for treatments correction.In the laboratory,after litter and non-target species were removed,weights of 24-h air-dried treatments were corrected to oven-dry weights using sacrificial samples to avoid the impact of differences in humidity at different weighing times.

where,yis corrected weight;ais the weight of 24-h airdried treatment;bis the weight of sacrificial sample after 60°C oven dried treatment;cis the weight of 24-h air-dried sacrificial sample.
We modified the method developed by Rosso et al.(2001)to assess the overall health condition of all samples according to their thallus color,using a scale of 0-5,with 0 indicating completely brown or dead-looking and 5 representing active green thalli (Table 2).We recorded moss biomass accumulation over a 6-month period after transplant during the growing season from the end of April to the end ofOctober in 2019.Biomass accumulation rates were measured as biomass changes relative to the initial biomass over the experimental period.Through biomass accumulation measurements,we assessed the net result of growth and decomposition,especially the acclimation to lower elevations.The weight of each sample was corrected to the oven dry weight using sacrificial standards.We assumed that the difference in the relative humidity of the laboratory at various times would not influence the results.
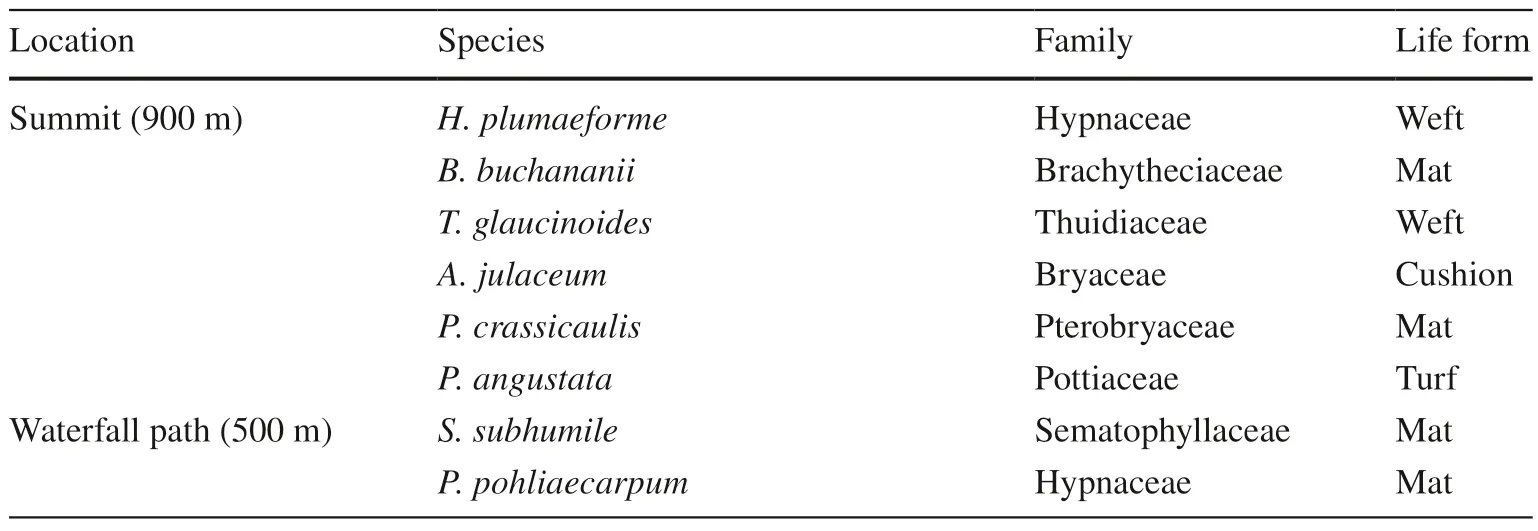
Table 1 Terrestrial moss species from two elevations for being used in the transplant experiment (listed in descending order of their relative field abundance)
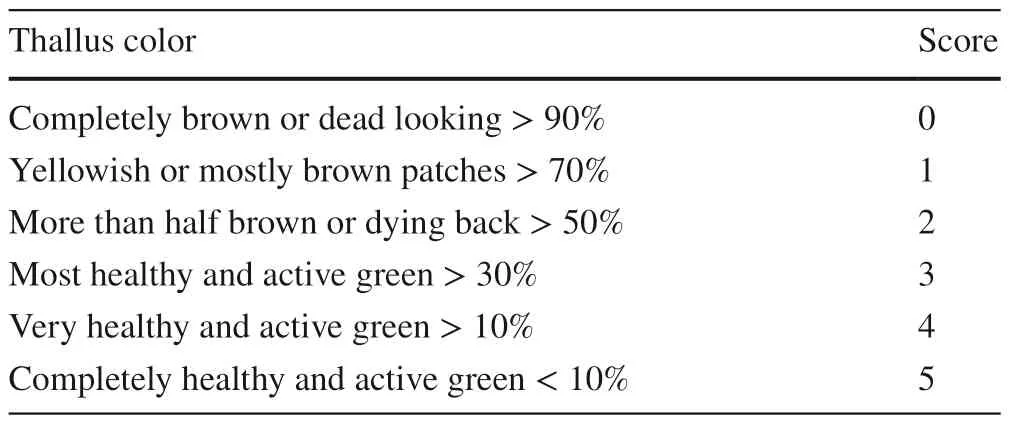
Table 2 Criteria for assessing the overall health status of each sample
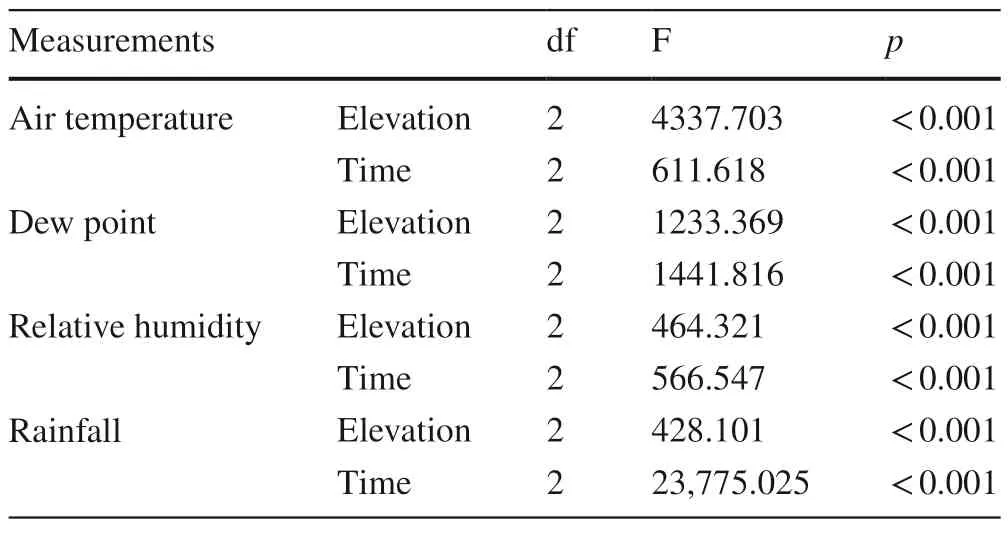
Table 3 Results of multi-way ANOVAs for environmental factors of the three elevations during the observation periods (n=3)
Environmental and climatic factors
Environmental and climate indices,including air temperature,dew point,relative humidity and rainfall at each elevation,were obtained from a local weather station if possible.Weather data were not available for the northerlyaspect 500 m.elevation sites,and climate parameters were instead measured at the self-deployed mini weather stations or were estimated according to the nearest meteorological station.After all needed items (including SIM cards) and sensors conf giured,the datalogger was set at WIFI mode and recorded data every 60 s.Three mini weather stations were set up at 500 m to automatically collect air temperature,dew point,relative humidity,and rainfall data.Vapor pressure def ciit (VPD) showing the dry degree of environment at each elevation was calculated based on mean air temperature and relative humidity.
Statistical analysis
All environmental variables were averaged for each elevation.All statistical tests were performed using SPSS (version 26.0;IBM).Data were checked for deviations from normality and homogeneity of variance before statistical analysis.ANOVAs with Tukey’s post hoc tests were performed to assess significant differences between different elevations and observation times.Differences in the health status,growth,and environmental factors among different elevations and sampling periods were analyzed using multi-way ANOVAs.Differences in overall health status and growthcondition among different elevations within each observation period were analyzed with one-way ANOVA.
Results
Environmental factors during measuring periods
Multi-way ANOVAs showed significant effects of elevation on air temperature,dew point,relative humidity,and rainfall during the observation period (Table 3).The mean air temperature at 900 m.was 21.2°C,which was significantly lower than that at 500 (24.0°C) and 100 m (27.1°C).The mean dew point showed a trend similar to that observed for air temperature,with mean values of 20.0°C,22.2°C and 23.6°C at 900,500 and 100 m,respectively.The relative humidity,however,showed a reverse trend compared with air temperature,with mean values of 94.4%,91.9% and 84.4% at 900,500 and 100 m,respectively.Mean rainfall at 900 m (642 mm) was significantly higher than at the two other elevations.The mean VPD at 900 m was 0.14 kPa,which was significantly lower than that at 500 m (0.24 kPa)and 100 m (0.56 kPa).Multi-way ANOVAs showed significant effects of measuring time (June,August and October)on air temperature,dew point,relative humidity,and rainfall(Table 3).The dynamics of air temperature,dew point,relative humidity,and rainfall followed similar patterns among the three elevations (Fig.1).
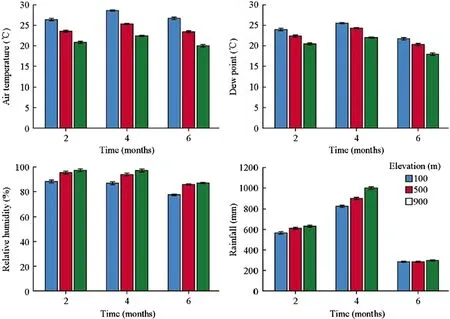
Fig.1 Comparison of mean air temperature,dew point,relative humidity,and rainfall among different elevations during the observation period.Error bars indicate the 95% confidence interval (n=3)
Health status of terrestrial mosses
The initialHypnum plumaeformesamples from the three elevations were completely healthy with active green thalli.The health status ofH.plumaeformediffered significantly among the three elevations at four (F=40.939,p<0.001)and six (F=14.837,p<0.01) months after transplant.The health status of samples at 100 m.deteriorated markedly,with parts of the transplants turning brown or dying backfour months after transplant (Fig.2).Multi-way ANOVAs showed that the effect of measuring time on the health status of all six moss species from 900 m was significant,similar to the effect of elevation (Table 4).
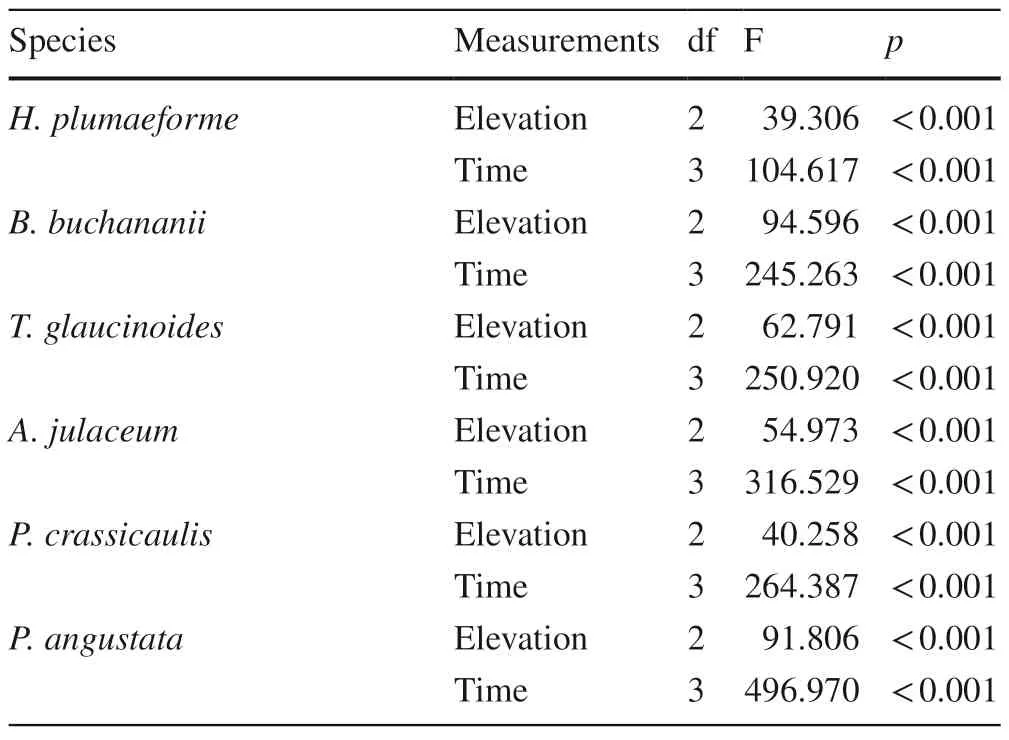
Table 4 Results of multi-way ANOVAs for the effects of elevation and time on health status of six terrestrial moss species from 900 m(n=3)
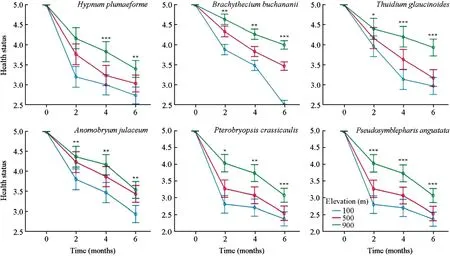
Fig.2 Effect of simulated climate change on the health of six terrestrial moss species from 900 m.Error bars indicate the 95% confidence interval (n=3).***Significant at the 0.001 level;**Significant at the 0.01 level;*Sgnificant at the 0.05 level
The initialBrachythecium buchananiisamples from the three elevations were completely healthy with active green thalli.The health status ofB.buchananiidiffered significantly among the three elevations two months after transplant (F=40.939,p<0.001).The health status of samples at 500 and 100 m deteriorated obviously,with parts of the transplants turning brown or dying back four months after transplant (Fig.2).Samples at 100 m turned completely brown and died back.
Thuidium glaucinoides,Anomobryum julaceum,Pterobryopsis crassicaulis,andPseudosymblepharis angustatashowed similar trends as those observed forB.buchananii.Significant differences among the three elevations in the health status ofT.glaucinoides,A.julaceum,P.crassicaulis,andP.angustataoccurred two months after transplant(Fig.2).The overall health of samples at 100 m was significantly worse than at the original elevation.
Sematophyllum subhumileandPseudotaxiphyllum pohliaecarpumfrom 500 m responded to the simulated climate change in a similar way as samples of these speciesfrom 900 m.The health status of the two species differed significantly between 500 and 100 m two months after transplant (p<0.001).Samples at 100 m turned brown and died back four months after transplant (Fig.3).The effect of time on the health status was significant,as was the effect of elevation (Table 5).
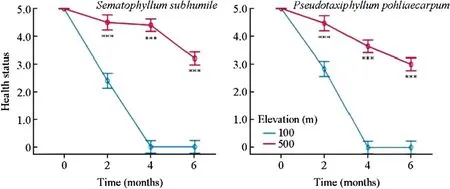
Fig.3 Effect of simulated climate change on the health of two terrestrial moss species from 500 m.Error bars indicate the 95% confidence interval(n=3).***Significant at the 0.001 level;**Significant at the 0.01 level;*Significant at the 0.05 level

Table 5 Results of multi-way ANOVAs for the effects of elevation and time on health status of two terrestrial moss species from 500 m(n=3)
Response of the growth condition of terrestrial mosses
Multi-way ANOVAs showed that the effect of sampling time on the growth of all six moss species was significant,as was the effect of elevation (Table 6).No significant differences in the initial biomass of the six moss species were detected among the different elevations (Fig.4).
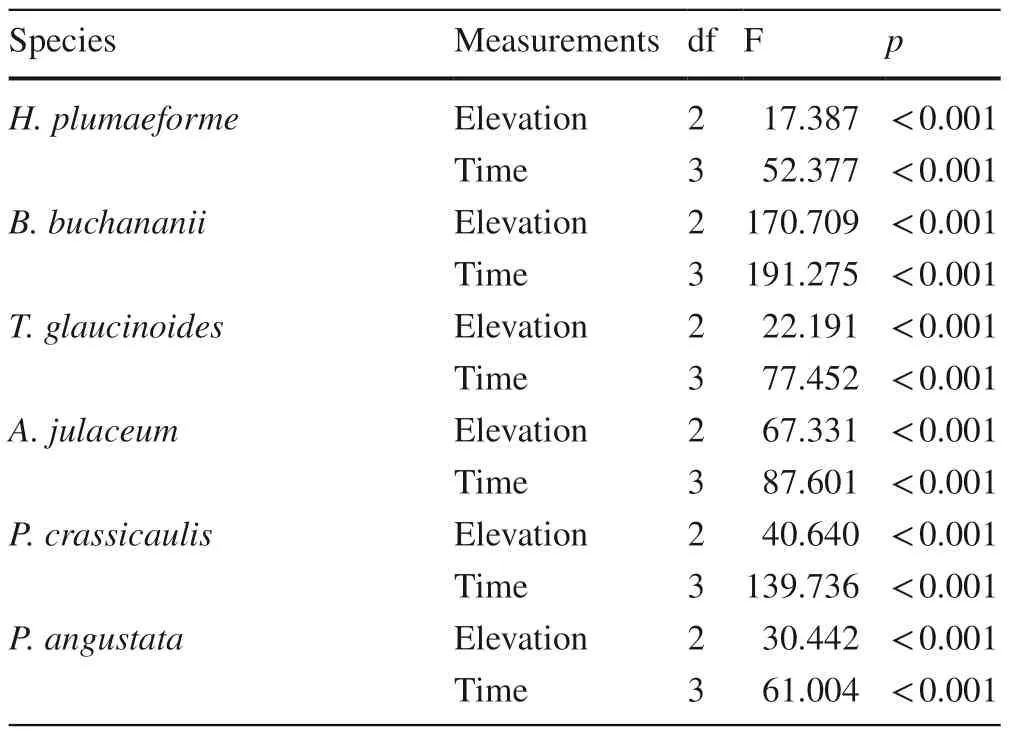
Table 6 Results of multi-way ANOVAs for the effects of elevation and time on growth condition of six terrestrial moss species from 900 m (n=3)
Significant differences inH.plumaeformebiomass were measured among the three elevations after transplant.H.plumaeformegrew fastest at 900 m and slowest at 100 m,and the differences between 500 and 100 m were not statistically significant (Fig.4).The mean biomass accumulation ofH.plumaeformeat the lower elevations was significantly lower than that at 900 m after transplant (Fig.4).Samples at all sites had negative growth rates from July to October 2019 than the first two months (Fig.4).
B.buchananiiresponded to the simulated climate change in a similar way asH.plumaeforme,but transplants at the low elevation exhibited little growth,and died back at six months at 100 m after transplant,which resulted in no biomass gain (Fig.4).T.glaucinoidessamples grew best at thehigh elevation followed by medium elevation.No significant differences were measured in the first two months after transplanting.All samples at the three sites yielded negative growth rates from July to October 2019 (Fig.4).
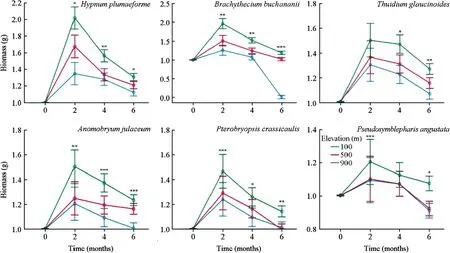
Fig.4 Effect of simulated climate change on the growth condition of six terrestrial moss species from 900 m.Error bars indicate the 95% confidence interval (n=3).***Significant at the 0.001 level;**Significant at the 0.01 level;*Significant at the 0.05 level
A.julaceum,P.crassicaulis,andP.angustataresponded to the simulated climate change in a similar manner toB.buchananii.We observed no significant differences inP.angustataamong the three elevations four months after transplant.The biomass ofA.julaceumandP.crassicaulisdiffered significantly among different elevations after transplant;these species grew better at high elevation than at 500 and 100 m,and no significant differences were observed between the two lower elevations.
S.subhumileandP.pohliaecarpumfrom 500 m responded to the simulated climate change in a similar manner as observed for these species from 900 m.The growth of these species differed significantly between the two elevations two months after transplant (p<0.001).Samples at 100 m completely died back four months after transplant(Fig.5).The effect of observation time on growth was significant,as was the effect of elevation (Table 7).

Table 7 Results of multi-way ANOVAs for the effects of elevation and time on growth condition of two terrestrial moss species from 500 m (n=3)
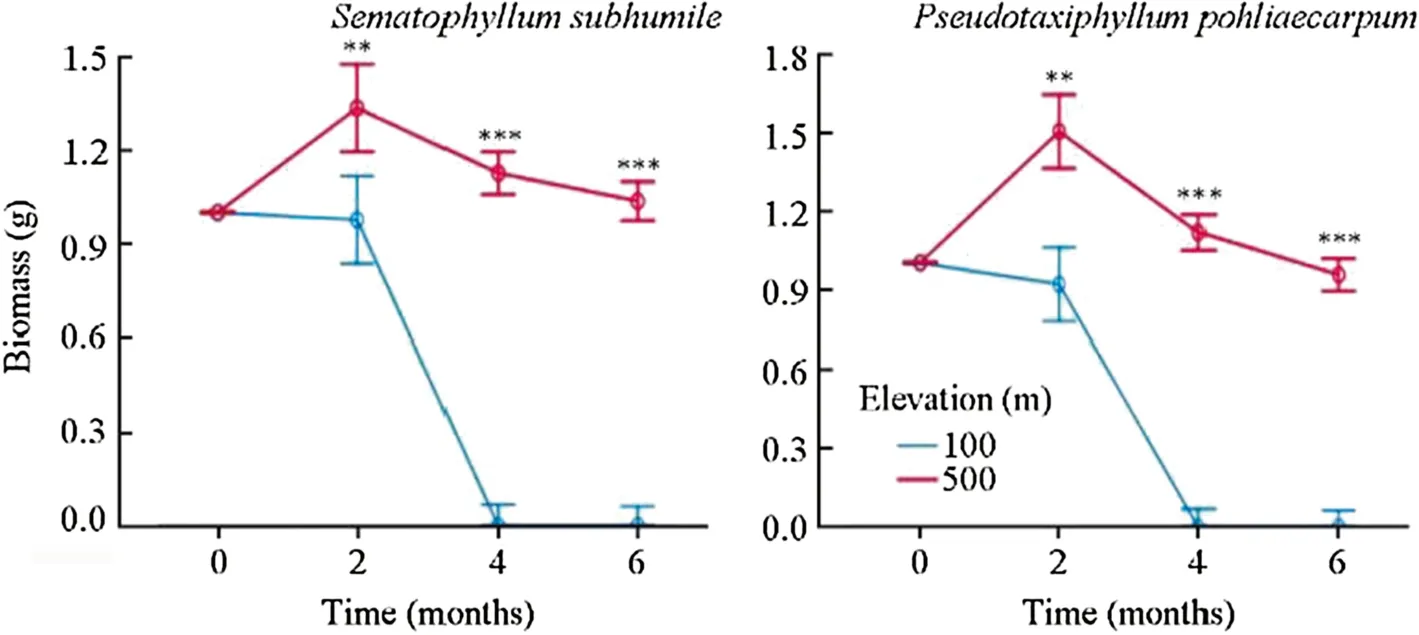
Fig.5 Effect of simulated climate change on the growthcondition of two terrestrial moss species from 500 m.Error bars indicate the 95% confidenceinterval (n=3).***Significant at the 0.001 level;**significant at the 0.01 level;*significant at the 0.05 level
Discussion
The experimental period recorded a mean air temperature increase by 3.0°C,dew point increase by 1.8°C,relative humidity decrease by 5%,vapor pressure deficit (VPD)increase by 0.21 kPa and rainfall decrease by 42 mm in the lowland area compared with the high elevation (Fig.1).Under rapid and persistent global warming and a likely declining trend of relative humidity and rainfall (Hijmans et al.2005;Ramirez and Jarvis 2008),the relocation of terrestrial mosses from high to low elevations can be used to estimate the impacts of future global climate change in the study area.
Health status of all transplants declined during the whole period,but biomass yield increased significantly in the first two months and then declined for the rest of experiment.When bryophyte species were transplanted to lower elevations,the overall health and growth were significantly lower,especially under the warmest and driest environments,than their performances at the original elevations (Figs.2-5).The most marked result of this study is that five of eight moss species survived six months after transplant to the warmer and drier lowlands,and even in these species with severely deteriorated overall health status (Figs.2 and 4).We did not detect positive growth rate after June at lower elevations compared to that of first two months,so survival might be pro-acclimated to warmer and drier lowlands.The simulated climate change significantly and negatively affected the overall health and growth of most transplanted species studied in the six-month period (Figs.2,3,4,5).Similar results were obtained in our laboratory study;as the temperature increased,the health status,photosynthetic activities and biomass gains declined sharply (Hao and Chu 2021).Song et al.(2014) also observed markedly declined growth rates and a negative effect on the health of transplanted epiphytes within two years.In addition,Wagner et al.(2014b)found that no short-term acclimation existed,and that a temperature increase led to poorer health and eventually high mortality of transplanted bryophytes.The relative abundance of species in the field changed significantly with a 1.5°C-2.5°C temperature increase over two years(Jácome et al.2011).
These results can be explained in three ways.First,high respiratory carbon losses and a shorter period of photosynthetic activities induced by increased temperature contributed to the decline of growth gains (Proctor 2011;Wagner et al.2013).Second,as mosses are poikilohydric,they rapidly lose water content and their photosynthetic efficiency decline dramatically when the relative humidity decreases,with photosynthetic capacity resuming only if they are rehydrated (Sillett and Antoine 2004).Wagner et al.(2013) suggested that the timing and duration of wetting rather than the water content were the main drivers in this respect,and temperature-dependent metabolism is limited with increasing evaporation rates,restricting the period for net photosynthesis.This situation was exacerbated by wet and warm nights.Third,increased temperature and dry environments exerting asymmetrical effects on respiration and photosynthesis do harm to the overall health status and photosynthetic apparatus of these bryophyte species,thereby decreasing their photosynthetic performance (He et al.2016),which in turn fail to sustain their health.Consequently,these mosses could not maintain the high photosynthetic rates to counteract the respiratory carbon losses in warmer and drier lowland areas.
Another striking result was that biomass accumulation increased significantly only in the first two months and then decreased severely,and negative growth rates were found during the last two observation periods irrespective of whether mosses were transplanted to lower elevations.However,the health status declined significantly during the experiment,except the first two months when compared to the control.We cannot differentiate whether the reduced growth rate was caused by the warmest year since records began in 1884 or whether this represents a seasonal phenomenon.A possible explanation for the positive growth rates in the first measurement period is that the highest relative humidity occurred in the first two months and old thalli turned yellow or brown,which is quite a natural phenomenon for plants as new leaves formed.Wet and warm nights might be the possible reasons for negative growth rates recorded in the subsequent measurement periods because August had the highest air temperature,dew point and rainfall recorded.
Other studies have also documented the responses of bryophytes to climate change,and even slight shifts in climate conditions may have negative consequences.Range shifts of vascular plants induced by higher temperatures in highlatitude ecosystems led to a reduction in bryophyte cover(Tømmervik et al.2004;Guglielmin et al.2014;Royles and Griffiths 2014).Bjerke et al.(2011) suggested that a warm winter had negative effects on the photosynthetic activities and growth rates of moss species in sub-arctic heathlands.Furthermore,the range for many European bryophyte species has contracted whereas range expansions for other species have occurred at their northern limits (Bergamini et al.2009;Désamoré et al.2012;Hodd et al.2014).
Bryophytes,especially epiphytes,have long been used as indicators to monitor climate change (Gignac 2001).S.subhumileandP.pohliaecarpumshowed the most significant and substantial differences in growth and health four months after being exposed to warmer and drier environments.Therefore,S.subhumileandP.pohliaecarpumcould be employed as potential climate change indicators in the marginal tropics.A significant negative effect of relocation to lowland areas on the health and biomass ofB.buchananiiwas detected six months after transplanting.These results indicate thatB.buchananiiwas susceptible to climate change.The fvie other moss species survived the whole experiment even though they experienced severely deteriorated health and reduced growth rates.This implies that these species are not good indicators of short-term simulated climate change,and may indicate that even warmer and drier sites are suitable for some species due to their phenotypic plasticity (Bradshaw 1965;Callahan et al.1997).Why these five species were unsuccessful in establishing in lowland areas remains unresolved.All species have limitations to their capacity for adaptive response to changing environments (Williams et al.2008),and these limits are unlikely to increase for species already experiencing warm temperatures close to their tolerance limits (Araújo et al.2013).
Conclusions
To understand the rapid,persistent impact of climate change,we generally need several decades of data to rigorously assess pre-and post-climate change trends at the level of species and ecosystems;however,such long-term data sets are rare for biological systems.We attempted to assess the possible short-term impact of climate change on the health status,growth,and survival rate of terrestrial moss species.The short-term simulated climate change in temperature and water patterns resulted in significantly deteriorated overall health and remarkable decrease in growth of the transplanted species.Although they yielded significantly deteriorated health and reduced growth rates,five of the eight selected species survived six months at the warmer and drier lowlands.However,pro-acclimation due to phenotypic plasticity may be overestimated due to current climatic conditions.As the rate of future climate change will likely outweigh the potential acclimation of many species,in addition to humaninduced habitat loss and habitat fragmentation,bryophyte species redistribution induced by climate change in tropical mountain regions may not occur.
This study fills the gap in empirical evidence on the sensitivity of terrestrial moss species to climate change.As climate conditions in the tropics are expected to become hotter and drier,many moss species might be negatively affected or even at the risk of extinction.Because bryophytes have essential ecological functions in land ecosystems,the adverse effects of climate change on moss species cannot be considered in isolation.Tropical bryophytes may be one of the best biological communities to monitor climate change and provide an early understanding of possible biological scenarios,even though we cannot predict the long-term inf ulence of climate change from the present study.However,conservation efforts to sustain the resilience of tropical forest ecosystems to climate change should include bryophyte communities.
AcknowledgementsWe thank the Agriculture,Fisheries and Conservation Department of the Hong Kong SAR Government for allowing us to set up mini-weather stations at our experimental sites,and Dr.Li Zhang from the Shenzhen Fairylake Botanical Garden and the Chinese Academy of Sciences for his assistance in moss identification.
 Journal of Forestry Research2022年5期
- Journal of Forestry Research的其它文章
- A review of the effects of forest fire on soil properties
- Correction To:Epidemiological derivation of flux-based critical levels for visible ozone injury in European forests
- Correction to:The dissemination of relevant information on wildlife utilization and its connection with the illegal trade in wildlife
- Improved guidelines for any-aged forestry
- Fuel and vegetation changes in southwestern,unburned portions of Great Smoky Mountains National Park,USA,2003–2019
- The effects of fire and seasonal variations on soil properties in Juniperus excelsa M.Bieb.stands in the Alborz Mountains,Iran
