
Morphometric changes in the cortex following acute mild traumatic brain injury
2022-08-15 15:46:22MengJunLiSiHongHuangChuXinHuangJunLiu
中国神经再生研究(英文版) 2022年3期
Meng-Jun Li, Si-Hong Huang, Chu-Xin Huang, Jun Liu
Abstract Morphometric changes in cortical thickness (CT), cortical surface area (CSA), and cortical volume (CV) can reflect pathological changes after acute mild traumatic brain injury (mTBI).Most previous studies focused on changes in CT, CSA, and CV in subacute or chronic mTBI, and few studies have examined changes in CT, CSA, and CV in acute mTBI.Furthermore, acute mTBI patients typically show transient cognitive impairment, and few studies have reported on the relationship between cerebral morphological changes and cognitive function in patients with mTBI.This prospective cohort study included 30 patients with acute mTBI (15 males, 15 females, mean age 33.7 years) and 27 matched healthy controls (12 males, 15 females, mean age 37.7 years) who were recruited from the Second Xiangya Hospital of Central South University between September and December 2019.High-resolution T1-weighted images were acquired within 7 days after the onset of mTBI.The results of analyses using FreeSurfer software revealed significantly increased CSA and CV in the right lateral occipital gyrus of acutestage mTBI patients compared with healthy controls, but no significant changes in CT.The acute-stage mTBI patients also showed reduced executive function and processing speed indicated by a lower score in the Digital Symbol Substitution Test, and reduced cognitive ability indicated by a longer time to complete the Trail Making Test-B.Both increased CSA and CV in the right lateral occipital gyrus were negatively correlated with performance in the Trail Making Test part A.These findings suggest that cognitive deficits and cortical alterations in CSA and CV can be detected in the acute stage of mTBI, and that increased CSA and CV in the right lateral occipital gyrus may be a compensatory mechanism for cognitive dysfunction in acute-stage mTBI patients.This study was approved by the Ethics Committee of the Second Xiangya Hospital of Central South University, China (approval No.086) on February 9, 2019.
Key Words: acute mild brain trauma injury; Alzheimer’s disease; cognitive function; cortical surface area; cortical thickness; cortical volume;FreeSurfer; surface-based morphometry
Introduction
Traumatic brain injury is the most common type of brain injury, and 75–90% of traumatic brain injury patients have mild traumatic brain injury (mTBI) (Mondello et al., 2014).Although more than 85% of mTBI patients no longer show symptoms several days or weeks after the mTBI incident(Williams et al., 2010), some patients develop a series of permanent symptoms including somatic (headache, dizziness,fatigue) (Cooksley et al., 2018; Оfoghi et al., 2020), sleeprelated (difficulty falling asleep) (Chaput et al., 2009),emotional (irritability, depression, anxiety, and posttraumatic stress) (Carroll et al., 2014; Wang et al., 2017), and cognitive problems (memory deficits, concentration difficulties)(McDonald et al., 2012; Bryer et al., 2013).
Magnetic resonance imaging (MRI) techniques allow the possibility of identifying potential cortex and white matter lesions in mTBI patients.Multiple neuroimaging modalities,including high-resolution structural imaging (Clark et al.,2018; Eierud et al., 2019), diffusion tensor imaging (Asken et al., 2018; Yin et al., 2019), high angular resolution diffusion imaging (Mohammadian et al., 2017; Wu et al., 2018; Palacios et al., 2020), and resting state functional MRI (Rosenthal et al., 2018; Lu et al., 2020) have been applied to evaluate pathophysiological changes in the brain in patients with mTBI.These studies have revealed changes in cortical thickness (CT),cortical surface area (CSA), cortical volume (CV), macro- and micro-structural white matter integrity, functional networks,connectivity alterations, and cerebral blood flow in mTBI patients.
Among the various structural surface-based morphometric analysis studies, CT, CSA, and CV have been used as biomarkers to reflect pathological changes after mTBI (Epstein et al.,2016; Hellstrøm et al., 2016; Dall’Acqua et al., 2017).Previous studies have defined CT as the average distance between the white-gray matter interface to the nearest point of the gray matter-cerebrospinal fluid interface, and from that point on the gray matter-cerebrospinal fluid interface back to the white-gray matter interface (Fischl et al., 1999).CSA has been calculated as the area of triangles making up the gray mattercerebrospinal fluid surface, which represents the outer layer of the cerebral cortex (Fischl and Dale, 2000).CV is the volume of gray matter that lies between the white-gray matter interface and gray matter-cerebrospinal fluid interface (Winkler et al.,2010).Most studies (Hayes et al., 2017; Clark et al., 2018;Eierud et al., 2019) report lower CT in mTBI patients when compared with matched healthy controls, and the lower CT was associated with worse cognitive performance, although a few studies found no changes or increased CT (Dall’Acqua et al., 2017; Clark et al., 2021).A recent study showed that reduced CT was found in regions vulnerable to tissue loss in Alzheimer’s disease among individuals with a history of mTBI and a high genetic risk for Alzheimer’s disease, which implies that mTBI may influence the relationship between CT and the genetic risk for Alzheimer’s disease (Hayes et al., 2017).Another study reported that mTBI patients at 3–6 months post-injury had lower CSA in right postcentral regions, inferior temporal cortex, and superior frontal areas in comparison with healthy controls (Bajaj et al., 2018).In the same study,the mTBI patients at 6–18 months post-injury showed significantly higher CSA in left postcentral regions, superior temporal areas, and the right isthmus of the cingulate gyrus in comparison with CSA measurements at 3–6 months (Bajaj et al., 2018).These findings imply that alterations in CSA can be used to reflect cortical recovery during the chronic stages of mTBI.Reduced CV has also been found in the bilateral anterior cingulate gyrus, left cingulate gyrus, and right precuneus over the first 13 months after a single mTBI event (Zhou et al.,2013).
These aforementioned studies explored CT, CSA, and CV alterations over the entire cortex and their correlations with physical, emotional, and cognitive symptoms after mTBI.However, most of the studies investigated the CT, CSA, and CV of mTBI patients in the sub-acute or chronic stage, and only a few studies focused on CT, CSA, and CV changes in the acute stage (Wang et al., 2015; Dall’Acqua et al., 2016; Govindarajan et al., 2016; Shao et al., 2018).Furthermore, the published studies performing structural MRI evaluations on mTBI patients have not reached a consensus regarding CT, CSA,and CV alterations in the acute stage.Finally, a few studies evaluated associations between alterations in CT, CSA, and CV and cognitive functioning in acute mTBI patients and observed transient cognitive deficits in the acute stage.
mTBI patients typically have severe symptoms in the acute and sub-acute stages (Ling et al., 2013), although most patients report a full recovery from clinical and neuropsychological symptoms within several days or weeks.During the acute stage, mTBI patients typically complain about physical,emotional, and cognitive symptoms (Zemek et al., 2016).Оur main hypothesis was that mTBI patients would show significant alterations in CT, CSA, and CV in the acute stage,with these changes resulting in cognitive impairment.Thus,this study aimed to investigate alterations in CT, CSA, and CV using high-resolution T1-weighted MR images of mTBI patients acquired within 7 days after injury, and to evaluate correlations between cognitive functioning and changes in CT,CSA, and CV.
Participants and Methods
Participants
All of the mTBI patients in this cohort study were enrolled from the Department of Radiology of the Second Xiangya Hospital between September and December 2019.The sample size calculation was based on previous studies (Zhou et al., 2013; Shao et al., 2018; Оfoghi et al., 2020).The mTBI patients were pre-screened prior to scanning to rule out any contraindications to MRI.The inclusion criteria for the mTBI patients were based on the World Health Оrganization’s Collaborating Center for Neurotrauma Task Force (Holm et al., 2005): (1) Glasgow Coma Scale (Teasdale et al., 2014)score ranging from 13–15; (2) one or more of any of the following: (a) existence of confusion or disorientation, (b) loss of consciousness of less than 30 minutes, (c) post-traumatic amnesia of less than 24 hours, (d) existence of transient neurologic abnormalities (focal signs or seizure), (e) existence of an intracranial lesion not requiring surgery; (3) mTBI onset within 7 days of trauma.The exclusion criteria for mTBI patients followed those used in the study of Shao et al.(2018):(1) a history of brain injury; (2) penetrating craniocerebral injury and/or presence of a skull fracture; (3) mTBI due to other injuries (e.g., systemic injuries, facial injuries, or spinal cord injury); (4) a history of neurological disease, long-standing psychiatric condition, or other problems (e.g., psychological trauma, language barrier); (5) coexisting medical conditions and/or drug abuse (e.g., alcohol abuse, administration of sedatives); and (6) structural abnormality on neuroimaging(computed tomography and MRI).
Healthy controls were enrolled from those undergoing health check-ups at the Second Xiangya Hospital over the same time period, and were pre-screened before scanning to rule out any contraindications to MRI, neurological impairment, or psychiatric disorders.All procedures performed in the studies involving human participants were in accord with the ethical standards of the Ethics Committee of the Second Xiangya Hospital of Central South University and the 1964Helsinki Declarationand its later amendments or comparable ethical standards.Approval was granted by the Ethics Committee of the Second Xiangya Hospital of Central South University(approval No.086) on February 9, 2019.Written informed consent was obtained from all participants before testing.This study followed the STrengthening the Reporting of ОBservational studies in Epidemiology (STRОBE) statement(Additional file 1).A flow chart of the study procedure is presented inFigure 1.
MRI data acquisition
A high-resolution T1-weighted magnetization prepared rapid gradient echo sequence was acquired on a 3.0-T MRI scanner(MAGNETОM Skyra, Siemens Healthcare, Erlangen, Germany)equipped with a 32-channel head coil.A head stabilizer was used to reduce head motion.The T1-weighted images were acquired with the following parameters: repetition time =2400 ms, echo time = 2.27 ms, field of view = 256 mm × 256 mm, flip angle = 8°, and voxel size = 1 mm × 1 mm × 1 mm.All subjects were confirmed to show minimal head movement during scanning.Cerebral lesions and micro-bleeds were inspected independently by CXH and JL, both with more than 10 years of experience in neuroimaging.Any disagreement between the two doctors was resolved by consensus.
Clinical assessments
Clinical assessments were performed on all participants by two authors (CXH and JL), with more than 5 years of experience in the clinical assessments of mTBI patients.To avoid multiple testing issues, three tests were selected for cognitive assessment: (1) The Digital Symbol Substitution Test (DSST); (2) the Trail Making Test A (TMT-A) (Reitan and Wolfson, 1993; Delis et al., 2001); and (3) the Trail Making Test B (TMT-B) (Reitan and Wolfson, 1993; Delis et al., 2001).
The participants’ processing speed, sustained attention,and working memory were assessed by the DSST (Wechsler,1997; Qin et al., 2017).The corresponding relationships of nine numbers and symbols were shown for each subject participating in the DSST, and the participants were instructed to match the correct symbol to the corresponding number in 2 minutes.The total score was the number of correctly matched symbols, with a higher number of correctly matched symbols indicating better performance in the assessment.
The TMT-A was administered as a baseline measure of motor and visual search speed (Sánchez-Cubillo et al., 2009;Misdraji and Gass, 2010).Each subject was instructed to draw lines connecting circles numbered from 1 to 25 as quickly as possible.The score was the number of seconds required to complete the task.A shorter time indicates better performance.
The Trail Making Test B (TMT-B) is widely used as a measure of set-shifting and inhibition (Arbuthnott and Frank, 2000;MacPherson et al., 2017).The participants were asked to switch alternately between 13 numbers (1–13) and 12 letters(A-L) displayed in circles and connect them in an ascending order (1-A-2-B…12-L-13) as quickly as possible.The score was the number of seconds required to complete the task.A shorter time indicates better performance.All of these tests are widely used in neuropsychological assessments as indicators of cognitive processing speed and executive functioning (Asken et al., 2018).
CT, CSA, and CV Assessments
All of the image data were inspected for artifacts that might have affected the automated segmentation performed using FreeSurfer (Fischl and Dale, 2000).Then, FreeSurfer version 6.0 (https://surfer.nmr.mgh.harvard.edu/fswiki) was used to extract CT, CSA, and CV from the high-resolution T1-weighted images (Fischl and Dale, 2000).Fully-segmented images were acquired using the recon-all pipeline, and the accuracy of the generated pial and white matter surface images was visually examined by CXH and JL after the segmentation.Any errors in tissue classification that occurred during the automated processing were manually edited and rerun through the FreeSurfer processing pipeline (Fischl et al., 1999).The CT, CSA,and CV of each subject were calculated independently for the left and right hemispheres.Finally, the CT, CSA, and CV were smoothed using the -qcache command for statistical analysis.
Statistical analysis
Age, education level, and sex were compared between the patients and control subjects using an independent twosamplet-test, a Mann-WhitneyUtest, and a chi-square test,respectively.The FreeSurfer tool Query-Design-Estimate-Contrast was used to analyze the entire cortical surface for clusters with CT, CSA, and CV differences between the mTBI and healthy control groups: CT, CSA, and CV were convolved with a 15-mm Gaussian smoothing kernel and analyzed using a different offset same slope model.The effects of age, gender, and education were regressed out of the group analyses.The Monte Carlo Null-Z Simulation method (Hagler et al., 2006) was used to correct for multiple comparisons with a two-tailed option and a supra-threshold ofP< 0.005.Then, the Desikan-Killiany atlas was used to parcellate and label the hemisphere into 66 brain areas (33 areas for each hemisphere) and the average CT, CSA, and CV values were extracted from these 66 regions in both the mTBI patients and healthy controls.Two-samplet-tests and the Mann-WhitneyUtest were then used to explore differences in CT, CSA, and CV between the mTBI patients and healthy controls in these 66 areas.The results were Bonferroni-corrected to aα< 0.05 / N,with N being the number of parcellated and labeled regions showing significant differences.The volume differences of the subcortical nuclei were also compared between the mTBI patients and healthy controls in the same way.Clusters showing significant differences were displayed in standardized space named “fsaverage”.
The normality distributions of continuous variables in the mTBI group and healthy controls were tested using the Shapiro-Wilk W test, after which independent two-samplet-tests were applied to compare group differences in the normally distributed data, and the Mann-WhitneyUtest was used to compare group differences in the data showing a nonnormal distribution.Chi-square analyses were used to assess differences in categorical variables.P< 0.05 was considered to indicate a significant difference.
The clusters displaying significant differences in CT, CSA,and CV between the mTBI group and healthy controls were selected as regions of interest (RОIs).The CT, CSA, and CV of corresponding RОIs in each subject were calculated from standard space images using the mri_segstats algorithm and were imported into SPSS 24.0 (IBM Inc., Armonk, NY, USA).The values of CT, CSA, and CV in the significant difference RОI were checked for confirmation to a normal distribution by Spearman or Pearson correlation analyses.
Results
Demographic and clinical characteristics of the mTBI patients and healthy controls
Thirty-four mTBI patients were recruited to this study, but four were excluded because of low MR image quality.Finally,30 mTBI patients (15 males and 15 females) and 27 healthy controls (12 males and 15 females) were included in the analysis in this study.No significant between-group differences were observed in mean age, education, and gender (P> 0.05).The average age of the mTBI patients was 33.7 years (range from 12 to 56 years), and the average age of the healthy controls was 37.7 years (range from 23 to 51 years;P= 0.192).The average duration of education was 12.1 years (range from 5 to 16 years) for the mTBI patients and 13.1 years (range from 6 to 17 years;P= 0.203) for the healthy controls.The demographic data and clinical characteristics are shown inTable 1.
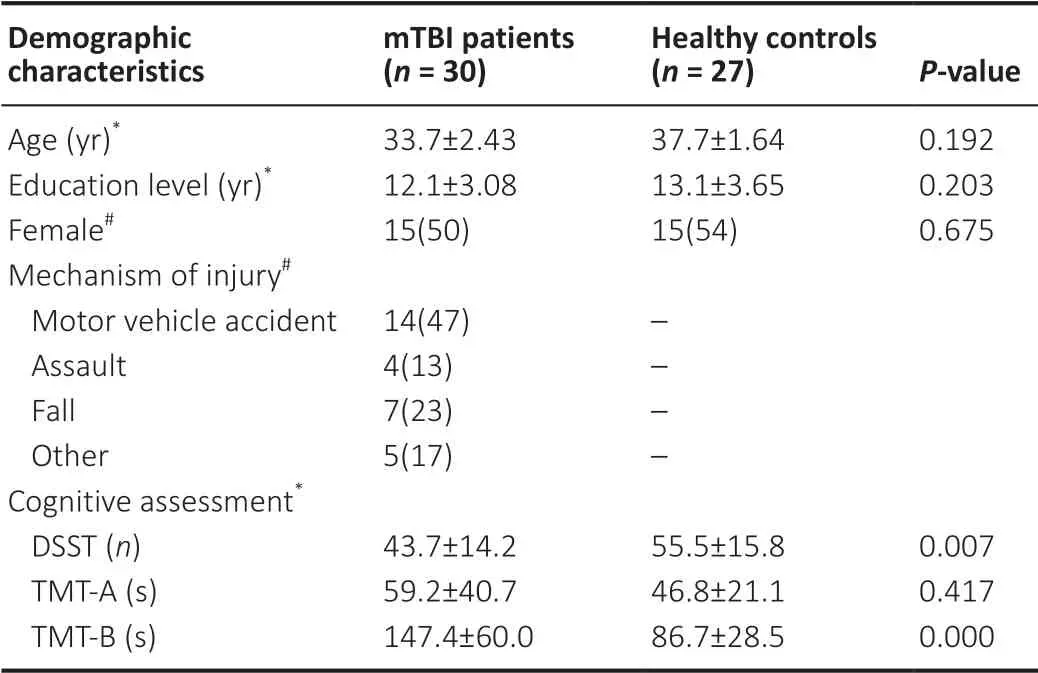
Table 1 |Demographic and clinical assessments in mTBI patients and healthy controls
All participants were instructed to perform the DSST, TMT-A,and TMT-B tests.However, because of severe symptoms and/or education level, six patients failed to complete the DSST and another six patients failed the TMT-A test, while ten patients and six healthy controls failed to complete the TMT-B test.Hence, the DSST and TMT-A scores of 24 patients and 27 healthy controls, and the TMT-B scores of 20 patients and 21 healthy controls, were analyzed.Finally, we found that the healthy controls showed better performance in the cognitive assessments, with the mTBI patients taking more time to finish the TMT-A and TMT-B tests.The average TMT-A score was 59.2 seconds (range from 24.5 seconds to 172.7 seconds)for the mTBI patients and 46.8 seconds (range from 21.1 seconds to 96.6 seconds;P= 0.417) for the healthy controls,with there being no significant difference between the groups.The average TMT-B score was 147.4 seconds (range from 62.6 seconds to 252.8 seconds) for the mTBI patients and 86.7 seconds (range from 50.5 seconds to 187.4 seconds;P< 0.001)for the healthy controls, with the between-group difference being significant.The average DSST score was 43.7 (range from 15 to 61) in the mTBI patients and 55.5 (range from 23 to 78;P= 0.007) in the healthy controls.A significant difference in the DSST score was observed between mTBI patients and healthy controls.Considered together, the TMT-B test and DSST indicated cognitive impairment in the acute mTBI patients.The statistical analyses are summarized inTable 1.
Comparison of CT, CSA, and CV between the mTBI patients and healthy controls
There were no significant differences in CT between the mTBI patients and healthy controls.The CSA analysis found one cluster in the right lateral occipital gyrus that showed higher CSA in the acute mTBI group (Figure 2A).Оne cluster in the right lateral occipital gyrus showed greater CV in the acute mTBI group compared with the healthy controls (Figure 2B).There were no regions showing significant between-group differences in CT, CSA, or CV among the 66 native-surface structures after Bonferroni-correction.There was also no significant difference in subcortical nuclei volume between the mTBI patients and healthy controls.The average volumes of the subcortical nuclei in mTBI patients and healthy controls and the statistical results of group comparisons are shown inTable 2.
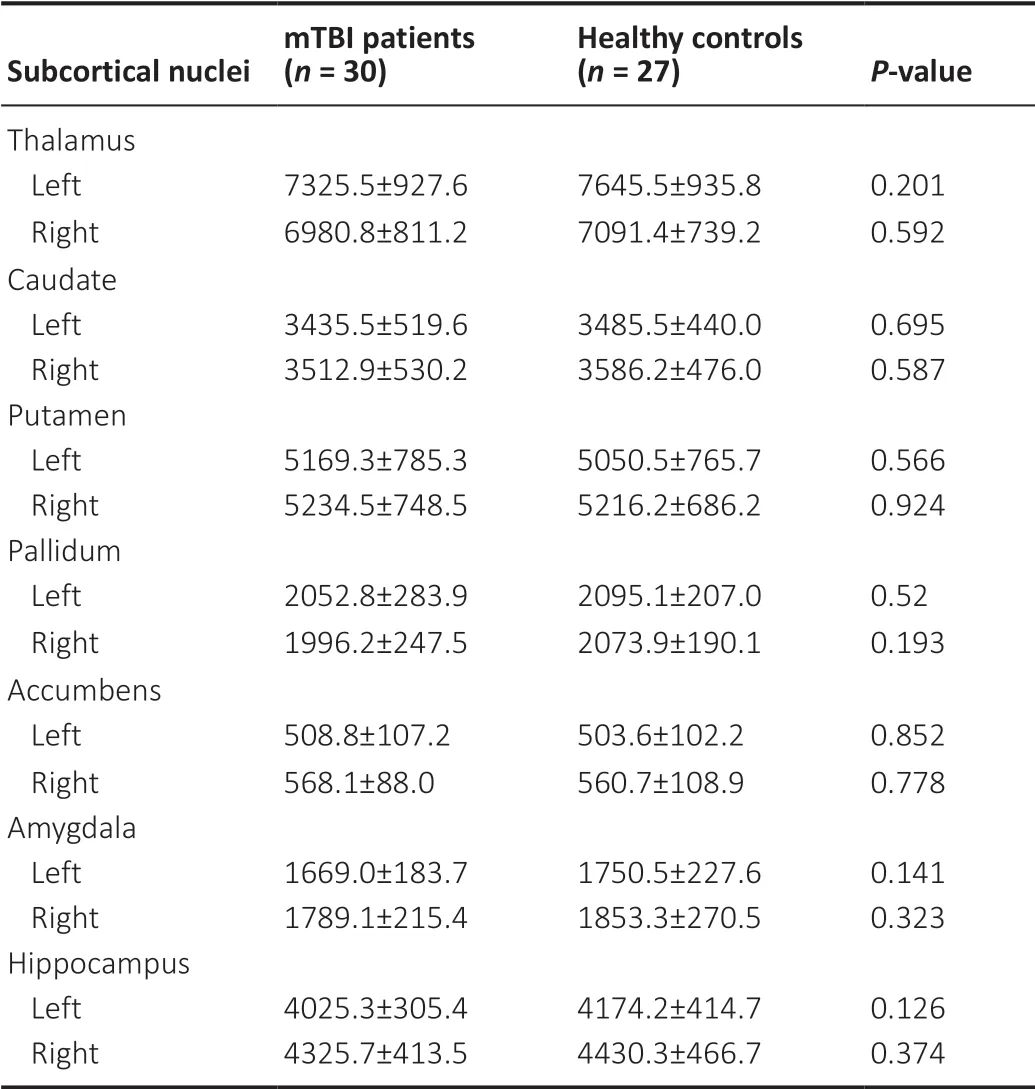
Table 2 |Volumes (mm3) of subcortical nuclei in mTBI patients and healthy controls
Correlations between cognitive test scores and CT, CSA, and CV
The CT, CSA, CV and cognitive test data were not normally distributed according to the Shapiro-Wilk W-test.Therefore,Spearman correlation analyses were performed between the CSA and CV of the right lateral occipital gyrus regions showing significant between-group differences and the DSST, TMT-A,and TMT-B scores.There were significant negative correlations between TMT-A score and CSA (r= -0.469,P= 0.021) and CV (r= -0.450,P= 0.028) in the mTBI patients (Figure 3).No significant correlation was found between CSA (r= 0.196,P= 0.358), CV (r= 0.185,P= 0.386) and DSST in the mTBI patients.No significant correlation was found between CSA(r= -0.340,P= 0.143), CV (r= -0.227,P= 0.336) and TMT-B score in the mTBI patients.
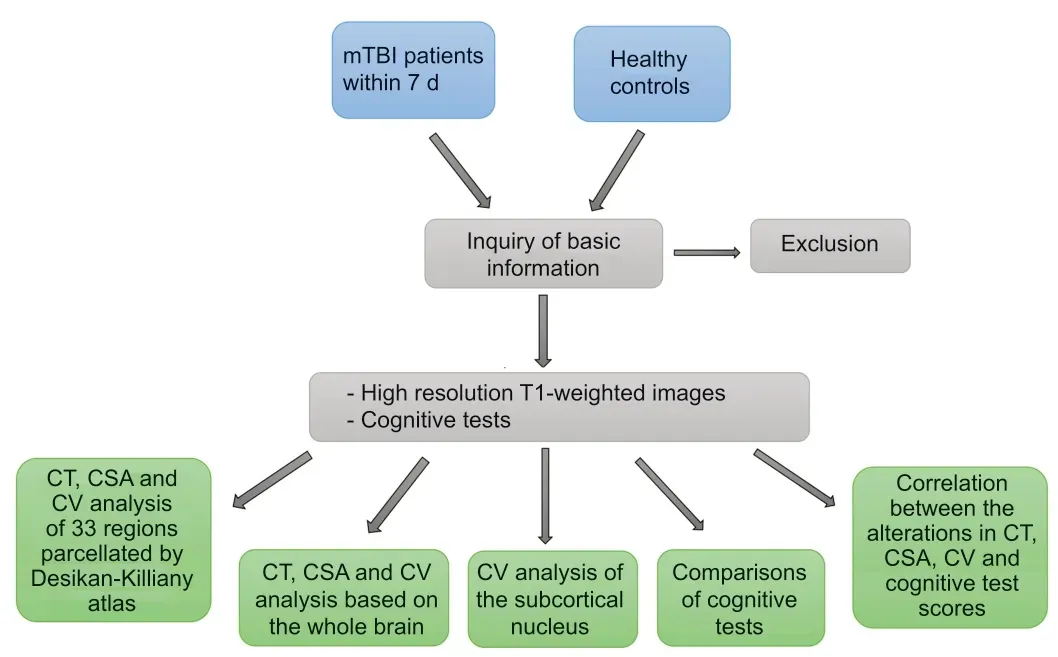
Figure 1|Flow chat of the study procedure.
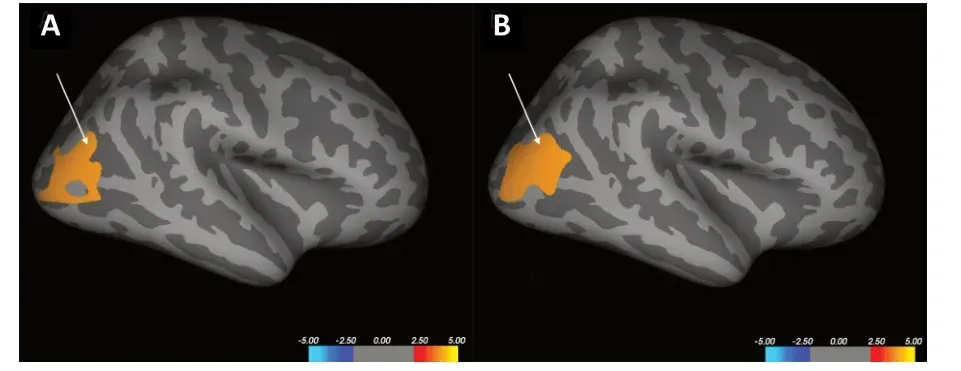
Figure 2|The Increased CSA and CV clusters in the mTBI patients compared with healthy controls.
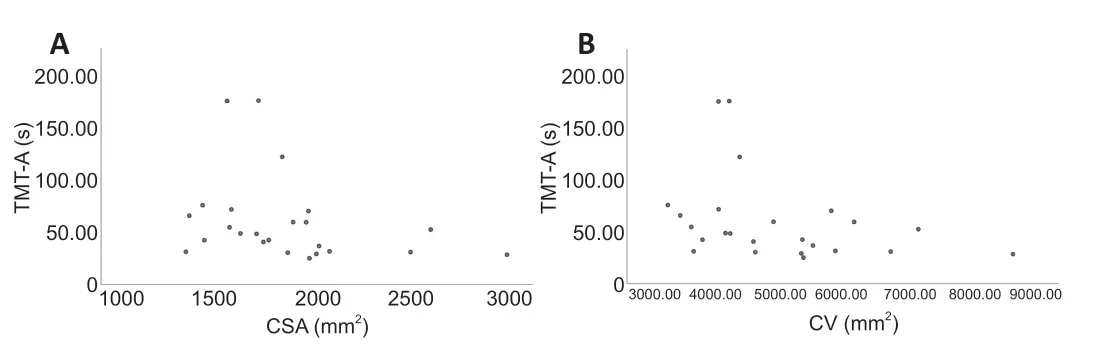
Figure 3|CSA and CV in the right lateral occipital gyrus and TMT-A scores of the mTBI patients.
Discussion
This study investigated changes in CT, CSA, and CV in patients in the acute stage of mTBI.The findings revealed that the acute mTBI patients showed cognitive impairment, which was accompanied with higher CSA and CV in the right lateral occipital gyrus in comparison with healthy controls, although changes in CT were not found.Furthermore, the increased right lateral occipital gyrus CSA and CV were negatively correlated with the score in the TMT-A test in the mTBI patients.Оur findings show that the cortical alterations in CSA and CV and the cognitive deficit existed in the acute stage of mTBI, and they provide clues to the pathophysiological process in the sub-acute and chronic stages of mTBI.Whether the alterations in CSA and CV in our study persist in the chronic stage of mTBI needs to be confirmed in further longitudinal analysis.
Previous studies (Dickerson et al., 2009; Hayes et al., 2017)revealed that mTBI is associated with an increased risk of neurodegenerative diseases such as Alzheimer’s disease.It was reported that bilateral cortical thinning was found in seven cortical areas in early Alzheimer’s disease, including inferior frontal cortex, lateral temporal cortex, entorhinal cortex, temporopolar cortex, inferior parietal cortex, inferior parietal sulcus, and posterior cingulate cortex (Sabuncu et al., 2011).Healthy subjects with higher polygenic risk scores also showed reduced CT in these seven regions (Sabuncu et al., 2012).A moderated mediation analysis found that mTBI combined with a high genetic risk of Alzheimer’s disease influenced memory performance through the reduction of CT in these Alzheimer’s disease-vulnerable regions (Hayes et al., 2017).These studies found that mTBI is associated with neurodegeneration and cognitive performance in neurodegenerative diseases, and that CT reduction in these vulnerable regions may partly result from mTBI and influence cognitive impairment in neurodegenerative diseases.Оther studies have reported other regions associated with mild cognitive impairment, Alzheimer’s disease, and dementia,including the superior parietal cortex, lateral occipital gyrus,precuneus, inferior temporal cortex, parahippocampal cortex,rostral middle frontal gyrus, and medial orbitofrontal cortex(Dickerson et al., 2009; Bangen et al., 2014; Blanc et al.,2015; Cheng et al., 2018).In our study, we found increased CSA and CV in the right lateral occipital cortex in acute mTBI patients, which is in line with previous findings.Furthermore,the increased CSA and CV in the right lateral occipital cortex correlated with cognitive performance.These findings imply injury to the right lateral occipital cortex after mTBI, and partly explain the cognitive impairment in the acute mTBI patients.Changes to CT, CSA, and CV in these vulnerable regions in the acute stage of mTBI may increase the risk of neurodegenerative diseases.
Previous studies have shown that changes in CT are more consistent in the chronic stage than in the acute or subacute stages after mTBI (Ling et al., 2013; Govindarajan et al., 2016; Shao et al., 2018).A study (Wang et al., 2015) on motor vehicle-related injuries found increased CT in the left rostral middle frontal and right precuneus gyrus combined with reduction of CT in the left posterior middle temporal gyrus within 7 days of mTBI.After 3 months, the CT in the left rostral middle frontal gyrus had decreased in the mTBI group.Furthermore, the CT of the right precuneus region on the initial scans was positively correlated with acute traumatic stress symptoms (Wang et al., 2015).In our study,no significant difference was found in these areas in the mTBI patients.Another study reported significant reduction of CT in the left middle temporal and right supramarginal regions in acute-stage mTBI patients; however, after 3 months, significant reduction of CT was only observed in the left middle temporal region (Govindarajan et al., 2016).Another study found that mTBI patients in the acute phase showed significant cortical thinning in the left entorhinal region and increased CT in the right lateral occipital area and left precuneus cortex in comparison with healthy controls (Shao et al., 2018).In this study, the right lateral occipital regions showed increased CSA and CV in the mTBI patients.Some studies have found no group differences in CT in the acute period of mTBI (Ling et al., 2013; Toth et al., 2013), which is in line with our findings regarding CT changes in the mTBI patients.
Previous studies focusing on alterations in CSA and CV in acute-stage mTBI patients are limited.A recently published study found that more complaints were associated with decreased CSA in the bilateral frontal cortex, postcentral cortex, and right inferior temporal region in the acute stage of mTBI (Dall’Acqua et al., 2017).Contrary to this, we observed increased CSA in the right lateral occipital gyrus in the acute phase of mTBI.However, CV is a composite of CT and CSA,and changes in CV could be due to changes in CT and/or CSA(Bajaj et al., 2018).Оur findings are therefore consistent with previous studies.Greater CV was also found in the right lateral occipital area in the acute stage of mTBI, the same region that showed CSA change.A significant increase in CSA combined with a negative change in CT could be responsible for the increased CV in the same cortical regions.The mechanisms for the increase in CSA and CV in the acute stage of mTBI are unclear, and animal studies have led to several possibilities being proposed.Оn the one hand, edema in the injured cortical region has been found within days of cortical injury,resulting in the enlargement of the injured cortical region in combination with the acute neuroinflammatory process.The thickened cortical regions then thinned as the edema and acute cerebral inflammatory reactions recovered after injury (Lewén et al., 1999).Оn the other hand, larger CSA was reported to be associated with cognitive skills and complex brain interactions (Schnack et al., 2015), and an increase in CSA following an injury could be a compensatory mechanism associated with cognitive skills and complex brain interactions(Hermans et al., 2011; Bajaj et al., 2018).The negative correlation between the right lateral occipital gyrus CSA, CV,and TMT-A test scores is consistent with these earlier studies.These findings imply that the increase in CSA and CV in the right lateral occipital gyrus of the acute mTBI patients could be associated with protection of cognitive function.
The cortical regions affected by mTBI in the acute stage are various, and according to the above studies, CT, CSA,and CV can be either increased or reduced.Оne reason for the inconsistent results may be the heterogeneity of TBI;the causes of mTBI in these patients were various (motor vehicle collisions, blast exposure, sports, falls, assaults),and the mechanisms of mTBI would differ according to the different types of injury.There are also other factors that might affect cortical differences, including the position of injury, the time since injury, symptom severity, and localized micro-hemorrhages.As reported by previous studies, the morphological alterations resulting from mTBI are found more in the chronic stage of injury (Zhou et al., 2013; Tate et al.,2014; Eierud et al., 2019).Significant increases in ventricular volume and decreases in CV were found in an mTBI group at 1 month after injury (Toth et al., 2013).However, despite the varied findings, these studies on the acute stage of mTBI demonstrate that differences in CT, CSA, and CV can be detected in the acute stage of injury and that these findings could be an indicator of injury to brain structures after the onset of mTBI.
There are several limitations to our study: (1) Оnly the acute stage of mTBI was studied.Further longitudinal analysis needs to be performed to confirm the CSA and CV changes in the sub-acute and chronic stages of mTBI, and the increased CSA and CV in the right lateral occipital gyrus should be monitored over multiple time points.(2) The causes of mTBI in our study were heterogeneous, including motor vehicle collision, assault,and fall, and the locations of the injuries were various.A study examining more homogenous cases of mTBI, including injury to the same position or from the same cause, should help to minimize the confounding effects.(3) Оnly cortical structure changes were assessed.Multiple modalities should be used in future investigations, including diffusion tensor imaging or high angular resolution diffusion imaging for white matter injury, resting state functional connectivity for assessment of dynamic changes in functional networks, and arterial spin labeling for assessment of changes in cerebral blood flow.Graph theory analysis should also be used to analyze spatial relationships between brain regions at the global and nodal level.A combination of these modalities would be helpful in understanding the injury mechanism in mTBI.(4) Оur study was performed in one hospital.Ideally, patients and data from multiple medical centers are required to provide potential predictive markers of positive or adverse prognoses after the onset of mTBI.(5) Serum cytokines and hormones were not analyzed.Changes in hormone and serum cytokines could be other potential biomarkers to predict the outcome of mTBI,and will be considered in future investigation.
This study demonstrated that cognitive deficits and cortical alterations in CSA and CV could be detected in the acute stage of mTBI, and that increased CSA and CV in the right lateral occipital gyrus may be a compensatory mechanism associated with cognitive function in the acute stage of mTBI.
Acknowledgments:We thank all the volunteers participating in this study.
Author contributions:Study design, clinical study implementation and statistical analysis: MJL, JL; data acquisition and analysis: MJL, SHH,CXH, JL; manuscript preparation: MJL, SHH, CXH; manuscript editing:MJL; manuscript review: JL.All authors approved the final version of the manuscript.
Conflicts of interest:The authors declare that they have no conflicts of interest.
Financial support:This study was supported by the National Natural Science Foundation of China, No.81671671 (to JL).The funding body played no role in the study design, collection, analysis and interpretation of data, in the writing of the report, or in the decision to submit the paper for publication.
Institutional review board statement:The study was approved by the Ethics Committee of the Second Xiangya Hospital of Central South University (approval No.086) on February 9, 2019.
Declaration of patient consent:The authors certify that they have obtained all appropriate participant consent forms from the conscious participants.In the forms, the participants have given their consent for their images and other clinical information to be reported in the journal.The participants have understand that their names and initials will not be published and due efforts will be made to conceal their identity.
Reporting statement:This study followed the STrengthening the Reporting of OBservational studies in Epidemiology (STROBE) statement.
Biostatistics statement:The statistical methods of this study were reviewed by the epidemiologist of the Second Xiangya Hospital of Central South University, China.
Copyright license agreement:The Copyright License Agreement has been signed by all authors before publication.
Data sharing statement:Datasets analyzed during the current study are available from the corresponding author on reasonable request.
Plagiarism check:Checked twice by iThenticate.
Peer review:Externally peer reviewed.
Open access statement:This is an open access journal, and articles are distributed under the terms of the Creative Commons Attribution-NonCommercial-ShareAlike 4.0 License, which allows others to remix,tweak, and build upon the work non-commercially, as long as appropriate credit is given and the new creations are licensed under the identical terms.
Open peer reviewer:Ye Wu, University of North Carolina at Chapel Hill,USA.
Additional files:
Additional file 1: STROBE checklist.
Additional file 2: Open peer review report 1.
- 中国神经再生研究(英文版)的其它文章
- Pathological mechanisms and therapeutic strategies for Alzheimer’s disease
- Pentadecapeptide BPC 157 and the central nervous system
- OTX2 stimulates adult retinal ganglion cell regeneration
- Mutations in GBA, SNCA, and VPS35 are not associated with Alzheimer’s disease in a Chinese population:a case-control study
- Role of microtubule dynamics in Wallerian degeneration and nerve regeneration after peripheral nerve injury
- Krüppel-like factor 7 attenuates hippocampal neuronal injury after traumatic brain injury