Advances in Hyperspectral Image Classification Based on Convolutional Neural Networks:A Review
Somenath Bera,Vimal K.Shrivastava and Suresh Chandra Satapathy
1School of Computer Science and Engineering,Lovely Professional University,Phagwara,144411,India
2School of Electronics Engineering,Kalinga Institute of Industrial Technology(KIIT),Bhubaneswar,751024,India
3School of Computer Engineering,Kalinga Institute of Industrial Technology(KIIT),Bhubaneswar,751024,India
ABSTRACT Hyperspectral image(HSI)classification has been one of the most important tasks in the remote sensing community over the last few decades.Due to the presence of highly correlated bands and limited training samples in HSI,discriminative feature extraction was challenging for traditional machine learning methods.Recently,deep learning based methods have been recognized as powerful feature extraction tool and have drawn a significant amount of attention in HSI classification.Among various deep learning models,convolutional neural networks(CNNs)have shown huge success and offered great potential to yield high performance in HSI classification.Motivated by this successful performance,this paper presents a systematic review of different CNN architectures for HSI classification and provides some future guidelines.To accomplish this,our study has taken a few important steps.First,we have focused on different CNN architectures,which are able to extract spectral,spatial,and joint spectral-spatial features.Then,many publications related to CNN based HSI classifications have been reviewed systematically.Further,a detailed comparative performance analysis has been presented between four CNN models namely 1D CNN,2D CNN,3D CNN,and feature fusion based CNN(FFCNN).Four benchmark HSI datasets have been used in our experiment for evaluating the performance.Finally,we concluded the paper with challenges on CNN based HSI classification and future guidelines that may help the researchers to work on HSI classification using CNN.
KEYWORDS Convolutional neural network;deep learning;feature fusion;hyperspectral image classification;review;spectralspatial feature
1 Introduction
Hyperspectral imaging,also known as imaging spectroscopy,records hundreds of continuous and narrow spectral bands in the range of visible light to infrared spectrum and generate hyperspectral image (HSI) [1].It contains both spectral and spatial information about the objects and can be visualized as a data cube.A representation of HSI is shown in Fig.1,where each spectral band represents an image with a particular wavelength.A pixel in HSI can be represented with a wide range of spectral values and is surrounded by neighboring pixels.The set of values in the spectral domain provides the spectral information whereas neighboring pixels offer spatial information.With such rich spectral and spatial information,HSIs have been applied in many fields,such as mineralogy[2],surveillance [3],physics [4],astronomy [5],chemical imaging [6],military [7],agriculture [8],environment monitoring[9],and so on.The main task in these applications is classification of pixels to identify the objects.
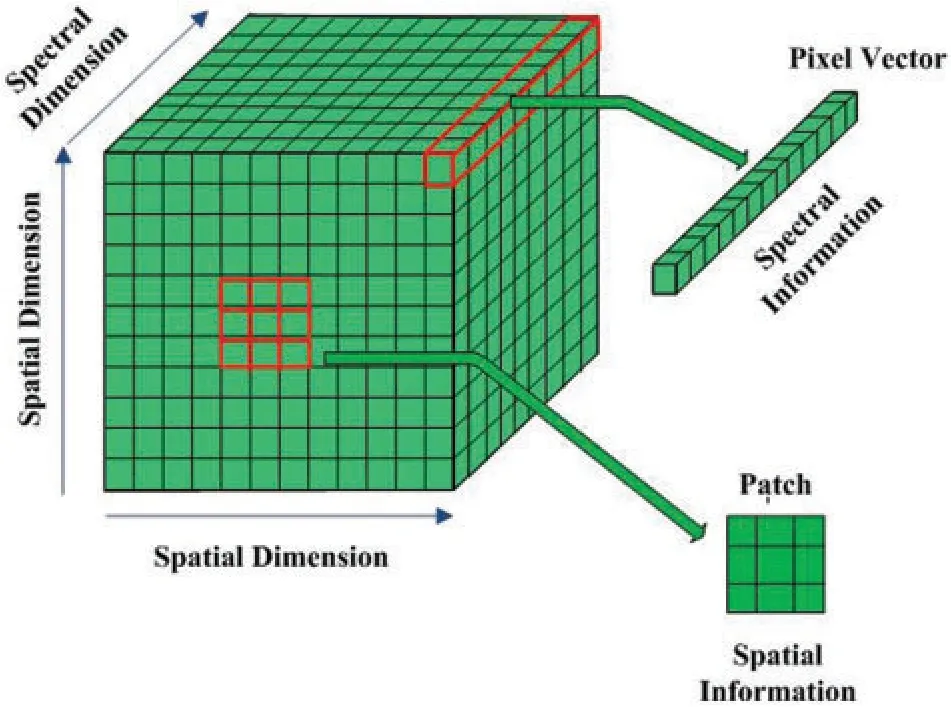
Figure 1:Representation of HSI
To classify the HSI pixels,several classification methods such as support vector machine(SVM)[10,11],distance measure[12,13],k-nearest neighbors(KNN)[14,15],maximum likelihood criterion[16,17] and logistic regression [18,19],have been applied in the past.The performance of these methods was not satisfactory due to the consideration of spectral information alone.Therefore,many classification methods have been proposed to improve the performance by incorporating spatial information[20–23].The spatial information provides shape and size of the objects.With the help of spectral and spatial information,several methods improved the classification accuracy but failed to generate smooth classification maps due to their shallow learning nature.
Recently,deep learning [24–29] has been considered as the state-of-the-art machine learning technique [30,31].It automatically learns hierarchical features from raw input and has made great breakthrough in various domains viz.computer vision [32],object detection [33],medical imaging[34],agriculture [35],and natural language processing [36,37],etc.Motivated by these successful applications,deep learning concept has also been introduced in HSI classification and demonstrated good performance [38].Many deep learning models were applied in HSI classification such as stacked autoencoder (SAE) [39,40],deep belief network (DBN) [41,42],and convolutional neural network (CNN) [43–48].Among these models,DBN and SAE are unsupervised learning and does not require labeled samples for training.However,the main problem of SAE and DBN lies in the initial stage,where images are flattened into vectors to fulfill the input requirement,which leads to spatial information loss.Compared with SAE and DBN,CNN is very efficient for extracting spectralspatial information and significantly improves the classification performance[49].Beside this,CNN has shown its effectiveness in normal image classification[50,51].Guo et al.[52]proposed an attention network,where 2D CNN was utilized as spatial feature extraction and 3D CNN as spectral-spatial feature extraction tools for HSI classification.In [53],authors have introduced graph CNN due to its powerful representation ability and achieved impressive performance.Moreover,many recent HSI classification methods have introduced feature fusion techniques to improve the classification performance[54].Ge et al.[55]proposed a fusion based method,where 2D CNN and 3D CNN were combined to extract abstract spatial features and multi-branch network was employed for exploiting features at different levels.
In the last few years,many review articles have been published based on HSI classification[56–58].For instance,Ma et al.[59]presented a review of how deep learning has been applied in remote sensing image analysis and can be an effective tool in future.In [60],Gewali et al.reviewed several literatures related to machine learning algorithm and hyperspectral image analysis.Authors further compared different machine learning based hyperspectral image analysis methods to address the critical challenges.In [61],authors concentrated on the basics of HSI analysis and their various applications.Ghamisi et al.[62] presented a detailed discussion about spectral information based HSI classification methods.He et al.[63] focused on spectral-spatial analysis of HSI by using a spatial dependency concept.In [64],Li et al.systematically reviewed the deep learning based HSI classification methods and introduced few strategies to address the limited samples problems.From these literature,we have observed that many review articles have been presented on HSI classification in a generalized way.However,none of the review articles have provided detailed analysis on CNN based HSI classification that has produced most prominent results on HSI classification.Therefore,we have specifically focused on CNN based HSI classification by presenting a deep and systematic analysis.To accomplish this,we have divided the literature into four groups that include spectralbased CNN methods,spatial-based CNN methods,spectral-spatial based CNN methods and fusion based CNN methods.Then,comprehensive review has been performed on these methods.Further,a detailed comparative analysis has been presented between four CNN based models namely 1D CNN,2D CNN,3D CNN,and feature fusion based CNN(FFCNN)on four HSI datasets.Lastly,challenges and future guidelines have been provided.
The remainder of this paper is organized as follows.Section 2 makes a brief introduction to CNN and its different architectures.Section 3 reviews the previous work into four aspects based on the types of features utilized by different CNN architectures.The architectural details of four CNN based models have been discussed in Section 4.Section 5 provides the comparative performance analysis of four models on four HSI datasets.Conclusions and future guidelines are provided in Section 6.
2 Overview of CNN Architecture
The working principal of CNN was inspired by the neuroscience.The neuroscience defines how a different level of processing can help in recognizing the objects[65].To identify the object,CNN takes the advantage of two special characteristics:local connection and shared weights.The local connection is used to extract the spatial features and shared weights reduce the network parameters[66].In Fig.2,a general CNN based model is presented that contains convolutional,pooling and fully connected layers.From the figure,we can see that the convolutional and pooling layers are stacked alternately to extract the deep features followed by fully connected layer.The details of each layer are discussed below:
The convolutional layer is characterized by the set of kernels and biases.These kernels have a small receptive field and are used for extracting specific features.More specifically,a kernel is used for generating the feature map.A feature map of the convolutional layer can be defined as follows:

wheref jlrepresentsjth feature map of the currentlth layer,fil−1is theith feature map of the previous(l−1)th layer and T is the number of bands.wlijandbliare weight and bias.The ∗operator is used for convolution operation andαdenotes the activation function.In CNN,a pooling layer is added after each convolutional layer to reduce the size of the feature maps without losing discriminative information.Further,it provides translation invariant property.After several convolutional and pooling layers,the feature maps are flattened into one dimensional vector and input to fully connected layer.The number of neurons in the last fully connected layer is equal to the number of classes.The softmax function is used at the last layer,which is a logistic regression function for generating the probability distribution of classes.

Figure 2:General architecture of convolutional neural network
2.1 Types of CNN
A CNN architecture is categorized based on application domain of convolution operation.Specifically,when a convolutional operation is conducted on spectral domain of input data,the CNN is called 1D CNN[67].In 1D CNN,the neuron’s valuenaijat position a in thejth feature map ofith layer can be represented as follows:

wherekdenotes the(i−1)th layer’s feature map which is connected with the current feature map,wrijkis the weight at positionrconnected to thekth feature map,bijis the bias ofjth feature map in theith layer,Riis the width of the kernel to the spectral dimension.Similarly,when convolution operation is conducted on spatial and spectral-spatial domains,it is called 2D CNN [68] and 3D CNN [69],respectively.The neuron’s valuenof thejth feature map inith layer for 2D CNN and 3D CNN are represented in(3)and(4),respectively.

whereSiis the height of the convolutional kernel,Tiis the size of the kernel with respect to spectral dimension.
3 CNN Based HSI Classification Methods
CNN has the power to extract discriminative features from complex hyperspectral data.With the help of discriminative features,CNN based methods can efficiently identify the ground objects[70,71].A large number of CNN based methods have been developed for HSI classification in last few years and achieved state-of-the-art performance [72–75].We have divided the literature into four groups that include spectral-based CNN methods,spatial-based CNN methods,spectral-spatial based CNN methods and fusion based CNN methods.
3.1 Spectral Based CNN Methods
One of the most important properties of HSI is spectral information which helps to identify small objects[76–78].To get the spectral information,1D CNN plays an important role in HSI community.Many methods have been proposed for extracting spectral information.Among them,1D CNN shows efficiency with the advantage of conceptual simplicity and ease of implementation[68].For example,Chen et al.[79]proposed a CNN based model for HSI classification,which was designed automatically and fitted well to specific datasets.Specifically,the model uses 1D Auto-CNN for classifying HSI.In[80],authors explored the power of 1D CNN to extract spectral features and demonstrated good performance than traditional methods.Recently,Sun et al.[81] adopted CNN to exploit localized spectral features from several band groups.Although,spectral information improves the classification performance but fails to describe the structure of an object.
3.2 Spatial Based CNN Methods
Spatial information is another important information resource of HSI,which can be used to represent the shape and size of the objects.As CNN has got huge popularity for extracting spatial information in various fields[82,83],many methods have incorporated spatial information into their models and reported improved classification accuracy over the past decades [84–87].In [88],spatial features extracted by multiscale CNN were integrated with spectral features achieved by long shortterm memory (LSTM) to accomplish the HSI classification.Yue et al.[66] introduced a deep CNN model to extract spatial features with the help of Principal Component Analysis (PCA) [89,90] and logistic regression.Xu et al.[91] integrated HSI data and multiple sensor’s data for improving the classification performance,where spectral and spatial features of HSI data were extracted through 1D CNN and 2D CNN,respectively.In addition,several literature used off-the-shelf CNN models including AlexNet [43],VGGNet [92],GoogLeNet [93] and ResNet [94] for deep spatial feature extraction on HSI datasets and achieved high classification accuracy.In more detail,Cheng et al.[95]proposed a classification framework,where spatial features were exploited through off-the-shelf CNN models and improved performance has been obtained by metric learning based approach.In[96],spatial features exploited through 2D CNN were combined with spectral features to enhance the classification performance.Makantasis et al.[97]employed CNN to encode the spatial information of pixels followed by Multi-Layer perception.In[98],authors extracted deep spatial features by CNN and their characteristics have been investigated by sparse representation based framework.Moreover,in our previous works,we have analyzed the effect of various pooling strategies[99]and optimizers[100]on the performance of 2D CNN based HSI classification system.It has been observed that though the utilization of spatial information can enhance the representation power of HSI but unable to fully identify the small objects.
3.3 Spectral-Spatial Based CNN Methods
Considering only spectral or spatial information of HSI is not enough for improving the classification performance[101–103].Both spectral and spatial information are essential[63,104,105].Studies report that joint spectral-spatial based methods significantly improve the classification results [106–113].During the last few years,3D CNN has got huge popularity for extracting joint spectral-spatial features and shown remarkable performance in HSI classification [114].Li et al.[69] presented a CNN model that jointly extracts spectral-spatial features from HSI dataset without depending on preprocessing and post-processing task[67].Mei et al.[115]integrated the spectral and spatial features by constructing five layer CNN model with regularization technique.Liu et al.[116]proposed a 3D CNN based classification model to simultaneously learn spectral-spatial features and adopted virtual sample concept to address the limited training sample problem.In[117],joint spectral-spatial features were exploited through CNN based multi-feature learning model.Shi et al.[118] proposed a HSI classification model as a combination of CNN and multi-resolution analysis to extract 3D features.Zhu et al.[119]designed a deep 3D Capsule framework for spectral-spatial classification.Zou et al.[120]exploited joint spectral-spatial and semantic information by 3D fully convolutional network to boost the classification accuracy.In [105],the proposed model not only extracted spectral-spatial features but also minimized the computational cost.Roy et al.[121] adopted hybrid CNN model to maintain the classification accuracy.In [80],Chen et al.introduced 3D CNN to simultaneously learn the deep spectral and spatial features.However,there may be loss of spectral information when spectral-spatial features were extracted jointly due to the involvement of convolution operation on non-informative spectral bands [88].Therefore,separate spectral and spatial feature extraction and their fusion may be an alternative choice to better utilize the spectral and spatial information in HSI classification.
3.4 Fusion Based CNN Methods
Feature fusion concept is another important step in HSI classification for better utilizing the spectral and spatial information[54,122].The feature fusion can help in extracting the abstract features and improve the classification performance [123–127].It also helps in merging the detailed and boundary information of shallow layers and semantic information of deep layers[128].Many literature have fused the spectral and spatial features in different manner and have shown better classification accuracy[49,91,129,130].Kang et al.[131]proposed a novel fusion scheme where group of adjacent bands were fused by averaging and processed with recursive filtering to get the resulting features for classification.In[132],Guo et al.introduced fusion method for HSI classification,where CNN and guided filter have been adopted for spectral and multiscale spatial feature extraction,respectively.In[133],a multilayer feature fusion based triple-architecture CNN has been presented,where spectral and spatial features were extracted by stacking of spectral features to dual-scale spatial features with sample augmentation using local and non-local constrains.In [134],spectral and spatial features were extracted through balanced local discriminate embedding and CNN,respectively to construct the fused features.Gao et al.[135] employed CNN to construct fusion network by adopting multibranch concepts.In[136],spatial based deep CNN architecture was integrated with pixel based shallow structured multilayer perception by utilizing decision fusion approach for classifying fine resolution remotely sensed data.Liang et al.[137]introduced a novel feature fusion method where multiscale deep spatial features were extracted through VGG16 model and spectral features were exploited directly.Then,spectral and spatial features were fused with the help of unsupervised sparse autoencoder.In[138],authors used CNN based information fusion network for combining heterogeneous information of HSI and light detection and ranging(LiDAR)data and achieved state-of-the-art results.From these fusion techniques,it has been observed that fusion can improve the classification performance of HSI.
4 HSI Classification Framework Using CNN
We have presented a comparative performance analysis on HSI classification using four CNN based models (namely 1D CNN,2D CNN,3D CNN,and FFCNN) based on their specific feature extraction capabilities.Specifically,1D CNN,2D CNN,3D CNN,and FFCNN are based on spectral,spatial,spectral-spatial,and feature fusion,respectively.Moreover,the architecture of those four CNN models have been introduced and discussed in the following subsections.
4.1 Spectral Based 1D CNN
A pixel in HSI is represented by set of spectral values with particular wavelength.These values offer spectral information to identify small objects.As shown in Fig.3,a 1D CNN based model is built to extract spectral information by considering entire spectral bands of HSI.In addition,the model uses several convolutional and pooling layers to extract the deep spectral information followed by fully connected layer to exploit the more abstract information.

Figure 3:Architecture of 1D CNN model for spectral feture extraction
4.2 Spatial Based 2D CNN
In HSI,spatial information of a pixel is captured from the neighboring pixels.The spatial information helps in describing the shape and size of the objects.As shown in Fig.4,a 2D CNN based model is constructed for extracting spatial information.The PCA has been employed to select single band as principal component followed by patch extraction.The model then applies many convolutional and pooling operations on extracted patches to get the spatial information.

Figure 4:Architecture of 2D CNN model for spatial feture extraction
4.3 Spectral Spatial Based 3D CNN
Only spectral or spatial information is not enough for identifying the ground objects of HSI.Both spectral and spatial information play a vital role in HSI classification.As shown in Fig.5,a model has been built,which utilizes both spectral and spatial information of HSI.The model uses only a few informative bands by selecting the first few principal components(bands).Then,patch extraction is done followed by joint spectral-spatial feature extraction.

Figure 5:Architecture of 3D CNN model for spectral-spatial feature extraction
4.4 FFCNN
Recently,feature fusion technique is very popular in HSI classification.As shown in Fig.6,we have designed a model named FFCNN,where spectral and spatial information are fused to increase the representation of HSI.In this model,the spectral and spatial information are extracted separately through 1D CNN and 3D CNN,respectively to reduce the information loss.Finally,the spectral and spatial features were fused before fully connected layer.
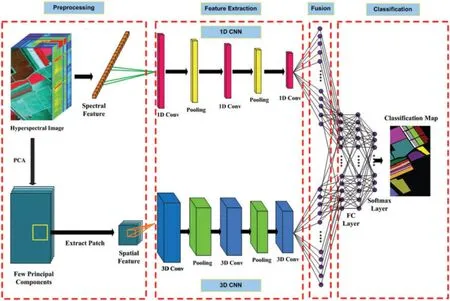
Figure 6:Architecture of FFCNN model for feature fusion
From 3 to 6,we can observe that four models are presented for HSI classification.In order to classify HSI,some preprocessing steps have been taken for each model.Initially,HSI is normalized in the range of −0.5 to+0.5 before applying PCA.The PCA is used for selecting the most informative band(s).For 1D CNN,inputs are prepared by directly extracting the pixel vectors from HSI datasets.For the other models,image patches of size 27×27[80]are cropped from the band(s)and considered as inputs.After preparing the different structured inputsxs,the output of the models can be computed as follows:

wherefdenotes the composite function for input,which is obtained after applying several linear and nonlinear operations.WandBrepresent the weight and bias of the model,respectively andSis the number of training samples.A softmax function is used to generate the probability distribution of each output and can be represented as follows:

whereysiis theith value ofysandTis the number of classes.Depending on the true and predicted values,the cost functionLis defined as follows:

wheretiandpiare the true and predicted label ofith data,respectively.To reduce the cost function,the Adam optimizer[100]has been adopted.After completing the optimization[139],the models are ready to predict the class label of test samplesx′depending on maximum probabilitypi.

5 Results and Discussion
5.1 Datasets
To validate the performance of above frameworks,we have used four well known HSI datasets namely Kennedy Space Center(KSC),Indian Pines(IP),University of Pavia(UP),and Salinas(SA).The details of the datasets are given below.
The KSC hyperspectral image was gathered by the Airborne Visible Infrared Imaging Spectrometer (AVIRIS) sensor over KSC,Florida,on March 23,1996.This dataset includes 176 bands after removing water absorption and noisy bands ranging from 0.4 to 2.5μm.The spatial size of each band is 512×614 with spatial resolution of 18 m/pixel.Thirteen classes are considered for this scene.Fig.7 shows the false color image of KSC dataset and the corresponding ground truth image.
The IP hyperspectral image was acquired by the AVIRIS sensor in June 1992 over the Indian Pines test site in Northwestern Indiana.This image comprises of 220 spectral reflectance bands in the wavelength range from 0.4 to 2.5μmand has a spatial size of 145×145 pixels with spatial resolution of 20 m/pixel.From this dataset,20 bands were removed due to the water absorption and noise.This scene has 16 land cover classes.Fig.8 shows the false color image of IP dataset and the corresponding ground truth image.
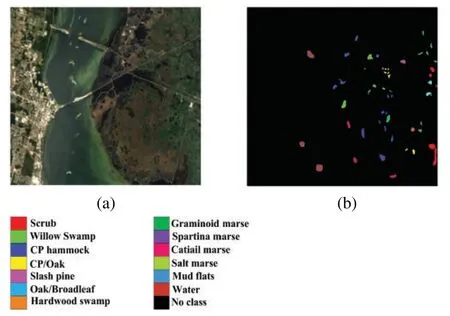
Figure 7:KSC dataset.(a)False color image.(b)Ground truth

Figure 8:IP dataset.(a)False color image.(b)Ground truth
The UP image covers an urban area of University of Pavia,Northern Italy.It was captured by the Reflective Optics System Imaging Spectrometer(ROSIS)sensor on July 08,2002.This dataset has 115 spectral bands across the spectral range from 0.43 to 0.86μmwhere 12 noisy bands were removed.The spatial dimension of this scene is 610×340 with spatial resolution of 1.3 m/pixel.Fig.9 shows the false color image of UP dataset and the corresponding ground truth image.
The SA dataset was also recorded by the AVIRIS sensor over the area of Salinas Valley,California,USA with a spectral range from 0.36 to 2.5μm.It contains 224 spectral bands and has a size of 512×217 with spatial resolution of 3.7 m/pixel.For classification purpose,16 classes were defined for this image.Before the experiments,20 bands were removed due to the water absorption and noise.Fig.10 shows the false color image of SA dataset and the corresponding ground truth image.
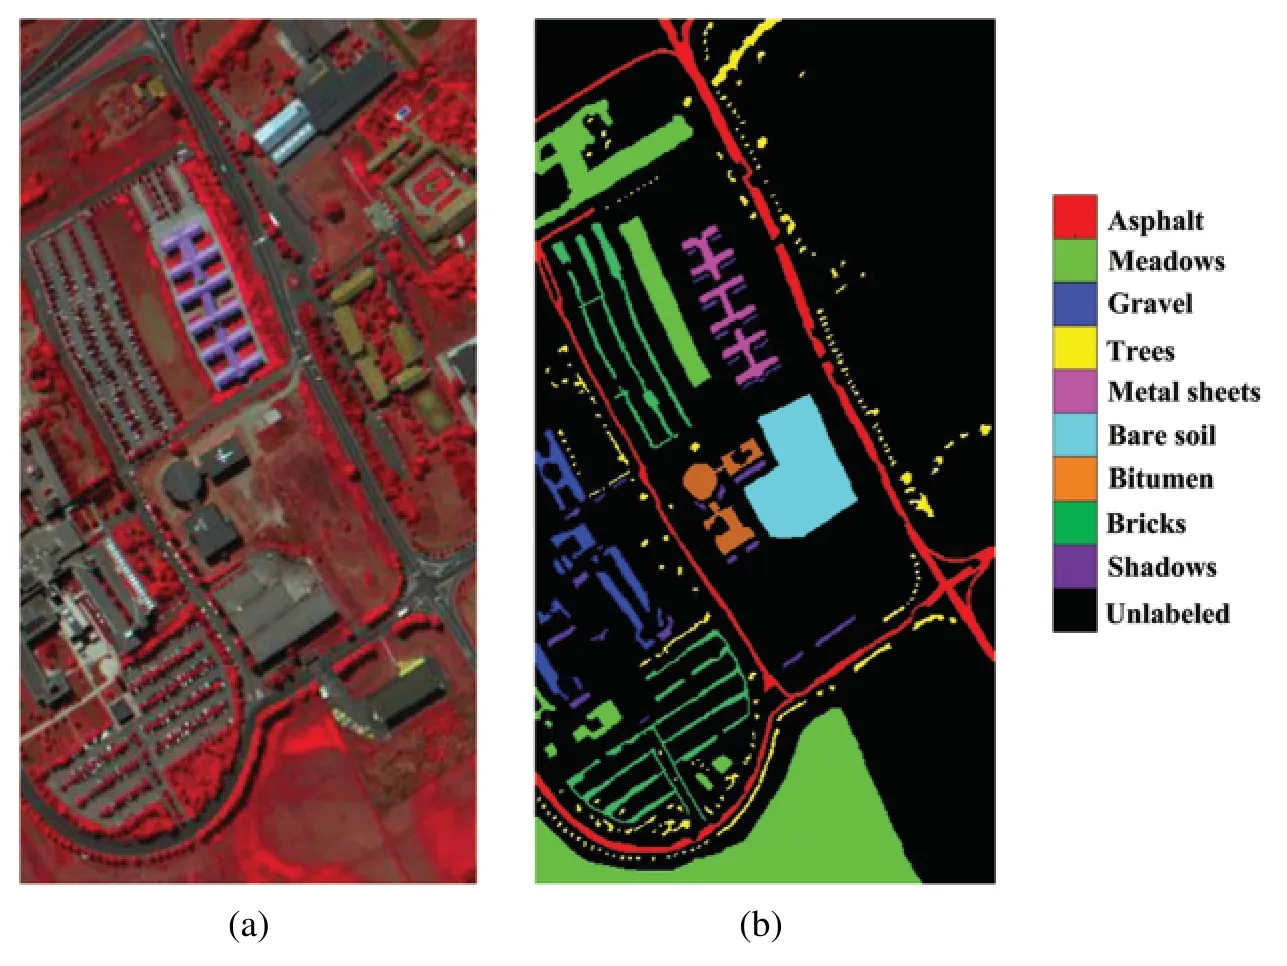
Figure 9:UP dataset.(a)False color image.(b)Ground truth
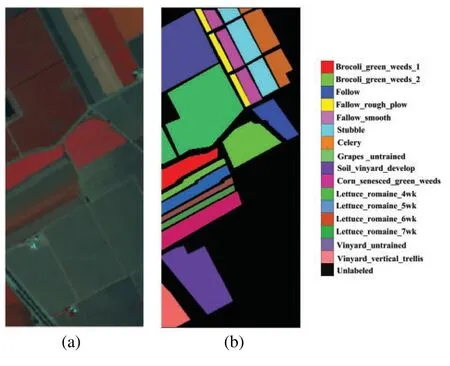
Figure 10:SA dataset.(a)False color image.(b)Ground truth
5.2 Experimental Design
In our experiments,we have empirically selected the parameters for 1D CNN,2D CNN,and 3D CNN.Table 1 shows the parameter setting of the models on KSC,IP,UP,and SA datasets,where C,P,and FC are representing the convolutional,pooling,and fully connected layers,respectively.For the convolutional layer,kernel size is varied according to the datasets.In case of pooling layer,max pooling[99]has been selected with pool size of 2.The learning rate was set as 0.01 with the weight decay of 1e−6.The experiments were conducted for 200 epochs with mini batch size of 100.For fairness,we have used 20 trials for each method,where each trial contains different distribution of training and test samples.The experiments were performed using laptop with Intel Core(TM)i5-6200U 2.4-GHz CPU with 8 GB memory and an NVIDIA GeForce 940 M GPU.All the experiments were implemented using Keras 2.2.4 and Tensorow 1.12.0(backend library).

Table 1:Architectural details of 1D CNN,2D CNN,and 3D CNN
To measure the quantitative results,we have adopted three popular indexes:overall accuracy(OA),average accuracy (AA),and kappa coefficient (Kp).The OA refers the total number of accurately classified test samples over entire test samples.The AA represents the average of class-wise accuracies.TheKpmeasures the similarity among classification map and ground truth map.In addition,standard deviation has been reported for each index.
5.3 Sensitivity to the Number of Bands in 3D CNN
Previous studies have reported that selection of number of spectral bands are highly responsible for affecting the performance of HSI classification.On the one hand,considering too few bands may cause unsatisfactory performance due to the limited amount of spectral information.On the other hand,excessive bands may reduce the classification accuracy and increase the computational cost[80].To address this issue,an empirical band analysis has been conducted using PCA on 3D CNN to select the optimal number of bands.In Fig.11,we can observe that OA gets decreased after third band for KSC dataset with increasing computation time.Therefore,we have considered only three bands for KSC dataset.Similar observations have been found from the remaining datasets.For example,the OA gets saturated or starts decreasing after 6th,6th,and 5th bands for IP,UP,and SA dataset,respectively.Hence,the number of bands has been set as 6,6 and 5 for IP,UP,and SA dataset,respectively.

Figure 11:Sensitivity to the number of bands on 3D CNN for KSC,IP,UP,and SA datasets.(a)OA vs.number of bands.(b)Training time vs.number of bands
5.4 Sensitivity to the Number of Training Sample
As HSI contains limited labeled samples,selection of number of training samples is an important criterion for HSI classification.Therefore,we have presented an analysis to select the number of training samples for all the considered datasets and models.For KSC and IP datasets,the analysis have been performed by randomly selecting 4%,6%,8%,10%,and 12%training samples from each class.Compared with KSC and IP datasets,UP and SA datasets contain huge number of training samples.Therefore,the proportion of training samples were considered as 1%,2%,3%,4%,5%for UP dataset and 1%,1.5%,2%,2.5%,3%for SA dataset.As shown in Fig.12,the OA gets improved when number of training samples are increased.The OA of FFCNN reaches above 99%and 98%for KSC and IP dataset,respectively when 10%training samples were considered.Beside this,we have achieved marginal improvement in OA with increasing computation time when more than 10%training samples were considered.Therefore,we have found 10%training samples to be an optimal choice for KSC and IP datasets.Similarly,4%and 2.5%training samples have been found to be suitable for UP and SA datasets,respectively.
Based on the above analysis,we have randomly selected 10%training samples from each class of KSC and IP datasets and remaining samples were used as test samples.The detailed distribution of training and test samples of KSC and IP datasets are listed in Tables 2 and 3,respectively.For UP and SA datasets,4%and 2.5%training samples were randomly selected from each class respectively and rest samples were used as test samples.The detailed distribution of training and test samples of UP and SA datasets have been reported in Tables 4 and 5,respectively.
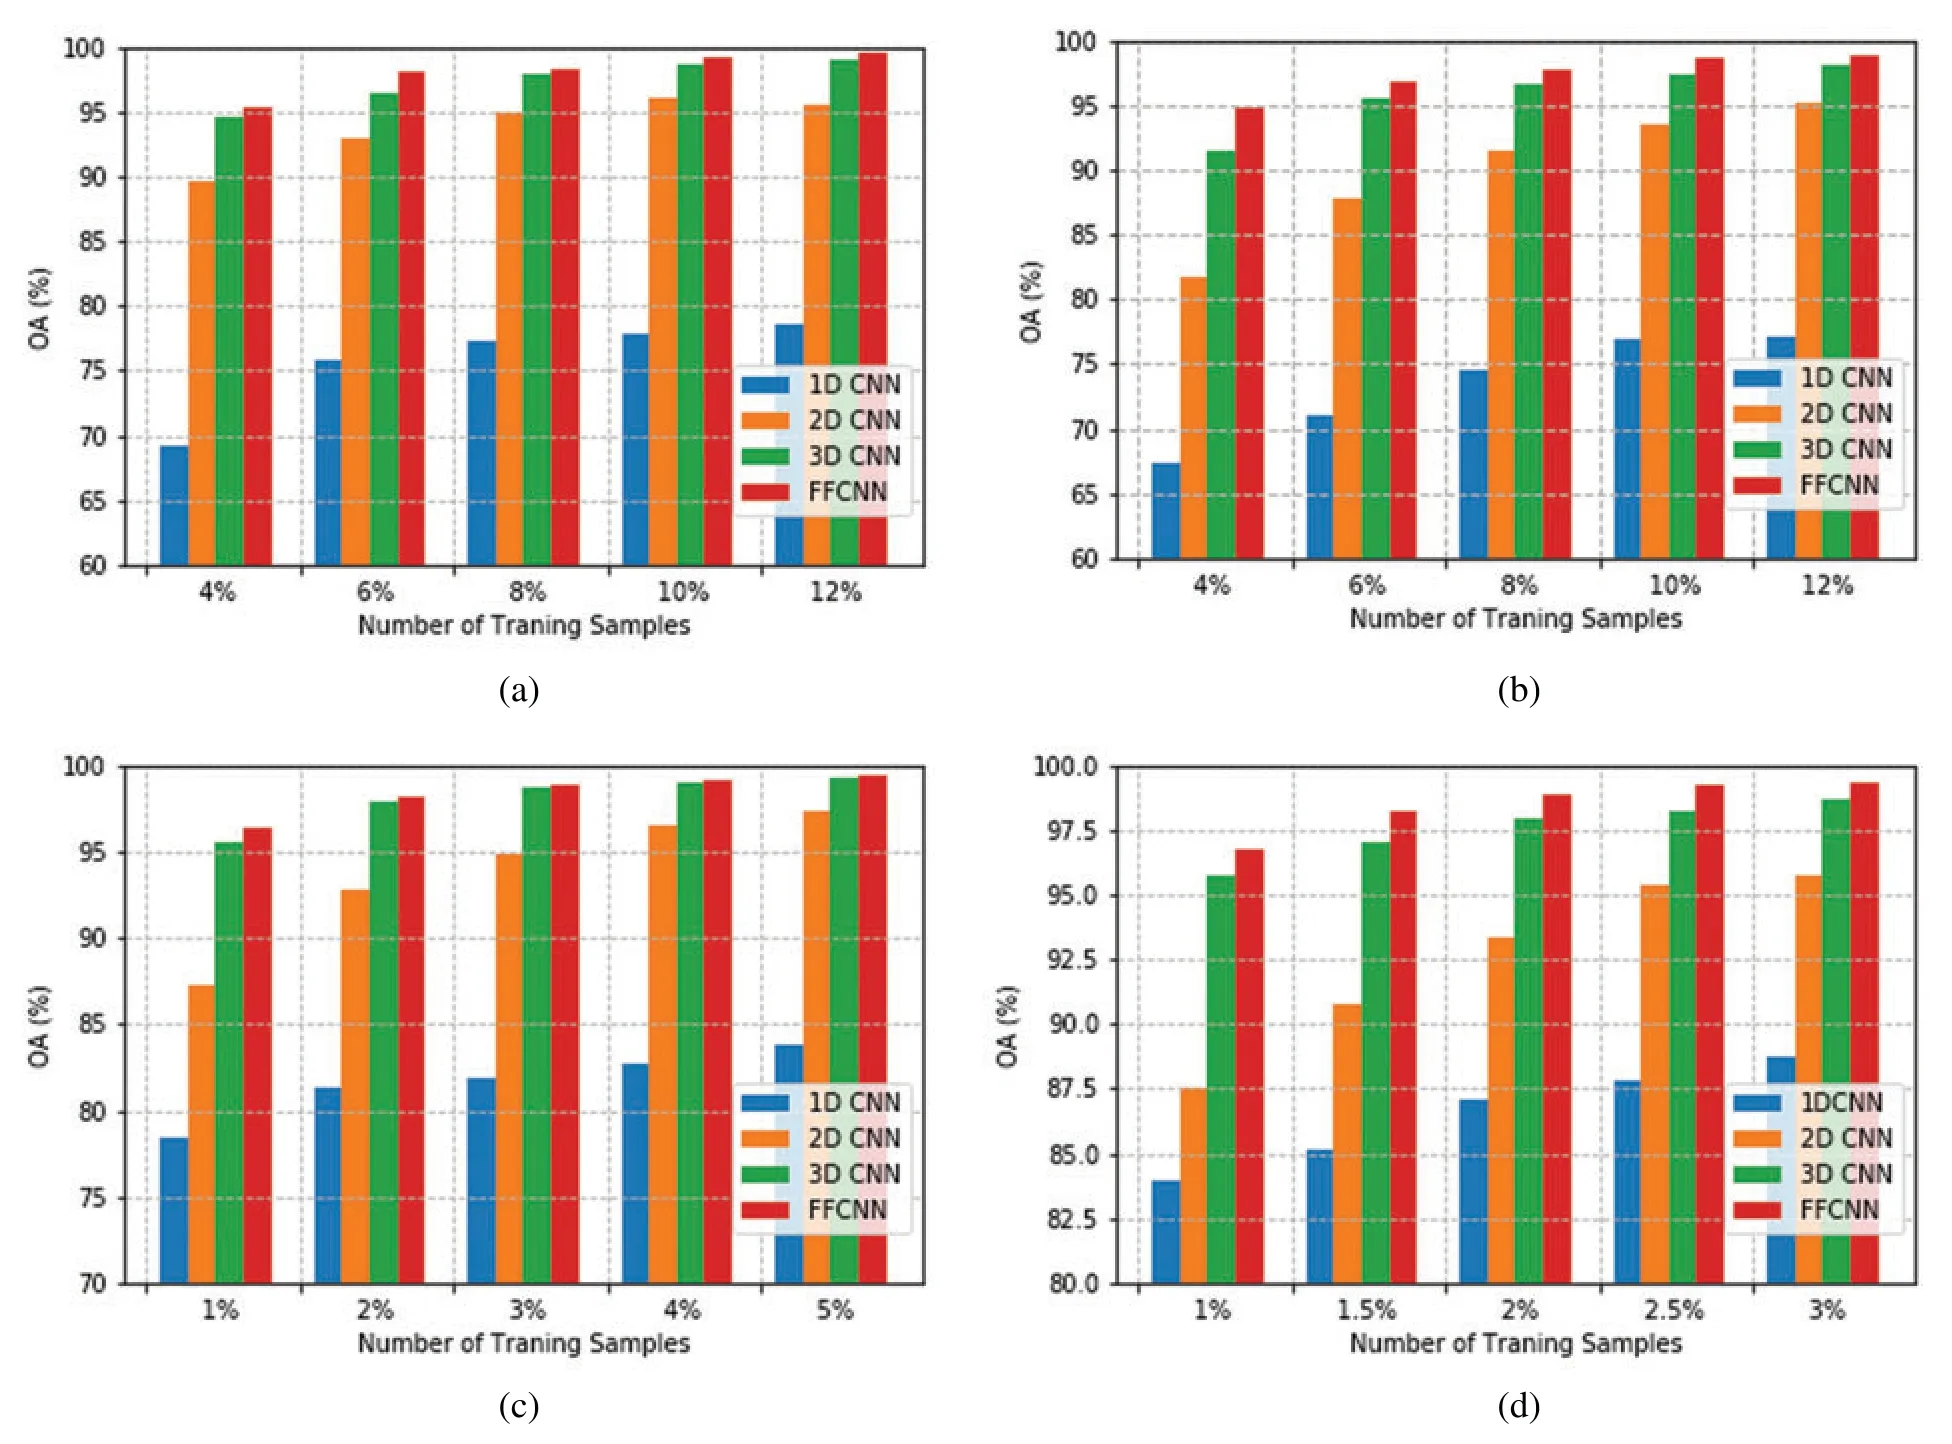
Figure 12:Sensitivity to the number of training samples using 1D CNN,2D CNN,3D CNN,and FFCNN.(a)KSC.(b)IP.(c)UP.(d)SA
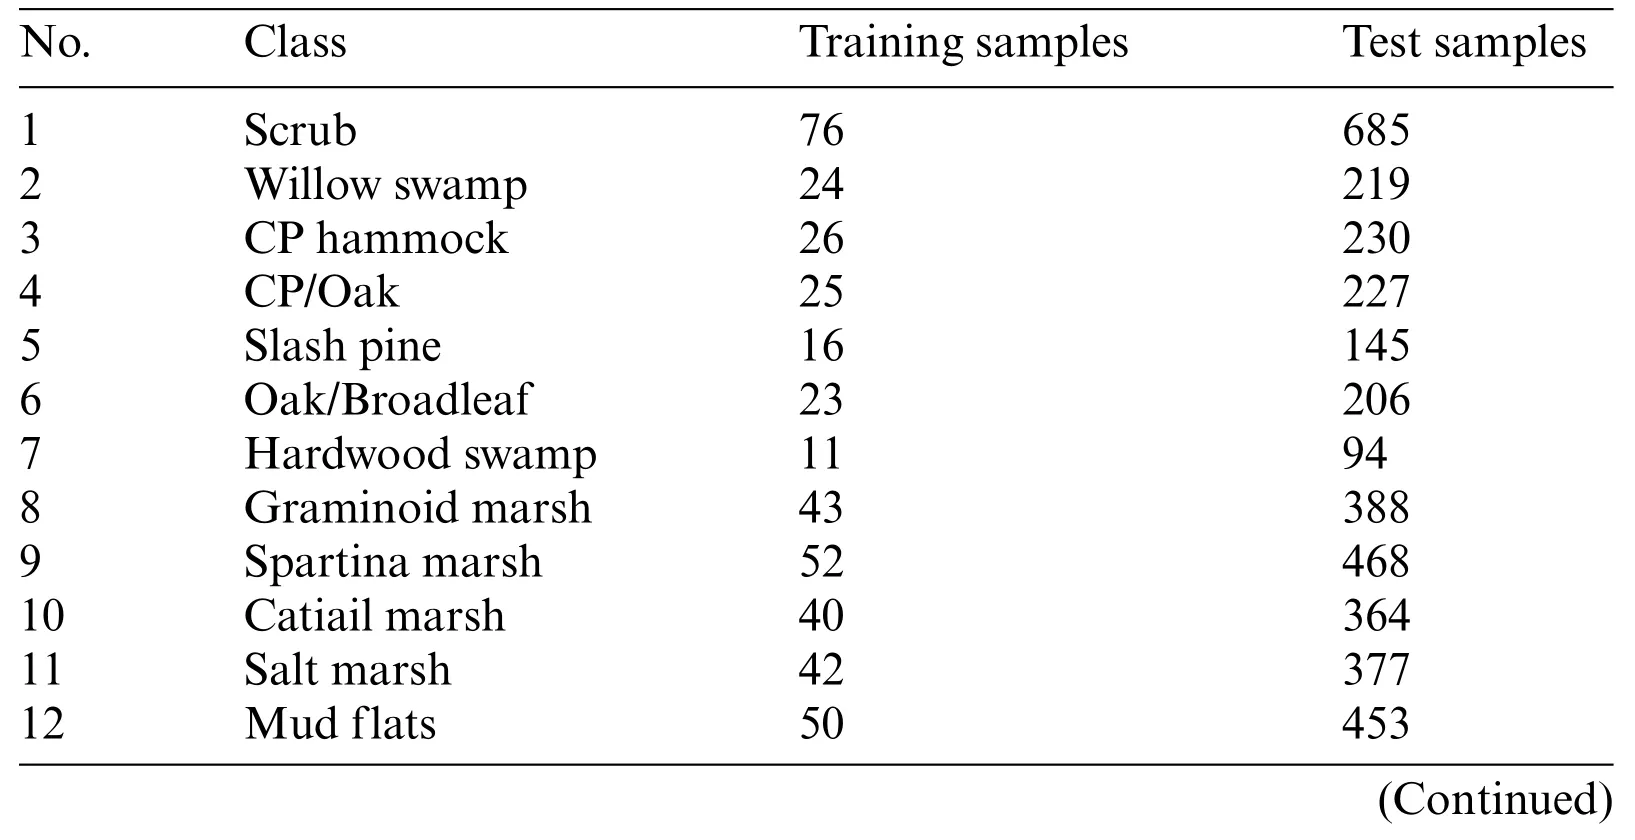
Table 2:Number of training and test samples used in the KSC dataset

Table 2 (continued)No.Class Training samples Test samples 13 Water 93 834 Total 521 4690

Table 3:Number of training and test samples used in the IP dataset
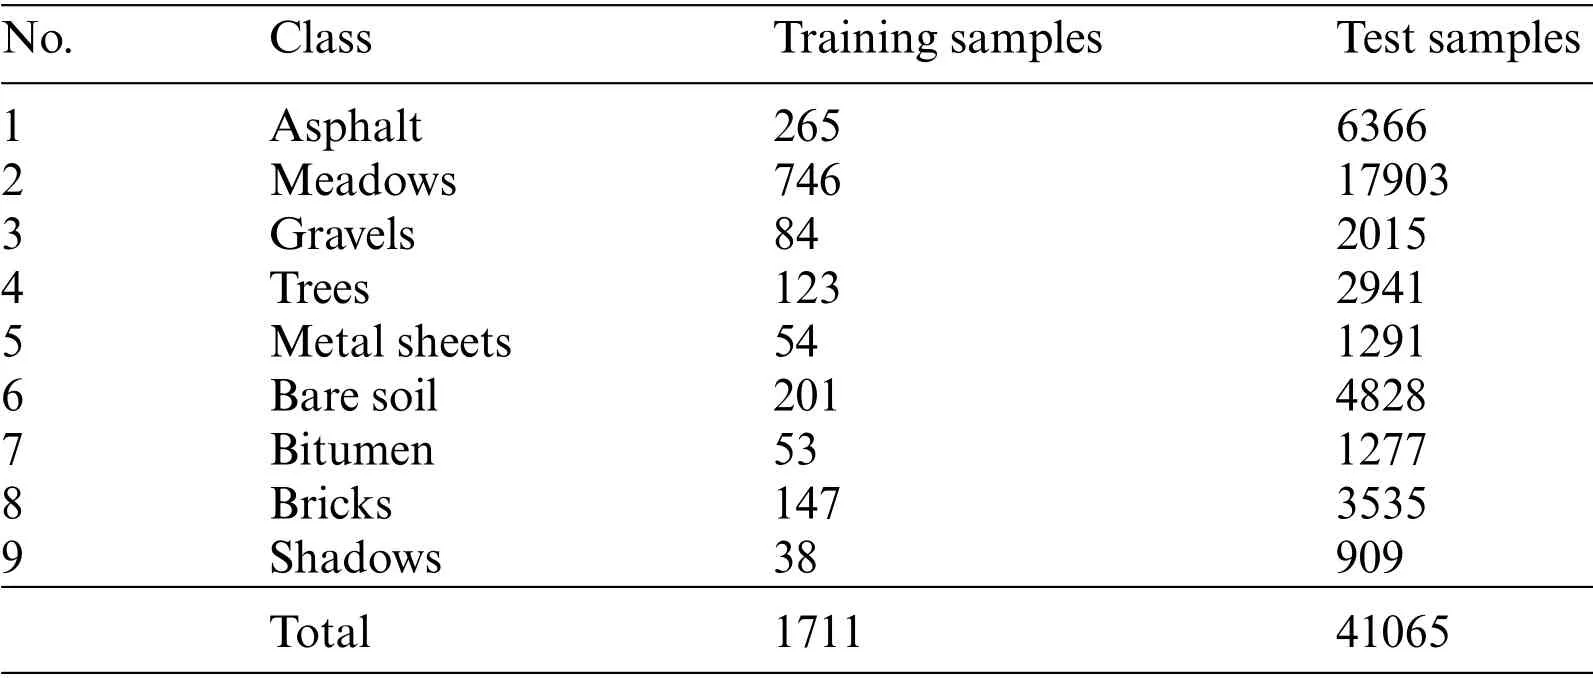
Table 4:Number of training and test samples used in the UP dataset
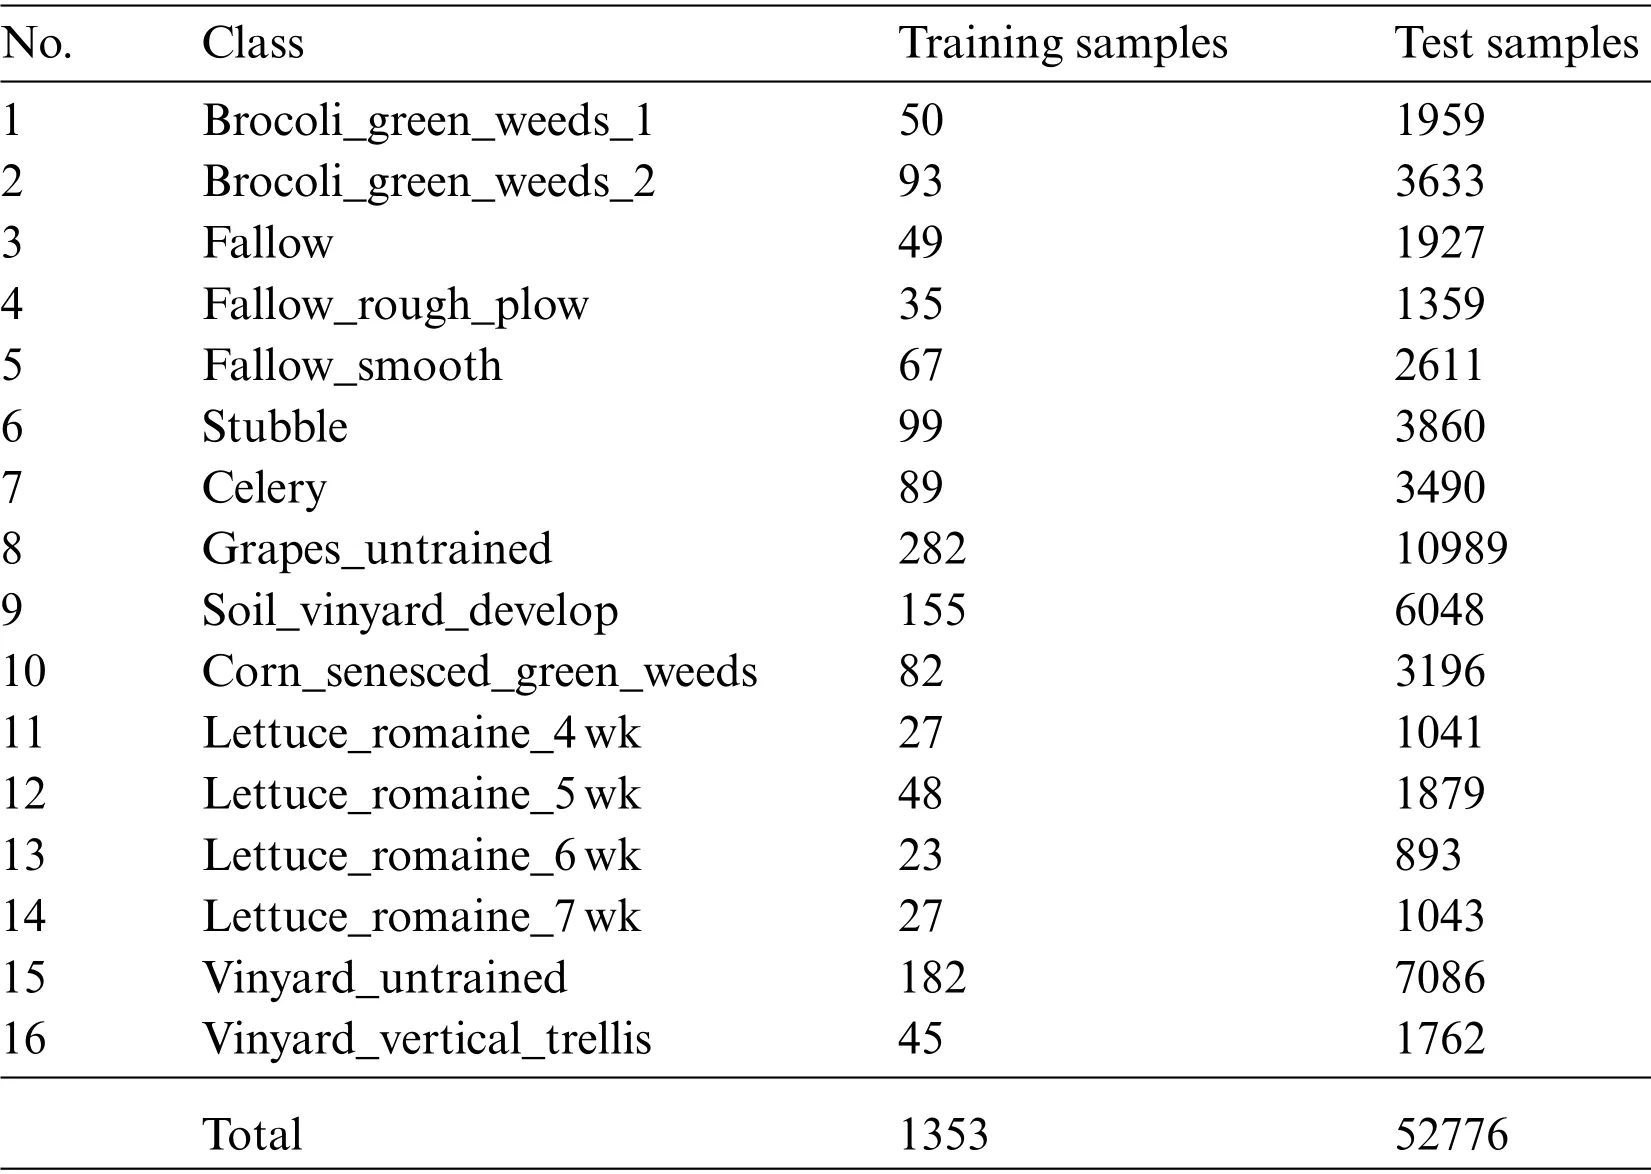
Table 5:Number of training and test samples used in the SA dataset
5.5 Classification Results
5.5.1 Classification Results on KSC
The classification results of four CNN based methods on KSC dataset have been shown in Table 6.The first 13 rows of the table indicate class-wise accuracies,and the remaining three rows present statistical results in terms of OA,AA,andKp.It has been observed that the performance of 2D CNN is better than 1D CNN because spatial information has more impact than spectral information.Further,compared with 2D CNN,3D CNN and FFCNN has achieved better classification results due to the presence of both spectral and spatial information.Lastly,when we compared the results of 3D CNNvs.FFCNN,we found that FFCNN performed better due to the consideration of feature fusion.It is worth mentioning that FFCNN has achieved almost accurate classification accuracy for eight classes(including Scrub,CP Hammock,Hardwood swamp,Graminoid marsh,Spartina marsh,Catiail marsh,Salt marsh,Mud flats)and obtained perfect classification for Water class.For all the classes,FFCNN has achieved more than 94% classification accuracy.Among four methods,the statistical performance of FFCNN is found to be better in terms of OA,AA,andKp.

Table 6:Classification results obtained by different methods for KSC dataset
Along with the statistical results,a classification map has been presented for all four datasets using all considered models.The classification map on the KSC dataset is shown in Fig.13.It can be observed that 1D CNN and 2D CNN misclassify many samples whereas the classification maps of 3D CNN and FFCNN are better than 1D CNN and 2D CNN due to the effect of spectral and spatial information.As the number of labeled samples in KSC is very less,therefore it is very difficult to visually differentiate the classification maps of 3D CNN and FFCNN.

Figure 13:(Continued)

Figure 13:Classification maps for KSC dataset.(a)1D CNN.(b)2D CNN.(c)3D CNN.(d)FFCNN
5.5.2 Classification Results on IP
The classification results on IP dataset have been summarized in Table 7.It has been observed that 1D CNN obtained below 70%classification accuracy in many classes.The performance of other methods is far better than 1D CNN.For 2D CNN,each class has achieved over 84% classification accuracy.In case of 3D CNN and FFCNN,all the classes have obtained more than 91%classification accuracy.For the Oats class,the classification results of 1D CNN and 2D CNN are not satisfactory.Compared with these two methods,the performance of 3D CNN has increased by 61.11%and 13.89%,respectively whereas the performance of FFCNN has improved by 60.83%and 13.61%,respectively.Compared with 3D CNN,FFCNN has obtained better classification accuracy in many classes and achieved higher statistical results in terms of OA,AA,andKp.

Table 7:Classification results obtained by different methods for IP dataset

Table 7 (continued)Class 1D CNN 2D CNN 3D CNN FFCNN BuildngGrassTrees 55.07±15.55 90.48±3.42 98.12±1.31 99.27±1.43 Stone-Steel-Towers 87.70±3.02 90.77±6.43 95.23±4.20 91.90±5.99 OA(%) 76.89±1.19 93.39±0.42 97.39±0.70 98.70±0.33 AA(%) 74.19±0.88 91.33±1.10 97.31±0.94 98.25±0.68 Kp×100 73.57±1.28 92.45±0.47 97.03±0.80 98.52±0.38
The classification maps of four methods on IP dataset are shown in Fig.14.Due to the absence of spatial information,1D CNN suffers from misclassification of objects.Similarly,2D CNN fails to produce smooth classification maps due to the lack of spectral information.Besides this,3D CNN and FFCNN have taken advantage of both spectral-spatial information and yielded better classification maps.Compared with 3D CNN,FFCNN has achieved better clarity on Soybeans-mintill class.
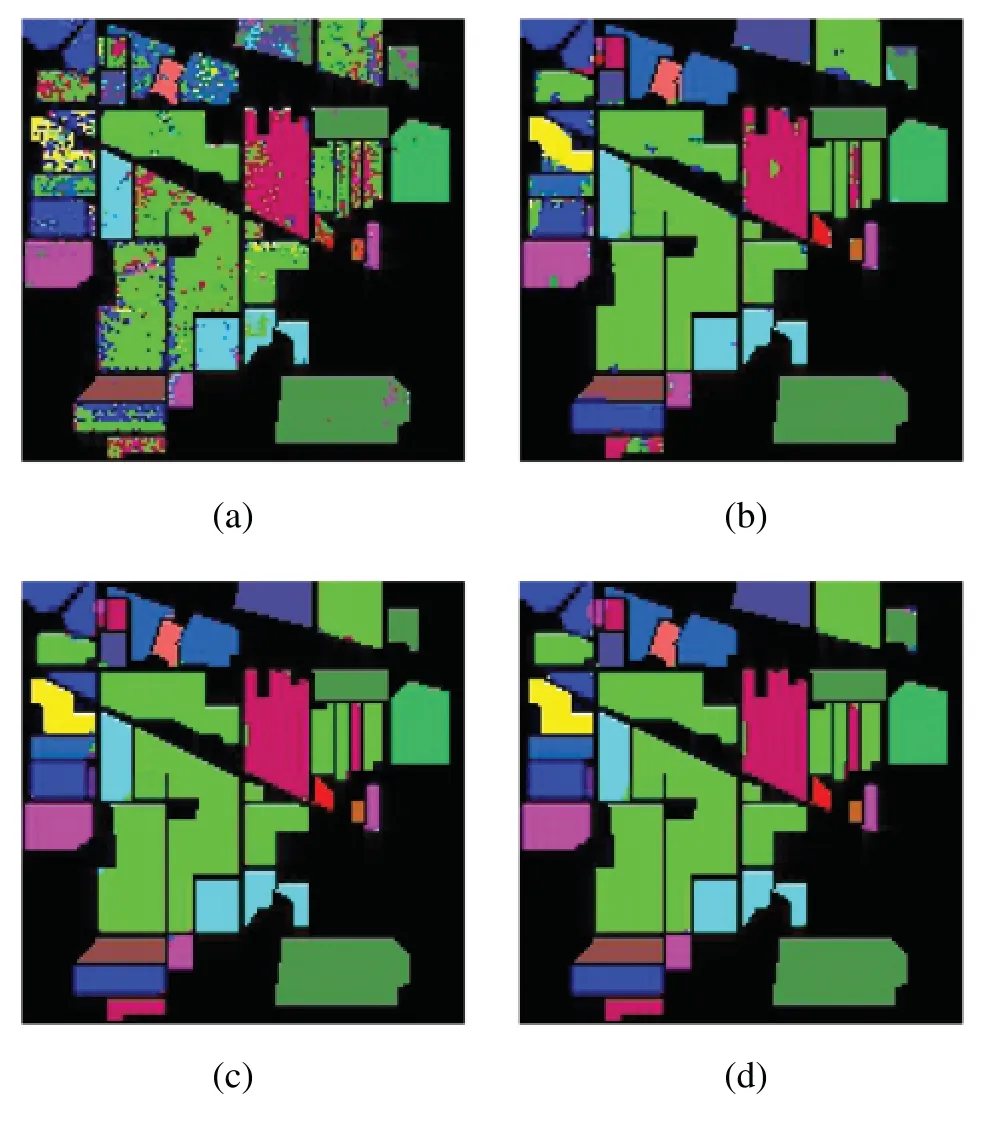
Figure 14:Classification maps for IP dataset.(a)1D CNN.(b)2D CNN.(c)3D CNN.(d)FFCNN
5.5.3 Classification Results on UP
The classification results of four methods on UP datasets have been depicted in Table 8.It can be observed that Gravel,Bare soil,and Bitumen were the most difficult class to be classified by the 1D CNN.However,other methods have achieved more than 92% classification accuracy in most of the classes.Therefore,their statistical performance is far better than 1D CNN.The performance of 3D CNN and FFCNN are superior to 1D CNN and 2D CNN in every respect.Compared with 3D CNN,FFCNN obtains better classification results because of its fusion technique.It is worth noting that FFCNN has achieved almost correct classification results for Asphalt,Meadows,Metal Sheets,and Bare soil.Moreover,compared among four methods,FFCNN has best classification accuracies in term of OA,AA,andKp.
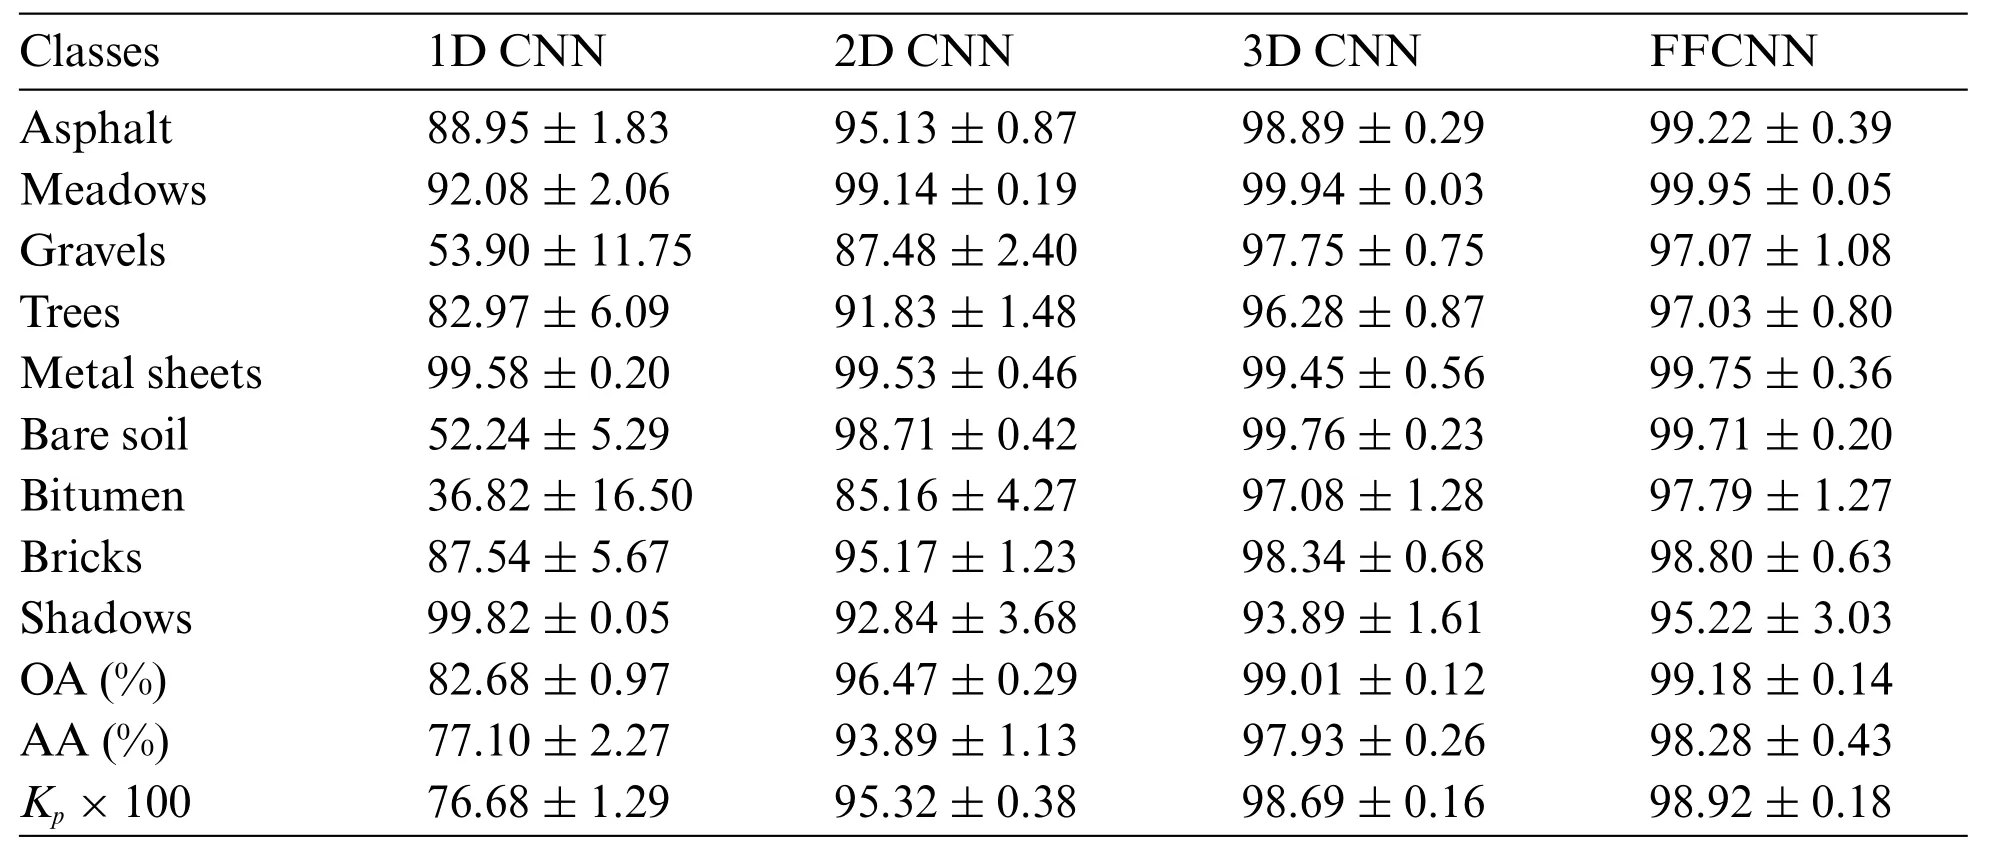
Table 8:Classification results obtained by different methods for UP dataset
The classification maps of four methods on UP dataset are shown in Fig.15.Many samples belonging to the Bare soil class are misclassified by 1D CNN due to similar spectral characteristics and lack of spatial information.However,other methods have shown finer regional clarity in the bare soil class.Moreover,FFCNN has gained improved boundary appearance in the Bitumen class.

Figure 15:(Continued)
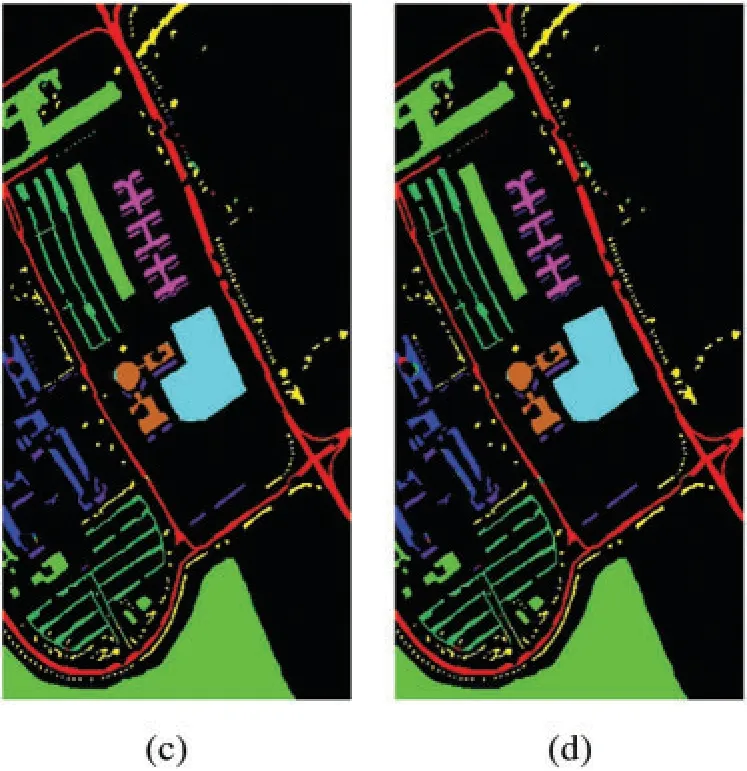
Figure 15:Classification maps for UP dataset.(a)1D CNN.(b)2D CNN.(c)3D CNN.(d)FFCNN
5.5.4 Classification Results on SA
The classification results of four CNN based methods on SA datasets have been reported in Table 9.It can be observed that all the considered methods have obtained more than 96%classification accuracy in most of the classes.However,the performance of 1D CNN is not adequate specifically for Vinyard_untrained class.Compared with this method,the performances of 2D CNN,3D CNN,and FFCNN have increased by 41.91%,44.8%,and 47.53%,respectively.Further,compared with 2D CNN,3D CNN and FFCNN have achieved better classification results.Among four methods,FFCNN has achieved the best classification accuracies in most of the classes.After FFCNN,3D CNN has achieved the highest classification accuracy in terms of OA,AA,andKp.Thus,3D CNN is the closest competitor of FFCNN.

Table 9:Classification results obtained by different methods for SA dataset

Table 9 (continued)Classes 1D CNN 2D CNN 3D CNN FFCNN Lettuce_romaine_7 wk 90.41±3.88 93.69±3.52 98.77±1.48 99.53±0.84 Vinyard_untrained 50.83±19.27 92.74±2.38 95.63±1.47 98.36±1.06 Vinyard_vertical_trellis 94.86±2.91 95.17±1.38 99.37±0.64 99.91±0.13 OA(%) 87.79±1.50 95.36±0.98 98.23±0.39 99.24±0.14 AA(%) 92.17±1.17 96.14±0.64 98.83±0.16 99.47±0.15 Kp×100 86.37±1.67 94.84±1.08 98.03±0.44 99.16±0.16
The classification maps of four methods on SA dataset are shown in Fig.16.It can be observed that 1D CNN,2D CNN,and 3D CNN have misclassified many samples in Grapes_untrained and Vinyard_untrained classes,which make noisy classification maps.However,FFCNN successfully classified all the classes and was able to generate a smooth classification map.Moreover,compared with 3D CNN,FFCNN has obtained finer uniformity in Brocoli_green_weeds_1 and Celery classes.
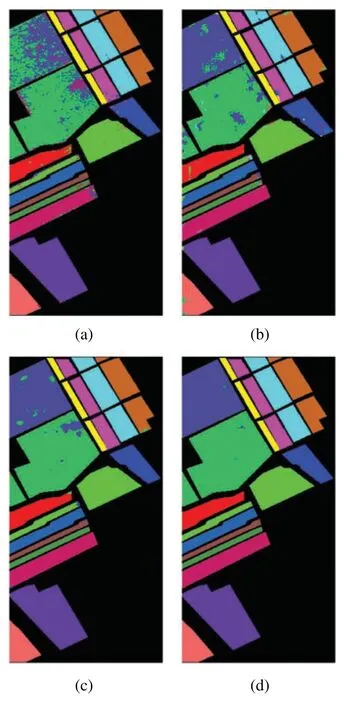
Figure 16:Classification maps for UP dataset.(a)1D CNN.(b)2D CNN.(c)3D CNN.(d)FFCNN
5.6 Analysis on Computational Time
In this section,we have discussed the computational time of four CNN based HSI classification methods.The training time(for 200 epochs)and test time on all the considered datasets are reported in Table 10.The training time of 1D CNN is very less due to the structure of 1D pixel vector.The 2D CNN is faster on training time than 3D CNN and FFCNN due to the consideration of single band.On the other hand,3D CNN and FFCNN cost more training time because of the increasing parameters of the 3D convolution operations.

Table 10:Computational performance comparison of different methods (Tn:Training time,Ts:Test time,and s:seconds)
During testing,the computation time of 1D CNN and 2D CNN were less as compared to 3D CNN and FFCNN.This is because 1D CNN and 2D CNN has less number of parameters whereas 3D CNN and FFCNN involves complex 3D convolution operations.Lastly,while comparing 3D CNN and FFCNN,FFCNN consumes little bit more time due to the usage of feature fusion technique.
6 Conclusion and Future Guidelines
Recently,deep learning models have drawn a significant amount of attention for HSI classification.Among various deep learning models,CNN has shown effectiveness in feature extraction and demonstrated state-of-the-art performance in HSI classification.Therefore,in this paper,we have presented a systematic review on the literature of HSI classification,which is based on various CNN architectures.Further,experimental analysis on four well-known HSI datasets has been presented with four CNN based models namely 1D CNN,2D CNN,3D CNN,and FFCNN.In addition,we have shown the effect of the selection of a number of bands and a number of training samples.The experimental results demonstrated that the performance was not good enough when only spectral information or spatial information was used.But,classification accuracy had increased significantly when both spectral and spatial information were considered.The accuracy had further improved when the feature fusion technique was applied.For this reason,we have found that the overall performance of FFCNN is better than other methods for all considered datasets.Moreover,3D CNN has shown satisfactory classification results and thus,it is the closest competitor of FFCNN.In the context of CNN based HSI classification,we believe that the following are the challenges and future guidelines that might be useful in future research.
(1) To exploit the spectral information,1D CNN may be a suitable choice because it has a simple internal structure and can be easily implemented.In addition,it takes less time to process the pixel vectors of HSI datasets.However,1D CNN alone is unable to produce satisfactory performance.
(2) The 2D CNN is able to efficiently exploit the spatial information of HSI and significantly improves the classification performance.However,2D CNN alone cannot find the subtle differences among small objects due to the insufficient spectral information.Therefore,2D CNN can be integrated with 1D CNN to enhance the classification performance.
(3) 3D CNN provides a way to extract join spectral-spatial feature extraction.Nevertheless,joint spectral-spatial feature extraction leads to information loss[80,88]and hence we believe that separate spectral and spatial feature extraction should be adopted to achieve better classification performance.
(4) Recently,the feature fusion technique has delivered superior performance in HSI classification.However,the system’s performance varies depending on how the fusion of features has been done.For example,there are two types of feature fusion techniques proposed in literature:early fusion and late fusion.The early fusion and late fusion are developed based on the feature level and decision score level,respectively[140].Both fusion techniques have their own advantages and disadvantages.Hence,there are many scopes to improve the HSI classification performance by analyzing the different ways of feature fusion.
(5) HSI has a huge number of bands,and hence,the use of 2D CNN and 3D CNN demand for a selection of a few informative bands to reduce the computational cost and redundant information.More number of bands leads to an increase in computational cost while fewer bands can be responsible for information loss.Therefore,an optimum number of band selection is a critical challenge in the HSI classification system and requires attention.
(6) Another challenge in HSI classification is the limited availability of training samples.Researchers are trying to design a system that can achieve high classification accuracy by utilizing as few training samples as possible.Still,it is a challenging task as insufficient training samples create an overfitting problem.
Funding Statement:The authors received no specific funding for this study.
Conflicts of Interest:The authors declare that they have no conflicts of interest to report regarding the present study.
 Computer Modeling In Engineering&Sciences2022年11期
- Computer Modeling In Engineering&Sciences的其它文章
- A CFD-DEM-Wear Coupling Method for Stone Chip Resistance of Automotive Coatings with a Rigid Connection Particle Method for Non-Spherical Particles
- A Multi-Scale Grasp Detector Based on Fully Matching Model
- Numerical Study for Magnetohydrodynamic(MHD)Unsteady Maxwell Nanofluid Flow Impinging on Heated Stretching Sheet
- An Intelligent Cluster Verification Model Using WSN to Avoid Close Proximity and Control Outbreak of Pandemic in a Massive Crowd
- Hysteresis of Dam Slope Safety Factor under Water Level Fluctuations Based on the LEM Coupled with FEM Method
- Cotangent Similarity Measure of Consistent Neutrosophic Sets and Application to Multiple Attribute Decision-Making Problems in Neutrosophic Multi-Valued Setting
