Prediction and programming of microemulsion phase behavior simulation
Dong-Qi Wang ,Dai-Yin Yin *,Jun-Da Wang ,Ya-Zhou Zhou ,Cheng-Li Zhang
a Department of Petroleum Engineering,Northeast Petroleum University,Daqing,163318,China
b Key Laboratory of Enhanced Oil Recovery,(Northeast Petroleum University),Ministry of Education,China
c PetroChina Refining & Chemicals Company,Beijing,100007,China
Keywords:
ABSTRACT
1.Introduction
Microemulsion is consists of surfactant,additives,oil,water with salinity and other stabilized dispersion system.The amount and type of each component of microemulsion will change the formation of microemulsion and the phase property of microemulsion(Davidson et al.,2016;Wang,2008;Liu,2009;Wang et al.,2021;Suniga et al.,2016).According to whether microemulsion is coexistent with excess oil or water,microemulsion can be divided into multi-phase microemulsion and single-phase microemulsion.Multi-phase microemulsion exist in three phase states,namely,the lower phase microemulsion,the middle phase microemulsion and the upper phase microemulsion.Among the three microemulsion types,the middle phase microemulsion has the highest displacement efficiency.Therefore,in the design of the oil displacement system,it is necessary to keep the middle phase microemulsion flooding as far as possible.In the actual process of microemulsion flooding,microemulsion phase state may be affected by the adsorption of core and the distribution of oil and water.The phase change of microemulsion may occur,forming the upper phase,the middle phase or the lower phase microemulsion.Therefore,how to accurately describe the phase state of microemulsion and quantitatively discrimination the composition of equilibrium phase is of great theoretical value and research significance for the design of microemulsion flooding system and improving the recovery efficiency of microemulsion.
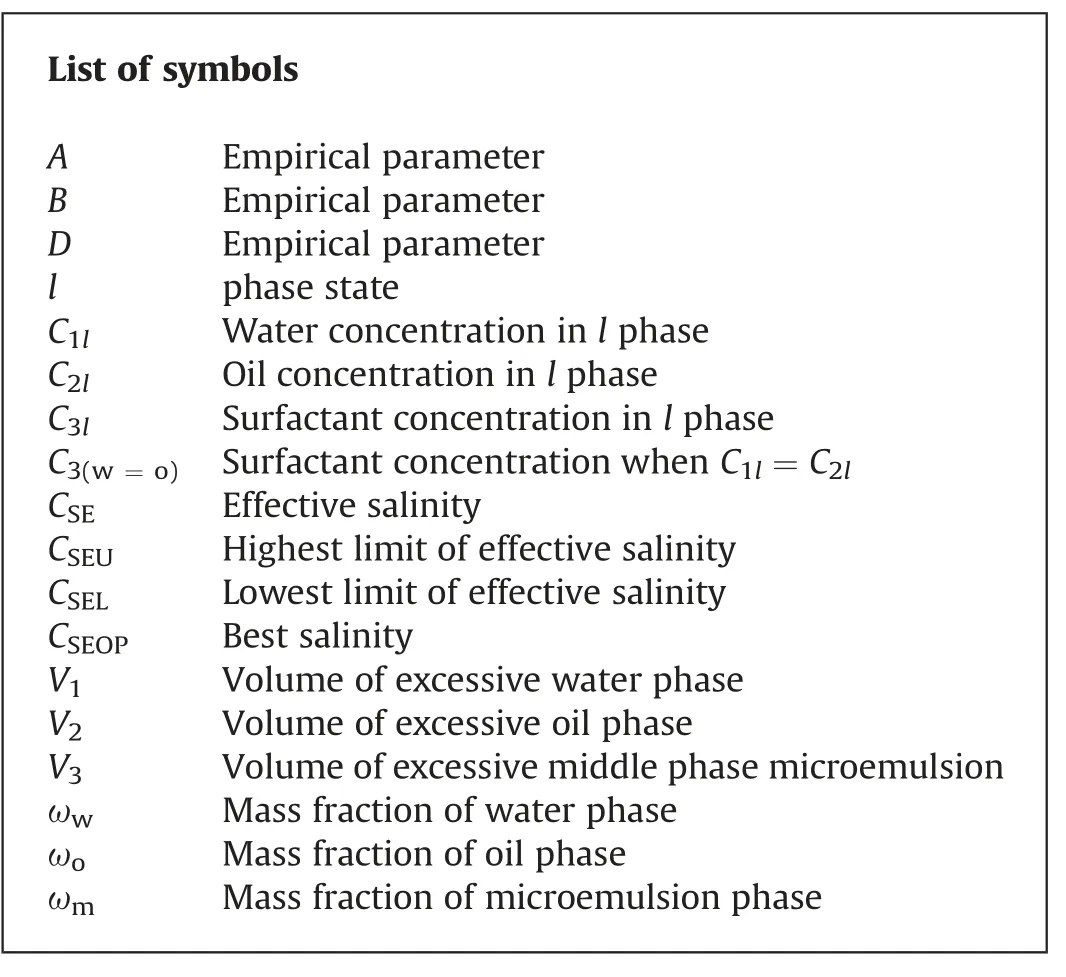
List of symbols A Empirical parameter B Empirical parameter D Empirical parameter l phase state C1lWater concentration in l phase C2lOil concentration in l phase C3lSurfactant concentration in l phase C3(w=o)Surfactant concentration when C1l=C2l CSEEffective salinity CSEUHighest limit of effective salinity CSELLowest limit of effective salinity CSEOPBest salinity V1Volume of excessive water phase V2Volume of excessive oil phase V3Volume of excessive middle phase microemulsion ωwMass fraction of water phase ωoMass fraction of oil phase ωmMass fraction of microemulsion phase
At present,the quantitative description and prediction methods of microemulsion system phase state are mainly Hand model and improved HLD-NAC model.The phase state theory of surfactant/oil/water was proposed and perfected by Winsor,Healy,Welson,Pope and Prouvost(Chang et al.,2018,2019;Liao et al.,1999;Liu,2014;Pan,2018;Walker et al.,2012).This theory mainly considers the formation of three pseudo components from five components in solution,and the volume concentrations of these three components are usually made into quasi-ternary phase diagrams.The commonly used quasi-ternary phase diagrams can be divided into two categories:one is to fix the mass ratio of surfactant to additives,the other is to fix the mass ratio of water to oil.In fact,the mass ratio of water to oil in the process of microemulsion flooding is constantly changing,so the Hand model usually refers to the quasiternary phase diagram of fixed surfactants and additives.Hand model considers that the formula of binodal curve in all phase environments can be changed into the same formula,which is established based on the experience that the concentration ratio of equilibrium phase is a straight line in the double logarithm coordinate,and is widely used in the mainstream reservoir numerical simulation software.Since 2009,Acosta EJ of University of Toronto has proposed the HLD-NAC model as“an equation of state”to predict the properties of the microemulsion system formulated with by anionic or non-ionic surfactants(Acosta,2009;Acosta and Bhakta,2009;Acosta et al.,2012;Choi et al.,2020;Stammitti-Scarpone and Acosta,2019).On the one hand,the model uses the concept of hydrophilic-lipophilic difference(HLD)to calculate the chemical potential difference of transferring a surfactant from the oil phase to the water phase,which is a function of formulation variables such as type of surfactant,oil,temperature and electrolyte concentration.On the other hand,the net-average curvature(NAC)model is used to fit and predict the phase behavior of microemulsion formulated with ionic surfactants.In recent years,Johns RT of University of Pennsylvania has proposed a modified HLD-NAC model to match and predict the experimental data of Winsor III microemulsion phase behavior in view of the fact that the original HLD-NAC model cannot describe the Winsor I and Winsor II phase behavior and catastrophe theory,which has ensured the consistency of the whole composition space(including Winsor I and Winsor II)(Roshanfekr and Johns,2011;Khorsandi and Johns,2016;Ghosh and Johns,2018;Ghosh and Johns,2016a,2016b;Torrealba et al.,2019;Torrealba and Johns,2017,2018;Ghosh et al.,2018).For three types of Winsor,an efficient algorithm is developed.The algorithm has good convergence,can provide any form of continuity prediction of two-phase plait point lines and the IIIphase node line,and eliminate the discontinuity.The limit connection line near the critical point is determined by analysis.A large number of experimental results show that the method has good predictability and solubilization rate.
Through research and comparison,the existing Hand model has two problems in describing the phase state of microemulsion.One is that the general Hand model(B≠-1)is difficult to obtain the numerical solution of the binodal curve,and the iterative solution is complex.The other is that the simplified Hand model(B=-1)has a large error in describing the phase curve when the water-oil ratio is too low or too high,so the simulation accuracy needs to be improved.The improved HLD-NAC model needs to consider more parameters,and the relevant parameters need to be obtained through a lot of experiments,with heavy workload and complex calculation.In view of the problems of the above models,Wang DQ proposed an improved Hand model in 2019(Wang,2019;Wang et al.,2019;Zhou et al.,2019,2020).The new model introduces binodal curve range parameter D and the asymmetric migration degree parameter B,which can not only obtain the numerical solution of the symmetric/asymmetric binodal curve,but also improve the simulation accuracy of the simplified Hand model.Therefore,based on the improved Hand model,the phase simulation prediction and programming of microemulsion system were carried out to accurately describe the phase state of microemulsion and identify the composition of equilibrium phase of microemulsion.
1.Types and changes of phase state
In the process of microemulsion flooding,phase,component,time and space are changed due to the migration of components such as water,oil,surfactant and additives.The proportion of oil and water,salinity,and the type,structure,concentration of surfactant and additives have decisive influence on the phase state.The phase change can be represented by the quasi-ternary phase diagram of water,oil and surfactant.Three fixed points of phase diagram respectively represents the water with salinity,surfactant+additives,oil,and phase diagram is a function of salinity.With the changes of the salinity of microemulsion system,the phase diagram also changes continuously.Phase state changes of Winsor I,Winsor II and Winsor III are as shown in Fig.1.
Winsor I:The slope of the binodal curve is negative,and there are two co-existing equilibrium phases.The plait point of the two phase region is obviously inclined to the oil side,which represents the lower phase microemulsion of the low salinity system,also known as Winsor II(┐)phase diagram.Under low salinity,the plait point inclined to the oil side indicates that the affinity between surfactant and water is significantly greater than that between surfactant and oil.When the salinity is lower than the critical salinity CSEL(lowest limit of effective salinity)for maintaining the phase state of Winsor I,it will form two phase co-existing system of the lower phase microemulsion(O/W)and the excess oil phase.
Winsor III:There are three co-existing equilibrium phases.When the composition of the system falls into the connection triangle,it represents the middle phase microemulsion of the best salinity system.Under the best salinity,the affinity between surfactant and water is close to that between surfactant and oil,and most of the surfactants are in the middle phase microemulsion.When the salinity is between CSELand CSEU,it will form three phase co-existing system of the middle phase microemulsion,the excess oil phase and the excess water phase.With the increase of salinity,the solubilizing ability of surfactants to oil increases and that to water decreases,which makes the relative volume of excess oil phase decrease and the relative volume of excess water phase increase.Then the relative content of oil increases and that of water decreases in the middle phase microemulsion.The middle phase point composed of constant points will start from the water phase point and move up to the right,then move down to the oil phase point after the maximum value.
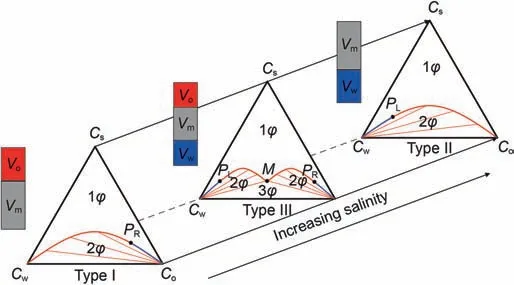
Fig.1.Quasi-ternary phase diagram of microemulsion phase behavior.
Winsor II:The slope of the binodal curve is positive,and there are two co-existing equilibrium phases.The plait point of the two phase region is obviously inclined to the water side,which represents the upper phase microemulsion of the high salinity system,also known as Winsor II(+)phase diagram.Under high salinity,the plait point inclined to the water side indicates that the affinity between surfactant and oil is significantly greater than that between surfactant and water.When the salinity is higher than the critical salinity CSEU(highest limit of effective salinity)for maintaining the phase state of Winsor II,it will form two phase coexisting system of the upper phase microemulsion(O/W)and the excess water phase.
Quasi-ternary phase diagram is the basis for the composition simulation of microemulsion flooding.Surfactant can be soluble in any proportion with water and oil.In order to describe the process of microemulsion phase behavior accurately,it is necessary to analyze the migration of surfactant and salts in microemulsion,water and oil phase.Component analysis of equilibrium phases in microemulsion is shown in Table 1.

Table1 Component analysis of equilibrium phases in microemulsion.
2.Prediction model of microemulsion phase behavior
According to Hand model,the concentration ratio of equilibrium phases is linear in double logarithmic coordinates,and the formula of binodal curve in all phase environments can be defined as,

where,A-empirical parameter;B-empirical parameter,for the symmetric binodal curve,B=-1,the above formula is the simplified Hand model,for the asymmetric binodal curve,B≠-1,it is difficult to obtain the numerical solution of binodal node curve by the aboveconcentration C3(w=o)reaches the maximum value,which is the height of the binodal curve C3max.For the asymmetric binodal curve,there may be two cases.When the highest height of the binodal curve C3maxis on the left of the surfactant concentration C3(w=o),it is called left-sided asymmetry binodal curve.When the highest height of the binodal curve C3maxis on the right of the surfactant concentration C3(w=o),it is called right-sided asymmetry binodal curve.
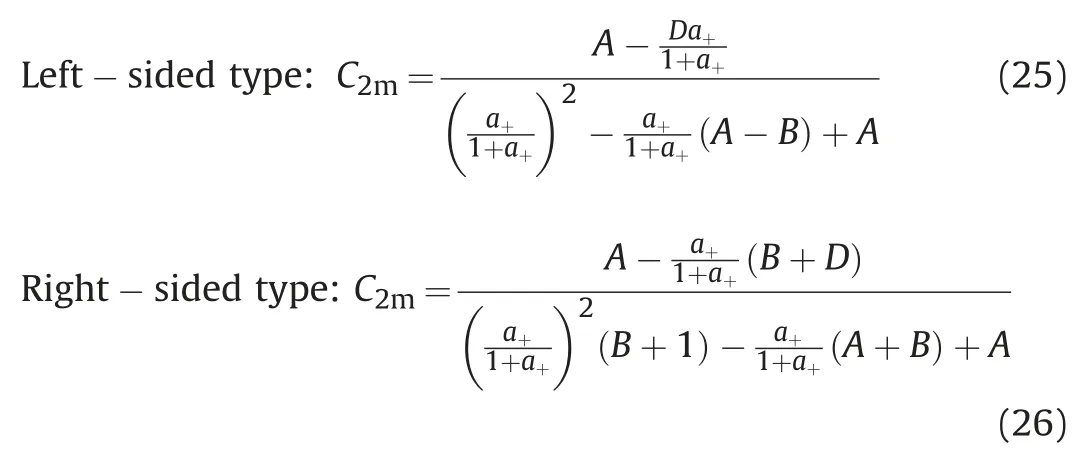
In view of the problems existing in the current phase model,we modify the power exponent B of the Hand model,then introduce the binodal curve range parameter D and the asymmetric migration degree parameter B.For two kinds of asymmetric binodal curves(left-sided type and right-sided type),the asymmetric binodal curves can be expressed by the following formula,

In the formula,parameter A,B and D can be obtained from the experimental data.Parameter A is related to the height of binodal curves.Parameter B reflects the asymmetric migration degree of the binodal curve.When B=0,the left-sided asymmetric binodal curve and the right-sided asymmetric binodal curve are the same;Parameter D reflects the range of binodal curve.When B=0 and D=0,the above binodal curves are the same with the simplified Hand model to describe the symmetric binodal curve.In addition,when the values of A,B and D of the right-sided and left-sided asymmetric binodal curves are the same,the curve is symmetric about the center line of the quasi-ternary phase diagram(C1l=C2l).
Combined with the component concentration formulaformula(2)and formula(3)are solved.All phase concentrations can be calculated according to the oil concentration C2l.

Right-sided type:formula;l-phase state,l=w,o,m respectively represent water phase,oil phase and microemulsion phase.
For the symmetric binodal curve,when the water concentration C1lis equal to the oil concentration C2lin each phase,the surfactant Left-sided type:

Water concentration C1l:

3.Conditions and programming for microemulsion phase discrimination
The salinity and total system composition of microemulsion directly affect the microemulsion phase state and number of coexisting equilibrium phases.According to the results of laboratory experiments,we have already known phase model parameters under the low salinity,the best salinity and the high salinity.According to the interpolation method,the bimodal curve height parameter ASE,the binodal curve range parameter DSEand the asymmetric migration degree parameter BSEunder different salinity can be obtained,then we can get quasi-ternary phase diagram of microemulsion under different salinity.If the water concentration C1P,the oil concentration C2Pand the surfactant concentration C3Pof total system are known,it can be used to

where,m=0,1,2-represents the phase state under the low salinity,the best salinity and the high salinity.
The height of the binodal curve C3(w=o)and m can be considered as a linear function of temperature.

where,HBNC,m,HBNT,m-input parameters,which can be obtained from experimental data.
Parameter B reflects the asymmetric migration degree of the binodal curve,which is related to the system composition of the C3max(parameter A reflecting the highest height of the binodal curve)and the binodal curve range parameter D.Parameter B of the asymmetric binodal curve can be defined as,

determine the number and type of phases formed by any composition of microemulsion,and determine the mass fraction of equilibrium phases.
In order to quantitatively describe the binodal curve with different salinity,the linear difference of parameters A,B and D in the formula was calculated for a certain salinity CSEof the system.
3.1.Determine the type of phase diagram according to the salinity
When the salinity CSE<CSEL,it is phase state of Winsor I;when the salinity CSE>CSEU,it is phase state of Winsor II;when the salinity CSEL<CSE<CSEU,it is phase state of Winsor III.
Parameters A,B and D of the binodal curve are a function of salinity,according to the phase experiments,the height of binodal curve,surfactant concentration and water or oil concentration at the same concentration of oil and water under three reference salinity are input data.Based on formulas,parameters A0,A1,A2,B0,B1,B2,D0,D1,D2can be obtained,and then according to the linear interpolation formula,parameters ASE、BSE、DSEunder any salinity can be calculated.
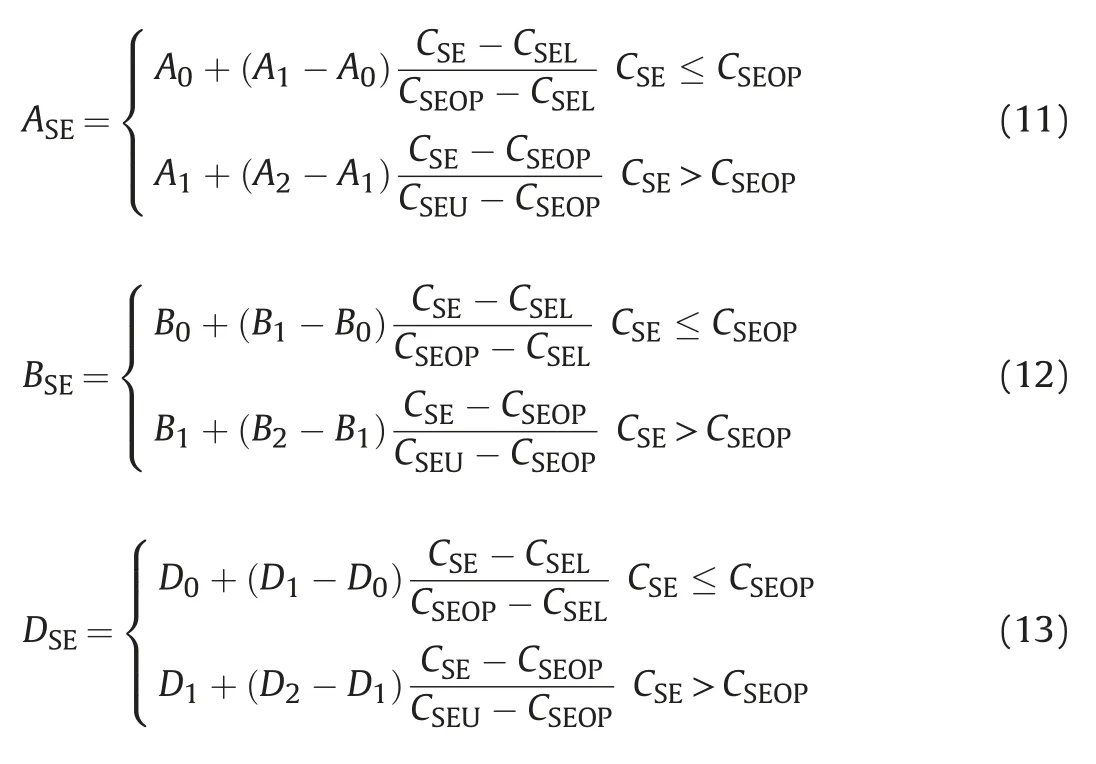
Parameter A reflects the highest height of the binodal curve,which is related to the surfactant concentration(height of the binodal curve)C3(w=o)under the same concentration of oil and water.where,CSEU-the critical salinity for maintaining the phase state of Winsor II,that is the highest limit of effective salinity;CSEL-the critical salinity for maintaining the phase state of Winsor I,that is the lowest limit of effective salinity;CSEOP-the best salinity,the arithmetic mean value of CSELand CSEU.
The height of the binodal curve under the three reference salinities are all input data,and can be estimated and fitted according to the experimental results.If the parameters ASE,BSEand DSEare substituted into formula(2)or(3),the quasi-ternary phase diagram of the microemulsion of any temperature,any pressure and any salinity can be obtained.
3.2.Determine the phase number and type of microemulsion basing on total components
For the Winsor III,when C3M/C1M>C3P/C1Pand C3M/C2M>C3P/C2P,there are three phases coexist in the system.For Winsor I(including right junction)and Winsor II(including left junction),there are three phases coexist in the system;When C3P≥C3l|C2l=C2P,there is only one phase in the system.
When the system phase is Winsor III,the following formulas can be given for the solution of all components in the three-phase triangular region.

The physical meaning of this formula is that when the salinity increases from CSELto CSEU,the oil concentration of the middle phase microemulsion increases from 0 to 1.Therefore,this ratio gives the oil concentration of the middle phase microemulsion at any salinity.For Winsor III,with the increase of salinity,three phase points of the trajectories are given.
If V represents the volume of micro-element,V1、V2、V3represent respectively the volume of excessive water phase,oil phase and middle phase microemulsion in micro-element,then,

Formula(15)is solved.

Thus,when V1>0 andV2>0,the conditions for the existence of three-phase in the micro element is,

When V1/V≤0,the excess water phase does not exist and all constituent points fall into the range of the right junction.When V2/V≤0,the excess oil phase does not exist and all constituent points fall into the range of left junction.In these two cases,there are two phases coexist in the system and its solution method is the same with that of Winsor I and II.When formula(18)is satisfied,all the constituent points fall into the area of the three-phase triangle region,and at this time,co-there are three phases coexist in the system.When the formula is not satisfied,the system belongs to a single phase or two phase co-existing state.
In the phase state of Winsor I(including right junction)and Winsor II(including left junction),when the total component C3P≥C3max,the system also belongs to single phase,and the phase composition of the single phase system is the total component.When the total component C3P<C3max,the conditions for the existence of two phases in the micro element are as follows.

Right-sided type:

Left-sided type:

3.3.Determine the mass fraction of equilibrium phase according to the straight line law and the leverage principle
For the oil reservoirs with the existence of surfactant,the phase mass fraction can be determined by the phase concentration,the total component concentration and the mass fraction constraint conditions.If the water concentration C1P,the oil concentration C2Pand the surfactant concentration C3Pof total system are known,we can determine the phase number and phase type of microemulsion system,and then we can determine the mass fraction of each phase according to the straight line law and the leverage principle.
For Winsor I or Winsor II,only two phases coexist on the binodal curve,and the two ends of the two-phase plait point lines are composed of equilibrium phases.Due to the low concentration of water and surfactant components or oil and surfactant components in the equilibrium phase(excess oil phase or water phase)on the two-phase plait point lines,the model is simplified to reduce the workload of the numerical simulation of microemulsion flooding.Assuming that the excess oil phase or water phase is a single pure phase,the two-phase plait point lines have nothing to do with the location of the plait point,which can be defined as,

At this time,the two ends of the two-phase plait point lines for Winsor I are always the pure oil phase and the lower phase microemulsion,and that of the two-phase plait point lines for Winsor II are always the pure water phase and the upper phase microemulsion.For Winsor I phase diagram,if the two phases coexist in the system,we can determine composition of the other equilibrium phase according to the composition of the total components and the equilibrium phase of the pure oil phase.The composition is not only on the binodal curve,but also on two-phase plait point lines.Combining formula(2)or formula(3)with formula(21),then the oil concentration of the equilibrium phase is,

Right

Similarly,for Winsor II phase diagram,the oil concentration of equilibrium phase is,
According to the straight line law and the leverage principle,if the two systems are mixed with each other,the new system composition must be on the linking line of the two phases.In the Winsor I or Winsor II phase diagram,the ratio of the mass fraction of the upper phase microemulsion or the lower phase microemulsion and pure oil phase can be defined as

According to the constraint conditions of mass fraction,the mass fraction of each phase in the microemulsion system was further given as follows,
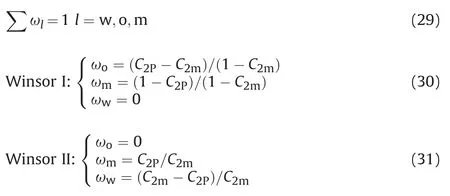
For the Winsor III phase diagram,if the two phases coexist in the system,we can calculate the mass fraction of each phase in application of formula(30)and formula(31).If the three phases coexist in the system,we can determine the middle phase microemulsion system according to the total composition,pure oil phase and pure water phase,and its composition is not only on the linking line of water/oil phase and total composition,and it is also on the III phase nodal line.According to the formula of water phase and total composition line,and III phase nodal line(oil phase),oil concentration and mass fraction of each phase of the middle phase microemulsion was determined.

III phase nodal line(oil phase):C3l=a-(C2l-1),a-=

Formula(32)and formula(33)are solved simultaneously,that is,the concentration of oil component in the equilibrium phase is,

According to the straight line law and the leverage principle,the total component concentration is on the linking line of water phase and equilibrium phase,the equilibrium phase concentration is on the linking line of the microemulsion phase and oil phase,and the ratio of the mass fraction of the microemulsion phase,the pure oil phase and the pure water phase can be defined as,

According to the constraint conditions of the phase mass fraction,the mass fraction of each phase in the system of microemulsion was further given as follows.
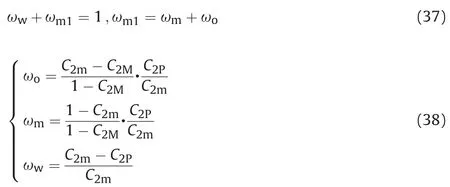
According to the conditions for microemulsion phase discrimination,if the system belongs to single phase,the mass fraction of microemulsion phase is 100%.If the system belongs to two-phase microemulsion,formula(30)is used to calculate the mass fraction of O/W type microemulsion,and formula(31)is used to calculate the mass fraction of W/O type microemulsion.If the system belongs to three-phase microemulsion,formula(38)is used to calculate the mass fraction of the middle phase microemulsion.
3.4.Programming of microemulsion phase discrimination
According to the above conditions for phase discrimination,the programming of microemulsion phase discrimination is given,as shown in Fig.2.
4.Phase simulation verification
4.1.Verification of salinity scanning law
Assuming the highest height of binodal curve under the lower limit of effective salinity,the best salinity and the highest limit of effective salinity are 28.45%,38.32% and 28.48% respectively,the bimodal curve parameters can be calculated,A0=2.84,A1=5.74,A2=2.84,B0=0,B1=-2.40,B2=0,D0=-0.99,D1=-0.30,D0=-0.99.According to the discrimination process of microemulsion phase,the phase model of microemulsion was verified.If the total composition of the system was fixed(C1P=46%,C2P=46%,C3P=8%),When changing the salinity CSE,the verification result of salinity scanning law is shown in Fig.3.
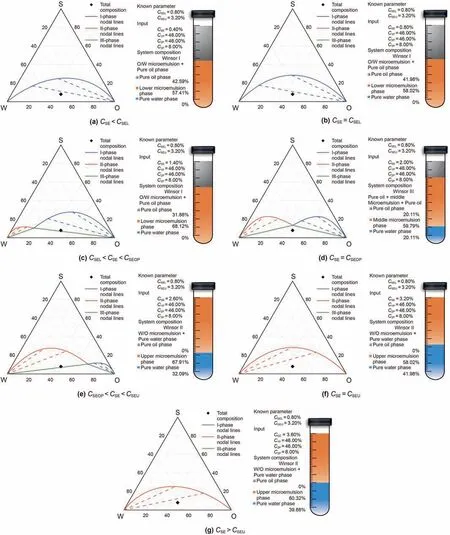
Fig.3.Results of salinity scanning law.
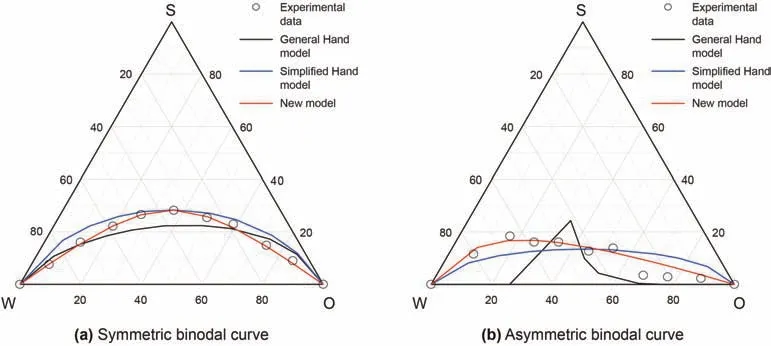
Fig.4.Microemulsion phase simulation results.
From the analysis of the above results,we can see that the phase behavior of the total system composition is consistent with the result of phase behavior discrimination,which accords with the law of salinity scanning.The model is simple and convenient for discriminating the phase state of microemulsion,and the results are more reliable.
4.2.Verification of phase simulation results
Based on the experimental data of quasi-ternary phase diagram,the phase model simulation accuracy of the simplified Hand model,the general Hand model and the microemulsion phase prediction model are verified.The phase simulation results of data 1(Wang,2019)and data 2(Yan et al.,2016)are shown in Fig.4.
From the simulation results,the simplified Hand model can only describe the symmetric binodal curve.The parameter A is obtained by using formula(7),and the binodal curve is symmetrical with respect to surfactant concentration(height of binodal curve)C3(w=0)at the same oil-water concentration,but the simulation accuracy is lower at low or high oil-water ratio.The general Hand model can describe the asymmetric binodal curve,but the simulation accuracy needs to be improved.The new microemulsion model can not only describe the asymmetric binodal curve,but also quantitatively describe the phase change characteristics and emulsification process of microemulsion.It has solved the problem that Hand model cannot accurately describe the bimodal curve at high or low water/oil ratio,and obtain the analytical solution of asymmetrical binodal curve,and simulate the changing phase process visually,but improves the simulation accuracy of microemulsion phase behavior.
5.Conclusion
1 By introducing the binodal curve range parameter D and the asymmetric migration degree parameter B,a new model for predicting the phase behavior of microemulsion is carried out.This phase model has solved the problems such as the difficulty of numerical solution of general Hand model,the low accuracy of binodal curve simulation of simplified Hand model,and the unknown parameters of the improved HLD-NAC model.
2 According to the salinity,the total composition of microemulsion,the straight line law and the leverage principle,the conditions for microemulsion phase discrimination was defined,and programming of microemulsion phase discrimination was also designed.The quasi-ternary phase diagram of microemulsion under any salinity was determined.The phase number and phase type discrimination method and the calculation method of equilibrium phase mass fraction for any microemulsion system were established.The discriminating method of phase number and phase type and the calculation method of mass fraction of equilibrium phases for different microemulsion systems were established.
3 The simulation results of microemulsions show that the phase change of microemulsion accords with the salinity scanning law,which can accurately describe the phase state of microemulsion and determine the composition of equilibrium phases quantitatively.It is of great theoretical value and research significance for the design of microemulsion flooding system and improving the recovery efficiency of microemulsion.
Acknowledgements
This work was financially supported by Northeast Petroleum University Talent Introduction Scientific Research Start-Up Foundation Project“dynamic characterization and prediction method of phase behavior of microemulsion flooding”and National Natural Science Foundation of China under grant No.12002083 and Nature Science Foundation of Heilongjiang Province(LH2020E013).
- Petroleum Science的其它文章
- Sedimentary characteristics and implications for hydrocarbon exploration in a retrograding shallow-water delta:An example from the fourth member of the Cretaceous Quantou Formation in the Sanzhao depression,Songliao Basin,NE China
- Study of the gas sources of the Ordovician gas reservoir in the Central-Eastern Ordos Basin
- A novel hybrid thermodynamic model for pore size distribution characterisation for shale
- Microstructural analysis of organic matter in shale by SAXS and WAXS methods
- Coupling mechanism of THM fields and SLG phases during the gas extraction process and its application in numerical analysis of gas occurrence regularity and effective extraction radius
- Investigation of oil and water migrations in lacustrine oil shales using 20 MHz 2D NMR relaxometry techniques

