On the time-varying correlations between oil-,gold-,and stock markets:The heterogeneous roles of policy uncertainty in the US and China
Wen Zhao,Yu-Dong Wang
School of Economics and Management,Nanjing University of Science and Technology,Nanjing,210094,China
Keywords:
ABSTRACT
1.I ntroduction
Understanding the evolution of correlations between stock and other asset classes is of great significance for portfolio designing,risk management,as well as market regulation and supervision.Commodity futures have become a desirable asset class in portfolio to diversify or hedge against the stock market risks because they are considered to be driven by different business cycles from traditional financial markets(Roll,2013)and confirmed to have weak correlations with stock markets(Boako et al.,2020).Clearly,given the fact that crude oil and gold are heavily used to diversify or hedge against volatilities in stock markets,the correlations between oil-,gold-,and stock markets have been an issue of high interest.Numerous evidences suggest that oil-stock and gold-stock correlations exhibit time-varying characteristics(Hood and Malik,2013;Junttila et al.,2018;Wen et al.,2019).Intuitively,such dynamic characteristics of cross-asset correlations may not just occur unless driven by some remarkable factors.However,compared to the well-established literature on the correlations of oil-stock and gold-stock,scant attention has been paid to the determinants of these cross-asset correlations,especially the effect of economic policy uncertainty(EPU).
The growing concern about EPU(i.e.,uncertainty related to economic and financial decisions)has been commonly raised since the Global Financial Crisis,the Euro Crisis and increasing partisan policy disputes in the United States(Baker et al.,2016).The seminal works of P′astor and Veronesi(2012,2013)and Gomes et al.(2012)establish theoretical frameworks to demonstrate that the uncertainty of government policies will depress stock prices,and make stocks more volatile and more correlated via its negative influence on investment decisions and personal consumption.Subsequently,numerous literatures confirm that EPU has widespread and significant impacts on macroeconomy and microeconomy(Bloom,2014;Zhu et al.,2021),stock markets(You et al.,2017;Das and Kannadhasan,2020),commodity markets(Wang et al.,2015;Shahzad et al.,2017;Raza et al.,2018;Lyu et al.,2021)and so on.
Despite of the abundant research on the EPU effect on economy and single financial market,how EPU drives the cross-asset correlations still remains insufficiently studied.As mentioned above,one can argue that EPU could affect the market connectedness by its impacts on common macro fundamentals of various markets and the behavior of investors who make cross-asset portfolio investment.In addition,the monetary policy uncertainty(MPU),one of the most important types of EPU,also has a significant effect on global capital flows and credit condition(Miranda-Agrippino and Rey,2020)which closely associate with investment and speculation activities across markets.Considering that crude oil,gold and stock are heavily used for investing,hedging and speculative purposes globally,there is a strong incentive to investigate the role of policy uncertainty playing in the correlations between oil-,goldand stock markets.Such research will facilitate risk management and market regulation during high EPU period just like the current COVID-19 pandemic.
As evidenced by the few literatures emerging recently that have explored the effect of EPU on cross-asset correlations,the US EPU can negatively affect the correlations of US stocks-bonds(Fang et al.,2017)and US stock-Chinese stock(Li and Peng,2017),while a positive effect is observed in case of stock-commodity(Fang et al.,2018;Badshah et al.,2019).Meanwhile,the presence of a significant path-through effect of the US EPU via oil prices spilling over to the currency market is also confirmed by Albulescu et al.(2019).However,the research on the EPU effect on cross-asset correlations is still in its infancy.For one thing,most scholars put their focus on the EPU from the US.With the growing importance of emerging markets,the EPU from developing countries should get more attention.For another,the previous research has only considered the linear impact of it with the common use of DCCX models and OLS approach.In fact,both financial and commodity markets tend to be fraught with frequent external shocks which result into nonlinear relationships as well as regime changes in their series(Adekoya and Oliyide,2021).For these reasons,it is necessary to promote research by taking into more EPU sources and the possible nonlinearity of the EPU impact,and it would contribute to a better understanding of the complicated relationships between the EPU and cross-asset correlations.
In this paper,we extend the few literatures on the effect of EPU on cross-asset correlations by attempting to solve the following questions:First,in terms of the EPU and MPU originating from both the US and China,do they have significant impacts on time-varying correlations between oil-,gold-and stock markets?Is there any difference between the“US impact”and“China impact”?Second,are all these impacts of EPU and MPU on the time-varying correlations alike across various asset pairs?Third,how do the EPU and MPU affect time-varying correlations under different market correlation regimes?To this end,we adopt DCC-GARCH t-Copula model to describe the dynamic conditional correlation between commodities(crude oil and gold)and stocks(the US and Chinese stock markets),and then explore the effects of EPU and MPU on the time-varying correlations using the ordinary least square(OLS)approach and quantile regression(QR)approach.
This paper makes three main contributions to the existing literature.Firstly,it enriches the emerging literatures on the effect of EPU on cross-asset correlations by providing novel insight to the EPU impact in the developing country.It is obviously seen that the existing research mainly focuses on the EPU in the US.In the context of China's strong economic development,the increasing use of the RMB in international capital markets and the importance of Chinese stock market,several studies have documented that Chinese EPU has a significant effect on US macroeconomic variables(Fontaine et al.2017,2018),household asset portfolios(Lee et al.,2020)and even the global markets(Zhang et al.,2019).So,we incorporate the EPU originating from both the US and China into the research framework,in order to compare the significance and relative intensity of the EPU impacts between the US and China.It is interesting and meaningful to explore the international influence of EPU in China on the on hand,and make some comparisons between the influence of EPU originating from the largest developing and developed countries on the other.
Secondly,considering that the single use of EPU may confuse some important information contained in MPU(Mei et al.,2019),we further take into account the possible significant impact of MPU to reveal the profound influence of uncertainty with regard to monetary policies on cross-asset correlations.MPU is one of the most important components of EPU(Lyu et al.,2021).Contrast with the EPU which contains a broad set of information,MPU emphasizes particularly on the uncertainty induced by monetary policies.Monetary policies have direct influence on asset prices and investor sentiment(Kurov,2010;Lutz,2015).Not only the Fed's monetary policy serves as the major driver of global financial cycle(Passari and Rey,2015;Rey,2016),but Chinese monetary policy also plays a crucial role in global commodity markets(Ratti and Vespignani,2013),the economic activities and financial condition of the US and Eurozone(Vespignani,2015;Lombardi et al.,2018).
Last but not least,we employ the QR approach to investigate the possible nonlinear impact of EPU(MPU)under different correlation regimes,as well as produce more accurate results in the presence of some unpalatable statistical issues.The OLS approach is usually used to investigate the determinants of market correlations(Badshah et al.,2019;Batten et al.,2021;Karanasos and Yfanti,2021),which can only capture the impact of independent variables at the mean of the dependent variable's distribution.In this paper,QR approach is also used,which can not only analyze the nonlinear impact of independent variables on dependent variables under different market correlation regimes,but also provides estimates that are robust to outliers,heteroskedasticity,and skewness on the dependent variable(Koenker and Bassett,1978).Recently,there have been some studies using this approach to explore the impacts of some common macroeconomic factors on the market correlations and find the heterogeneity properties(Gokmenoglu and Hadood,2020;McMillan et al.,2021).
The remainder of this paper is organized as follows:Section 2 briefly reviews the related literature.Section 3 introduces the methodology.Section 4 describes the data used in this paper.Section 5 presents the results of empirical results and discussion.Section 6 concludes the paper.
2.Literature review
There are three strands of literature directly related to the research issue of this paper,namely,the determinants of correlations between oil-,gold-and stock markets,the possible influence channels of EPU(MPU)on the time-varying market correlations,and what exactly the effects of EPU(MPU)on them.
The correlation between assets is an instructive indicator to consider when making portfolio investment and cross-market risk management.According to definitions given by Baur and Lucey(2010),an asset is regarded as a diversifier if it is positively(but not perfectly correlated)with another asset or portfolio on average,or a hedge if it is uncorrelated or negatively correlated with another asset or portfolio on average,or a safe haven if it is uncorrelated or negatively correlated with another asset or portfolio in times of market stress or turmoil.A large number of studies concentrated on the investment performance of oil and gold combined with stocks have shown that crude oil and gold can serve as an eligible diversifier(Arouri et al.,2011;Hoang et al.,2015;Adewuyi et al.,2019),hedge(Basher and Sadorsky,2016;Antonakakis et al.,2020;Mensi et al.,2021)and safe haven(Baur and Lucey,2010;Elie et al.,2019).
Furthermore,mounting evidences suggest that the correlations of oil-stock and gold-stock exhibit time-varying characteristics,which experience significant structural changes during global financial crisis and some major events(Creti et al.,2013;Junttila et al.,2018;Wen et al.,2019).These evidences suggest the instability of crude oil and gold serving as the diversifier,hedge or safe haven for stocks.Then what determinants might drive these correlation pattern?According to the few studies that have explored the dynamic cross-asset correlation determinants,global financial crisis event,stock market uncertainties such as VIX,credit conditions,economic activity,business and consumer confidence and so on might exert significant influence on the evolution of correlations(Olson et al.,2014;Batten et al.,2021;Karanasos and Yfanti,2021).In this vein,we focus on the role of EPU besides other common macroeconomic or financial variables in view of the increased concern about uncertainty induced by economic policies and how it affects economic indicators.
Numerous studies have provided ample evidences for the policy uncertainty effect on macroeconomy(Foote et al.,2000;Bloom,2014)and single financial markets,including the stock market(Arouri et al.,2016;You et al.,2017;Guo et al.,2018),bond market(Wisniewski and Lambe,2015)and commodities(Shahzad et al.,2017),especially crude oil(Li et al.,2016)and gold(Raza et al.,2018;Zhang et al.,2021),and the literature are still witnessing increasing for now.However,how EPU drives the connectedness between the commodity and stock markets remains exclusively understudied.
Meanwhile,there are three possible channels through which policy uncertainty might affect market correlations positively or negatively.First is macro fundamentals channel.As the high degree of global integration,different financial markets will be simultaneously affected by some common macroeconomic factors,leading to the cross-asset co-movement.Considering that the downturn in the business cycle is related to the inhibitory effect of high EPU on economic activities,including the reduction in firm investment,employment and industrial production(Colombo,2013;Caggiano et al.,2017).Under such circumstances,the prices of both commodities and stocks tend to decline at the same time due to the sluggish economy,which results in a positive correlation.
Next is the investor behavior channel.The rise of EPU level is proved to reduce stock returns(Arouri et al.,2016)and increase stock market volatility(Liu and Zhang,2015).Under the framework of risk preference theory,when risks in the stock market increase,the safe haven assets(such as gold,bond,etc.)are more attractive to risk-adverse investors.Therefore,investors will transfer their holdings from stocks and other risky assets to the relatively safe assets,which is called a“flight-to-quality”phenomenon(Baur and Lucey,2009).On the other hand,when the EPU declines and the stock market is back to normal,investors'risk aversion level decreases and they re-opt to risk assets,leading to a“flight-fromquality”phenomenon.Both phenomena will lead to negative correlation between risky assets such as stocks and safe-haven assets.
The third is global financial cycle channel.The emerging evidence arguing that US Federal Reserve's monetary policy is the main driver of the global financial cycle,affecting global capital flows and credit expansion(Rey,2015;Miranda-Agrippino and Rey,2020).We can make an inference that the MPU,one most important subcategory in EPU,can exert significant influence on the interactions between markets through changing the global credit environment,liquidity and the risk appetite of investors engaged in arbitrage activities across assets.Such conjecture has been verified by Albulescu et al.(2019)with the evidence in oil-commodity currencies connectedness.With respect to our research objects,the stock market plays a core role in the global financial market,and crude oil and gold market are the most active strategic assets in the commodity market,which are commonly serve as the diversifier or hedge against stock risks.Accordingly,the correlations between these markets will more sensitive to the uncertainty of economic policy,especially the monetary policy.
Based on the possible influence channels discussed above,the emerging strand of literature extends the EPU effect to cross-asset correlations,which is directly related to the issue of this paper.Researchers have reached a consensus that there is a negative effect of US EPU on the stock-bond market correlations,which consisted with the“flight-to-quality”phenomenon(Li et al.,2015;Fang et al.,2017).To capture the nonlinear features of EPU effect,Fasanya et al.(2021)adopt the nonparametric causality-in-quantile test and confirm the high nonlinear causal effect between US EPU and most of the connectedness between bitcoin and precious metals.In terms of the stock-commodity correlation,Fang et al.(2018)extend the DCC-MIDAS model specification and documents a positive impact of US EPU on the long-run correlation between oil and US stock market,which mostly exists during the post 2008 subsample.Karanasos and Yfanti(2021)confirm the positive effect of GEPU and US EPU on cross-asset correlations within OLS regression framework based on the three indices of global equity,real estate,and commodity markets.Furthermore,they test the indirect impact on cross-asset interdependence through several macrofactors and conclude that EPU exacerbates the deterioration of the macroeconomic fundamentals to elevate cross-asset correlation.Badshah et al.(2019)use a larger set of commodity sectors included in the Dow Jones commodity index to examine the effect of policy uncertainty and the state of the economy on the timevarying correlations between commodities and S&P 500 index.They document a significant positive effect of policy uncertainty on most of the time-varying correlations,with the largest positive effects observed in the case of energy commodities followed by industrial metals,while the opposite effect in the case of precious metals.This contrary result exactly indicates the different nature among commodities,especially between energies and precious metals.In addition,the DCCX model(Fang et al.2017,2018;Li and Peng,2017)and OLS regression(Badshah et al.,2019;Karanasos and Yfanti,2021)are usually used to investigate the impact of EPU on cross-asset correlations from the traditional linear framework.
Taking the above,it is obvious that the existing work on the dynamic conditional correlations driven by EPU is limited despite of the rapidly growing EPU literature.Meanwhile,the researchers mainly focus on the global or US EPU,but we should not lose sight of the fact that the EPU originating from developing countries,especially China.As shown in recent research,Chinese EPU exhibits an increasing influence across the world economies(Fontaine et al.,2018)and financial markets(Zhang et al.,2019).Therefore,this paper tries to fill the notable gap in the extant EPU literature by investigating both the impact of the US and Chinese EPU(including MPU)on the connectedness between the commodity(crude oil and gold)and stock market.Following McMillan et al.(2021),we adopt the QR approach to reveal the possible nonlinear effect of EPU across different quantiles of market correlations,which is impossible to be captured by the common use of OLS regression approach.
3.Methodology
3.1.DCC-GARCH t-copula model
DCC-GARCH model is widely adopted due to its ability to capture the time-varying nature of correlation between assets.It assumes the standardized residuals to be normal distribution,while the data generally presents the characteristics of skewness and excess kurtosis in reality.In terms of this issue,Sklar's theorem(Sklar,1959)provides the link between a joint distribution and the corresponding copula,which can solve this problem effectively.This section will introduce the DCC-GARCH t-Copula model estimated by two-step procedure.Firstly,we adopt the AR(p)-GARCH(1,1)model to describe the marginal distribution of the univariate asset return,which is one of the most commonly used and effective models for describing financial time series(Diebold et al.,1998).The lag order of AR process is determined according to the BIC criterion.The return generating process is specified as follows:

where ri,tis the daily return of asset i,μiis the unconditional mean,the elements of{θ1,θ2,…,θp}denote the autoregressive coefficients,εi,tis the innovation and ei,tis the standardized residual coming from a Student-t distribution with videgrees of freedom.hii,tdenotes the time-varying variance ofεi,t,which is further generated by the GARCH(1,1)process:

where exists parameter restrictions:ωi>0,ai>0,bi>0 and ai+bi<1 to ensure a stationary GARCH process.
Secondly,fit the Copula function to the marginal distribution of each asset return.Let X1,X2,…,XNdenote a set of random variables with continuous marginal cumulative distribution functions(CDFs)FX1,FX2,…,FXNrespectively and the joint CDF is FX1,X2,…,XN.According to Sklar's theorem,there is a copula function linking the joint CDF and the marginal CDFs which can be written as:

where FXi(Xi)=ui,i=1,2,…,N are uniformly distributed,and the function C(u1,u2,…,uN)is called the copula.Based on Eq.(4),the copula function can be derived as follows:


Considering the case of two variables(u1,u2),which are uniformly transformed from the standardized residuals(e1,e2)by the probability integral transform,Eq.(6)can be further exhibited as:

where Rtis the correlation matrix andηis the degree of freedom parameter,while tηis the univariate Student-t CDF withηand the univariate inverse CDF of the t-distribution is denoted by t-1.
Next,we use the basic concept of the DCC-GARCH model proposed by Engle(2002)to calculate the time-varying variancecovariance matrix Htand the dynamic conditional correlation matrix Rt.We assume that Rtfollows the DCC(1,1)model as follows:
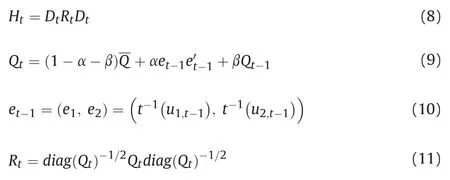
where Dt=diag(h)is a diagonal matrix which contains the square root of time-varying conditional variance from the previous GARCH models.Qtis the time-varying covariance matrix of standardized residuals andis the unconditional variance-covariance matrix.The coefficientαindicates the influence of the standardized residual product of the lagging period on the dynamic conditional correlation andβmeans the persistency.The stationary process requires thatα>0,β>0,α+β<1.The closerα+βis to 1,the stronger the overall persistence of the correlation.
In practice,it is neither practical nor meaningful to make portfolio adjustment/hedging decisions at daily frequency due to transaction restrictions and costs.Hence,we focus on monthly frequency in our next empirical tests.In accordance with Badshah et al.(2019),we calculate the monthly correlations based on the daily dynamic conditional correlations derived from the DCCGARCH t-Copula model,taking the average of all daily data within the month.
3.2.Basic regression
Next,to examine the effects of EPU(MPU)on the dynamic dependence relationship between oil,gold and stock markets,we regress the monthly dynamic conditional correlation on the EPU(MPU)respectively.
Firstly,we examine the single effect of EPU(MPU)originating from one country,the US or China,on the correlations of oil-stock and gold-stock as most of the related literature do.The benchmark regression equation is formed as follows:

where corrtis the monthly dynamic conditional correlation between the commodity(OIL or GOLD)and stock(SP500 or SH).PUi,tis the policy uncertainty measure denoting either EPU or MPU index originating from country i={US,CN}.Consisting with Badshah et al.(2019),we included corrt-1to control for autocorrelation.
Furthermore,what distinguishes this paper from other related literature is that we account for the effects of EPU(MPU)originating from the US and China simultaneously.Given that the US and China are the largest developed and developing countries respectively,it's meaningful to figure out the differences between the effects of the US and Chinese policy uncertainty and who plays the more significant role across the market co-movements.For this reason,we extend Eq.(12)to examine the effects of EPU(MPU)originating from the two countries at the same time when controlling for the EPU(MPU)effect from the other country:

3.3.Quantile regression
The OLS approach in Section 2.2 captures how the mean level of the dependent variable changes with the independent variables only.However,researchers may be interested in the heterogenous effects of independent variables on other important quantiles of the conditional distribution of the dependent variable.Following McMillan et al.(2021),we adopt the quantile regression(QR)analysis proposed by Koenker and Bassett(1978)to address this major shortcoming of OLS approach,given its two main advantages:on the one hand,it uncovers a more comprehensive description of the conditional distribution of the dependent variable,providing us more evidences of heterogenous characteristics such as nonlinearity and asymmetry;on the other hand,the estimates of QR approach are robust to outliers,heteroskedasticity and skewness on the dependent variables(Xiao et al.,2019).
The quantile regression model is formed as follows:

where Qyi(τ|x)represents theτ-th(0<τ<1)conditional quantile of yiand x is the vector of independent variables.φ0(τ)captures the unobserved effect,and the estimated coefficientφ1(τ)is derived from Eq.(15):

whereρτ(u)=u(τ-I(u<0))with I(∙)being the indication function.That is,the estimated coefficient is obtained by minimizing the weighted sum of the absolute deviation depending on the given quantile value ofτ.
In order to investigate the heterogenous effects of EPU(MPU)that may exist on the different distributions of market correlations,the corresponding quantile regression models of Eq.(12)(13)are specified as follows:

This paper selects eleven quantiles,namely,τ=(0.05,0.1,0.2,…,0.9,0.95).The eleven quantiles are divided into three correlation regimes,namely low correlation regime(lower quantiles,i.e.,τ=(0.05,0.1,0.2,0.3)),medium correlation regime(middle quantiles,i.e.,τ=(0.4,0.5,0.6))and high correlation regime(upper quantiles,i.e.,τ=(0.7,0.8,0.9,0.95)).Notably,the value of corrtacross various quantiles may change from negative to positive.For instance,given thatτ=0.05 and corrt(0.05)<0,a positive effect of PUi,t(namelyφ2(0.05)>0))implies that higher policy uncertainty comes with weaker negative market correlation(with smaller absolute value).On the other hand,given thatτ=0.95 and corrt(0.95)>0,a positive effect of PUi,t(namelyφ2(0.95)>0))indicates that higher policy uncertainty comes with stronger positive market correlation(with larger absolute value).Similar logical inferences hold for negative effects of PUi,t.
4.Data and preliminary analysis
The current study uses the daily closing prices of the NYMEX WTI crude oil futures,COMEX gold futures,S&P 500 Index and Shanghai Composite Index for the period January 4,2000 to November 30,2020,obtaining from the Choice database.The economic policy uncertainty index including the economic policy uncertainty index and the subcategory monetary policy uncertainty index of the US and China are monthly data.Correspondingly,the overall newspaper-based US economic policy uncertainty index(EPU_US)and the monetary policy uncertainty subindex(MPU_US)are constructed by Baker et al.(2016)based on the top ten newspapers in the US.Davis et al.(2019)uses the same method to construct the Chinese economic policy uncertainty index(EPU_CN)based on 10 major mainland newspapers.These three indicators are all from the website www.policyuncertainty.com.In view of the lack of Chinese monetary policy uncertainty measure on this website,Huang and Luk(2020)propose a monthly index of monetary policy uncertainty for China(MPU_CN)starting from January 2000 based on ten major newspapers in mainland,which proved to be robust and not affected by media bias.This index has been widely adopted by scholars(Zhu et al.,2021;Lyu et al.,2021).Theindexcomesfromthewebsitehttps://economicpolicyuncertaintyinchina.weebly.com/.Fig.1 plots the raw level of all economic policy uncertainty indices.It can be found that the policy uncertainty of the United States and China share the same peak in specific periods,such as the Global Financial Crisis in 2007-2009,the European Debt Crisis in 2011,the election of Trump from December 2016 to January 2017,the China-US Trade Disputes beginning in 2018,especially the period of COVID-19 pandemic.According to comparison of EPU and MPU,we can find that the trends of the two are not exactly the same,indicating that the pure MPU index reflects some exclusive information that is obscured by the generalized EPU index(Mei et al.,2019),so this paper will further consider the specific influence of MPU.
For the stationarity,we take the logarithmic difference of the daily closing prices of crude oil,gold futures and stocks,and take the natural logarithm for the EPU and MPU indices.Table 1 provides the detailed description of the variables used in the paper.The descriptive statistics are reported in Table 2,and the results of ADF test reject the unit root hypothesis at the 10% significance level which indicates that all the series are stationary.Crude oil has the highest standard deviation as well as the maximum and minimum among the four assets,implying that the extreme profits in crude oil market along with largest risks.Gold has the highest average yield and the smallest standard deviation,which is attractive to investors due to the highest Sharpe ratio.All return series present the evidence of non-normality,autocorrelation and heteroscedasticity.Hence,this paper chooses the AR-GARCH model to fit the marginal distributions,and uses a more flexible Copula function to model the correlation of the non-normal series,making the results closer to reality.

Table1 List of variables and abbreviations.

Table2 Descriptive statistics.
5.Empirical results
5.1.Time-varying correlations
The first step is to fit the marginal distribution of each asset.Table 3 reports the parameter estimation of the AR(p)-GARCH(1,1)model,and the lag order of AR(p)is determined by BIC criterion.The degree of freedom parameters v are all significant,justifying the t distribution of the error term.In the GARCH model,the parameters a and b are significant for all series at 1%significance level and such evinces the existence of volatility clustering and persistence effects in WTI crude oil,gold,S&P 500 and Shanghai Composite Index return series.
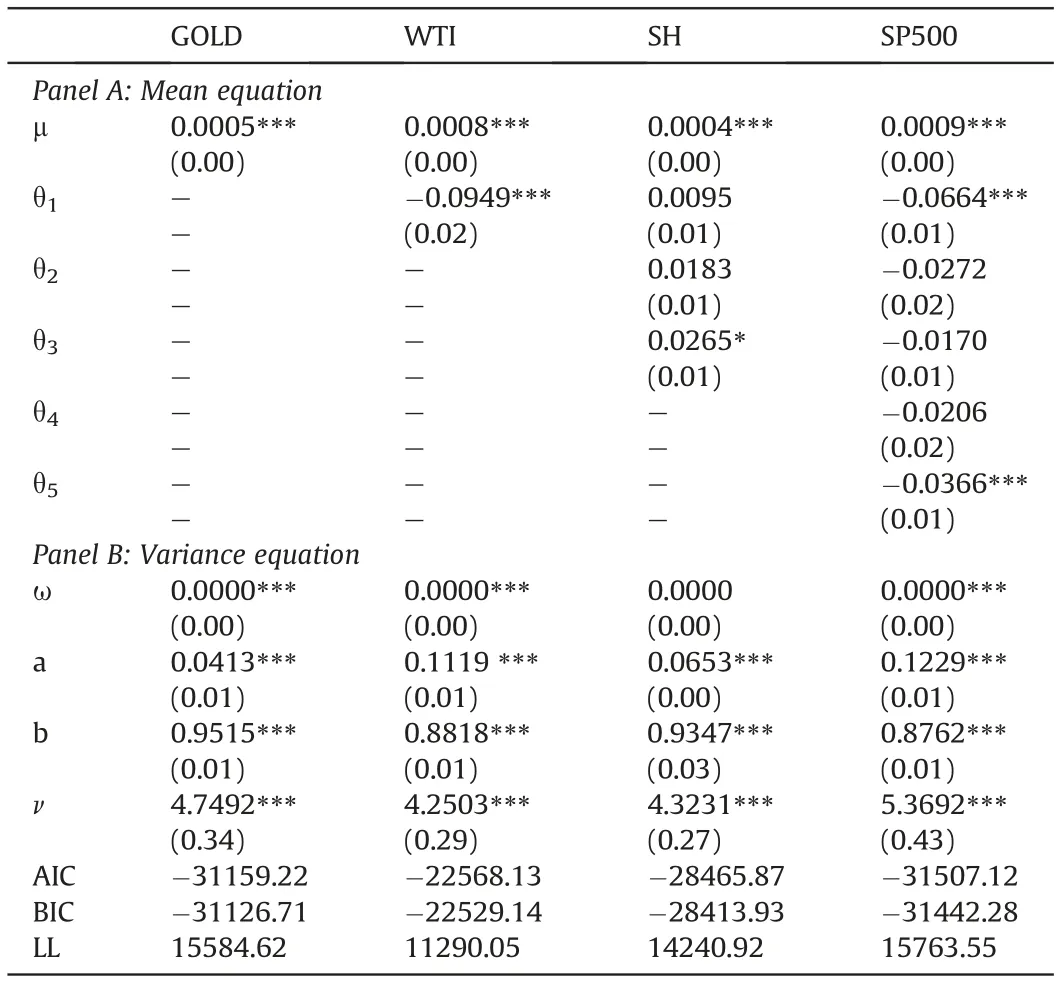
Table3 Estimation of AR(p)-GARCH(1,1)model.
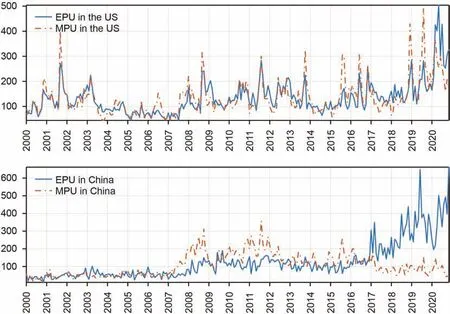
Fig.1.The raw series of EPU and MPU in the US and China from January 2000 to November 2020.
Table 4 reports the parameter estimation results of DCC t-Copula model.The degree of freedomηindicates the probability of joint extreme movements,which provides the evidence of dependence of tail(Berger and Uddin,2016).At the 1%significance level,all the parameters of the degree of freedom of the binary t-Copula function are significant,indicating that the t-Copula function can well describe the dependence structure between asset pairs.Interestingly,the degree of freedom of GOLD(WTI)-SP500 is smaller than GOLD(WTI)-SH,which means the US stock market has the higher tail dependence on crude oil and gold market than Chinese stock market.As for the DCC model parameters,except for the insignificant coefficients a of GOLD-SH and WTI-SH,theαandβof all asset pairs are significant at 1%significance level and the sums ofαandβ are all greater than 0.98,which shows that there is a significant dynamic dependence process between the asset pairs,and the overall persistence is very strong.For a more comprehensive understanding,the descriptive statistics of time-varying correlations are presented in Table 5,and their dynamic evolution paths are plotted in Fig.2.
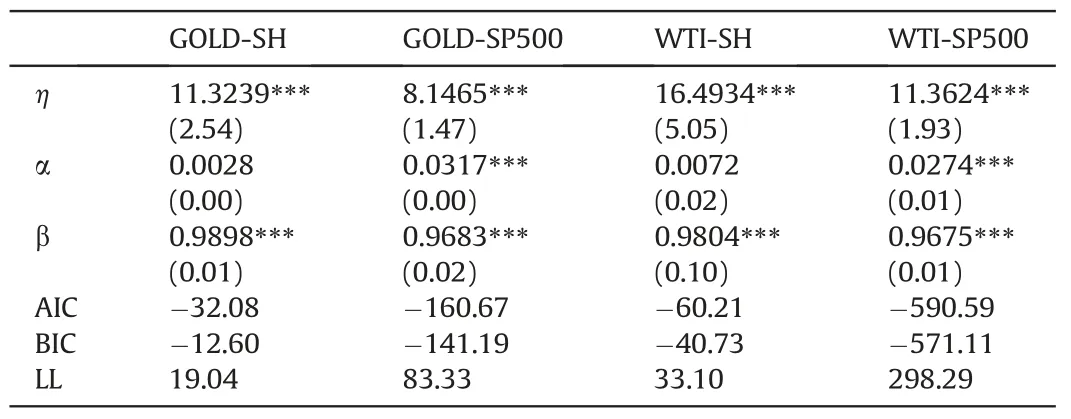
Table4 Estimation of DCC t-Copula model.
As defined by Baur and Lucey(2010),an asset is regarded as a diversifier if it is positively(but not perfectly correlated)with another asset or portfolio on average,or a hedge if it is uncorrelated or negatively correlated with another asset or portfolio on average.As seen from Table 5,the average correlations between GOLD and stocks are lower than that between WTI and stocks,suggesting thatgold serves as a better diversifier than crude oil.Particularly,the hedging property of gold can be found in the smallest and negative(i.e.,-0.0137)average correlation of GOLD-SP500,albeit with the largest standard deviation which means great risk to investors.Considering the negative minimum of WTI-SP500 and WTI-SH correlaions but the positive average of them,we can infer that WTI can only hedge the stock risks in specific periods.Overall,the ability of hedging and diversification of crude oil is second to gold.Comparing the difference between the two stock markets,the averages and volatilities of commodities-SH correlations are smaller than commodities-SP500 correlations.This is consistant with the evidences in Bhatia et al.(2020)and Ahmed and Huo(2021),and provides a practical implication that gold and crude oil are potential investment tools for portfolio investors to diversify the risks in Chinese stock market.In turn,the US stock market is more closely connected with crude oil and gold than Chinese stock market.

Table5 Descriptive statistics of daily dynamic conditional correlations.
It can be intuitively observed from Fig.2 that the evolutions of dynamic conditinal correlation of the asset pairs exhibit significant time-varying characteristics.Most notably,there seems to be a dramatic strctual shift in the dependence between stock and crude oil as wellasgoldmarketsafterSeptember2008,thebankruptcyofLehman Brothers marked the outbreak of the Global Financial Crisis,when the economic policy uncertainty of the US and China increased sharply.During the full-blown period of the crisis(2008.9-2009.2),the correlations of GOLD-SP500 and GOLD-SH experienced a deep drop and kept at the low or even negative level subsequently,while the correlations of WTI-SP500 and WTI-SH rose sharply to a higher level above zero after a drop.Such fact suggests that as stocks falled in the crisis,the price of crude oil almostly fell at the same time but the gold price was tended to move in the opposite directions,which is consistant with the evidence documented by Junttila et al.(2018)and supports the safe haven properties of gold but not for oil.Such opposite performances between crude oil-stock and gold-stock correlations also exist around the January 2020,when the economic policy uncertainty of both the US and China started to increase as the COVID-19 pandemic outbreak.Intutively,we would argue that the impact of EPU on the correlations of oil-stock and gold-stock may be heterogeneous,which remains to be investigated in next section.
5.2.The effect of EPU on time-varying correlations
In terms of practical feasibility for investors,it is neither meaningful nor practical to make portfolio adjustments on a daily basis considering the transaction costs and constraints.Therefore,this section will focus on the effect of EPU and MPU on the correlations on a monthly basis.In accordance with Badshah et al.(2019),we calculate the monthly correlations by taking the average of the estimated daily correlation series within the month.In order to make the regression analysis of the correlations more efficient,Fisher's z-transformation is applied to ensure the correlations within[-1,1].Based on the transformed correlation series,we adopt the OLS regression and QR approach to investigate the EPU and MPU effects on the mean level and across different quantiles.The monthly dynamic conditional correlations in different quantiles are presented in Table 6.
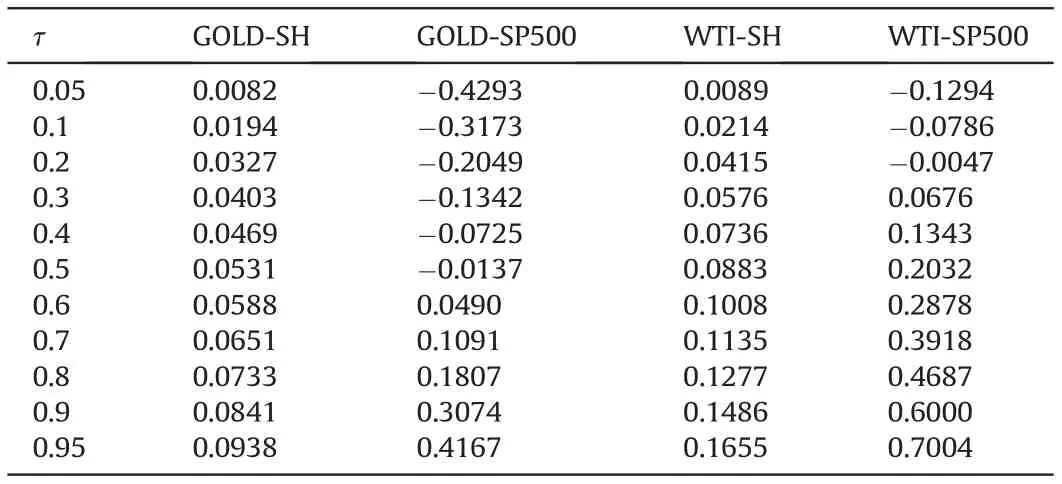
Table6 Quantiles of monthly dynamic conditional correlations.
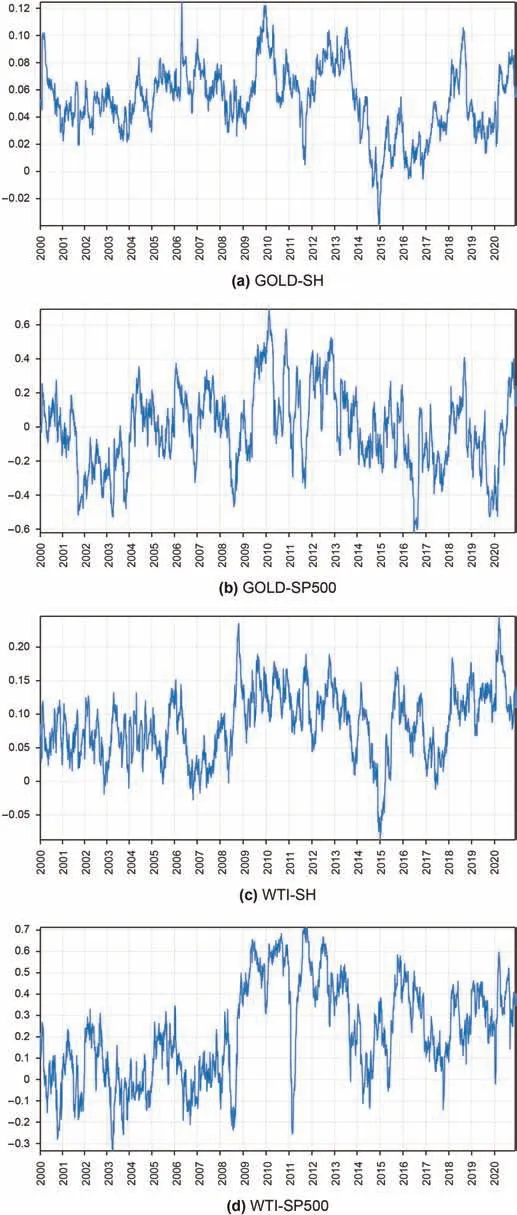
Fig.2.Daily dynamic conditional correlations of gold-,oil-and stocks.
Table 7 presents the results for Eqs.(12)and(16)with one single policy uncertainty index at a time,and Table 8 reports the results for Eqs.(13)and(17)with both the policy uncertainty index originating from the US and China simultaneously,which control the influence of EPU(MPU)in another country to compare the relativestrength and significance level of the EPU(MPU)effect between the US and China.The VIF factors of the variables in the regression model are all less than 2,supporting no multicollinearity.Fig.3 plots the impact of EPU(MPU)on time-varying correlations across different quantiles and 95% confidence intervals of EPU(MPU)based on Eq.(17).A comparison of Tables 7 and 8 shows that,except for the effect of EPU_CN on the WTI-SP500 correlation completely disappeared after controlling for EPU_US,other results basically remain the same,which indicates the effect of single country's EPU(MPU)are robust.The following analysis are based on Table 8 given the robust results.
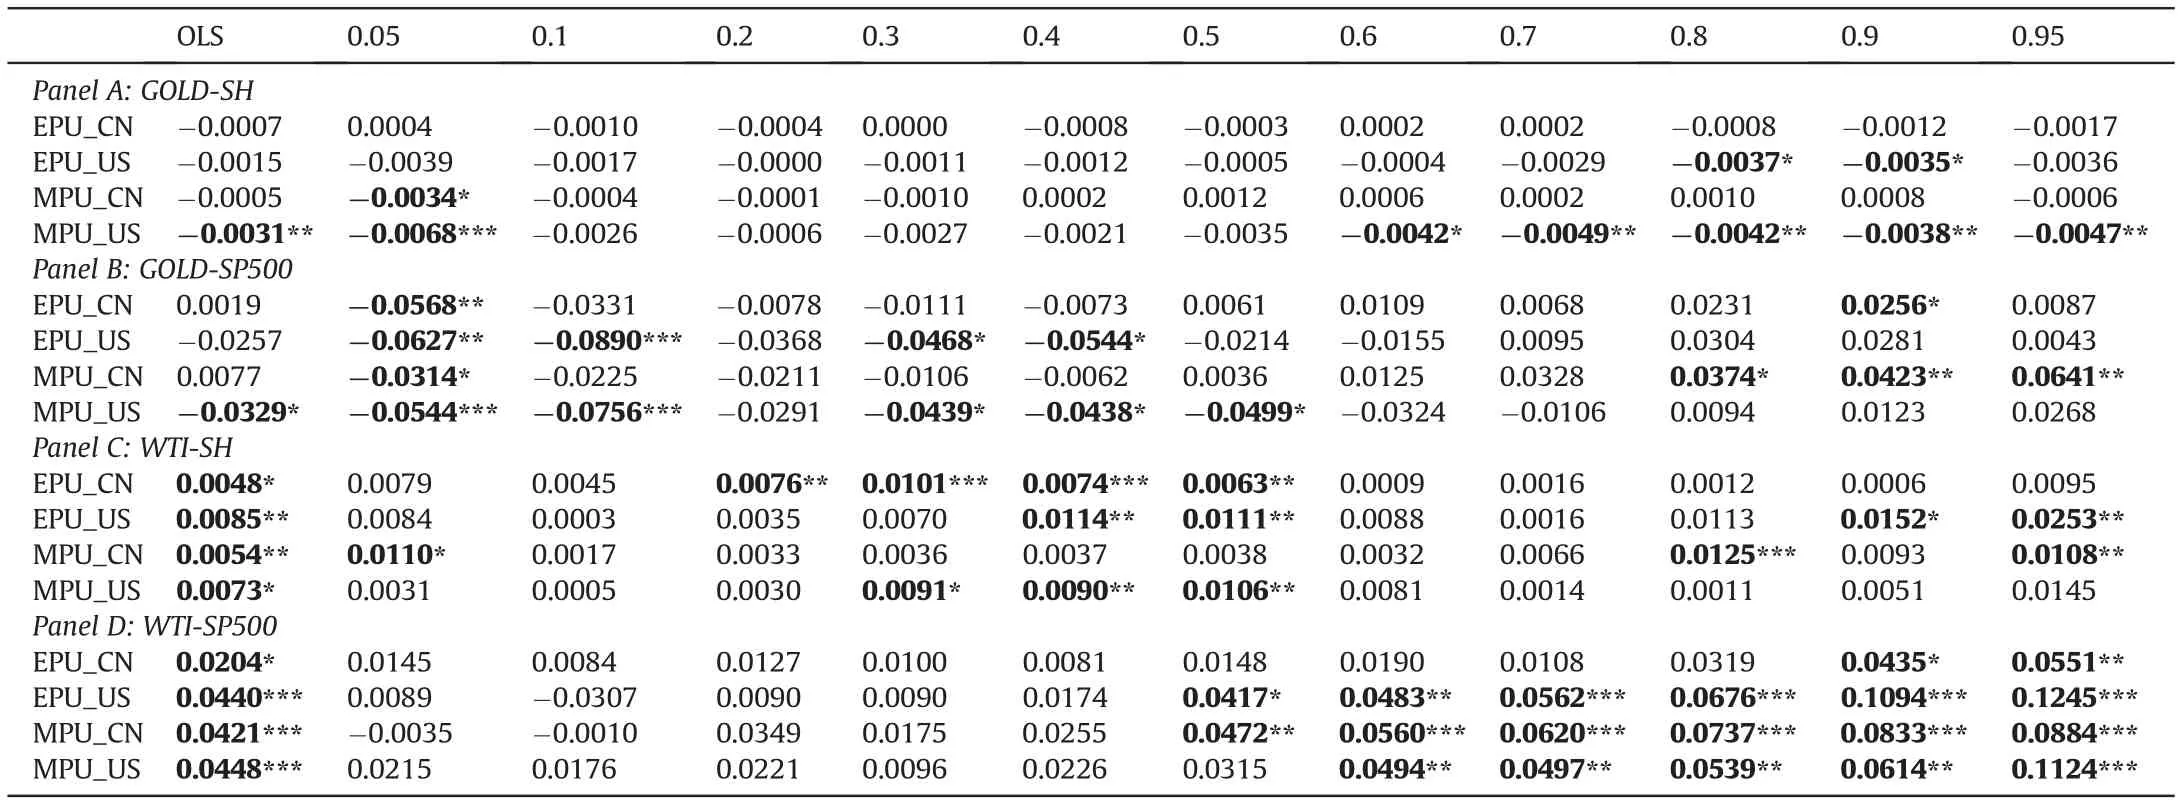
Table7 Estimation for the single effect of policy uncertainty in the US or China.
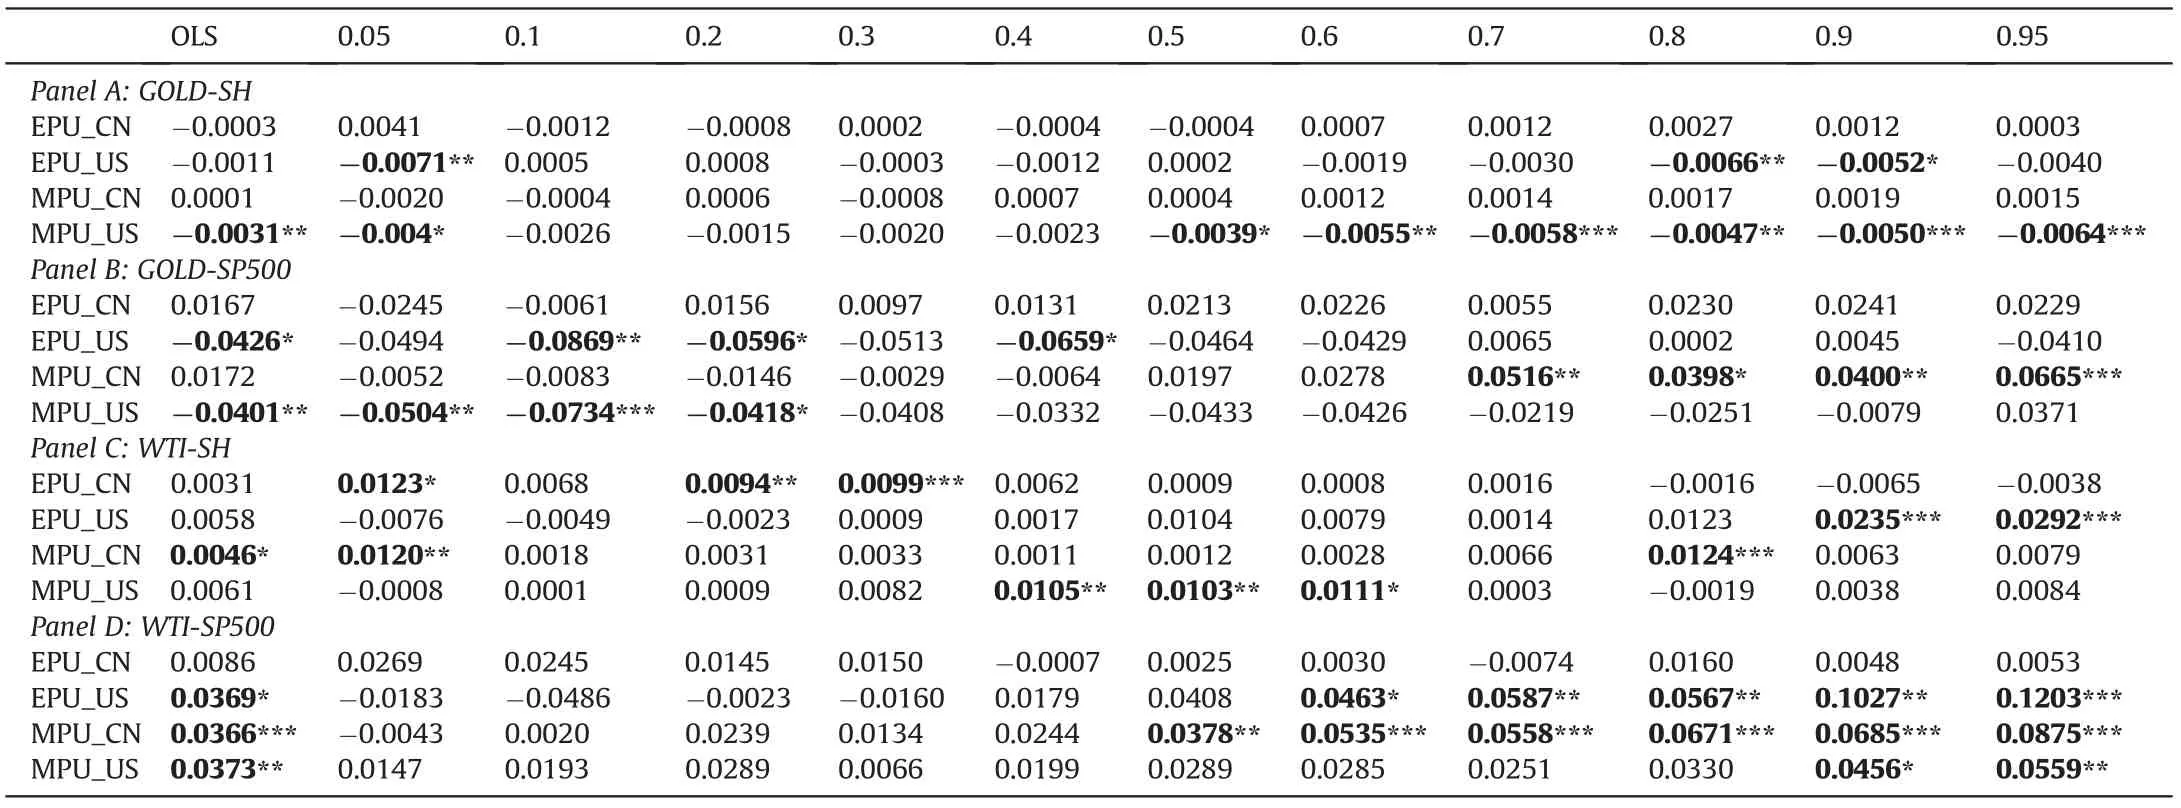
Table8 Estimation for the simultaneous effects of policy uncertainty in the US or China.
5.2.1.Do the“US impact”and“China impact”have the same performance?
The first issue we aim to address is whether the EPU(MPU)originating from China has a significant impact on cross-assets correlations and how“China impact”differs from“US impact”.Indicated by the contrast of the impact of EPU(MPU)originating from the US and China,we can observe that“US impact”prevails among the time-varying correlations of oil-stock and gold-stock,while“China impact”is beginning to appear on the oil-stock correlations.Although MPU and EPU have similar results,it is undeniable that MPU is more significant,especially the MPU of the US Federal Reserve.It confirms the importance of global financial cycle channel,which leads to volatility interactions across different financial markets via its effects on global liquidity conditions and changes in investors'risk preferences(Albulescu et al.,2019).
Put concretely,combining the results of Tables 7 and 8,it can be found that the US EPU(MPU)not only has a stable and significant impact on the correlation between domestic stock(SP500)and commodities(GOLD and OIL),but also on correlations between Chinese stock(SH)and commodities,even with the control of“China impact”.In terms of the impact intensity,the“US impact”is stronger on the correlations between the domestic stock market and the commodities.The evidences of widespread“US impact”found in this paper are confirmed by the existing studies in terms of global markets(Agnello et al.,2020;Qin et al.,2020)and stock markets correlations(Li and Peng,2017).Closer to our research,Zhang et al.(2019)investigate the impact of the EPU in China and the US on the global markets and find that although China has become more influential,the US's dominant position still holds in all the markets.Our research makes an important supplement to the research of Zhang et al.(2019)from the perspective of EPU impact on market correlations.Additionally,among the four asset pairs,the correlations between gold and stocks are almost driven by“US impact”.This is because there is a general negative correlation between the US dollar and gold price(He et al.,2020),andthe value of the US dollar is closely related to the performance of economy and related economic policies in the US,especially Fed's monetary policy,which explains that the dominant role of the US policy uncertainty in time-varying correlations between gold and stocks.
However,the weak impact of Chinese EPU(MPU)on gold-stock correlations shown in Table 7 almost disappears with the control of“US impact”in Table 8,whereas the impact on oil-stocks correlations in quantiles remains to be robust,except for the EPU_CN impact on WTI-SP500.This underlines that investors should not ignore the“China impact”in the international market,which mainly exists in the connection between oil and stock markets.It could be explained through the macro fundamentals channel.With the slow penetration of NGFE and RE due to price regulation and ineffective subsidy policies(Zhu et al.,2017),China's oil consumption accounted for 18.9%of total primary energy consumption by the end of 2018,secondly only to coal(Chen et al.,2020).As the world's second largest economy and the world's largest importer of crude oil,there have been sound evidences showing that China's economic activities,financial markets,and economic policies have extended their impacts to the world profoundly,including energy and other commodities(Ratti and Vespignani,2013;Ji and Zhang,2019),macro economy of developed economies such as the United States and the Eurozone(Vespignani,2015;Fontaine et al.,2017;Lombardi et al.,2018),and global stock markets(Zhou et al.,2012;Tsai,2017).Therefore,the uncertainty of Chinese economic policy will exert the positive influence on the oil-stock correlations,by exerting significant influences on the common macro-fundamentals,such as the production demand,in the crude oil market,the domestic and foreign stock markets simultaneously.
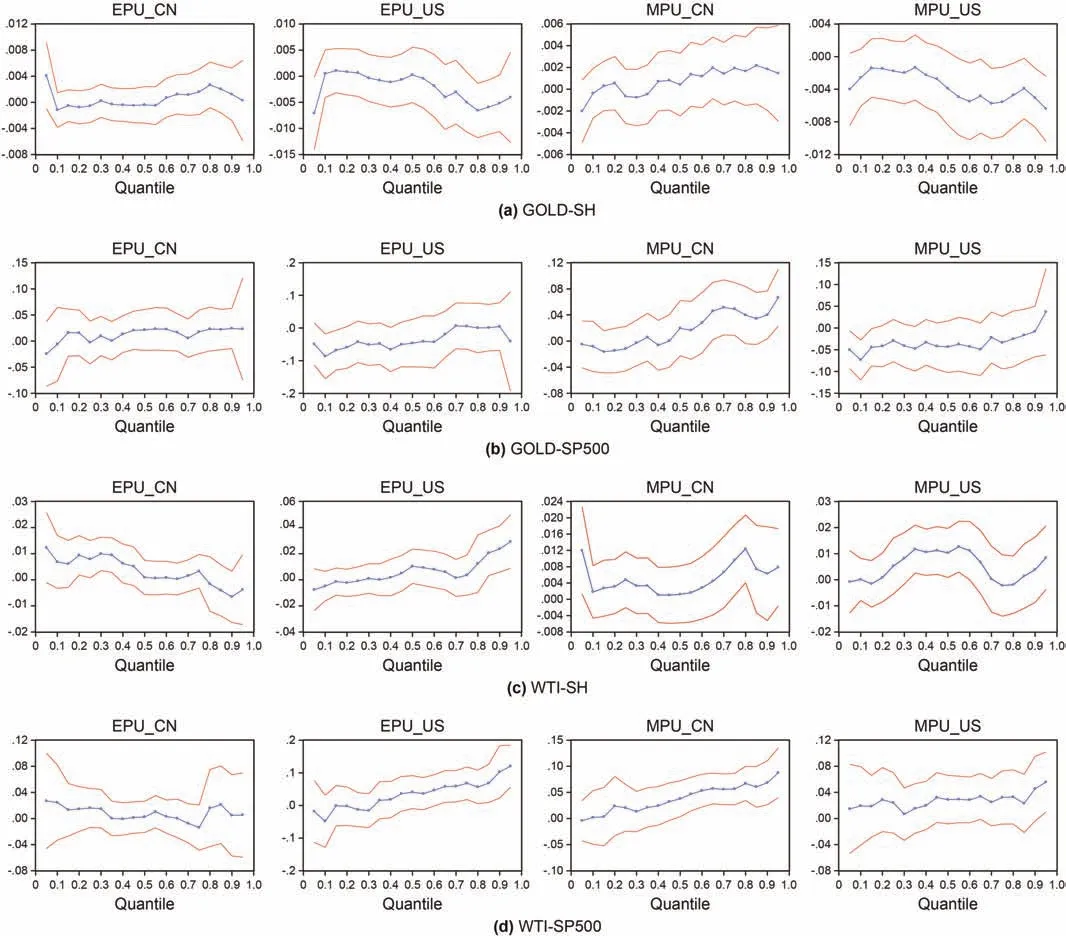
Fig.3.Quantile estimates based on Eq.(17)Notes:The plot shows the effects of EPU(MPU)originated from the two countries on the time-varying correlations at the same time when controlling for the EPU(MPU)effect from the other country.The blue solid line with circles denotes the point estimates and the two solid red lines present the 95% confidence bands.
5.2.2.Does EPU(MPU)affect the correlations of all asset pairs alike?
The next important issue of this paper is to investigate how EPU(MPU)affects different cross-asset correlations.We find some evidences of the heterogeneity in the direction of EPU effects on correlations of different asset pairs,and the results of MPU are basically the same as EPU.It is clearly shown in Table 8 that EPU presents a negative impact on gold-stock correlations but a positive impact in terms of crude oil-stock correlations at both the level of mean(OLS)and quantiles(QR).This finding has direct implications for portfolio decisions and risk management.Theoretically,if the coefficient of EPU is significantly negative,the higher level of economic policy uncertainty will weaken the positive correlation between the commodity and stock,or strengthen the negative correlation of them,both indicating that the commodity has a better ability to diversify(or hedge)stock risks during the period of rising EPU.Otherwise,the positive effect of EPU implies that higher level of economic policy uncertainty will strengthen the positive correlation or weaken the negative correlation of them,both suggesting that the diversification or hedging property of the commodity will get worse with the level of EPU rising.Accordingly,the negative effect of EPU on gold-stock correlations infers that when the uncertainty of economic policy climbs,risk-averse investors will tend to flee from risky assets(such as stocks)to safer assets(such as gold here),consequently reducing the correlation between gold and stocks to negative.This is in line with the“flight-toquality”phenomenon.
Quite the opposite,the estimated coefficients of EPU for the correlation between crude oil and stocks are significantly positive,which means that in the case of rising economic(monetary)policy uncertainty(such as during the global financial crisis in 2008),crude oil tends to have a stronger positive linkage with stocks,thus weakening the ability of crude oil to diversify the stock risks.This is due to the fact that crude oil is closely related to industrial production.The increase of EPU level can raise the cost of capital and delay both firm investment and projects(Jeong,2002).Such reduction of industrial production will exert a negative impact on stock performance and crude oil demand,causing both markets to fall at the same time.Taken together,gold can serve as the better diversifier or hedge against stock volatility than crude oil during the period of high EPU,consistent with Junttila et al.(2018)that the correlation between crude oil futures and aggregate US equities increases in crisis periods,whereas in case of gold futures the correlation becomes negative.
5.2.3.How does EPU(MPU)affect time-varying correlations across different regimes?
Adekoya and Oliyide(2021)suggest that both financial and commodity markets tend to be fraught with frequent external shocks which result into nonlinear relationships as well as regime changes in their series.Benefit from the QR approach,it is possible to examine the heterogenous characteristics of EPU(MPU)effects,such as the nonlinearity and asymmetry across different market correlation regimes.
We can generally observe that GOLD-SH correlation is only significantly negatively affected by the US EPU at the extreme low quantile(τ=0.05)and the medium and high correlation regimes.Regarding the correlation of GOLD-SP500,the negative impact of US EPU mainly exists in the low correlation regime.It means that the US EPU mainly have a significant negative impact when SP500 and GOLD are negatively correlated(as shown in Table 6),thereby further strengthening the hedging property of gold.This might be explained that when the correlations of gold-stock are in the low correlation regime,the hedge or diversification value of gold is more prominent.In this case,the increase of EPU will further motivate investors to buy more gold and sell the risky stocks,resulting in“flight-to-quality”phenomenon.
However,the situation is quite different in terms of oil-stock correlations.We find that the significant positive effects of EPU on the connectedness between crude oil and stock markets are mainly concentrated at the medium and high correlation regimes and tend to be stronger at higher quantiles(with one exception for EPU_CN)as depicted in Fig.3.It can be inferred that when crude oil and the stock market are closely linked,rising economic policy uncertainty will further reinforce the positive correlation between the two markets,consequently weakening the risk diversification ability of crude oil.This is in line with Filis et al.(2011)who conclude that the oil market is not a“safe haven”for offering protection against stock market losses in periods of significant economic turmoil,when the price of oil would follow the decline of stock prices.
The impact of MPU is almost similar to that of EPU.It is worth noting that MPU_CN has a significant positive impact on GOLDSP500 at upper quantiles,indicating that the increase in Chinese MPU will further enhance the connection between gold and the US stock market,which is already in a high correlation regime.In fact,this phenomenon implies that the role of gold as a hedge is not stable.Many scholars have also found the same evidence.For example,Hood and Malik(2013)document a positive correlation between gold and S&P 500 in some periods of high volatility(including the 2008 financial crisis).Lucey and Li(2015)find that the hedging property of gold is time-varying.In some specific periods,silver,platinum and palladium act as a safe haven when gold does not.Choudhry et al.(2015)examine the spillover effect of gold and the stock market and further point out that the disappearance of the hedging property of gold during the crisis is due to the bidirectional interdependence between gold returns,and stock returns as well as stock market volatility.Moreover,MPU_CN has a more significant impact on the correlation between crude oil and stocks than EPU_CN.This is because monetary policies have a closer relationship with interest rate,which is a key factor in asset prices.
5.2.4.Slope equality tests
As the supplementary test for the heterogeneity across different correlation regimes,we would examine whether the significant impacts of EPU(MPU)at certain quantiles are different from the insignificant ones at the other quantiles with the Wald test.As stated in Section 3,τ=(0.05,0.1,0.2,0.3)denotes low correlation regime,τ=(0.4,0.5,0.6)denotes medium correlation regime,and τ=(0.7,0.8,0.9,0.95)denotes high correlation regime.We conduct the Wald test with two quantile coefficients which belongs to two different regimes respectively to examine the slope equality.
To save space,the test results are not reported here.Generally,the negative effects of the US EPU and MPU are homogeneous no matter what correlation regimes the gold and Chinese stock market are in,albeit only significant at certain quantiles.However,EPU and MPU have a significant positive impact on oil-stock market correlations in the medium or high correlation regime and tends to be stronger at higher quantiles,which exhibits the significant property of heterogeneity.
6.Conclusions
Since the Global Financial Crisis,there have been increasing concerns about uncertainty of policy related to economic policies and monetary decisions.Despite numerous subsequent works provide sound evidence for the impact of EPU on the macro economy and financial markets,few studies have investigated the impact on market correlations.In this study,we apply the DCCGARCH t-Copula model to describe the dynamic conditional correlations of crude oil-,gold-and stock markets in the US and China,and then adopt the OLS and QR approach to investigate the impact of EPU(MPU)originating from the US and China on both the mean level and different quantiles.This paper makes several important contributions to the existing few literatures that mainly focus on the US EPU's effect on financial market correlations.First,we also examine the EPU effect originating from China on financial market correlations to complement previous literature and make a comparison with the effect of the US EPU.Second,this paper specifically considers the impact of MPU,an important subcategory within EPU that may exert more significant influence on the correlations of oil-,gold-,and stock markets.And the use of generalized EPU index may confuse the specific information of MPU.Third,given that the existing studies mainly research the EPU impact from the traditional linear framework,we provide a novel sight by the use of QR approach to explore the possible heterogeneity of the EPU(MPU)'s impact on market correlations under different correlation regimes.Our findings are fourfold.
Firstly,there is a significant dynamic conditional correlation with strong persistence for each asset pair.On average,the correlations of oil-stock are positive and greater than that of gold-stock,indicating that although oil can hedge stock risks during several certain periods,the hedging and diversification abilities are second to gold on the whole.The US stock market is more closely linked with crude oil and gold markets than Chinese stock market.Moreover,all market correlations exhibit time-varying characteristics and experienced an enormous shift during the full-blown period of the Global Financial Crisis(2008.9-2009.2).
Secondly,by comparing the influence of EPU(MPU)with different origins,it can be found that the“US impact”widely exists across all market correlations in the sample,and“China impact”is beginning to appear in oil-stock correlations.MPU exhibits more significant results than EPU,especially the MPU for the US Federal Reserve.
Thirdly,the impacts of EPU(MPU)on correlations of different asset pairs exhibit some evidences of heterogeneity in direction.EPU has negative effects on gold-stock correlations,which is consistent with the“flight-to-quality”phenomenon.However,a positive effect is observed in case of crude oil-stock correlations,and one argument can be made is that crude oil is closely related to industrial production thus shares some common macrofundamentals with stock markets.Such findings underscore that gold can provide a better diversification or hedge for stock market risks than crude oil during the period of high level of economic policy uncertainty.
Fourthly,the impacts of EPU(MPU)on gold-stock correlations basically present a homogenous negative impact across various correlation regimes with few exceptions,while the distribution heterogeneity is observed in terms of oil-stock correlations.That is,the EPU(MPU)exhibits a more significant and stronger positive impact when oil and stock markets are in medium or high correlation regime.The impact of MPU is similar to that of EPU,but Chinese MPU has a positive impact on the correlation between gold and S&P 500.It is worth to be noticed that the hedging and safe haven properties of gold are not stable as some studies discovered(Hood and Malik,2013;Lucey and Li,2015;Choudhry et al.,2015).Meanwhile,compared to EPU in China,the subindex MPU has a more significant impact on the correlation between oil and stocks as monetary policies have implications on the level of interest rate,which is an important determinant of asset prices.All evidences above manifest the specific information contained in MPU could be confused by the broader measure,EPU.
In summary,the findings of this paper reaffirm the important role of the US EPU and MPU on financial market correlations and the heterogeneity of the impact.And more importantly,we uncover the pronounced impact of uncertainty induced by Chinese economic policies on oil-stock market correlations for the first time.For the practice of investors and portfolio managers,gold can serve as a better diversifier and hedge against the stock risks induced by high economic uncertainty than crude oil,but the instability in diversification and hedging properties of gold should not be ignored.It also has important enlightenments for governments to prevent cross-market risks when making economic policy decisions.
- Petroleum Science的其它文章
- Sedimentary characteristics and implications for hydrocarbon exploration in a retrograding shallow-water delta:An example from the fourth member of the Cretaceous Quantou Formation in the Sanzhao depression,Songliao Basin,NE China
- Study of the gas sources of the Ordovician gas reservoir in the Central-Eastern Ordos Basin
- A novel hybrid thermodynamic model for pore size distribution characterisation for shale
- Microstructural analysis of organic matter in shale by SAXS and WAXS methods
- Investigation of oil and water migrations in lacustrine oil shales using 20 MHz 2D NMR relaxometry techniques
- Fast least-squares prestack time migration via accelerating the explicit calculation of Hessian matrix with dip-angle Fresnel zone

