Analysis of imbibition of n-alkanes in kerogen slits by molecular dynamics simulation for characterization of shale oil rocks
Qian Sang ,Xin-Yi Zhao ,Hui-Min Liu ,Ming-Zhe Dong ,d
a Key Laboratory of Unconventional Oil & Gas Development(China University of Petroleum(East China)),Ministry of Education,Qingdao,266580,Shandong,China
b School of Petroleum Engineering,China University of Petroleum(East China),Qingdao,266580,Shandong,China
c Management Center of Oil & Gas Exploration of Shengli Oilfield Branch Company,SINOPEC,Dongying,257001,Shandong,China
d Department of Chemical and Petroleum Engineering,University of Calgary,Calgary,AB,Canada,T2N 1N4
Keywords:
ABSTRACT
1.Introduction
With growing attention to unconventional energy sources,especially shale gas and shale oil reservoirs,transport phenomena in shale oil and gas reservoirs have become the hot fields of oil and gas flow research in porous media.The understanding of flow and production mechanisms in shale oil reservoirs is still at its preliminary stage due to the lack of the storage features and methods to determine them for shale rock samples.This is because that shale oil formations contain both inorganic and organic media(Hunt and Jamieson,1956).The organic matter has much smaller pores in it than in inorganic material and holds both free oil in the pores and dissolved oil within the kerogen molecules(Sang et al.,2018).
To determine the storage capacity of shale oil rocks,researchers commonly break the rock samples into blocks(1-2 cm in diameter)and extract them by using mixtures of dichloromethane and ethanol for several days.After the above extraction procedure,the samples are dried at about 100˚C for several days to remove the solvents remained in the samples.The dried samples then are ready for tests to determine the storage capacity and flow properties.It has been found that the oil volume which can be imbibed into the organic matter is larger than the organic pore volume determined by using the helium porosity method(Sang et al.,2018).Therefore,in the procedure of restoring the organic oil saturations in the organic matter by vacuum imbibition method,the oil flow in the organic pores and diffusion into the surrounding organic walls are always coupled together.The same coupling transport process also applies to the production process in which oil flows out through the organic pores coupled with the diffusion of the dissolved oil from the surrounding organic walls.
The dynamic imbibition process and the results provide useful data for determining the organic porosity and permeability of shale oil formations.Due to the flow in pores and diffusion in kerogen are coupled together,Li et al.(2019a)proposed a numerical method considering both flow and diffusion to match the measured oil and water imbibition curves.Their numerical analysis showed that the organic permeability is two to three orders smaller than the inorganic permeability and the average pore size in the organic matter is in the order of nanometers.Since it is not possible to separate the diffusion from the flow,there exists uncertainties in assuming the parameters for flow in pores and diffusion in kerogen.Therefore,it is very important to further study the flow of hydrocarbons in the organic pores under imbibition conditions.To do this in nano-scale,molecular dynamic simulation is a powerful and suitable method.
Numerous studies have been conducted to report novel phenomena in nanopores,including the adsorption behavior(Yang et al.,2020),the critical point shift(Luo et al.,2016),the interfacial physical property oscillating(Kou et al.,2014),and the boundary slip(Whitby et al.,2008;Firouzi and Wilcox,2013;Obliger et al.,2016).The pressure-driven molecular flow in nanopipes or nanochannels has been extensively studied by and MD simulations(Thomas et al.,2010;Sam et al.,2018;Li et al.,2019c).In previous studies,carbon nanotubes(CNTs)and graphene were commonly used as the nanochannels to analyze molecular transportation(Wang et al.,2016a;Li et al.,2019b).Depending on the difference in geographic origin,sedimentary history,and maturity,kerogen exhibits a series of chemical compositions,densities,porosities,and so on(Okiongbo et al.,2005;Bousige et al.,2016).Therefore,the extremely smooth walls and pure carbon atoms of CNTs and graphene slits of such models can overestimate the adsorbing capacity and slippage of hydrocarbons.Previous studies have been undertaken to characterize and reconstruct the molecular models for kerogen by nuclear magnetic resonance(NMR)(Lille et al.,2003),X-ray photoelectron spectroscopy(Kelemen et al.,2007),and molecular dynamics-hybrid reverse Monte Carlo(MD-HRMC)reconstruction method(Ungerer et al.,2015;Bousige et al.,2016).Adsorption of shale oil in kerogen slits(Yang et al.,2020)and pressure-driven alkane transport in kerogen-like nanoporous material(Falk et al.,2015)have been studied using MD simulations.Because of the difference in the molecular weight and its affinity with the kerogen wall,the light and heavy components of shale oil are heterogeneously distributed in the kerogen slits,which leads to the variation in the production of light oil and heavy oil(Yang et al.,2020).The pressure-driven transport simulation results show that the flow velocity of n-alkanes in the kerogen-like nanoporous material depends linearly on the pressure gradient,but the permeability is dependent on both the fluid type and the amount of adsorption(Falk et al.,2015).The velocity of fluid molecules in nanopores exceeds the predicted value of no-slip Poiseuille flow by several orders of magnitude(Majumder et al.,2005;Holt et al.,2006).Slip boundary conditions are widely adopted to explain the abnormal transportation of fluids in nanochannels(Joseph and Aluru,2008;Thomas and McGaughey,2008;Thomas et al.,2010;Wang et al.,2016b).The possible reason for this result is that in these MD simulations,the driving force imposed on molecules to sustain a flow was about 10-12N,corresponding to a pressure gradient of about 107GPa/m(Falk et al.,2015),which is far greater than that in a reservoir during oil production.Therefore,it is also important to perform MD studies for imbibition flow under reasonable pressure gradient to see what flow rules apply to flow in nano-pores in actual reservoir conditions.The driving force for imbibition into organic pores is the pressure drop across the wetting/non-wetting fluid interface.According to previous imbibition studies in other materials(Lucas,1918;Washburn,1921;Martic et al.,2002,2004,2005;Supple and Quirke,2003,2004,2005;Hou et al.,2020),the wettability of kerogen and the interaction between kerogen and n-alkane molecules,which are important to the accumulation and production of shale oil,can also be revealed.
In this paper,we consider the imbibition processes related to the penetration of n-alkane in nanoscale slits in a shale formation.We constructed a slit between two kerogen matrices and studied the distribution and molecular transport behavior of n-alkane molecules in the kerogen slit.We examined the effects of n-alkane length,n-alkane ratio,slit width,and temperature on the penetration distance and density distribution of n-alkanes in the kerogen slit.The dynamic contact angle and the molecular conformations changes with n-alkane length,slit width,and temperature were analyzed to reveal the underlying mechanisms and factors of imbibition flow.
2.Simulation method
MD simulations were performed using the Material Studio 7.0 package from Accelrys Inc.The kerogen and n-alkane models were constructed by the Visualizer Tools module,and the initial models of the kerogen slit/n-alkane system were built by the Amorphous Cell.The Forcite module was used to perform MD simulations.COMPASS II force field(Sun et al.,2016)was used in the simulations,which is applied to most organic and inorganic molecules(Sun et al.,1998;Sang et al.,2021).
2.1.Molecular models
Kerogen can be characterized as three distinct types(designated Type I,Type II,and Type III)(Tissot et al.,1974).The Type I kerogen monomer proposed by Ru et al.(2012)was used to construct the kerogen slit.The chemical formula of the kerogen monomer is C243H432O25N3S2(Fig.1(a)).Each kerogen matrix was constructed with six kerogen monomers.The three kerogen monomers were loaded in a periodic box,and were optimized using Geometry Optimization task to minimize the system energy.Then,an NVT ensemble simulation was performed for 1 ns to get a relaxed structure.After that,an NPT ensemble simulation with 40 MPa and 393.15 K was performed for 1 ns to get the equilibrium structure of the kerogen slit.The values of pressure and temperature are in the range of those in a real shale oil formation.The kerogen slit models were constructed with two kerogen matrixes as shown in Fig.1(b).The pore size distribution within the kerogen matrix was calculated by the method presented in previous research(Bhattacharya and Gubbins,2006).As shown in Fig.2,the pore size distribution within the kerogen matrix is mainly less than 3Å.The hydrocarbon composition of shale oil includes C1to C30+(Sun et al.,2000;Ru et al.,2012).Thus,n-dodecane(Fig.1(c),n-C12),eicosane(Fig.1(d),n-C20),triacontane(Fig.1(e),n-C30),and alkane mixtures were selected as a fluid to obtain the molecular penetration driven by the capillary force.
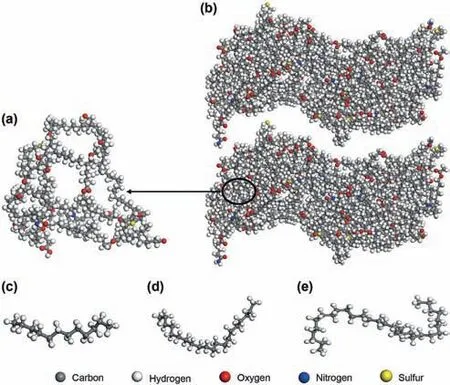
Fig.1.Molecular models of:(a)kerogen monomers;(b)kerogen slit;(c)n-C12;(d)n-C20;(e)n-C30.
2.2.Simulation details
A periodic unit cell was constructed as shown in Fig.3.The dimensions of the simulation box are 14.9×8.5×2.5 nm3.Each component in the systems is depicted by different colors:graykerogen slit,red-n-C12.The kerogen matrices were first packed in both sides of the box with periodic boundary along the y direction,and the apertures of slit were controlled at 1,3,and 6 nm.The n-C12molecules(Fig.1(e))were placed into another periodic box,and are optimized using Geometry Optimization task to minimize the system energy.The NVT ensemble was taken for 1 ns with a time step of 1 fs to get the relaxed structure of n-C12system.Then,the NPT ensemble with 0.1 MPa and 393.15 K was performed for 1 ns with a time step of 1 fs to obtain the equilibrium structure of n-C12.Then,the box of n-C12and the box of kerogen slit were combined together.The structure of kerogen slit/n-C12was shown in Fig.3.
In all MD simulations,a Nose-Hoover-Langevin thermostat and a Berendsen barostat were applied to control the temperature and pressure of all systems,respectively.The van der Waals interactions were calculated by the atomic-based summation with a cutoff distance of 15.5Å.The electrostatic interactions were calculated by the Ewald summation method.In the simulation of the vacuumimbibition process,a 1000 ps NVT simulation with a time step of 1 fs at a specific temperature was performed.Based on this procedure,the kerogen slit/n-C20,kerogen/n-C30,and kerogen/alkane mixture systems were built to compare the mobility of alkane with different chain lengths.A series of temperatures were selected to compare the mobility of alkane with different temperatures.The numbers and densities of molecules in each system are shown in Table 1.
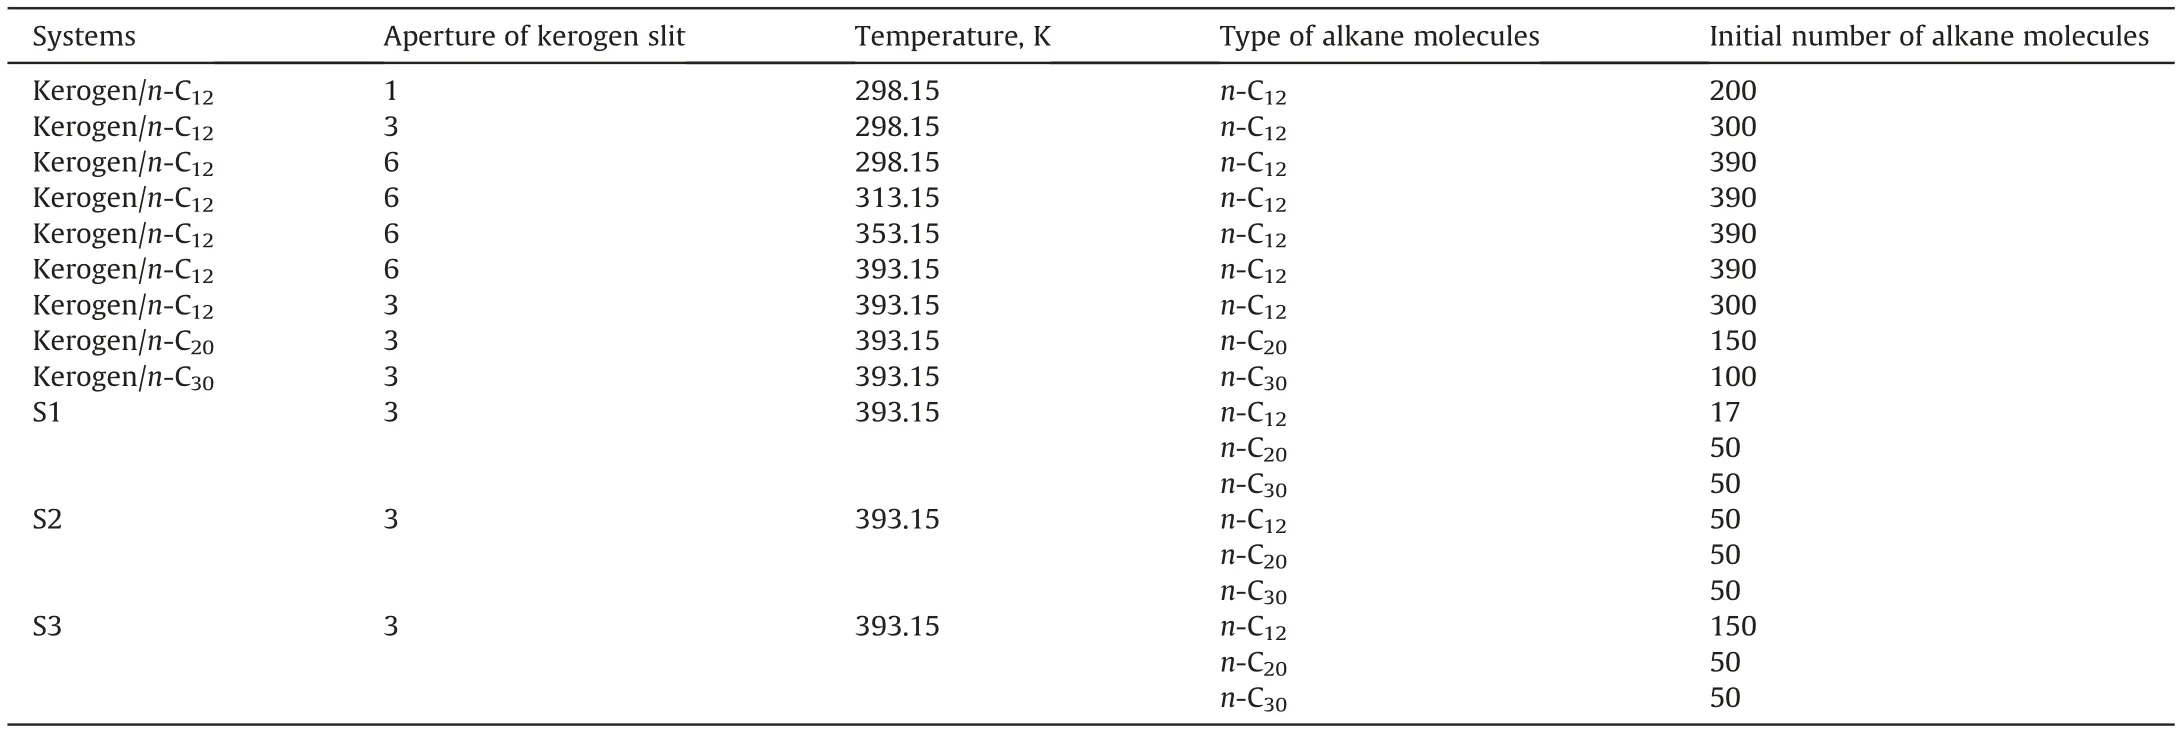
Table1 Numbers and densities of molecules in imbibition simulations.
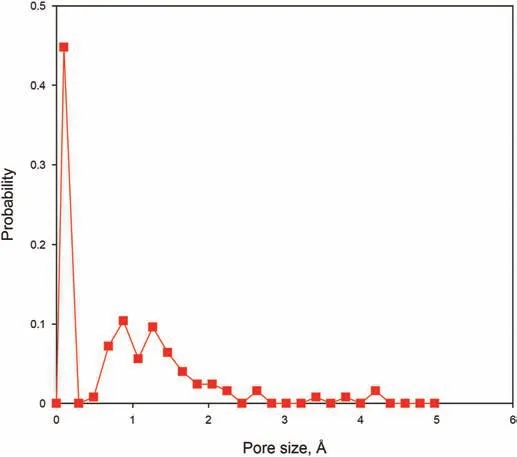
Fig.2.Pore size distribution of kerogen matrix.
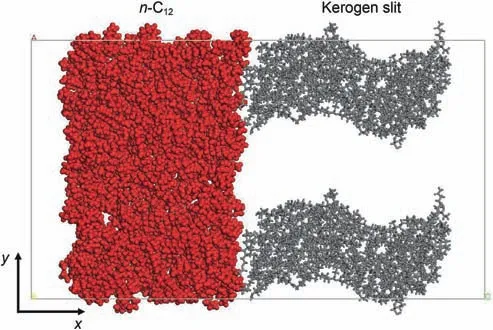
Fig.3.Snapshots of initial structures of kerogen slit with n-C12.The red balls represent n-C12 molecules.The gray sticks represent kerogen slit.
3.Results and discussion
In this section we present results for the imbibition dynamics of kerogen slits.The wetting is characterized by monitoring the location of the alkane-vacuum interface,which was then used in the analysis of dynamic contact angle,density distribution,and structures of alkane in the slits.We ran the simulations five times for each case independently to improve the accuracy and to make general predictions.
3.1.Penetration of n-alkane(n-C12)in kerogen slit with different widths
Fig.4 shows the progressive imbibition for the n-C12molecules into the kerogen slits during 1 ns.The simulations show that for the 6 nm and 3 nm slits,filling occurs first in the layer closest to the inner surface of the slit,and then in the inner region.But no obvious regional filling occurs in the 1 nm slit.In particular,the advancing meniscus of the n-C12in the 6 nm and 3 nm slits is clearly observable,but there is no obvious advancing meniscus in the 1 nm slit.In order to obtain an accurate measure of penetration distance,a relative density profile(along the x axis)was calculated as follows:

whereρ(x,t)is the local number density of alkane molecules at distance x and penetration time t,andρaveis the average number density of the alkane molecules of the system.Fig.5 shows relative density profile of fluid in the kerogen silts as a function of time and distance.In Fig.5(a)for the 6 nm slit,the fluid front is spread out with time within the restricted space of the kerogen slit.Fig.5(b)for the 3 nm slit shows that the fluid front is less diffuse than the 6 nm slit.For the 1 nm slit(Fig.5(c)),the viscous resistance between fluid molecules and fluid-solid molecules is greater.Thus,although there is fluid flow into the 1 nm slit,molecules accumulate at the entrance,but with only a small spread with time.
The penetration distance of n-C12was measured at a position corresponding toρrelative=0.1 to avoid density fluctuations caused by a few molecules in the vacuum phase.Fig.6 shows the penetration distance in slits with different widths as a function of time.Unlike the linear variation of penetration distance with time as in carbon nanotubes(Supple and Quirke,2004,2005),the penetration distance of n-C12within all the three kerogen slits initially increasesrapidly,and thereafter slowly increases.For carbon nanotubes(r<2 nm),as the tubes become smaller,the filling speeds increase significantly because alkanes and walls are more attractive(Supple and Quirke,2004,2005).However,for kerogen slits(1-6 nm),the larger slits fill more quickly than the smaller slits.The speed of penetration is:6 nm>3 nm>1 nm.The early stage penetration is dominated by the rapid acceleration of the molecules on the inner surface of the slits,caused by the attractive force resulting from the molecule-slit interactions within the range of the potential.Therefore,the filling speeds of the three slits are similar at the very early stage(<100 ps).With the penetration of n-C12,the friction of the rough surfaces and the viscous resistance between fluid molecules result in a slowing down of the filling speeds.The greater the width of a slit,the smaller the viscous resistance between the molecules.It is possible that for narrow slits,the filling at much lower speeds due to the increased viscous resistance arises from the tiny geometric space at a later stage.
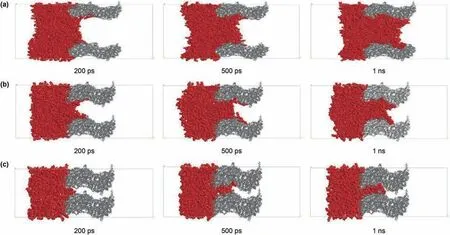
Fig.4.Results of imbibition of n-C12 in the pore with different diameters at different times:(a)6 nm;(b)3 nm;(c)1 nm.
As reported by Martic et al.(2002,2004,2005),for a capillary with a very small radius dominated by viscous forces,the overall balance of forces on the liquid in the capillary can be expressed as:

where R is the capillary radius,m;γLVis the surface tension of the liquid,N/m;ηis the viscosity of the fluid,Pa∙s;θis the equilibrium contact angle between the liquid and the capillary wall,degree;x is the distance of penetration,m;and t is the imbibition time,s.The Lucas-Washburn(L-W)equation(Lucas,1918;Washburn,1921)is obtained by integrating under the initial condition x=0,t=0:

For the slit model,Eq.(2)should be changed to Eq.(4):
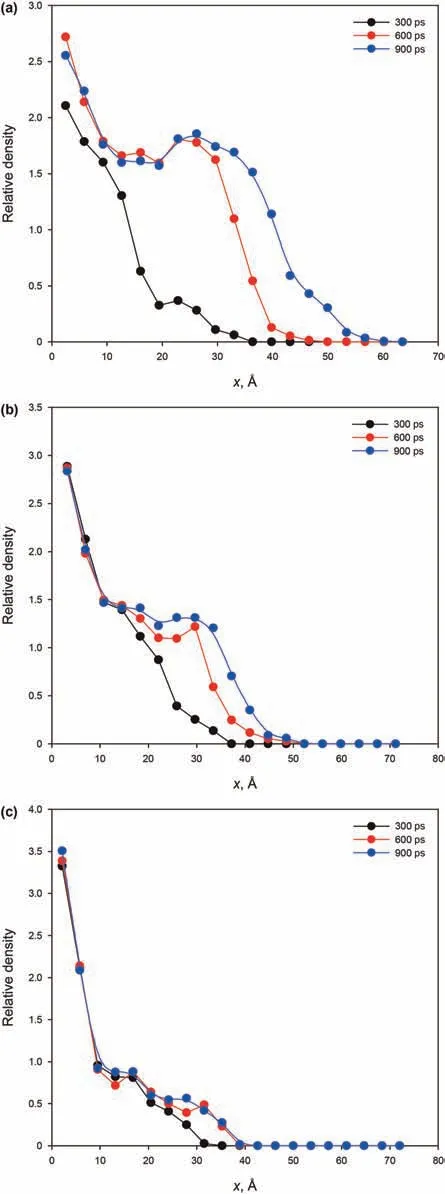
Fig.5.Relative density profiles in the kerogen slits at 300,600,and 900 ps:(a)L=6 nm;(b)L=3 nm;(c)L=1 nm.

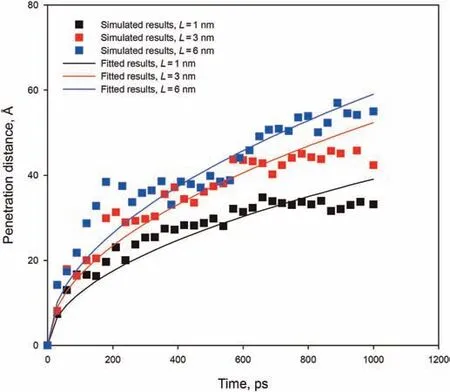
Fig.6.Penetration distance versus time for slits of widths of 6,3,and 1 nm.The solid lines correspond to the fits given by Eq.(5).
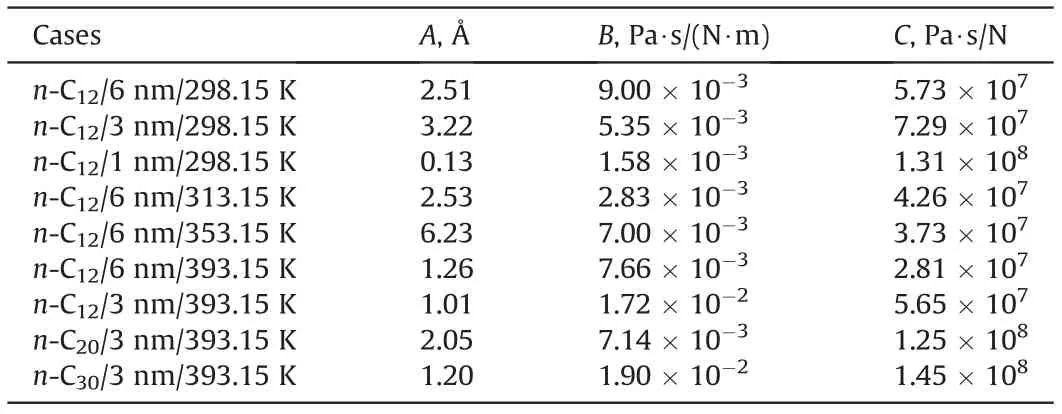
Table2 Fitted coefficients for Eq.(8).
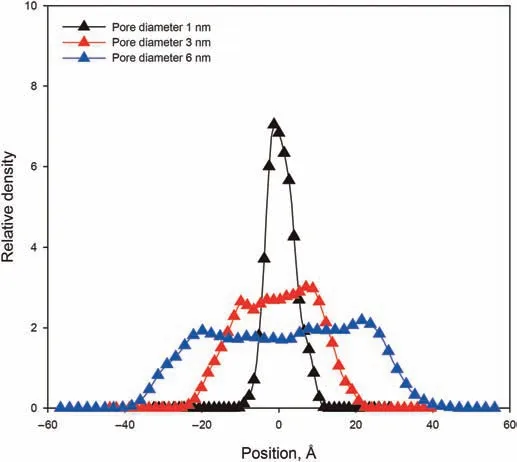
Fig.7.Relative density of n-C12 in the pore with different diameters at 1 ns.
where L is the width of the slit,m.Similarly,with the same initial condition,integration leads to the L-W equation applicable to slit model:

After n-C12in the 6 nm slit reaches the edge of the slit,the end effect will change the contact angle.Therefore,only the penetration process in 6 nm slit before n-C12reaches to the end of the slit(less than 900 ps)can be described by the above equation.As shown in Fig.6(blue scatter),the dynamics of x(t)in the 6 nm slit can be described by the L-W equation applicable to the slit model(Eq.(5)),with only a slight deviation in the early stage.However,for the 3 nm and 1 nm slits,the slow penetration speed in the later stage makes the deviation between the simulated and fitted get larger.Through the observation of the trajectory file,after a period of penetration,more and more molecules enter the slits,and the kerogen walls has an increasing hindrance to the movement of n-C12molecules,which affects the penetration speed at late stage.In the confined slit,the attractive force between the kerogen walls and alkane molecules reduces the velocity of the alkane penetration in the kerogen slit.
The wetting of porous media is an important parameter in oil production.As noted,the structure of kerogen is complex,and it is difficult to measure the contact angle by experimental methods.According to Eq.(4),the contact angleθcan be obtained by fitting the simulation results of imbibition with the L-W equation when the viscosity and surface tension have been determined.In the imbibition process,the contact angle may depend on the wettingline velocity of penetration(de Gennes,1985).This effect was accounted for in Eqs.(2)and(4)by replacingθwith a dynamic valueθt.Martic et al.(2002,2004,2005)have used the molecular-kinetic theory(Blake and Haynes,1969)to study dynamic contact angle during capillary imbibition.The velocity of the wetting line dx/dt can be expressed by:

with
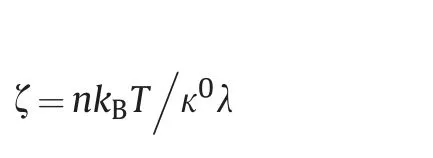
whereζis the coefficient of wetting line friction;κ0is the frequency of molecular displacement;λis the average length of a molecule,Å;n is the number of adsorption sites per unit area;kBis Boltzmann's constant,J/K;T is the absolute temperature,K;θ0is the equilibrium contact angle,degree;θtis the dynamic contact angle,degree.
By combining Eqs.(6)and(4),we obtain the velocity dependent equation for slit imbibition:

The exact solution of Eq.(7)is:
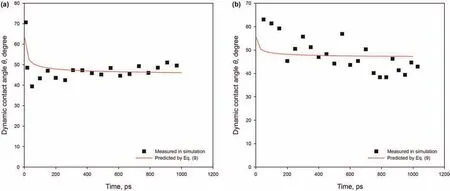
Fig.8.Dynamic contact angles for different width slits:(a)L=6 nm;(b)L=3 nm.The solid lines correspond to the predicted angle from Eq.(9).
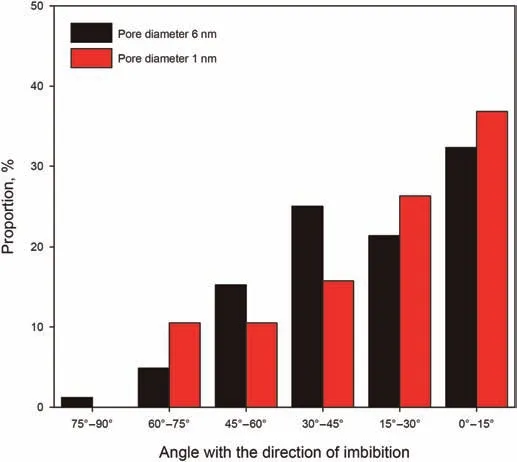
Fig.9.Comparison of orientation of n-C12 between the slits with 1 and 6 nm.

We can use Eq.(9)to predict dynamic contact angleθt,and compare with the values ofθtmeasured in the simulations.In order to define the boundary of kerogen slit,we calculated a relative density profile similarly as before(but this time along the y axis)of alkane in the slit region.As shown in Fig.7,the n-C12in kerogen slits with widths of 6 nm and 3 nm show the two density peaks near the kerogen boundary.The two density peaks at different imbibition times were used to locate the extremity of the meniscus of the advancing front.The contact angle can be obtained from the tangent of the meniscus and the slit boundary.Do note however that the two density peaks phenomenon is absent from the relative density profiles of n-C12in a slit with a width of 1 nm,which indicates that it is difficult for n-C12to form a density difference in such a small space.Therefore,it is more difficult to measure the contact angle by tangent line for a 1 nm slit.
Fig.8 shows a direct comparison between our simulated results of different width slits and the predicted contact angle.As indicated,the results of n-C12in slits with widths of 6 nm are in very good agreement with the predicted contact angle by Eq.(9),but the predicted contact angle in the 3 nm slit shows slight up-and-down deviations.The apparent issue is the unevenness of the kerogen surface giving rise to an error in the obtained contact angle.Nevertheless,there is no obvious difference of contact angle in slits with widths of 6 and 3 nm,suggesting that the contact angle does not depend on the slit width,but only on the material properties and its temperature.This important result is consistent with that predicted by molecular-kinetic theory(Martic et al.,2002,2004,2005).
We counted the orientation of alkane molecules relative to the slit axis in each case.The orientation was characterized by the angle θoxbetween the end-to-end chain vector and the imbibition direction(x axis)(Supple and Quirke,2005).The angleθoxcan take any value between 0˚and 90˚:0˚represents that the chains are completely aligned with the x axis,and 90˚represents that the chains are completely perpendicular to the x axis.
The orientation of the n-C12molecules in the kerogen slits with widths of 6 nm and 1 nm are shown in Fig.9.As shown is Fig.9,the greater proportion of n-C12is oriented at an angle of less than 45˚in both the 6 nm and the 1 nm slits.In the 1 nm slit,there is no n-C12oriented at an angle greater than 75˚,which represents almost no molecules coiled and perpendicular to the slit axis.The proportion of n-C12oriented at an angle of 30˚-60˚in the 6 nm slit is greater than that of the 1 nm slit.The proportion of n-C12oriented at an angle of less than 30˚in the 1 nm slit is significantly greater than that in the 6 nm slit,suggesting that more n-C12molecules orient almost perfectly parallel to the x axis.
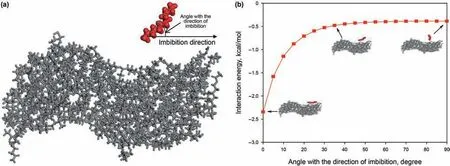
Fig.10.Method of calculating the interaction energy between n-C12 and OM:(a)model of the interaction between n-C12 and OM;(b)variation of the interaction energy between n-C12 and OM with the angle with the direction of imbibition.
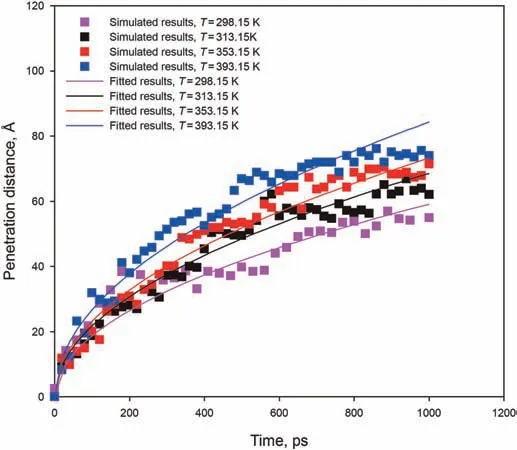
Fig.11.Variation of penetration distance with time of n-C12 in the 6 nm slit for different temperatures.The solid lines correspond to the fits given by Eq.(5).
As shown in Fig.10(a),we built a model to calculate the interaction between the kerogen matrix(designated by OM in the figure and hereafter)and the n-C12molecules.The angle with the x axis is changed to calculate the interaction energy at different orientation angles.The interaction energy between n-C12molecule and kerogen can be calculated as follows(ˇSponer et al.,1999;Zhao et al.,2021):

where Ekerogen&n-C12is the interaction energy between n-C12molecule and kerogen,kcal/mol;Ekerogen+n-C12is the total nonbond energy of n-C12molecule and kerogen,kcal/mol;Ekerogenis the non-bond energy of kerogen,kcal/mol;En-C12is the non-bond energy of n-C12molecule,kcal/mol.
A negative value of interaction energy suggests attractive interaction between n-C12molecule and kerogen(i.e.,bonding energy),and the more negative the value represents the greater the interaction strength between the two components,corresponding to the minimum energy of molecular configuration.Fig.10(b)shows the interaction energy when the angles with the x axis ranges from 0˚to 90˚.It can be seen that the interaction energy is greater and is invariant with respect to change of angle when the orientation angle is between 40˚and 90˚.However,when the orientation angle is less than 40˚,the Ekerogen&n-C12decreases rapidly as the orientation angle decreases.Compared with the 6 nm slit,the less than 30˚orientation angle of n-C12molecules in the 1 nm slit reside in greater proportion,reflecting that more molecules need to change their conformation to parallel to the x axis so as to maintain a lower energy for imbibition into the slits.Spaceconfinement conformational changes of n-C12molecules slow down the imbibition speed,resulting in the shortest penetration distance of the 1 nm slit within 1 ns.
3.2.Effect of temperature
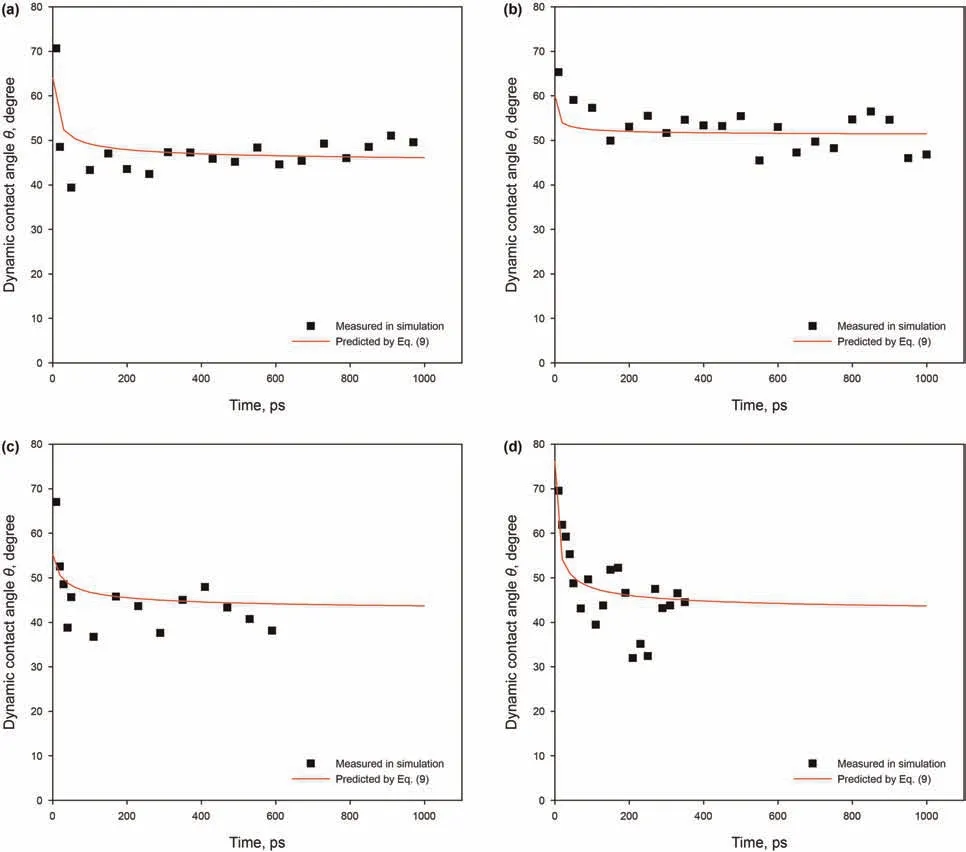
Fig.12.Dynamic contact angles for different temperatures:(a)T=298.15 K;(b)T=313.15 K;(c)T=353.15 K;(d)T=393.15 K.The solid lines correspond to the predicted angle.
The vacuum-imbibition of n-C12in the 6 nm kerogen slit for different temperatures was evaluated.The time evolutions of penetration distance in 6 nm slits at different temperatures are shown in Fig.11.It can be seen that the L-W equation applicable to the slit model(Eq.(5))can fit the simulated penetration distance well except for the end of penetration due to the end effect as analyzed before.The penetration distance was functionally approximated based on dependence of the square root of time.The imbibition speeds increase as the temperature increases.Prior to 200 ps,only the penetration speed of n-C12at 393.15 K is slightly higher than penetration speeds at other temperatures.After 200 ps,the difference in the penetration speeds of n-C12at the three different temperatures gradually increases.Fig.12 shows the predicted contact angle via Eq.(9)at four different temperatures.Consistent with the previous study results,the predicted contact angle decreases slightly with increasing temperature.

Fig.13.Comparison of the angle distribution of n-C12 in the 6 nm pore at 313.15 and 393.15 K,respectively.
High temperature leads to high thermal motion velocity,meaning more frequent collision between molecules occurs.Alkane molecules with higher velocity have more kinetic energy,which can help to overcome the attractive force between n-C12molecules and kerogen walls.Therefore,high temperature leads to high imbibition velocity.Fig.13 compares the orientation of n-C12molecules in the kerogen slits at 313.15 and 93.15 K,respectively.As shown,the proportion of n-C12molecules oriented at an angle of less than 45˚is greater in both the 313.15 K and the 393.15 K cases.The proportion of n-C12oriented at an angle greater than 60˚at 393.15 K is greater than 313.15 K,and the proportion of n-C12oriented at an angle less than 15˚at 313.15 K is greater than 393.15 K.These observations mean that more molecules lie parallel to the x axis(minimum energy conformation)at 313.15 K.With temperature increasing,the movement of molecules increases.High temperature systems have more energy and thus n-C12molecules do not need to maintain the minimum energy conformation.Therefore,higher temperature is a positive factor for alkane imbibition.
3.3.Effect of alkane length
The vacuum-imbibition of alkane with different lengths in the 3 nm kerogen slit at 393.15 K was evaluated.Snapshots and penetration distance of each system are shown in Fig.14.As shown in Fig.14(a-c),each alkane is depicted by different colors:red-n-C12,yellow-n-C20,purple-n-C30.Before combining with the kerogen slit box,a constant-temperature(393.15 K),a constantpressure(0.1 MPa),NPT ensemble simulation was performed on the alkane molecules box for 1 ns.It can be seen from Table 1 that the temperature and pressure conditions of different alkane systems are the same,and the initial numbers of n-C12,n-C20and n-C30molecules in the kerogen slit are different(shown in the last column),meaning different densities.After simulating the imbibition process for 1 ns,more n-C12molecules penetrated into the kerogen slit.It can be seen from Fig.14(d)that the penetration distance of the three alkanes all exhibit similar trend,and also that all can be well fitted by the L-W equation applicable to the slit model(Eq.(5)).The imbibition speed of n-C12is obviously greater than that of n-C20and n-C30,both of which have almost the same imbibition speed.Fig.15 shows the predicted contact angle of the three alkanes via Eq.(9)at 393.15 K.At the early stage of imbibition,the deviation between the predicted dynamic contact angles and the simulated contact angles increases as the carbon chain number increases.The predicted dynamic contact angles of the three alkanes exhibit only slight differences from the simulated contact angles at a later stage of imbibition,which indicates that the same wetting-line friction is exhibited by the three alkanes.Therefore,the difference in the penetration distance of the three alkanes in the 3 nm slit is not due to a difference in wettability.
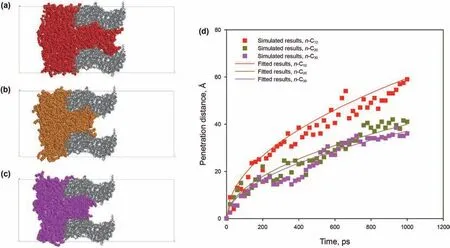
Fig.14.Results of the imbibition of different alkanes in 3 nm pore:(a)n-C12 at 1 ns;(b)n-C20 at 1 ns;(c)n-C30 at 1 ns;(d)variation of penetration distance with time of different alkanes in the 3 nm pore.
Fig.16(a)compares the orientation of n-C12and n-C30molecules in the 3 nm kerogen slits at 393.15 K.It can be seen that the proportion of molecules oriented at an angle of less than 45˚is greater for both the n-C12and the n-C30cases.The proportion of n-C30oriented at an angle less than 15˚is much greater than that of n-C12.This means that more n-C30molecules need to maintain the minimum energy conformation in the 3 nm slit at 393.15 K.We used the model shown in Fig.10(a)by replacing the n-C12with n-C30to calculate the interaction energy between n-C30and OM with different orientation angles.Remembering the previous discussion about interaction energies,and that a negative value of interaction energy suggests attractive interaction between the two components(i.e.,the more negative the value represents a greater interaction strength between the two components),we turn now to Fig.16(b).From the interaction energies between alkane and OM with the different orientation angles as shown there,similar as with n-C12and OM,the interaction energy of n-C30and OM is greater(i.e.,more negative=more attracting)and does not change with a change of angle when the orientation angle is between 20˚and 90˚.The interaction energy of n-C12and OM is less(i.e.,less negative=less attracting)than that of n-C30and OM when the orientation angle is the same.Especially when the orientation angle is less than 15˚,the Ekerogen&n-C30are much greater(again,more negative=more attracting)than the Ekerogen&n-C12.Compared with the space of the 3 nm slit,the molecular size of n-C30is too large,reflecting that more molecules need to change their conformation to maintain a lower energy for imbibition into the slits.With the alkane length increasing,the space-confinement hindrance increases.The longer the carbon chain,the slower the movement of alkane molecules.Therefore,the deviation of predicted dynamic contact angle and the slower penetration speeds of n-C20and n-C30is because the alkane molecules need more time to undergo conformational changes at an early stage of imbibition,reflecting that the shorter chain alkanes have greater mobility under capillary action.
3.4.Effect of alkane ratio
Due to the complexity of shale oil,especially continental shale oil,which contains a high content of long-chain alkanes,we selected n-C12,n-C20,and n-C30as the operative molecular mixtures.The imbibition process of alkane mixtures with different molar ratios in the 3 nm kerogen slits at 393.15 K were simulated.Snapshots and penetration distance of each system are shown in Fig.17.Same as Fig.14,each alkane of the mixtures in Fig.17(a-c)is depicted by different colors:red-n-C12,yellow-n-C20,purplen-C30.For a brief description,we denoted the system(n-C12):(n-C20):(n-C30)=0.3:1:1 by S1(Fig.17(a)),the system(n-C12):(n-C20):(n-C30)=1:1:1 by S2(Fig.17(b)),and the system(n-C12):(n-C20):(n-C30)=3:1:1 by S3(Fig.17(c)).The numbers of molecules of the three systems are listed in Table 1.As shown in Fig.17(a-c),after 1 ns imbibition,the S1 system imbibed the least molecules into the kerogen slit,and the S3 system imbibed the most molecules into the kerogen slit.The advancing meniscus of the mixtures can be clearly observed in all three cases,meaning that the slits filling occurs in layers closest to the slit inner surface first.According to the meniscus of the advancing front,contact angles were all less than 90˚in three cases.It can be seen from Fig.17(d)that,same as with the single alkane,the penetration distance of the three mixtures all first increase rapidly,and thereafter slowly increase,which means that the penetration speed at the early stage is faster,and that the penetration speed at the later stage slows down.The variation of penetration distance with time of the three cases also can be well fitted by the dynamic contact angle modified L-W equation(Eq.(8)).The imbibition speed is:S3 system((n-C12):(n-C20):(n-C30)=3:1:1)>S2 system((n-C12):(n-C20):(n-C30)=1:1:1)>S1 system((n-C12):(n-C20):(n-C30)=0.3:1:1),meaning that systems containing more shorter chain alkanes have greater penetration speeds.
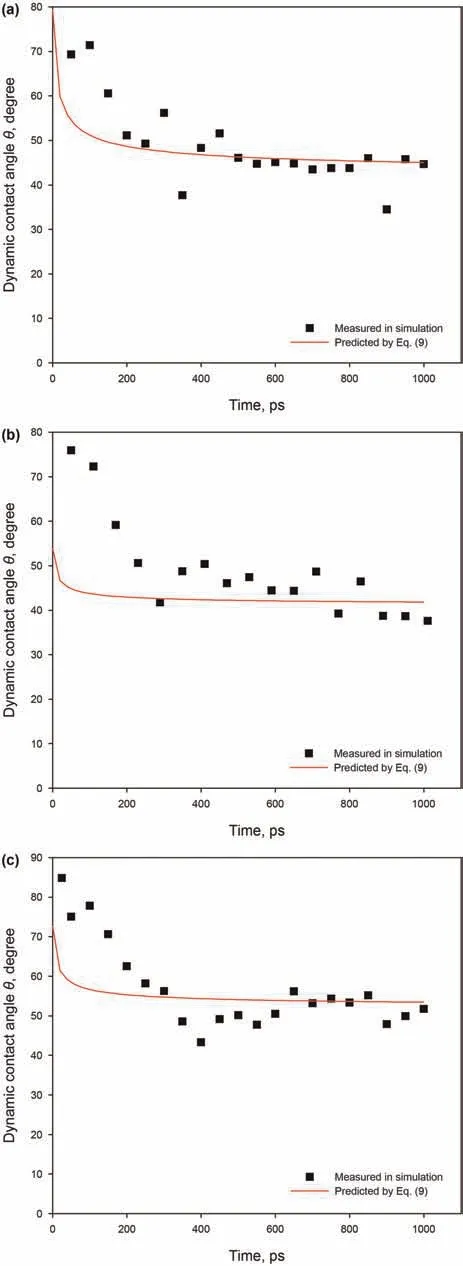
Fig.15.Dynamic contact angles for different alkanes in the 3 nm at 393.15 K:(a)n-C12;(b)n-C20;(c)n-C30.
The relative density profiles(along the x axis)of the three alkane ratio systems are shown in Fig.18.It can be seen from Fig.18(a)that most n-C12molecules are imbibed into the kerogen slit with the S3 system,while the S1 system is the least.This is because the S3 system contains a higher molar ratio of n-C12,and the n-C12molecules in the system have the best mobility.Like n-C12,n-C20and n-C30molecules are imbibed the most in the S3 system,and the least in the S1 system.
This can be explained by the increasing molar ratio of n-C12molecules in the three systems,which leads to greater mobility of each alkane mixture molecules.Fig.19 shows the relative density profiles of n-C12,n-C20,and n-C30molecules in each system after 1 ns imbibition.When the content of n-C12is the smallest(Fig.19(a)),the number of n-C12,n-C20,and n-C30molecules filling the slit is relatively small,and can only enter a distance of less than 40Å within 1 ns,which is very close to the entrance.At the advancing front,the relative densities of n-C20and n-C30are greater than that of n-C12,which indicates that,although n-C12has a greater mobility,the accumulation of n-C20and n-C30molecules at the entrance prevent the penetration of n-C12.When one third of the system is n-C12molecules(Fig.19(b)),n-C12,n-C20,and n-C30molecules can enter to a distance of 60Åwithin 1 ns,and the density of n-C12in the slit is greater than that of either n-C20or n-C30.When the content of n-C12molecules continues to increase(Fig.19(c)),n-C12,n-C20,and n-C30molecules can enter to a distance of 80Åwithin 1 ns,and the n-C12at the advancing front carries more n-C20molecules.As in the previous analysis,molecular transportation is mainly governed by the molecular structure at this scale,and the shorter chain alkanes have greater mobilities under capillary action.Therefore,as the content of short-chain alkanes increases,the mobility of long-chain alkanes improves and facilitates the penetration of alkane mixtures in kerogen slits.
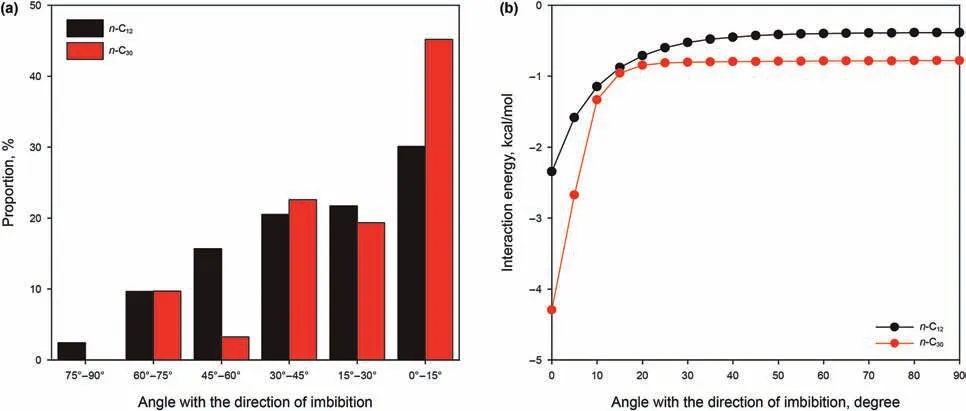
Fig.16.(a)Comparison of the angle distribution of n-C12 and n-C30 in the 3 nm pore;(b)variations of interaction energies between n-C12 and OM,n-C30 and OM with respect to the angle with the direction of imbibition.
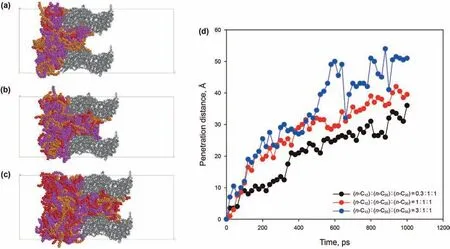
Fig.17.Results of the imbibition of the mixture of alkanes in 3 nm pore:(a)(n-C12):(n-C20):(n-C30)=0.3:1:1 at 1 ns;(b)(n-C12):(n-C20):(n-C30)=1:1:1 at 1 ns;(c)(n-C12):(n-C20):(n-C30)=3:1:1 at 1 ns;(d)variation of penetration distance with time of different alkane ratios in the 3 nm pore.
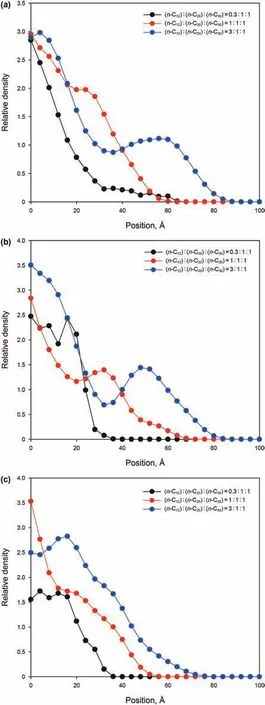
Fig.18.Comparison of relative densities of alkanes in the 3 nm slit at 1 ns for three systems with different alkane ratios:(a)the relative density of n-C12 in the three systems;(b)the relative density of n-C20 in the three systems;(c)the relative density of n-C30 in the three systems.
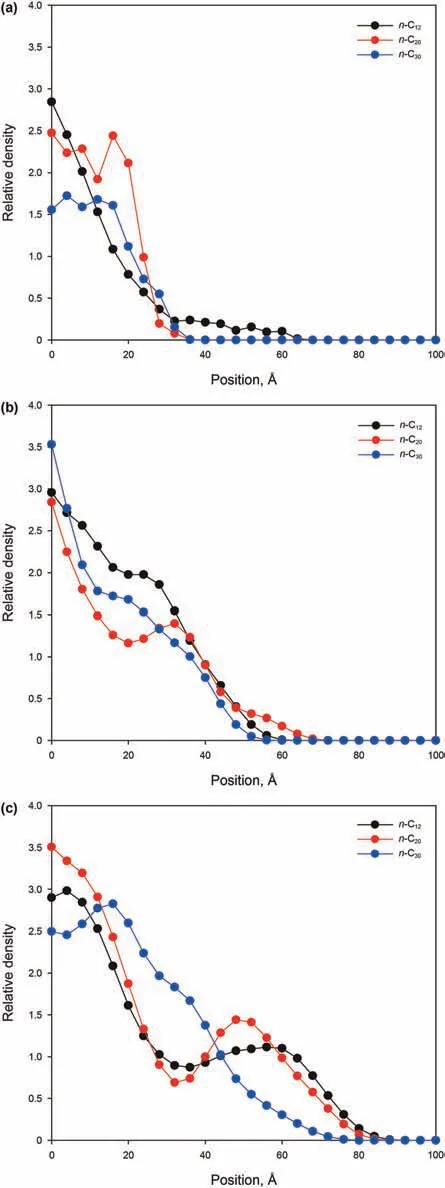
Fig.19.Comparison of the relative density distributions of n-C12,n-C20,and n-C30 in the 3 nm slit at 1 ns for three different alkane ratios:(a)the alkane ratio is(n-C12):(n-C20):(n-C30)=0.3:1:1;(b)the alkane ratio is(n-C12):(n-C20):(n-C30)=1:1:1;(c)the alkane ratio is(n-C12):(n-C20):(n-C30)=3:1:1.
4.Conclusions
The coupling transport of the oil flow in the organic pores and diffusion in the surrounding organic walls exist in the process of restoring the organic oil saturation and production.It is not possible to separate the diffusion from the flow,there exists uncertainties in assuming the parameters for flow in pores and diffusion in kerogen.To study the flow process in the organic pores,the imbibition of hydrocarbons in nanometer-wide kerogen slits was investigated.Effects of slit width,temperature,n-alkane types,and n-alkane ratio on the penetration distance,dynamic contact angle,and molecular conformations were analyzed.The following conclusions have been drawn from the study:
(1)Unlike the flow behavior of n-alkane in carbon nanotubes,the filling speeds of n-alkane in kerogen slits with apertures from 1 to 6 nm increase significantly as slits width increases.The main reason for this is that the driving force due to the molecule-silt interactions does not depend on the silt width,but space-confinement conformational changes of molecules slow down the filling speeds in the narrow slits.
(2)Increasing the temperature of a system is a positive factor for n-alkane imbibition,because high temperature provides more energy and thus n-alkane molecules can freely imbibe into the slits without taking time to change to the minimum energy conformation.
(3)Molecular transportation of n-alkanes is dominated by molecular structure and molecular motion at this scale.As the alkane length increases,the space-confinement hindrance increases.Therefore,n-alkane molecules with long carbon chains require more time to undergo conformational changes,which conversely indicates that n-alkanes with short carbon chains have greater mobility under capillary action.Therefore,as the content of short-chain alkanes increases in alkane mixtures,the mobility of long-chain alkanes improves and facilitates the penetration of alkane mixtures in kerogen slits.
Acknowledgments
This study is financially supported by the National Natural Science Foundation of China(Grant No.52004317;42090024),the Natural Science Foundation of Shandong Province of China(No.ZR2020ME091),and the Fundamental Research Funds for the Central Universities(20CX06016A),the National Science and Technology Major Project(2017ZX05049-004).
- Petroleum Science的其它文章
- Sedimentary characteristics and implications for hydrocarbon exploration in a retrograding shallow-water delta:An example from the fourth member of the Cretaceous Quantou Formation in the Sanzhao depression,Songliao Basin,NE China
- Study of the gas sources of the Ordovician gas reservoir in the Central-Eastern Ordos Basin
- A novel hybrid thermodynamic model for pore size distribution characterisation for shale
- Microstructural analysis of organic matter in shale by SAXS and WAXS methods
- Investigation of oil and water migrations in lacustrine oil shales using 20 MHz 2D NMR relaxometry techniques
- Fast least-squares prestack time migration via accelerating the explicit calculation of Hessian matrix with dip-angle Fresnel zone

