Permeability and heterogeneity adaptability of surfactant-alternatinggas foam for recovering oil from low-permeability reservoirs
Ming-Chen Ding ,Qing Li ,Yu-Jing Yun ,Ye-Fei Wng ,Ning Zho ,Yu-Gui Hn
a School of Petroleum Engineering,China University of Petroleum(East China),Qingdao,266580,Shandong,P.R.China
b Key Laboratory of Unconventional Oil & Gas Development(China University of Petroleum(East China)),Ministry of Education,Qingdao,266580,Shandong,P.R.China
c Research Institute of Petroleum Engineering Technology,Shengli Oilfield Company,Dongying,257000,Shandong,P.R.China
d Bohai Oilfield Research Institute,Tianjin Branch of CNOOC Ltd.,Tianjin,300450,P.R.China
Keywords:
ABSTRACT
1.Introduction
As conventional high-permeability reservoirs gradually approach the end of their development lives with high water cuts(usually above 90%),the development of low-permeability reservoirs becomes increasingly more important for maintaining crude oil production due to the huge reserves they contain.For example,the crude oil output from low-permeability reservoirs by the China National Petroleum Corporation in 2017 accounted for 36.8% of its total annual output(Hu et al.,2018).About 38% of the world's oil and gas are found in low-grade sources characterized by their low permeability.The corresponding number for resources in China is over 46% and most of the newly-discovered reserves(about 60%-80%)are of low permeability(Hu et al.,2018).For example,the Xinjiang Oilfield newly discovers the world's largest lowpermeability conglomerate reservoir with reserves amounting to 1.24 billion tons and an average permeability of only 1.34 mD(Zhi et al.,2018).
To develop low-permeability reservoirs after the primary elastic stage,the widely adopted secondary method is to inject water or gas to replenish the energy of the formation and displace the crude oil there(Ding et al.,2017;Ma et al.,2015).However,a large amount of oil remains after such treatment because of the low permeability and severe heterogeneity of the reservoir(as well as the resulting water/gas channeling and thus poor sweep quality).The amount of oil recovered after water injection is usually small(about 10%-30%),indicating that the majority of the oil(about 70%-90%)remains trapped underground.Therefore,enhanced oil recovery(EOR)techniques are needed to access this remaining oil.Chemical agents(e.g.polymers,gels,etc.)are the substances most used for EOR techniques around the world in order to realize profile control and enlarge the sweep volume(Sang et al.,2014;Liu et al.,2010;Xu et al.,2020).Great success has been achieved when such methods have been applied to conventional high-permeability reservoirs.However,they are usually not recommended in low-permeability reservoirs due to injectability problems(Wei et al.,2018).A promising solution to simultaneously overcoming the poor sweep and injectability problems associated with conventional polymers and gels is to use foam(Stevens et al.,1995;Svorstol et al.,1996).Actually,since foam was first introduced to control the mobility of the fluid front by Bond and Holbrook in 1958(Boud et al.,1958),surfactant-gas bubbles(i.e.foam)have attracted a great deal of attention and much research has been carried out(Aarra et al.,1996;Afzali et al.,2018;Hu et al.,2020).For example,comparisons between foam and the widely-used water-alternating-gas(WAG)method(Zeng et al.,2018;Wei et al.,2018),and influencing factors on foam properties and EOR(e.g.surfactant concentration(Shan et al.,2002;Chang et al.,1990),crude oil(Wei et al.,2017),liquid-gas ratio(Zhang et al.,2020)and injection pattern(Zhang et al.,2020;Zeng et al.,2018)etc)have been studied in depth.Recently,the development of new foaming fluids(i.e.CO2-sensitive foaming agent,modified nanoparticles)has also been a focus of research effort(Abdul et al.,2019;Alcorn et al.,2020;Achinta et al.,2017;Li et al.,2017;Liu et al.2018a,2020).
The primary use of foam is to achieve profile control.Therefore,its performance in heterogeneous reservoirs has long been one of the aspects focused upon(except for those factors mentioned above).For example,Yaghoobi et al.studied the effect of heterogeneity on CO2foam in composite cores containing zones of high and low permeability.They found that foam could indeed favorably control CO2mobility(Yaghoobi et al.,1996,1998).Farshbaf Zinati found that foam is primarily generated in the high-permeability layers by using a method of simulation.Only if the pressure gradient is higher than the capillary entry pressure could the foam propagate into the low-permeability layers to enlarge the sweep volume(Farshbaf Zinati et al.,2007).Salman attempted to apply miscible ethane foam to achieve EOR in low-permeability heterogeneous harsh environments.It was found that the addition of foam provides better conformance control,thus enhancing overall recovery on a laboratory scale(Salman et al.,2020).Bertin et al.experimentally investigated foam generation and propagation in heterogeneous porous media.They found that,despite there being a drastic permeability contrast of 67 between the high-and lowpermeability regions,the foamed gas can be diverted to the lowpermeability regions in systems that both permit and prohibit cross flow(Bertin et al.,1999).In fractured cores,Liu et al.concluded that air-foam system flooding blocks fractures and effectively displaces the residual oil in the matrix(Liu et al.,2017).
One of the main mechanisms by which oil recovery can be improved in heterogeneous reservoirs involves the plugging of high-permeability regions using surfactant-gas bubbles and thus diverting the fluid to the low-permeability regions.However,the stronger the heterogeneity,the more difficult it is to accomplish this diversion process.Therefore,considering that the foam has a limited plugging capacity(just by the Jinmin effect),when SAG foam is used for EOR in such reservoirs,a natural question that arises is:what is the acceptable heterogeneity range over which the SAG foam can be successfully applied?In other words,how heterogeneous can a reservoir be and still be capable of development using SAG foam?Alternatively,how heterogeneous is a reservoir that cannot?Although there is an abundance of results available relating to foam application under heterogeneous conditions,most of them pertain to constant heterogeneity conditions.As a result,this critical question is still unanswered or unclear.Therefore,there is a need to identify the heterogeneity boundary of a reservoir to which SAG foam may be successfully applied.Also,the effect of permeability on SAG foam is also worthwhile studying as it too changes significantly in real reservoirs.
The first concern when surfactant-gas foam is applied to EOR is to ascertain whether the bubbles exist stably in real reservoirs.This is because no stabilizer(e.g.polymer)is added to such systems(to guarantee their injectability in low-permeability reservoirs)(Wei et al.,2018;Zhou et al.,2020).To address this,the stability of the surfactant-gas foam in micron-sized channels was first evaluated in this study.Thereafter,the size of the surfactant-gas bubbles formed in porous media was measured(as some researchers believed that the plugging capacity of bubbles is closely related to their initial size)(Lv et al.,2018;Li et al.,2020).Finally,but most importantly,the adaptability of the surfactant-gas foam to permeability and heterogeneity was investigated by conducting flow and oil flooding tests in models with different permeabilities and heterogeneities.Thus,the questions raised above can be addressed,as we discuss later.
2.Experimental section
2.1.Materials
The mixed surfactant used in this work is composed of sodium dodecyl sulfonate(SDS)and cocamidopropyl hydroxy sulfobetaine(CHSB)with a mixing ratio of 9:1.The surfactants were both purchased from Xinghua Chemical Co.,Ltd.(Chengdu,China).The total concentration of the mixture used was fixed at 0.3% in all experiments performed in this study as this proportion has been proved to yield the optimal foam performance(Sun et al.,2016;Wei et al.,2018).The formation water used for preparing the surfactant solution and flooding tests was composed of 3607.3 ppm of Na+,180.0 ppm of Ca2+,75.5 ppm of Mg2+,and 6111.8 ppm of Cl-.The crude oil employed was collected from the Shengli Oilfield and had a viscosity of 9.9 mPa s at 40˚C.The gas used for foam generation was nitrogen with a purity of 99.9% supplied by Tianyuan Gas Co.,Ltd.(Qingdao,China).The surface and interfacial tension of surfactant solution/N2and surfactant solution/crude oil systems were measured to be 31.0 mN/m and 0.008 mN/m,respectively.
The sand cores used,which were supplied by the China University of Petroleum(Beijing,China),had a diameter of 2.5 cm and a length range of 5.0-30.0 cm.The permeability values of the cores were distributed over the range 0.013-5.000μm2(with the specific value chosen according to the objectives of the experiment concerned).
2.2.Evaluation of foam stability
The stability of the foam is a primary concern when applied to EOR in real reservoirs,especially in the absence of a foam stabilizer(e.g.polymer).To determine the foam stability,three special experiments were designed to estimate the stability of the surfactant-gas bubbles in a graduated cylinder,micron-sized channels,and porous media.
2.2.1.In a graduated cylinder
Surfactant-gas foam was first generated using a commonlyused Warning Blender(GJ-3S,Qingdao Senxin Machinery Equipment Co.,Ltd.,China)(Lai et al.,2013;Rio et al.,2014).The surfactant solution(50 mL)was stirred for 2 min at 8000 r/min.Then,the foam generated was immediately transferred to a graduated cylinder made of glass and the initial volume of foam was recorded.The life time of foam was recorded as the time taken for the foam to disappear.In addition to the surfactant-gas system,a conventional polymer-stabilized foam was also formed and tested at this time for comparison purposes.Thus,the stability of the foams in unconstrained and continuous spaces could be determined.
2.2.2.In micron-sized channels
The diameters of the pores in real reservoirs are usually in the micron range(Shi et al.,2018).This means that the bubbles in real reservoirs exist in a somewhat constrained state,unlike the unconstrained state that occurs in large-scale spaces(i.e.in a graduated cylinder).To determine whether such a constraint will significantly affect the stability of the foam,we utilized glass tubes with diameters of 100μm.Bubbles were drawn into a microtubule and the tube was kept tilted at 30˚.The shapes and numbers of bubbles at different times(0,90,160,and 455 min)were subsequently recorded using a microscope(SZX7,Olympus Corporation,Japan).
2.2.3.In porous media
Another stability experiment was designed to more intuitively assess the stability of the foam in real porous media.The experimental apparatus used is illustrated in Fig.1.The N2gas,formation water,surfactant solution,and crude oil were stored in separate stainless steel containers.The fluids were injected into the core samples using a precise ISCO injection pump.In these experiments,the core sample was placed in core holder#1(while the other two,#2 and #3,were shut off).
The detailed procedure used is as follows.First,three core samples were prepared with a diameter of 2.5 cm,a length of 30 cm,and permeability of 0.35μm2.Then,water was injected until the pressure measured at the inlet end became stable.After that,surfactant and N2was alternatively injected into the cores with a volume of 6.2 PV to form bubbles therein(gas-liquid ratio:1:1,size of a single gas or liquid slug:0.1 pore volume(PV)).Thereafter,the three cores were treated differently:the first one was immediately flooded using water before the bubbles in it had time to burst(this corresponds to the‘0 min’sample).The second and third cores were kept for 90 and 455 min,respectively,before performing postwater flooding,allowing time for the bubbles within to burst.Thus,the stability of the foam in the cores could be judged by comparing the injection pressures used in the three cases(measured during post-water flooding).To be more specific,if the post-water pressure recorded at 90 or 455 min is significantly lower than that at 0 min(even near the injection pressure before foam injection),it indicates that the foam generated previously during SAG injection must have disappeared.If not,the foam remains in the core.
2.3.Measurement of bubble size
The sizes of the bubbles generated in porous media were measured by the combined use of the core flooding apparatus and a high pressure visual model,as shown in Fig.1(in this case,core holder #2 was used,while core holders #1 and #3 were shut off).Cores with a diameter of 2.5 cm,a length of 5-30 cm,and permeability of 0.086-2.8μm2were used in these foam generation experiments.More specifically,after water saturation,SAG injection(gas-liquid ratio:1:1,size of a single gas or liquid slug:0.1 PV,injection rate:0.5 mL/min)was conducted on cores with different parameters.The foam produced in the cores migrated into the visual model which is set up downstream.Here,the bubbles present were photographed using a microscope(SZX7,Olympus Corporation,Japan)and the collected images were used for size analysis(using Surfer software).
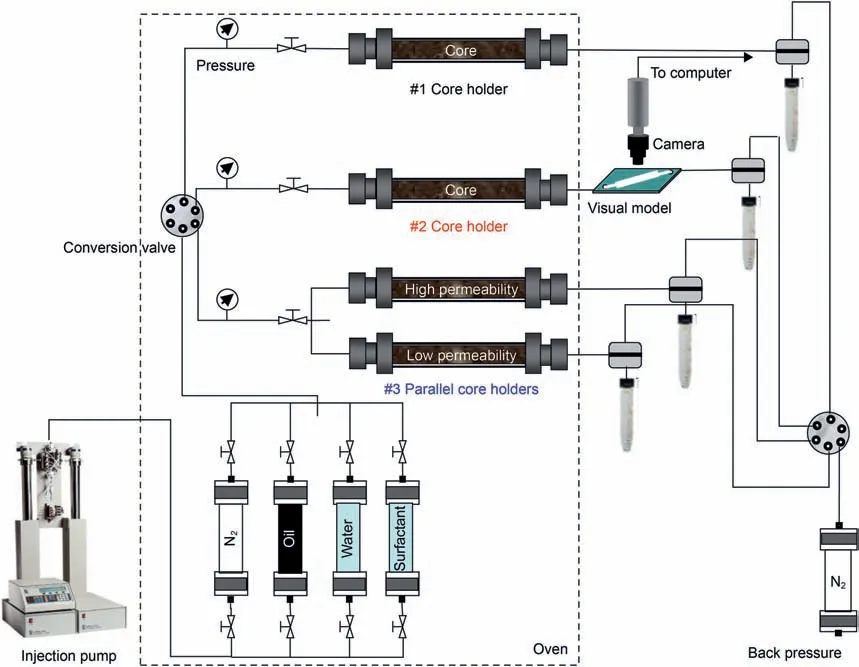
Fig.1.Schematic diagram of the experimental setup used in the core flow and flooding experiments.
2.4.Flow and oil flooding experiments
2.4.1.Homogeneous cores
In order to ascertain the plugging and oil-displacing capacity of SAG foam under a variety of permeability conditions,flow and flooding tests were implemented in cores with a diameter of 2.5 cm,a length of 30.0 cm,and permeability values ranging from 0.013 to 4.58μm2.The setup in Fig.1 was again used(using core holder #1,while core holders #2 and #3 were shut off).
(1)Flow tests.The plugging performance of SAG foam in porous media was assessed using core flow experiments.A prepared core,after being saturated with formation brine,was placed in the experimental flow apparatus,as shown in Fig.1(using core holder#1).Formation water was then injected into the core at a rate of 0.5 mL/min to attain a stable flow of water and pressure drop.Then,SAG injection(gas-liquid ratio:1:1,size of a single gas or liquid slug:0.1 PV,injection rate:0.5 mL/min)was started and continued until the pressure drop stabilized.After that,the core was again saturated with formation brine.Thus,the plugging performance of foam could be characterized by calculating the resistance factor encountered(defined as the ratio of the effective permeabilities measured before and after foam injection).
(2)Oil recovery tests.Oil flooding tests were conducted by using the same setup.The cores,after oil saturation,were first flooded with formation water to a high water cut(above 98%).Then,1.0 PV of foam was injected(gas-liquid ratio:1:1,size of a single gas or liquid slug:0.1 PV,injection rate:0.5 mL/min),followed by post-water flooding until no more oil was produced.Thus,the amount of oil produced during the whole displacement process could be adopted to ascertain the oil recovery and incremental amount of oil recovery realized using the foam.
2.4.2.Heterogeneous cores
To determine the diverting and oil-displacing capacity of SAG foam under a variety of heterogeneity conditions,flow and flooding tests were implemented in parallel cores with a diameter of 2.5 cm,a length of 30.0 cm,and permeability values ranging from 0.019 to 5.0μm2.The setup in Fig.1 was again used(using parallel core holders #3,while core holders #1 and #2 were shut off).
(1)Flow tests.The permeabilities of the parallel cores with high and low permeability were first measured and then saturated with water.Then,primary water,SAG foam(gas-liquid ratio:1:1,size of a single gas or liquid slug:0.1 PV,injection rate:1.0 mL/min,gas and liquid injection volume:6.0 PV),and post-water flooding could be conducted in turn.During this process,the effluent volumes from the high and lowpermeability cores were recorded and used to calculate the relative flow rates(defined as the percentage of high-or lowpermeability core flow to total flow).
(2)Oil recovery tests.The cores with high and low permeability were first saturated(separately)with brine.This was then displaced with oil(at a flow rate of 0.5 mL/min)to achieve oil saturation.Thereafter,the parallel cores were primarily flooded with water to a high water cut(above 98%).Then,a slug(gas-liquid ratio:1:1;size of a single gas or liquid slug:0.1 PV;injection rate:1.0 mL/min;gas and liquid injection volume:1.0 PV)of the SAG foam was injected,followed by post-water flooding.The amounts of oil and water produced were recorded during the whole flooding process and employed to calculate the oil recovery,incremental oil recovery,and relative flow rates.
It is worth noting that all the flow and oil flooding tests in this study were conducted at 40˚C with a backpressure of 6.0 MPa.Moreover,the pressure results presented in all figures are the differences between the detected pressures and the backpressure,thus reflecting the real pressure drops in the actual cores.
3.Experimental results and discussion
3.1.Stability of the surfactant-gas foam
The polymer stabilizer that is conventionally used is removed here to ensure the injectability of the foam in low-permeability reservoirs.As a result,the first concern is whether the SAG foam can still exist stably in the porous media as this is of critical importance for its use in EOR.To address this,three special experiments were designed to evaluate the stability of the surfactant-gas bubbles in a graduated cylinder,micro-sized channels,and porous media.
3.1.1.In a graduated cylinder
The properties of the surfactant-gas foam were first accessed by using the conventional Warning Blender method(Lai et al.,2013;Rio et al.,2014).The foam volumes measured and foam life times determined are illustrated in Fig.2.The corresponding data collected for the polymer-reinforced foam systems are also presented for comparison.
A comparison of the surfactant foam(0.3% S)and polymerstrengthened foam(0.3% S+0.2% P)shows that,when the polymer component is removed,the viscosity of the liquid phase decreases(Zhou et al.,2020).As a result,the dispersion of the gas into the liquid in the former case becomes slightly easier,leading to the generation of an increased volume of foam(260 mL compared to 220 mL).However,the stability of the foam is simultaneously reduced due to the accelerated rate of plateau liquid discharge(Shi et al.,2016).As a result,the foam's life time is significantly reduced from 163 to 90 min.
This data naturally can indicate that the surfactant-gas bubbles will disappear just 90 min after their generation,which is clearly not conducive to their use in EOR applications.However,this ignores a key factor:the environment in which the bubbles are located in real reservoirs is completely different to that occurring in graduated cylinder conditions.In the former case,the bubbles exist in a limited space subjected to constraints at the micron level(Shi et al.,2016)-in the latter case,there are no such constraints.Such differences may result in significant differences in the stability of the foam and the mechanism by which it acts.Therefore,the stability of the foam in real micron-sized channels needs to be studied further.
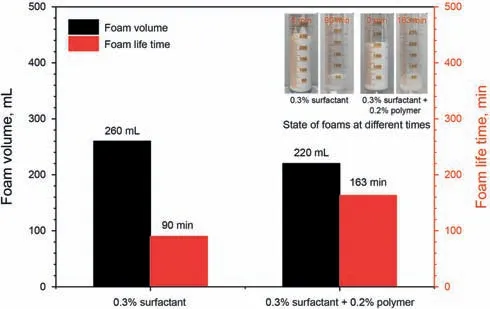
Fig.2.Properties of the foams produced with and without stabilizer(polymer).
3.1.2.In micron-sized channels
Bubbles of the surfactant-gas were introduced into a microtubule with a diameter of 100μm.The tube was kept tilted(at 30˚)and the bubbles were photographed after 0,90,160,and 455 min giving the results shown in Fig.3.
It can be seen that the bubbles in the micron-sized channel exist in clearly different conditions to those in continuous threedimensional space.To be more specific,due to the constraints imposed by the walls of the tube,the bubbles are self-arranged in single rows inside the micron-sized tube instead of numerous bubbles accumulating together(as they do in unconstrained space).In the microtubule the bubbles are generally isolated as single entities or two bubbles may make point contact with each other.Such limited contact between the bubbles in the microtubule weakens the plateau liquid discharge effect(Shi et al.,2018)on foam stability.Thus,the stability of the foam is significantly increased.The images in Fig.3 can well support this.As can be seen,there are 10 bubbles inside the tube initially(0 min).At the 90 min stage,a small bubble appears to have been absorbed by a larger bubble nearby(owing to the pressure inside the smaller bubble being larger than that in the larger one).In all,9 bubbles remain in the tube.On the other hand,the surfactant-gas foam has clearly disappeared in graduated cylinder conditions after 90 min(Fig.2).Even after 455 min,there are still 9 bubbles in the microtubule(although two bubbles have become larger and another two bubbles have become smaller).This suggests that the stability of the bubbles is significantly greater in the micron-sized channel than in a graduated cylinder.
3.1.3.In porous media
To determine the stability of the foam in real porous media,the surfactant and N2gas were alternately injected into three cores with the same parameters(2.5 cm in diameter,30.0 in length,and permeability of 0.35μm2)to generate foam therein.The cores were subsequently subjected to post-water flooding after 0,90,and 455 min.Thus,the stability of the foam in the cores can be estimated by comparing the pressure drop(measured during postwater flooding)at different times.Generally,the closer the pressure is to that measured at 0 min,the more stable the foam is at the designated time.
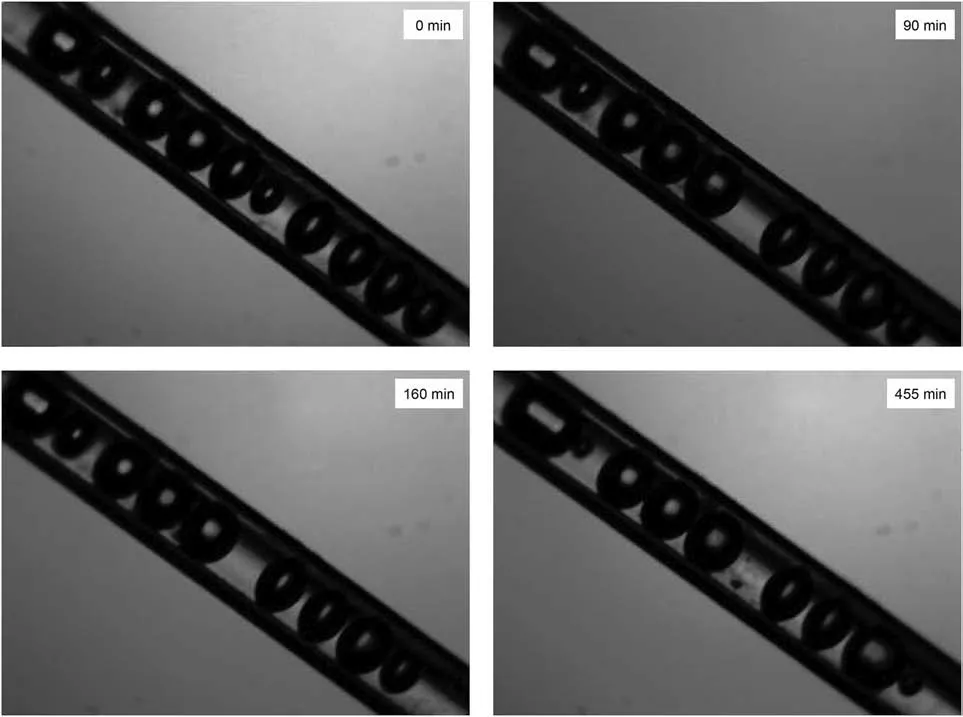
Fig.3.Photographs of the bubbles in the micron-sized channel(diameter 100μm)taken at different times.
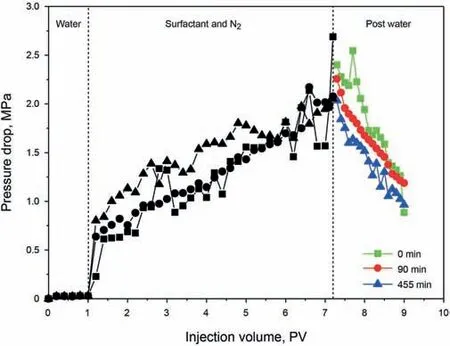
Fig.4.Pressure drops measured in sandpacks at 0,90,and 455 min after the bubbles were formed.
From Fig.4,it can be seen that the pressure drops in all the three cores significantly increased in comparison with the previous water injection pressure as the surfactant and N2were alternately injected.This indicates that foam is indeed formed by the SAG treatment in the porous media by the shearing and snap-off effect of the pores.Also,it implies the foam can effectively plug the cores and thus make the injection pressure rise.After the SAG treatment,the pressure decreases during the subsequent post-water flooding process(starting at 0 min)as the foam already generated is gradually produced from the outlet.However,the pressure drop still remains much higher than that measured at the primary water injection stage.The other two cores were left for 90 and 455 min before their post-water flooding was conducted to allow the foam therein to collapse.It is interesting to see that the pressure drops measured during these post-water flooding operations(shown in Fig.4)are only slightly lower than those measured at 0 min.They are also significantly higher than the pressure drops at the primary water injection stage.This shows that the foam still exists in the cores at 90 and 455 min after its generation and that only a small number of the bubbles therein may have coalesced.This is in accordance with the visual information presented in Fig.3.
Our foam-stability results in micron-sized channels and porous media show that the SAG foam(without polymer stabilizer)can be readily generated and has excellent stability in the micropores of real reservoirs.The bubbles in them do not readily burst,as we have seen in the most-used and traditional Warning Blender method(Fig.2).The super stability of the foam in microchannels thus makes it possible to use the foam for EOR in low-permeability reservoirs.
3.2.Size of the surfactant-gas bubbles in porous media
As foam can be used for EOR,some researchers have injected pre-prepared foam into cores to plug water and displace the oil there.It is thus believed that it is very important to match the diameters of the bubbles to the pore size in the rock as bubbles that are too large or too small will lead to insufficient plugging performance(Lv et al.,2018;Li et al.,2020).Therefore,in this part of the work,we alternately injected surfactant and N2gas into the cores to reveal the relationship between bubble diameter and pore size.
3.2.1.Effect of permeability
The surfactant and N2were alternately injected into cores with the same diameter(2.5 cm)and length(30 cm)but different permeabilities(0.086,1.2,and 2.8μm2).The average bubble diameters measured and pore sizes calculated(following methods published in the literature(Lv et al.,2018))are illustrated in Fig.5.Photographs showing the states of the bubbles formed in the cores with different permeabilities are also demonstrated.
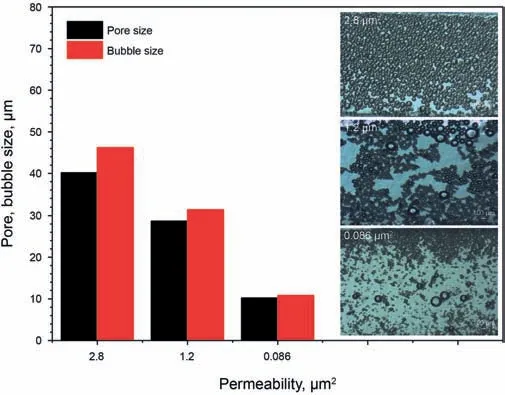
Fig.5.Sizes and states of bubbles formed in cores of different permeabilities.
The bubble images in Fig.5 prove that SAG injection into porous media does indeed generate foam therein.Secondly,it is very interesting to see that the diameters of the bubbles formed in the cores with different permeabilities are slightly larger but very close to the sizes of the pores in those cores(the pore sizes in the cores of permeability 0.086,1.2,and 2.8μm2are calculated to be 10.2,28.7,and 40.2μm,respectively,while the average diameters of the bubbles formed therein are 10.8,31.4,and 46.2μm,respectively).This indicates that when surfactant and gas were injected into a reservoir,the foam generated therein can be passively adjusted so that the size of the bubbles formed is close to the size of the pores.In other words,there is spontaneous adaptation and matching between the diameters of the bubbles and pore size of the rock without artificial design.This is probably because,under the continuous shearing effect of the rock pores,any bubbles that are too large will gradually become smaller,and bubbles that are too small will become larger by fusion,so that their diameters gradually adapt to the pore size of the rock.
To find more evidence to support this supposition,surfactant and N2were further injected into the cores of the highest permeabilities(2.8 and 1.2μm2)to form large bubbles.Then,these large bubbles were injected into the cores of lower permeability(1.2 and 0.086μm2).The diameters of the bubbles produced downstream from the low-permeability cores were then measured.The sizes and states of bubbles are shown in Fig.6.
Passive-adjustment behavior of the bubbles to self-match with the pores present is illustrated in Fig.6.For example,the average diameter of the bubbles formed in cores of permeability of 2.8μm2was previously measured to be about 46.2μm(Fig.5).When these large bubbles are injected into cores of permeability of 1.2 and 0.086μm2,the average diameters of the bubbles finally produced are 30.7 and 11.7μm,respectively.These values are close to the pore sizes of 28.7 and 10.2μm calculated for the cores of permeability of 1.2 and 0.086μm2.This shows that when large bubbles were injected into low-permeability cores,the bubbles will be passively adjusted to make their diameters close to those of the smaller pores(under the action of the shear and snap-off effects of the pores).In other words,spontaneous size-matching occurs.Size-matching also occurred when the large bubbles formed in a core with permeability of 1.2μm2were injected into a core with permeability of 0.086μm2(the final average diameter of the bubbles collected is 12.8μm which is close to the pore size of 10.2μm calculated for the 0.086μm2core).
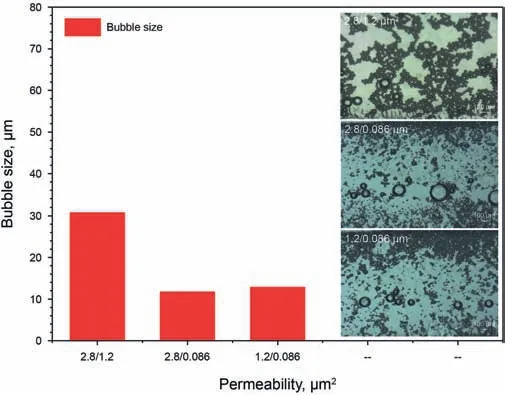
Fig.6.Sizes and states of the bubbles produced by the two-step flowing test in the high and low-permeability cores.
Therefore,contrary to some existing results and propositions in the literature(Lv et al.,2018;Li et al.,2020),the results presented here suggest that there may not be a matching problem between bubble size and rock pore size because the bubble size undergoes spontaneous passive-adjustment to match the pore size.
3.2.2.Effect of migration distance
The continuous application of the shear and snap-off effects of the rock pores on the bubbles is the main reason for their generation and diameter passive-adjustment.A natural question to ask,therefore,is:how far does a bubble need to travel for it to match the pores of the rock?To answer this question,SAG injection was conducted on cores of different lengths(5,10,15,and 30 cm).The average diameters of the bubbles produced were measured as they entered the downstream visual model of core holder#2(Fig.1)and given in Fig.7.
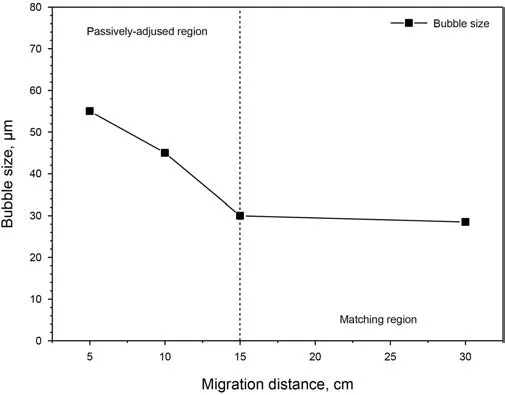
Fig.7.Average size of the bubbles produced after migrating different distances.
Fig.7 shows that the average diameter of the bubbles decreases as the bubbles travel further through a core and adapt to the pore size.More specifically,the average diameter decreases rapidly at first and then gradually tends to stabilize.There appears to be a boundary point corresponding to roughly 15 cm.In the range of 0-15 cm,the average diameter decreases rapidly with migration distance(due to the continuous shearing and snap-off effects of the rock pores on the bubbles)-beyond 15 cm,however,the decrease in diameter becomes negligible,this is because the diameter of the bubbles has been adapted to the rock throat,then,the bubbles can change smoothly to pass through the rock throat,and snap-off effects become rare,thus,the diameter of bubbles will not change significantly with the transport distance.This means that the bubbles reach a stable and pore-matching diameter after migrating just about 15 cm through the core,a distance which is negligible compared to the scale of the reservoir.Generally,this passiveadaption of the bubble diameter endows the foam with underlying excellent deep migration and profile controlling capabilities.SAG foam,in particular,may also have significant matching advantages over the more traditional solid granular agents,e.g.polymer microspheres and gel particles,in that excellent size matching between particles and pores is necessary to prevent the underlying blockage during application(Liu et al.,2018b;Pu et al.,2018).
It is noteworthy that the results here indicate that bubbles can easily achieve self-matching with pores in the rock,and the migration distance required to achieve this matching is at about centimeter-level.However,it does not guarantee that the boundary point is a constant 15 cm for all cases.For different application conditions(i.e.gas/liquid injection velocity,reservoir permeability,etc.),the boundary distance required to achieve matching of bubbles and rock may vary slightly,warranting investigation aimed at providing more evidence to verify this behavior.
3.3.Flow resistance and oil recovery using cores of different permeabilities
One of the key mechanisms by which foam achieves EOR is to plug large pores(through the Jiamin effect of the bubbles),thus reducing the mobility of the water and gas and diverting the displacing phase to low-permeability regions.To be more precise,plugging large pores causes the pressure to build up in these highpermeability regions.Eventually,the pressure will exceed the entry pressure of the capillaries in the low-permeability regions and so the fluid will penetrate these more inaccessible regions.
In this part of the work,the results of flow and oil recovery tests are presented for different permeability cores and the EOR performance of the SAG foam was determined.
3.3.1.Resistance factor
The measured pressure drops and calculated resistance and residual resistance factors are plotted as a function of injection volume in Fig.8.
As one can see from Fig.8a,the pressure drops measured for each core increase significantly during the surfactant and N2alternative injection.This indicates that the SAG foam produced can plug the rock pores and enhance the flow resistance for cores of a wide range of permeability.
As the permeability decreases from 4.580 to 0.013μm2,the largest resistance factor also decreases(from 173.0 to 14.1)even though the pressure drop established by the SAG foam increases from 0.14 to 5.40 MPa.This implies that the lower the permeability,the lower the plugging and permeability reduction.Actually,the plugging performance of the bubbles is affected by two aspects as the permeability decreases.On the one hand,the diameters of the bubbles formed in the core become smaller as the permeability decreases(see Fig.5).As a result,the capillary pressure formed by bubbles increases according to the formula for capillary force.Therefore,the additional pressure drop created due to the Jiamin effect will increase.From this point of view,the lower the permeability,the stronger the foam blocking,but on the other hand,the pressure drop across the core during the primary water injection stage increases significantly as the permeability decreases.Consequently,a larger pressure increment is needed to achieve the same degree of plugging(compared to the high-permeability situation).Thus,it becomes more difficult for the bubbles(and the resulting capillary pressure due to the Jiamin effect)to significantly increase it further.When the permeability is high,however,the initial pressure drop is very low,and so it is relatively easy for the bubbles to enhance it via capillary pressure.As a result,the SAG foam gives a better plugging effect in high permeability media(greater resistance factor and permeability reduction,see Fig.8b)than in low permeability media.

Fig.8.Flow behavior of bubbles in different permeability models.(a)Pressure drop.(b)Resistance factor and residual resistance factor.
3.3.2.Oil recovery
Five cores with different permeabilities were also used to perform oil recovery tests.The specific parameters employed,and oil recoveries measured are shown in Table 1 and Fig.9.

Table1 Physical properties of the homogeneous cores used and the oil recovery measured.
Fig.9 shows that the amount of oil recovered in the primary water flooding stage drops significantly as the permeability of the core decreases(54.3%,49.0%,43.4%,38.0%,and 36.2% when the permeability is 0.485,0.148,0.036,0.018,and 0.008μm2,respectively).Therefore,the lower the permeability,the greater the amount of oil remaining after water flooding(and the greater the potential for the foam to further enhance recovery).As a result,the incremental amount of oil recovered by SAG foam and post water flooding increases as the permeability decreases(18.6%,22.4%,27.2%,32.5%,and 33.2% when the permeability is 0.485,0.148,0.036,0.018,and 0.08μm2,respectively).The total amount of oil recovered overall decreases slightly as the permeability decreases(72.9%,71.4%,70.3%,70.5%,and 69.4%,when the permeability is 0.485,0.148,0.036,0.018,and 0.008μm2,respectively).
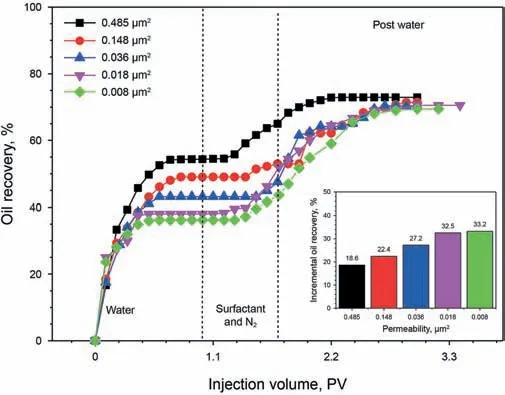
Fig.9.Oil recovery and incremental oil recovery measured in different permeability cores.
In low-permeability reservoirs,the plugging ability of the foam is relatively weak(Fig.8);however,the incremental amount of oil recovered increases.The foam can achieve spontaneous matching with the pores(Figs.5 and 6)and also shows better injectability than traditional solid particle profile control agents(which require a very high degree of matching between their particles and the pores:particles that are too large will cause blockage,while those that are too small will lead to insufficient plugging(Liu et al.,2018;Pu et al.,2018)).Overall,the foam is a promising candidate for EOR in reservoirs with a wide range of permeabilities.
As to the specific possible permeability suitable for SAG foam,it should be viewed from two perspectives:(i)For reservoirs with high temperature and high salinity which are unsuitable forpolymer-containing systems(due to the poor thermal stability of the polymer component(Seright et al.,2010)),SAG is a good candidate in a wide permeability range of 0.013-4.58μm2(Fig.8)and 0.008-0.458μm2(Fig.9)for its good plugging capacity and incremental oil recovery.(ii)For reservoirs with mild conditions(medium/low temperature and low mineralization),the SAG foam is only intended to be used in reservoirs with low permeability of a few to a dozen of mD(for example,the tested 0.013μm2(13 mD),0.018μm2(18 mD),and 0.008μm2(8 mD)),where the conventional polymer-containing foam is usually difficult to inject(Du and Duan,2004).While for higher permeability cases(without the injectivity problem of the polymer component),conventional polymerstrengthened foam may be a better choice offering better plugging of high-permeability channels(than single SAG foam).
3.4.Conformance control and oil recovery using cores with different heterogeneities
In addition to adaptability to permeability,another aspect focused upon in this study is the adaptability of the SAG foam to the reservoir heterogeneity.To investigate this,flow and flooding experiments were studied in parallel cores with different permeability contrasts.
3.4.1.Diverting performance
Fig.10 shows the changes in the relative flows through the two parallel cores of a variety of heterogeneity conditions.More specifically,six different permeability contrasts(Kmn)were considered:5.9(0.077μm2/0.013μm2),10.6(0.106μm2/0.010μm2),38.9(0.467 μm2/0.012μm2),132.3(1.455μm2/0.011μm2),260.0(3.900μm2/0.015μm2),and 312.5(5.000μm2/0.016μm2).
One can immediately see that the injected water only flows into the high-permeability core during the primary water injection stage,i.e.it does not enter the low-permeability core at all(in other words,the relative flow in the high-permeability core is 100%while that in the low-permeability core is 0% under each of the heterogeneity conditions used).This observation indicates the urgent need for profile control to further enhance oil recovery in heterogeneous reservoirs.
Fig.10 shows that,when the SAG injection is started,the generated foam effectively reduces the relative flow in the highpermeability core over a wide range of permeability contrasts of 5.9-260.Obviously,this means there is a corresponding increase in the relative flow in the low-permeability core.That is,the foam leads to excellent profile control.Therefore,even though no polymer has been used as a stabilizer,the foam still has good profile control and has the potential for EOR in reservoirs with a wide range of heterogeneities.As expected,the effectiveness of the foam to facilitate profile control is weakened as the permeability contrast becomes very large.When the permeability contrast is 260,for example,profile control can still be achieved but it is not as effective as it is when the permeability contrast lies in the range of 5.9-132.3.When the permeability contrast is further increased to 312.5,the SAG foam essentially loses the ability to improve the profile.That is to say,the SAG foam cannot be expected to work under such strongly heterogeneous conditions(or ones that are even more heterogeneous).
In general,the results of the heterogeneous parallel-core flow tests show that the SAG foam can significantly divert the path of the fluid and increase the sweep volume in zones of low-permeability.However,there is a broad limit for the application of SAG foam that corresponds to the situation in which the heterogeneity difference corresponds to a permeability contrast of~260.Beyond this limit,the foam gradually fails to improve the injection profile and becomes less effective at recovering oil(especially when the permeability contrast approaches 312.5).This may be because,when the heterogeneity is very large,the flow resistance established by the foam in the relatively high-permeability regions is not sufficient to overcome the capillary force preventing the bubbles from entering the low-permeability regions,nor overcome the starting pressure of water before flowing into the low permeability region.
3.4.2.Oil recovery
The results of the flow tests exhibit the excellent diverting performance of the SAG foam which can be used to encourage the fluid to move into the low-permeability regions over a wide range of heterogeneities(permeability contrasts 5.9-260.0).However,whether or not the SAG foam significantly enlarges the sweep to improve the recovery factor in real heterogeneous reservoirs may also depend on other factors.For example,some researchers believe that the presence of crude oil may be detrimental to the stability of the foam in reservoirs,resulting in the selective plugging of water and oil(blocking the former rather than the latter).However,any adverse effects of the residual oil on foam stability will also weaken its plugging ability in the high-permeability regions,which is not conducive to diverting the liquid to the lowpermeability regions.Another,more important,aspect is the effect of fluid heterogeneity.Specifically,if the viscosity of the underground crude oil is much larger than that of water,the primary water flooding may make the high-permeability region mainly contain low-viscosity water.Meanwhile,the low-permeability region contains high-viscosity crude oil that is not yet flowing.In this way,heterogeneity will also exist in the fluid content of the highand low-permeability regions.Moreover,the greater the viscosity of crude oil,the stronger the fluid heterogeneity generated.The superposition of this fluid heterogeneity with the permeability heterogeneity may have an even greater adverse effect on the foam flooding process.Therefore,it can be speculated that the foam may have a different diverting performance in real heterogeneous reservoirs containing crude oil from that observed in the foregoing single-flow tests(see Fig.10).
To ascertain this possibility,oil-displacement experiments were performed on parallel cores with different permeability contrasts,giving the results in Fig.11.The viscosity of the crude oil used is 9.9 mPa s,which is much greater than that of water(0.65 mPa s).The cores are 2.5 cm in diameter and 30 in length and other core parameters and measured oil recovery are listed in Table 2.

Table2 Physical properties of the parallel cores and the subsequent oil recovery measured.
When the heterogeneity is relatively weak with a permeability contrast of 3.6(Fig.11a),the primary water flooding process gives a good sweep of both the high-and the low-permeability cores(recovering 35.4% and 34.2% of the oil therein,respectively).However,at the end of the primary water stage,the relative flow in the high-permeability core has gradually increased to a high value of 72.2%,which is much higher than that in the low-permeability core(27.8%).When the SAG injection process begins,however,the relative flow in the low-permeability core significantly increases and that in the high-permeability core is reduced(demonstrating the excellent diverting capability of the SAG foam at this level of heterogeneity).As a result,the amount of oil recovered from both cores is significantly increased by 39.4% and 39.5%,respectively.The overall incremental oil recovery from the whole parallel model is 39.4%.This large amount of incremental oil recovery confirms that the SAG foam has excellent adaptability when a real reservoir with a permeability contrast of 3.6 is encountered.
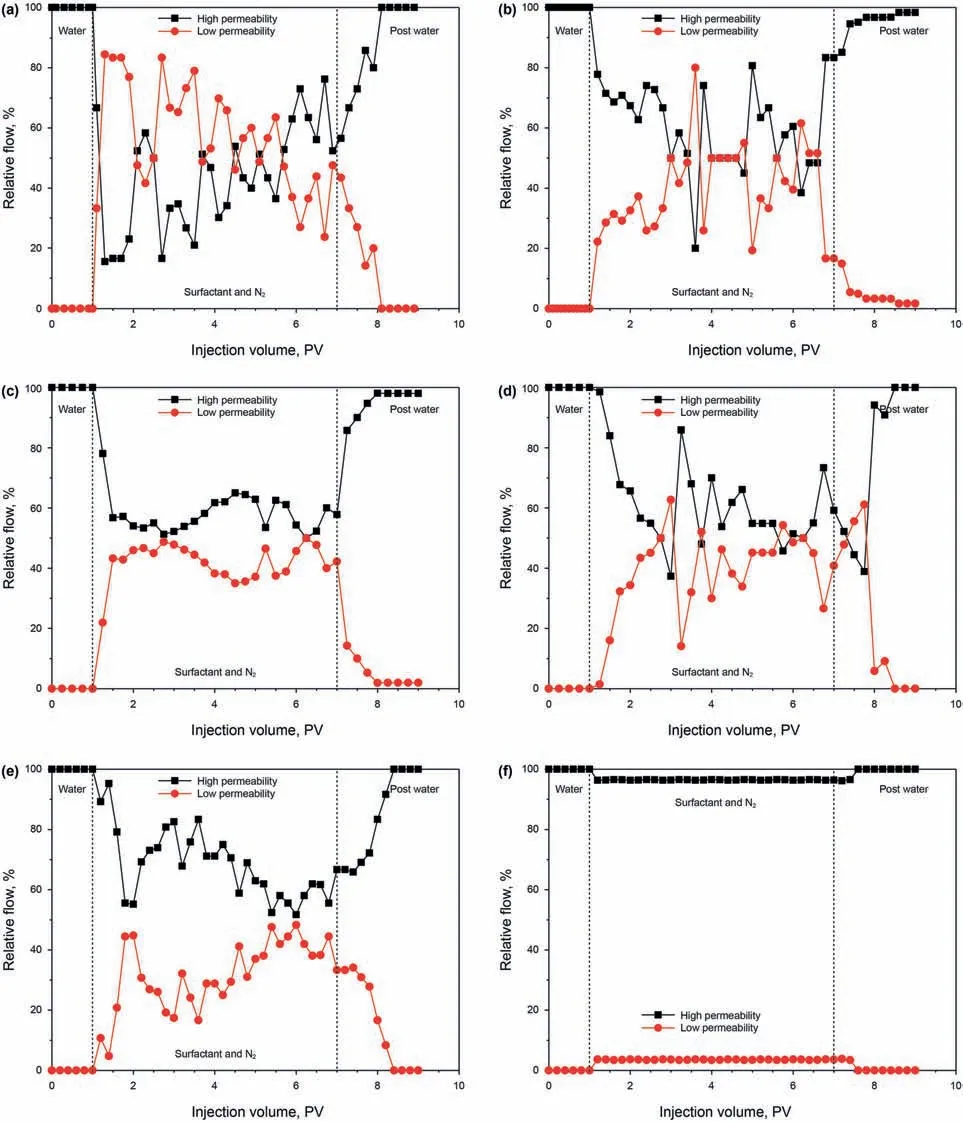
Fig.10.Effect of SAG foam on the relative flow through parallel cores with different heterogeneities corresponding to permeability contrasts of(a)5.9,(b)10.6,(c)38.9,(d)132.3,(e)260.0,and(f)312.5.
When the permeability contrast is increased to 12.0(in Fig.11b),the primary flooding water fails to enter the low-permeability core(the relative flow therein is 0%;that in the high-permeability core is therefore 100%).As a result,the oil recovery from the high-and low-permeability cores after primary water flooding is 48.4% and 0.0%,respectively.During the subsequent SAG injection process,the relative flow in the low-permeability core is slightly enhanced,rising to 6.3%(so most,93.7%,still occurs in the high-permeability core).This demonstrates limited profile adjustment produced by the SAG foam when the permeability contrast is 12.0.Consequently,the incremental oil recovered from the high-and low-permeability cores using SAG foam and post water flooding are 15.8%and 12.9%,respectively.The overall increment is only 14.8% from the parallel cores.
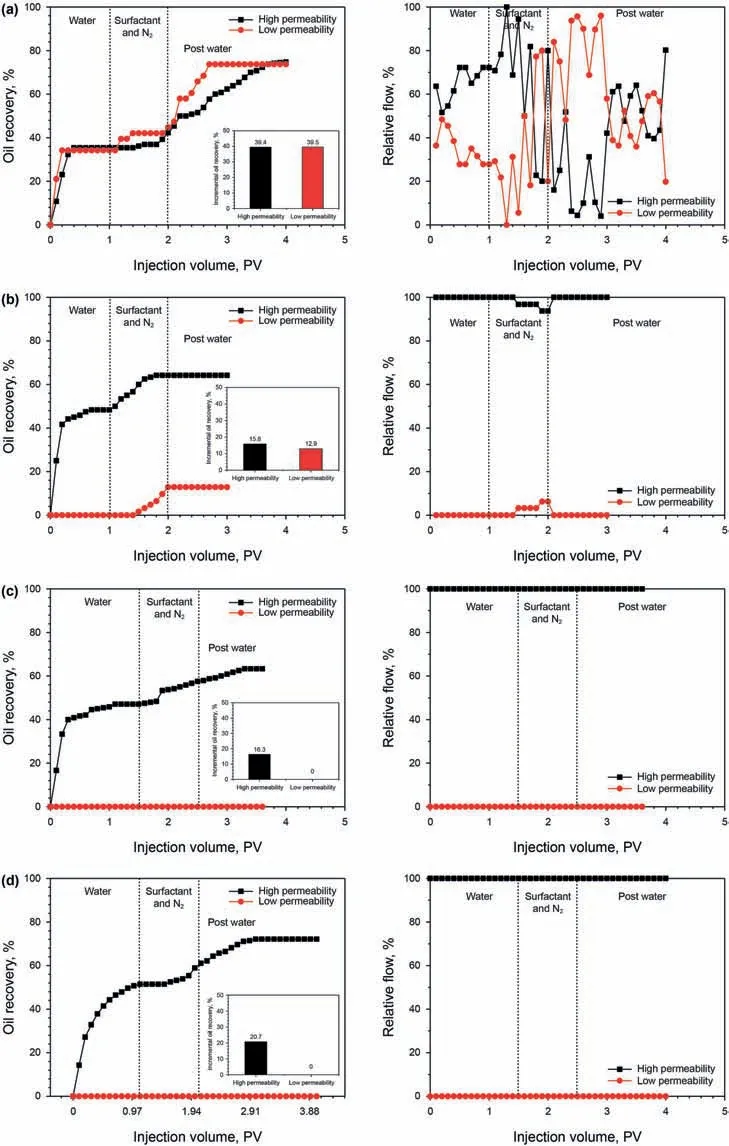
Fig.11.Oil recovery and relative flow measured in four models with different heterogeneities corresponding to permeability contrasts(Kmn)of:(a)3.6,(b)12.0,(c)24.3,and(d)51.0.
The relative flow data measured by the previous flow tests(in Fig.10)and by the current oil displacement tests(in Fig.11)shows some significant differences.In the former,SAG foam is found to be able to significantly improve the injection profile and increase the relative flow in the low-permeability core from 0%to at least~50%even when the heterogeneity is strong(permeability contrast of 38.9-260.0).However,the oil displacement results imply that the profile improvement obtained using SAG injection is very weak even when the permeability contrast is just 12.0.This is because:(i)The volume of SAG foam injected for oil flooding is only 1.0 PV(instead of the 6.0 PV used in the previous flow tests),which is an amount that is closer to the actual amount used in real reservoirs.(ii)The crude oil trapped in the core may have decreased the stability of the SAG foam,reducing its ability to plug the highpermeability core and thus damaging its ability to divert the fluid to the low-permeability core.(iii)Last,but most importantly,fluid heterogeneity occurs in the parallel cores after the primary water flooding-the high-permeability core will mainly have lowviscosity water flowing inside it,while the low-permeability core contains high-viscosity crude oil that is not yet flowing.The superposition of both fluid and permeability heterogeneity intensifies the heterogeneity of the system,making the SAG foam less effective(Fig.11)than it is in the previous flowing tests(Fig.10).
So,there are a few lessons to learn from these results:(i)Reservoirs that contain crude oil with a viscosity of~9.9 mPa s have a heterogeneity limit for the successful application of SAG foam corresponding to a permeability contrast of about 12.0.Within this limit,the SAG foam is very good at diverting the fluid from the highto the low-permeability regions,helping to remove the oil there.Beyond this limit,however,the foam may become ineffective.(ii)This heterogeneity limit for SAG application is not fixed,depending on many other factors,e.g.the viscosity of the crude oil.Specifically,the larger the viscosity of the crude oil,the stronger the fluid heterogeneity after primary water flooding,which reduces the effect of the foam flooding and narrows the heterogeneity limit for its successful application.Conversely,the lower the viscosity of the crude oil,the smaller the fluid heterogeneity after primary water flooding,which will help to expand the heterogeneity range open to SAG treatment.(iii)When it comes to evaluating the heterogeneityadaptability of profile-control agents in the future,we should not base our judgment only on the results of flow tests in parallel models.Rather,we should perform,and consider,the results of parallel model flooding tests,especially when the viscosity of the crude oil is high.This is because we have to consider not just the permeability heterogeneity,but also the fluid heterogeneity.
To verify the recommendations above,oil-displacement experiments were further conducted under strongly heterogeneous conditions(permeability contrast of 24.3-51.0).Fig.11c and d illustrate that the injection of SAG foam is not able to divert the fluid into the low-permeability cores at all under these conditions.The relative flow in the low-permeability core stays at 0%and no oil is removed from it by the SAG foam.As predicted,the SAG treatment fails under such severely heterogeneous conditions.It is notable that foam injection can still significantly increase the amount of oil recovered from the high-permeability cores under the heterogeneity conditions discussed above(increments of 16.3%and 20.7% at permeability contrast of 24.3 and 51.0,respectively).This also leads to a certain increase in the total oil recovery of 14.1%and 18.2%.However,it is also worth noting that the high-and lowpermeability cores used here are of equal size.In practice,in real reservoirs,the volume of the high-permeability region(the‘thief’layer)may be much smaller than that of the low-permeability region.This may reduce the contribution made by the highpermeability region to the total amount of EOR from the reservoir as a whole.As a result,the performance of the SAG foam may be even worse in real reservoirs under such severely heterogeneous conditions,thus making it inapplicable for EOR.
4.Conclusions
In this research,a systematic study of the adaptability of surfactant-alternating-gas foam for EOR from low-permeability and heterogeneous reservoirs was undertaken.The stability of the foam,the bubble size in porous media,and,more importantly,the permeability and heterogeneity adaptability of the foam were focused upon.The main conclusions can be summarized as follows:
(1)In micron-sized and constrained spaces,bubbles tend to make point contact instead of accumulating together(as they do in an unconstrained space),which weakens the plateau liquid discharge effect,making them highly stable.The bubbles could remain stable for at least 455 min in such micron-sized channels,which is much longer than the 90 min measured in the continuous three-dimensional space by Warning Blender method.
(2)Direct visual observation shows that bubbles are indeed generated by the shearing and snap-off effects of the pores during the alternate injection of surfactant solution and gas.More importantly,those bubbles formed can be passively adjusted to make their diameters spontaneously match the size of the pores.This endows them with excellent deepmigration and profile-control capabilities.
(3)Reducing the permeability can decrease the plugging capacity of the SAG foam in terms of resistance factor and residual resistance factor.However,the lower the permeability,the greater the amount of oil remaining after water flooding,and the greater the potential for further EOR.As a result,the incremental oil recovery using the SAG foam increases,showing its excellent adaptability for EOR in media with a wide range of permeability.
(4)There is a heterogeneity limit for the application of SAG foam to EOR,beyond which it may become ineffective.For reservoirs containing crude oil with a viscosity similar to that used here(9.9 mPa s),this limit corresponds to a permeability contrast of about 12.0.
Acknowledgement
The authors wish to thank the Natural Science Foundation of Shandong Province of China(Grant No.ZR2020ME089),and the National Natural Science Foundation of China(Grant No.51504275 and 5207433)for their financial supports.
- Petroleum Science的其它文章
- Sedimentary characteristics and implications for hydrocarbon exploration in a retrograding shallow-water delta:An example from the fourth member of the Cretaceous Quantou Formation in the Sanzhao depression,Songliao Basin,NE China
- Study of the gas sources of the Ordovician gas reservoir in the Central-Eastern Ordos Basin
- A novel hybrid thermodynamic model for pore size distribution characterisation for shale
- Microstructural analysis of organic matter in shale by SAXS and WAXS methods
- Investigation of oil and water migrations in lacustrine oil shales using 20 MHz 2D NMR relaxometry techniques
- Fast least-squares prestack time migration via accelerating the explicit calculation of Hessian matrix with dip-angle Fresnel zone

