Performance Analysis of Periodic Query Polling System Based on Asymmetric Dual-Queue Threshold Services*
Man Cheng,Xinchun Wang,Jinghong He,Caiyun Ding
(School of Physical and Electronic Science,Chuxiong Normal University,Chuxiong,Yunnan Province 675000,China)
Abstract:Based on establishing the mathematical model of the system and defining the parameters,using the embedded Markov chain and probability generating function as Probabilistic methods,the discontinuous-time,two-queue different gated polling system has been fully analyzed,the low-and higherorder properties and cycle period of the system are deduced,and the average queuing length and average waiting delay of information packets are calculated accurately.The simulation experiments agree well with the theoretical calculations.The analysis further deepens the cognition of the asymmetric threshold polling system,lays a foundation for research on the asymmetric threshold polling system,and has a positive significance for a better and more flexible control polling system.
Key words:asymmetric;dual-queue;Periodic Query;gated polling system;two-order property;average waiting delay
1 Introduction
Due to the difficulty of research on asymmetric polling systems[1-5],it usually begins with the analysis and discussion of asymmetric polling systems with two queues.Therefore,the performance of the two-queue asymmetric threshold service system is deeply analyzed and studied in this paper to lay a solid foundation for the research on the multi-queue threshold asymmetric polling system.As is known to all,the periodic query queuing service system has been widely used in communication systems and computer networks[6-9].However,for the periodic query queuing service system,parameters such as the number of information packets entering the network at any time,the time of packet service and the transfer time are all random variables,so the analysis of its related performance has considerable complexity[10-13].Especially in the study of asymmetric systems[14-17],because there are still some problems in the analysis method,the results are local results obtained under certain limited conditions,and some precise parsing is given in the literature[18-23].Based on the literature[24,25],this study adopts the method of embedded Markov chain and probability generation function to parse the asymmetric threshold service system of discrete-time type and the double queue of periodic query type,deduce the low-and higher-order characteristic quantities of the system,calculate the average queue length and average cycle period as well as the exact solution of the average waiting delay.The simulation results are in good agreement with the theoretical calculations.This study lays a foundation for the research on the multi-queue asymmetric threshold service polling system and has a positive significance for a more flexible control polling system.
2 Theoretical model of the asymmetric threshold service
2.1 Physical model of the asymmetric threshold serviceThe dual-queue asymmetric threshold service receives service on a first-in,first-out basis in the same queue.Both Queue one and Queue two are running in threshold service policy mode.In the first queue,When the current threshold information packet is serviced,the newly added information packets in the service process should be accumulated until the next polling cycle before service is performed.Transition to queue two service after a transition time,the service of queue two only serves the current threshold information packet until the service is complete,then switch to queue one for the next round of service after a transition time.The physical model of the asymmetric threshold service is shown in Figure 1.
Buffer queue for any input,the number of information packets reaching its buffer in any unit time is independent and identically distributed.The probability generating function,mean and variance of the distribution of the number of information groups in the queue areThe probability generating function,mean and variance of the transformation time distribution areR j(z j)、r j=The probability generating function,mean and variance of service time distribution areThe abovei,j k=1,2.The buffer storage capacity of each queue is large enough to not cause packet loss.Services in each queue are done on a first-come,firstserved basis.
In order to facilitate the analysis of the queuing system,the following random variables will be defined.u i(n)is the query conversion time for waiter starting service objectito service objecti+1 at thet n.v i(n)is the time when waiter starts serving for the service objectiat thet n.μj(u i)is the number of information groups when the waiter goes into Queuejat theu i.μj(v i)is the number of information packets entered by the waiter in the service objectjwithinv i.ξi(n)is the number of information packets queued in the service objectiat thet n.For asymmetric two-queuesi,j=1,2.

Fig.1 Physical model of the asymmetric dual-queue threshold service
2.2 State variable expressionFor a two-queue asymmetric threshold service polling system,when querying the threshold service queue at thet n+1,it shows the following relation:

at thet n+1when querying gated service queue.
2.3 Probability generating function of state distributionFor a two-queue asymmetric threshold service polling system,the systematic probability generating function expression is:

Combined(1),(2)and(3),the systematic probability generating function expression is

TheG1(z1,z2)in(4)is probability generating function of state distribution of information packet in threshold 1st Queue.TheG2(z1,z2)in(5)is probability generating function of state distribution of information packet in threshold 2nd Queue.
3 Theoretical analysis of system performance indicators
3.1 Parse low-order characteristic quantitiesExpression:

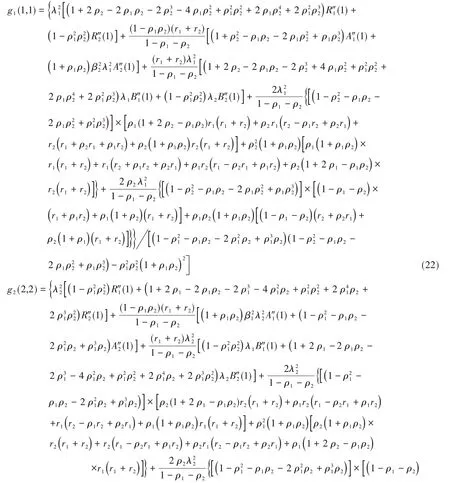
Parse(4),(5)and(6),the following expression can be obtained.

Resolve(7),(8),(9)and(10)jointly,the paper obtains

Average length of queue

3.2 Resolve two-order characteristicsDefine:

The equation can be obtained by a reduction and by resolving(4)and(5)according to(15).

By solving(16),(17),(18),(19),(20),and(21),the high-order feature quantities can be obtained.


3.3 The average waiting time of the systemIn the periodic query threshold service,the average waiting time of the service object is the average waiting time of the information packet from entering the queue to the start of the service.From the reference[24],the average waiting delay of the two queues of the gate service can be obtained.

4 Numerical calculation and experimental simulation
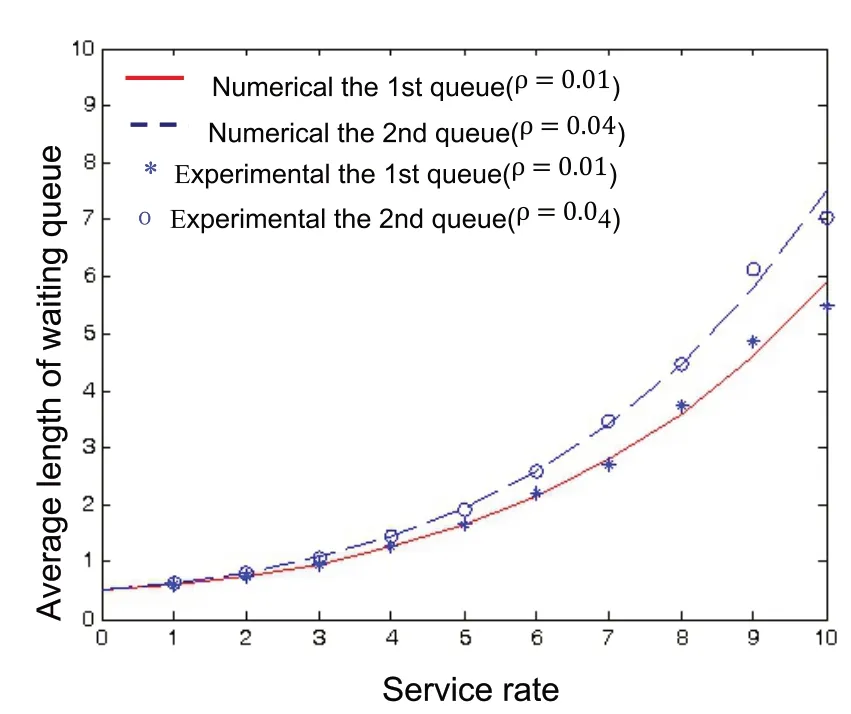
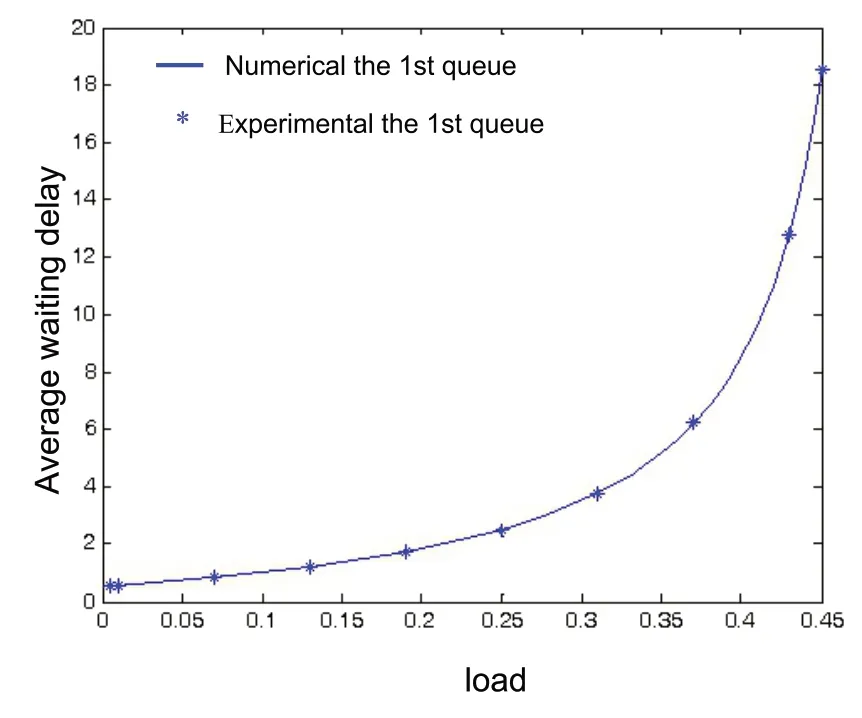
Numerical calculations are from theoretical analysis.Programming and simulation experiments are carried out according to the operating mechanism of the system.Let the arrival process of each queue in any time slot obey the Poisson distribution.The channel rate is 54 Mbit/s,the message packet length is 2700 bit;the query conversion time is 10μs;the slot width is 10μs.And the numerical calculation is consistent with the simulation experimental parameters.Set polling numberM=106.Whenr1=r2=1,λ1=0.01,λ2=0.04,the average-length of the first and the second queue changing with service-rate is shown in Figure 2.Set polling numberM=3×10⁶.Whenr1=r2=1,β1=1,β2=3,the average-length of the first and the second queue changing with arrival-rate is shown in Figure 3.Set polling numberM=5×10⁷.Whenβ1=β2=10,λ1=0.01,λ2=0.04,the average waiting time changing with shifting-time is shown in Figure 4.If the first and the second queue are exactly the same,running the number of polling cyclesM=5×10⁷the average waiting time changing with the variation-load is shown in Figure 5.

Fig.2 The average-length of the 1st and second queue changing with service-rate

Fig.3 The average-length of the 1st and second queue changing with arrival-rate

Fig.4 Comparison between simulation and theoretical calculation results of average length of Queue 1 and 2 varying with shifting-time

Fig.5 Comparison between simulation and theoretical calculation results of average length of Queue 1 and 2 varying with the variation-load
5 Discussion on simulation experiment and numerical calculation results
Referring to Figure 2,it can be seen that the average queue length and average waiting delay changes with the variety ofβiwhenλiandγiremains constant.Look at the two types of plots in Figure 2 and it can be seen that the average waiting delay changes faster ifλiis changing.Average waiting delay is bigger ifλiis bigger and whenβiremains constant.Experiment results and theoretical analysis expression(24)and(25)are consistent.In practice,the experimental results are approximately equal to the theoretical numerical calculations.There is a certain deviation.The main factor is that the number of polling statistics loops is too small,onlyM=106.If the number of polling cycle statistics is further increased,the error between the experimental value and the theoretical value will be further reduced.
By viewing Figure 3,it can be seen that the average queue length and average waiting delay changes with the variety ofλiwhenβiandγiremains constant.Viewing in Figure 3 and it can be seen that the average waiting delay changes faster ifβiis variety.Average waiting delay is bigger ifβiis bigger and whenλiremains constant.Experiment results and theoretical analysis expression(24)and(25)are consistent.Experiment results and theoretical analysis expression(24)and(25)are consistent.Experimental data are subject to minor deviations.This is due to the polling statistics loop count reachingM=3×10⁶.If the number of polling cycle statistics is further increased,the error between the experimental value and the theoretical value will be smaller.
Referring to Figure 4,it can be seen that the average queue length and average waiting delay changes with the variety ofγiwhenλiandβiremains constant.Look at the two types of plots in Figure 4 and it can be seen that the average waiting delay changes faster ifρiis changing.Average waiting delay of the ones with lighter loads is smaller when shifting-time remains constant.Experiment results and theoretical analysis expression(24)and(25)are consistent.Experimental data are subject to minor deviations.This is due to the polling statistics loop count reachingM=3×10⁶.If the number of polling cycle statistics is further increased,the error between the experimental value and the theoretical value will be smaller.
By viewing Figure 5,it can be seen that the average queue length and average waiting delay changes with the variety ofρiwith the sameγiWhen the two queues are set to be symmetrical.Experiment results and theoretical analysis expression(24)and(25)are consistent.Deviation of experimental data are minimal.This is due to the polling statistics loop count reachingM=5×10⁷.If the number of polling cycle statistics is further increased,it can also improve the quality of the data and further reduce errors.
By comparing Figures 2,3,4,5,it can be seen that the deviation between the simulated experimental value and the numerical calculation value is further reduced with the increase of the threshold polling times.Proven by experiment,if you take the statistical polling timesM≥108,the error can be controlled within 1%under heavy load.
When the network system operates with symmetric parameters,Formulas(24)and(25)of theoretical analysis are simplified to formula(20)in Reference[24]under the sameN=2 condition.
6 Summary
The article is based on the establishment of a theoretical model and the definition of system-related parameters,The embedded Markov-chain and the probability generating function of the system state variables are used to accurately analyze the Two-Queue Asymmetric Threshold Service System,The low-order characteristic quantity,high-order characteristic quantity and query period of the system are deduced,The average queue length and average waiting delay of the system are accurately calculated.The results of the simulation experiment based on the operation mechanism and the theoretical analysis and numerical calculation are in good agreement.The article lays a foundation for the research on the related problems of multi-queue asymmetric threshold service polling system to further deepen the cognition of the asymmetric threshold polling system and further expand the research space of polling system.

