
Kinetic study of key species and reactions of atmospheric pressure pulsed corona discharge in humid air
2022-06-01 07:55:58YongkangPENG彭永康XiaoyueCHEN陈小月YeqiangDENG邓冶强LeiLAN蓝磊HaoyuZHAN詹皓予XuekaiPEI裴学凯JiahaoCHEN陈嘉豪YukuanYUAN苑玉宽andXishanWEN文习山
Plasma Science and Technology 2022年5期
关键词:永康
Yongkang PENG(彭永康),Xiaoyue CHEN(陈小月),Yeqiang DENG(邓冶强),Lei LAN (蓝磊), Haoyu ZHAN (詹皓予), Xuekai PEI (裴学凯),Jiahao CHEN (陈嘉豪), Yukuan YUAN (苑玉宽) and Xishan WEN (文习山)
The School of Electrical Engineering and Automation, Wuhan University, Wuhan 430072, People’s Republic of China
Abstract In this study,we examined the key particles and chemical reactions that substantially influence plasma characteristics.In summarizing the chemical reaction model for the discharge process of N2-O2-H2O(g)mixed gases,65 particle types and 673 chemical reactions were investigated.On this basis,a global model of atmospheric pressure humid air discharge plasma was developed,with a focus on the variation of charged particles densities and chemical reaction rates with time under the excitation of a 0-200 Td pulsed electric field.Particles with a density greater than 1%of the electron density were classified as key particles.For such particles,the top ranking generation or consumption reactions(i.e.where the sum of their rates was greater than 95%of the total rate of the generation or consumption reactions)were classified as key chemical reactions.On the basis of the key particles and reactions identified,a simplified global model was derived.A comparison of the global model with the simplified global model in terms of the model parameters,particle densities,reaction rates (with time),and calculation efficiencies demonstrated that both models can adequately identify the key particles and chemical reactions reflecting the chemical process of atmospheric pressure discharge plasma in humid air.Thus,by analyzing the key particles and chemical reaction pathways,the charge and substance transfer mechanism of atmospheric pressure pulse discharge plasma in humid air was revealed,and the mechanism underlying water vapor molecules’influence on atmospheric pressure air discharge was elucidated.
Keywords: atmospheric humid air, key charged particles, key chemical reactions, reaction pathways
1.Introduction
The traditional corona discharge fluid model considers only electrons, positive and negative ions, and the discharge parameters are determined using the simplified weighting method involving the partial pressure ratio.Atmospheric pressure discharge plasma in humid air involves three main neutral gas molecule types:N2,O2,and H2O(g).However,the discharge process involves many types of particles and chemical reactions, and the charge and substance transfer processes are complex.The influence of humidity on plasma reactions of corona discharge is significant and complex[1,2].On the basis of the corona discharge test using a wireplate electrode configuration,Abdel-Salam[3]concluded that although the addition of water molecules increases the effective collision cross section of the ionization region and enhances ionization, water molecules increase the absorption coefficient and weaken effective ionization.Hence, as this addition increases the photoabsorption coefficient and enhances ionization, it simultaneously reduces the electron migration rate and weakens ionization.Because the complex macroscopic law of corona discharge is closely related to its microscopic plasma reaction process, studying the chemical reactions of corona is a direct and fundamental methods of solving this problem.Studies[4-7]have shown many chemical reactions in humid air corona discharge,but only a few of those reactions play key roles.The reaction rate coefficient is a key parameter in a chemical reaction and must be matched with the corresponding gas components,pressure,temperature,and other conditions.However, in extended research processes, repeated indirect references of these data can lead to the reaction rates of some reactions being used under mismatched conditions,which introduces errors.Therefore, studying the key particles and chemical reactions of corona plasma is a process of eliminating complexity and understanding the main plasma reaction characteristics of corona discharge in humid air.
At present,two mainstream methods are used to simulate plasma chemical reactions.Some researchers [6, 8-13] have selected the global model to include maximal chemical reactions and present the chemical reaction pathways as completely as possible; other researchers [14-19] have selected the fluid model or particle model, emphasizing the temporal and spatial evolution law of corona discharge with the hope of including as few chemical reactions as possible to reduce the level of model complexity.
Although the corona is typical partial discharge in extremely inhomogeneous field, the global model can be regarded as a point in the actual corona space,just because of the characteristics of homogeneous spatial distribution.In this way, we can ignore the spatial characteristics of corona discharge,and focus on the reactions.It is the biggest advantage of global model,so that we can take so many reactions in the model.The large number of complex reaction equations and corresponding reaction rates in plasma chemistry are key inputs for calculations based on the global model.Over many years of research, a considerable amount of plasma chemical reaction data has been accumulated.The US National Institute of Standards and Technology chemical kinetics database stores almost all elementary reaction kinetics data published after 1906 [20].LXCat, a data exchange project involving information required for plasma modeling, such as collision cross section and group parameters,was also established after the 2010 Gaseous Electronics Conference[21,22].Moreover,Xi’an Jiaotong University established a basic database of gas discharge data [23].Thus, a large quantity of basic chemical reactions data related to nonisothermal humid air plasma discharge has been obtained, and numerous research results have been published based on these basic data.
The research team from the Plasma Lab for Applications in Sustainability and Medicine-Antwerp at the University of Antwerp in Belgium have focused on the reaction pathways of bioactive substances under plasma conditions.Gaens et al [6]studied the chemical process of argon plasma after the introduction of humid air; the chemical reaction pathways of 84 particles types and 1880 chemical reactions were studied using the global model.The variations in the density distribution of the main active particles along with temperature, humidity, and power density were recorded.A simplified chemical reaction model was also proposed.The reaction data are evaluated at each calculation time step,and only the reactions that contribute more than 10% to the generation or consumption of a certain substance are retained for model calculation.This simplified method improves the calculation speed of the model.Also Gaens and Bogaerts [8] revealed the reaction pathways of bioactive substances such as N2(A),O,O3,O2(a),N,H,HO2,OH,NO,NO2,N2O5,H2O2,and HNO2as well as the influence of humidity on them.Wang et al[9]considered 78 types of particles and 1792 chemical reactions with a similar method, and the active substances and chemical reaction pathways of CO2and CH4were analyzed after the introduction of humid air.
Liu et al studied the active particles and chemical reactions produced by the introduction of humid air into gas plasmas[10-13].46 types of particles and 577 reactions were considered, and a plasma chemical reaction model and the influence of humidity on the density of the bioactive substances in He + H2O mixed gas at atmospheric pressure were studied in [10].A simplified method of the model was proposed, and the results obtained using several screening thresholds were compared; a simplified plasma chemical model was derived by retaining the particles with concentrations of 0.5% (and 5%) of the total gas concentration and the reactions with contributions to the formation or consumption of a substance of more than 2%(and 10%).The maximum relative error between the material density of the proposed and original models was 20% (and 60%).They considered 20 particles types and 168 reactions, a chemical reaction model of He + H2mixed gas plasma was used to study the influence of H2content in the mixed gas on the product in [11].After the simulation calculation entered a stationary state, the particles with a particle density greater than 5%of the total density of all positive ions were retained as key particles, and the reactions that contributed more than 5% to the formation or consumption of key particles were retained as the key reactions.Through such simplification,the key particles and chemical reaction pathways were obtained based on the H2(v) reaction model.The influence of power density, gas composition, discharge area, and environmental temperature on active particles in humid air plasma was studied [12].The reaction model used was that proposed in[24,25].The key particles and chemical reaction pathways in a Ar + H2O plasma chemical model were studied with varying levels of water vapor content by considering 57 particle types and 1228 chemical reaction pathways [13].
The aforementioned works have demonstrated that even in similar atmospheric conditions, the particles and reactions employed in the development of plasma chemical models differ markedly among studies.For now, listing all the reactions involved with the plasma chemical process in humid air remains impossible.Therefore,researchers have arranged and summarized the verified reactions and predictions.Sakiyama et al [24, 25], established a global model containing N2, O2,and H2O(g) mixed gas at atmospheric pressure.It is composed of 53 particle types and 624 chemical reactions.It is considered representative and widely cited by researchers in relation to the plasma chemical process.In later works,Murakami et al investigated the influence of CO2[26,27]and the effects of humidity on the main products and reaction pathways of He(g) plasma at atmospheric pressure by using the He(g) and humid air [N2, O2, H2O(g), CO2] mixed gases and considering 59 particle types and 1048 chemical reactions.Wang et al[28]simulated the plasma chemical process generated by corona discharge around a transmission line under atmospheric pressure humid air conditions,considering 69 particle types and 393 chemical reactions.The influence of the power waveform and moisture concentration on the density of substances was also analyzed.
The chemical kinetic model (global model) entails few calculations and can accurately determine the composition of discharge particles, but it does not involve consideration of the physical field and particle movement process in plasma.The fluid model is computationally intensive but can describe the temporal and spatial distribution characteristics of charged particles.Particle components can be obtained using the chemical kinetic model, and the spatiotemporal evolution characteristics of each particle can be determined using the hydrodynamic method.Consequently, the complex generation, disappearance, and transport behaviors of charged particles in the microscopic development of humid air corona discharge can be studied.The joint simulation of the chemical kinetic and fluid models proposed by Rong et al[29]is highly effective at revealing the microscopic mechanism of complex plasma.
When the chemical kinetic and fluid models are used in this joint simulation, only the most critical reactions are typically considered, thus minimizing the model calculation requirements.For example,Wu[14]selected 36 key chemical reactions according to experimental results when calculating the pulse current of corona discharge, and the corona current pulse in dry air (N2-O2mixed gas) at atmospheric pressure was successfully modeled using the chemical kinetic and fluid model joint simulation.Chen and Du [15, 16] considered 28 reactions and successfully simulated the continuous pulse sequence of corona discharge in dry air(N2-O2mixed gas)at atmospheric pressure by using the chemical kinetic and fluid model joint simulation.Chen and Wang [17] focused on the plasma chemical reaction process of O3in humid air corona discharge, considering 50 chemical reactions closely related to O3and calculating the influence of humidity on the ozone yield, electron energy, and electron density by using the chemical kinetic and fluid model simulation.Sarrette et al[18] compared the plasma chemical reactions produced by DC corona discharge in dry and humid air based on 28 ion reactions.In [19], the variation of plasma density in a gas diffusion wake excited by a short-pulse microwave or laser was studied based on 21 chemical reactions.
Extracting key particles and chemical reactions to establish a simplified reaction model is a method that sacrifices model accuracy to improve calculation efficiency.Depending on research purposes,differences in the weights of each article and reaction and the screening of key particles and chemical reactions are critical.However, the aforementioned studies have reached no consensus on the key particles and reactions in the chemical process of humid air corona discharge plasma.In the present study,based on the chemical reaction model proposed in Sakiyama et al [24], which included 65 particle types and 673 chemical reactions, the chemical reaction models of the mixed gas discharge of N2,O2, and H2O(g) were summarized, and a global model of atmospheric pressure discharge plasma in humid air was developed.The key chemical reaction pathways of corona discharge in humid air were derived by extracting the key particles and chemical reactions related to the humid air corona discharge process in the global model.The reaction road map was used, the reaction process of water molecules involved in humid air corona discharge was studied, and the water vapor molecule mechanism influencing atmospheric air discharge was clarified.In the future, the influence of migration and diffusion to the plasma reactions of corona discharge process can be conquered by introducing the key species and reactions to a fluid model.
2.Global model of plasma reactions of humid air corona discharge
2.1.Size of discharge area
The simulation calculation domain was a cylindrical plasma discharge area with a radius of 0.4 cm and a height of 0.4 cm.Due to volume averaging being applied in the global model,spatially related physical quantities were homogeneous throughout the calculation domain.
2.2.Power supply
The pulse electric field loaded on the reactor is obtained as follows:
where E0= 6.75 MV m-1,which represents the amplitude of the applied electric field,andtpls= 1 ns,which represents the duration of a single pulse of plasma discharge.
Because we mainly focused on the charged particles and those particles only existed in the reaction process for a short time, the simulation time examined in this study was 1 ns to 100 μs.What is more, the migration and diffusion characteristics of corona do influence the species’ densities, and then affect the chemical reaction, but this influence is negligible in a 1 ns pulsed electric field and the subsequent time when the electric field is zero.
2.3.Governing equations
The electronic governing equations are as follows:
where neis the electron density(m-3),niis the density of the ith substance (m-3), and Ziis the charge amount of the ith substance (Ziis -1, 0, or 1).
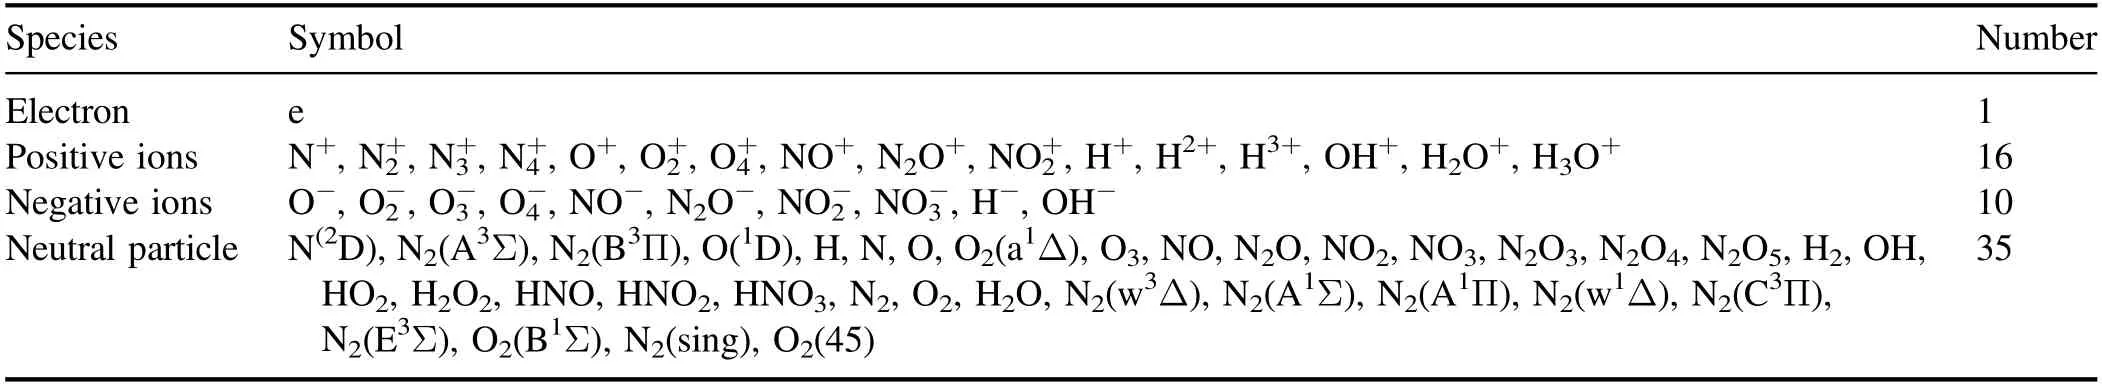
Table 1.All particles of humid air corona discharge included in the model.
The control equation of heavy species is as follows:
where Rkis the rate expression of the kth reaction(m-3s-1),l is the number of reactions related to the ith substance,and Γ is the flux of substance niflowing out through the boundary reaction.
The reaction rates are obtained as follows:
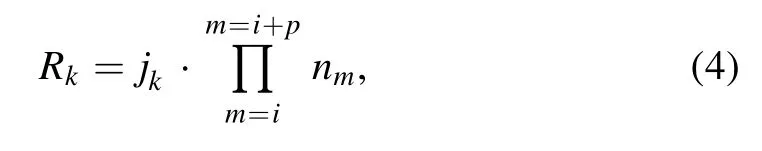
where jkis the rate coefficient(constant)of the kth reaction,nmis the density (mol m-3) of the mth substance involved in the kth reaction, and p is the substance species of the kth reaction.
2.4.Initial conditions
The air pressure condition of the model is one of atmospheric pressure, and the ambient temperature is defined as 300 K.The gas composition is N2:O2:H2O = 79:20:1.All particles of humid air corona discharge included in the model is shown in table 1.
2.5.Particles included
To ensure the model would converge as soon as possible,the initial density of positive and negative ions is defined as 1×10¹³m-3,and the initial density of electrons is obtained according to the electrical neutrality.The remaining neutral gas substances are almost zero before discharge, and their volume fraction is 1×10-13.Because N2(w3Δ), N2(A1∑),N2(A1∏), N2(w1Δ), N2(C3∏), N2(E3∑), O2(B1∑), N2(sing),and O2(45) do not participate in the subsequent ion reaction,they are regarded as N2molecules and O2molecules in the study of key particles and are not analyzed separately.
3.Model results and verification
The first 624 reactions in the model presented in this paper are based on the model proposed by Sakiyama et al [24] and reactions 625-673 are listed in table A1.The results are compared with those in reference 24.Moreover, the present study primarily investigated the discharge process and the density of charged particles.
Figure 1 illustrates the change trends of charged particles in the present study, which were generally similar to those recorded by Sakiyama et al [24]; only local differences were noted, indicating that the global model established in this work is highly consistent with the model of Sakiyama et al[24] and can adequately reflect the plasma chemical process of pulsed corona discharge in humid air.
Figure 1 indicates that the electron density was equal to the difference between positive and negative ion density obtained based on the electron control equation, with the difference at a reasonable level.
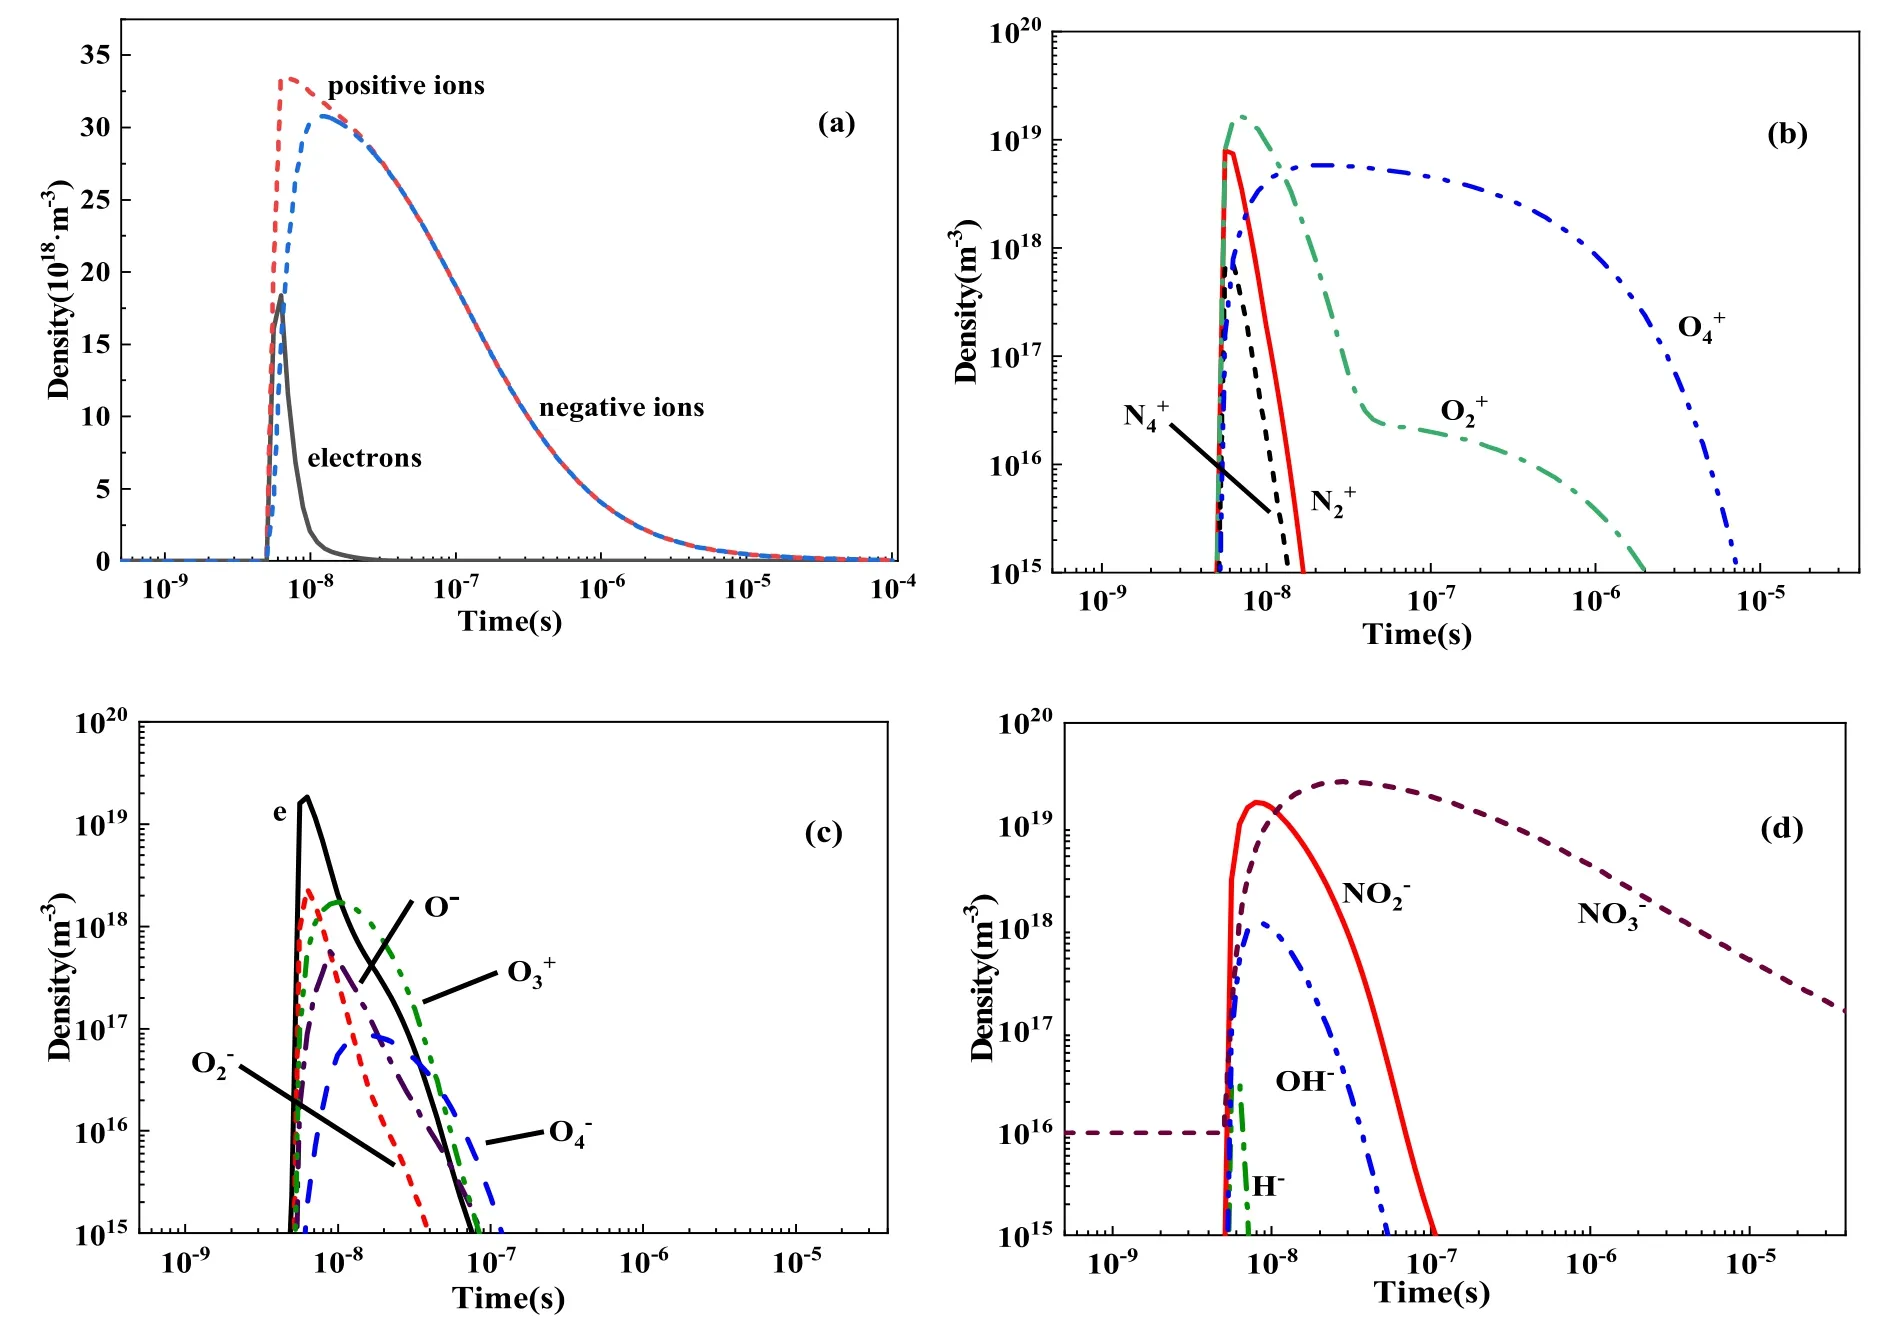
Figure 1.Time evolution of charged particles.
4.Screening rules for key particles and chemical reactions
The comparison with the work of Sakiyama et al[24]verified the accuracy of the model presented in this paper.The key particles and reactions of this model were also screened using specific rules to obtain the key chemical reaction process involved with corona discharge plasma in humid air.
4.1.Screening rules for key particles
Specific research objectives or conditions correspond to distinct key particles.The purpose of this study was to examine the plasma chemistry of the corona discharge process.Because electrons are the most active charged particles in the reaction, we defined electrons as the reference object and the examinable particles relative to the electron as the key particles.So,the screening rule 1 was established as that screening particles with a density greater than A% of the electron density at any time of investigation were considered key particles.
4.2.Screening rules for key reactions
The screening of key reactions was only required to focus on the pivotal substances.To obtain the main reactions for the formation or consumption of these key substances,n reactions with the fastest rate of formation or consumption of each key substance were selected such that the sum of these reactions accounted for the main part of the total formation or consumption of the substance.The n reactions were the key reactions of the corresponding key substances.The screening threshold of key reactions was determined by analyzing the relationship between the percentage of screened key reactions (as a proportion of the total) and the number of key reactions (figure 2).Finally, the screening rule 2 for key reactions summarized as that for each key particle, if several reactions with the top ranking formation or consumption rates occurred such that the sum of their rates was greater than B%of the total rate, then these reactions were considered key reactions for the substance.
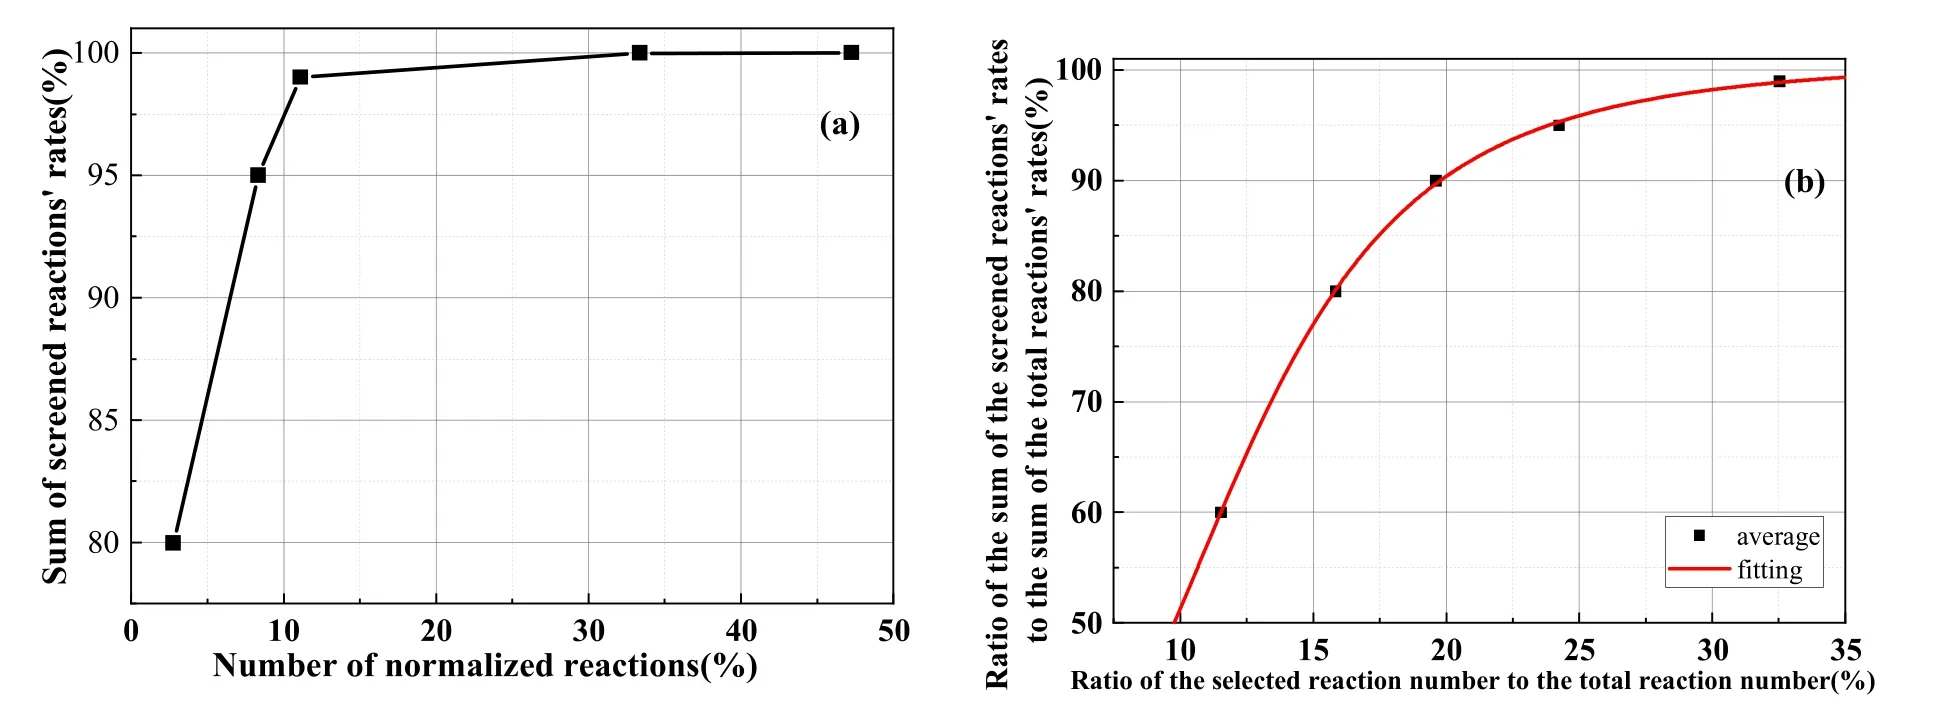
Figure 2.Relationship between the sum of key reaction rates and screening proportion.(a)Reaction rate and proportion for key consumption reactions of and screening proportion.(b) Mean value of the sum of key reaction rates and screening proportion.
4.3.Discussion of the screening threshold
In order to determine the threshold value ‘A%’ of screening rule 1, we refer to the relationship between positive and negative ions and electrons, as shown in figure 1.It is obviously that some ions are comparable with electrons in density, such as O-,and some ions’ densities are seriously below, such as H-.So, we can easily set A% = 1% to divided ions into two part, and consider that species with a density greater than 1%of the electron density at any time were key species.
In order to determine the threshold value ‘B%’ of screening rule 2, we discussed the relationship between the sum of key reaction rates and screening proportion.
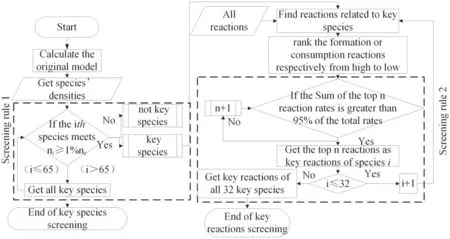
Figure 3.Flow chart of screening process for key particles and reactions.
Figure 2(a) presents the consumption reaction ofas an example and displays the analysis of the relationship between the screening proportion of key chemical reactions and the percentage of screened reactions compared with all reactions.Only 10% of allparticle consumption reactions were required to express the 97% consumption reaction rate ofions.Similarly, all key particles were analyzed as illustrated in figure 2(a), and the average values were computed to produce figure 2(b), which illustrates that when the number of screened key reactions was less than 25% of all reactions, the sum of the key reaction rates increased rapidly with the increase in the number of screened key reactions.When the number of screened reactions exceeded 25%of the total amount, the change rate gradually slowed.With the sum of key reaction rates as 95%of the total reaction rate defined as the screening threshold, 22.4% of the number of reactions could be achieved, and 95% of the total reaction rate could be expressed.So the value of B% is set as 95%.
4.4.The screening process
The screening rules for key particles and reactions were finally summarized as follows:
(1) Screening particles with a density greater than 1% of the electron density at any time of investigation were considered key particles.
(2) For each key particle, if several reactions with the top ranking formation or consumption rates occurred such that the sum of their rates was greater than 95% of the total rate, then these reactions were considered key reactions for the substance.
We define electrons as reference so that the selected species and reactions could be closely related to the discharge process.Moreover, the choice of the threshold for key species and reactions also makes us control the quantity of the key species and reactions.When the key species and reactions are used in fluid model, the complexity of the model was controllable.
The screening flow chart is presented in figure 3.First, the results for the distribution of particle density with time were calculated based on the original model,with the size relationship between each substance and 1% of the electron density at each time compared.If substance i satisfied the condition of ni> 1%neat a certain time,i was considered as a key particle;otherwise,it was not.Because the total number of particle types included in the original model was 65, when the remaining 64 particles were compared with electrons,key particle filtering was complete.The key reactions were then screened for the obtained key particles.Because the chemical reaction rate is determined by the rate coefficient and substance density, when the substances with low densities were used as the reactant, the corresponding reaction rates tended to be low.For each key substance, all the relevant reactions from among the 673 reactions included in the original model were identified.These were then divided into the two categories of generation or consumption reactions.The generation and consumption reactions were then ranked by reaction rates(high to low).The top ranking generation or consumption reactions were those where the sum of their reaction rates was greater than 95%of the total rate.Such reactions were considered as key reactions for the given substance, e.g.if the rates of the top 3 reactions are 50%, 40%, 8%, we should select all of the top 3 reactions; if the rates of the top 3 reactions are 99%, 0.1% and 0.01%, only the top one reaction should be selected.
The process to select the key reactions of each key species respectively is the main part of the screening process.We select the key reactions of each key species respectively,and then,get a union of them.So we would not miss any key reactions.
In general, the screening rules can be used in other environments to study the discharging process,but we cannot be sure about that it can be used in different power sources or different discharge forms.In fact, the key species and reactions are deeply influenced by electrical waveform, and the background gas composition.We will figure out the applicability of the selected model in the future.
5.Screening results and analysis
5.1.Screening of key particles
5.1.1.Screening results for the positive ions.The distributions of all positive ion densities with time are shown in figure 4.
In accordance with screening rule 1, positive ions with a density greater than 1% of the electron density at any given time were considered as key positive ions.The screened positive ions (six in total) are depicted with thick, solid lines in figure 4.
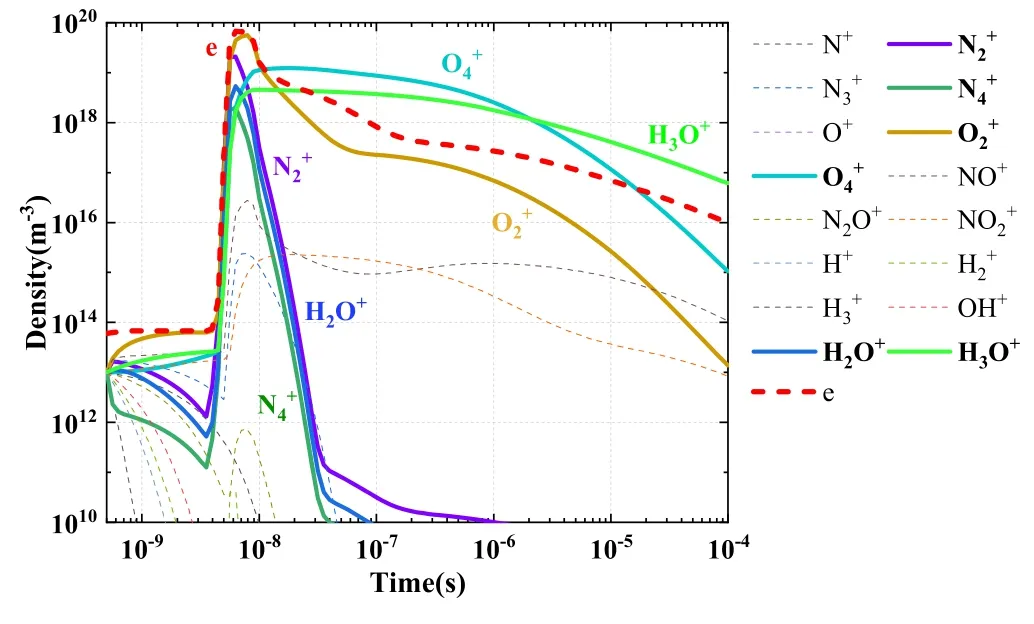
Figure 4.Variations of positive ion densities with time.
5.1.2.Screening results for negative ions.The distributions of all negative ion densities with time are illustrated in figure 5.In accordance with screening rule 1, negative ions with a density greater than 1% of the electron density at any given time were classified as key negative ions.The screened negative ions(five in total)are denoted with thick,solid lines in figure 5.
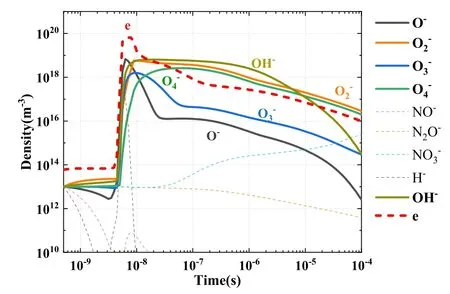
Figure 5.Variations of negative ion densities with time.
5.1.3.Screening results for neutral particles.Similar to the cases for positive and negative ions, the key particles in neutral particles were selected based on screening rule 1,with the screening results (totaling 20 types of neutral particles)indicated by the thick, solid lines in figure 6.
At the initial period in the first 10-8s,all species increase rapidly with electron density.Then, when electron density decays from 10-8s,the excited species and long life ions rule the evolution of the discharge.The densities of these long life species are accumulated and keep in high densities.Their generations are stronger than consuming.However,we would not miss these important species, when we compare their density with the density of electrons in their ruling time.So the screening rule 1 is still useful after 10-8s.
Additionally, electrons were the most active species and were also selected as a key species.In total,32 electrons were screened, all of which are listed in table 2.
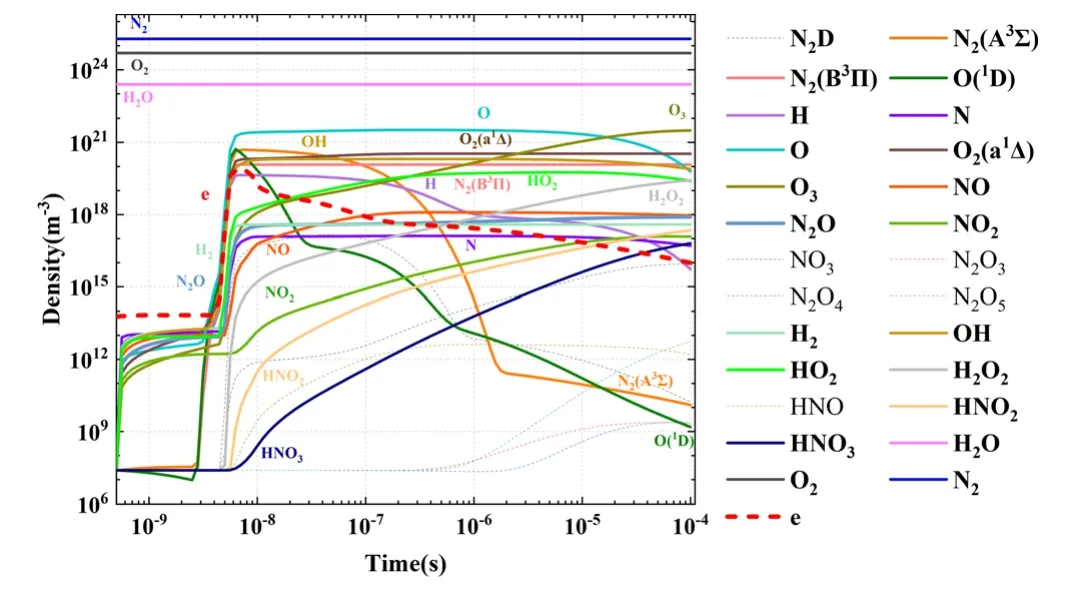
Figure 6.Variations of neutral particle densities with time.
5.2.Screening results for key reactions
On the basis of screening rule 2, the key formation and consumption reactions for the example ofwere screened,and the results are presented in figures 7(a) and (b); specifically, the formation and consumption reaction rates ofat each time are sorted from fast to slow.In the example of the formation reaction ofthe reaction rates (from fast to slow) were added at each time until the sum of the accumulated rates was greater than 95% of the total rate.Reactions R150 and R658,which participated in the accumulation,were the key formation reactions ofas shown in figure 7(a).The screened key reactions ofre denoted by the thick solid lines in figure 7(b), which refer to the three reactions R128, R138, and R140.
To illustrate the screening results of the reaction, the density ofand the reaction rates are compared in figure 8.A comparison of figures 7(a) and 8(a) suggests that the reaction rates of R150, R658, and R659 were notably higher than those of other reactions in the main formation ofThe key consumption reactions ofscreened using the same method are shown in figures 7(b) and 8(b).The key consumption reactions were the three reactions numbered R128,R138, and R140.The key reactions of all key particles were screened using the same method as detailed previously.
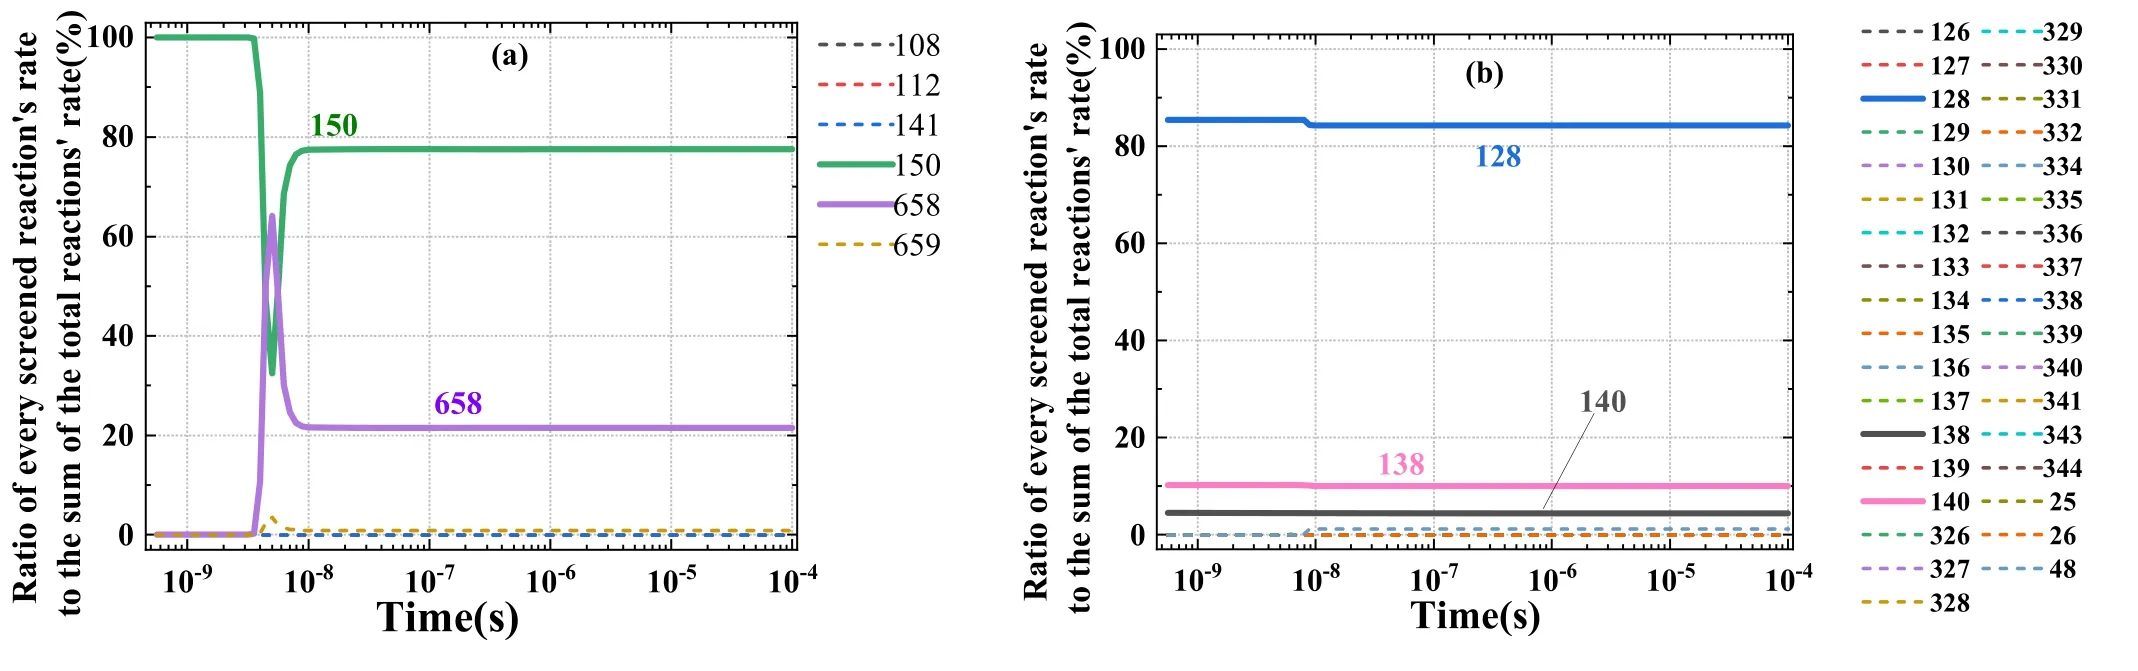
Figure 7.Proportion diagram of ion reaction rates.(a) Proportion of formation reaction rates, (b) proportion of consumption reaction rates.
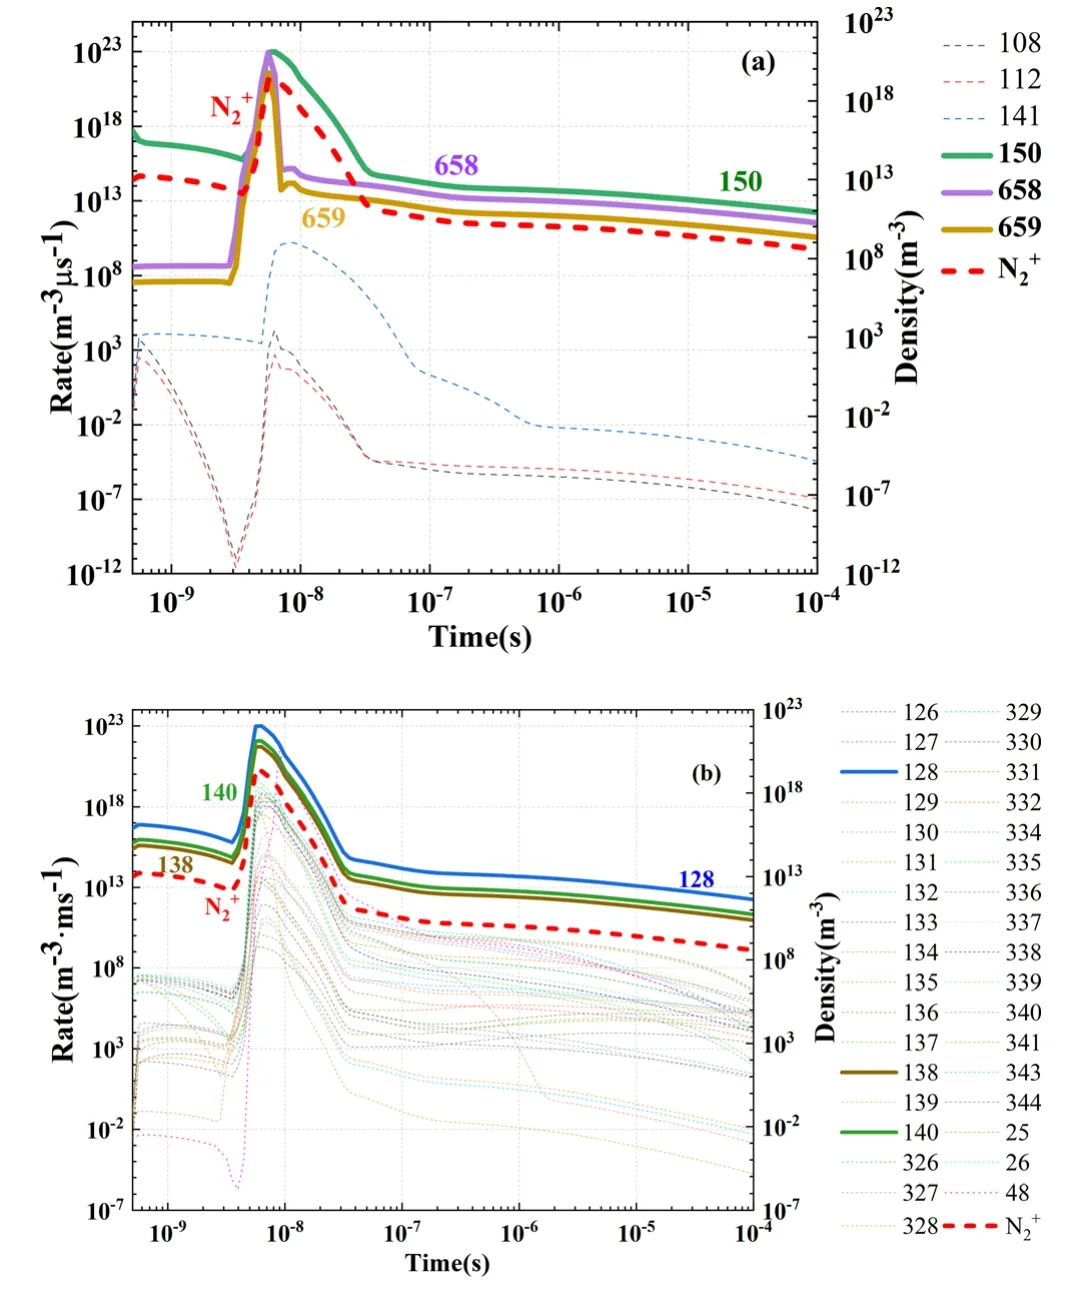
Figure 8.(a) Formation and (b) consumption reaction rates of
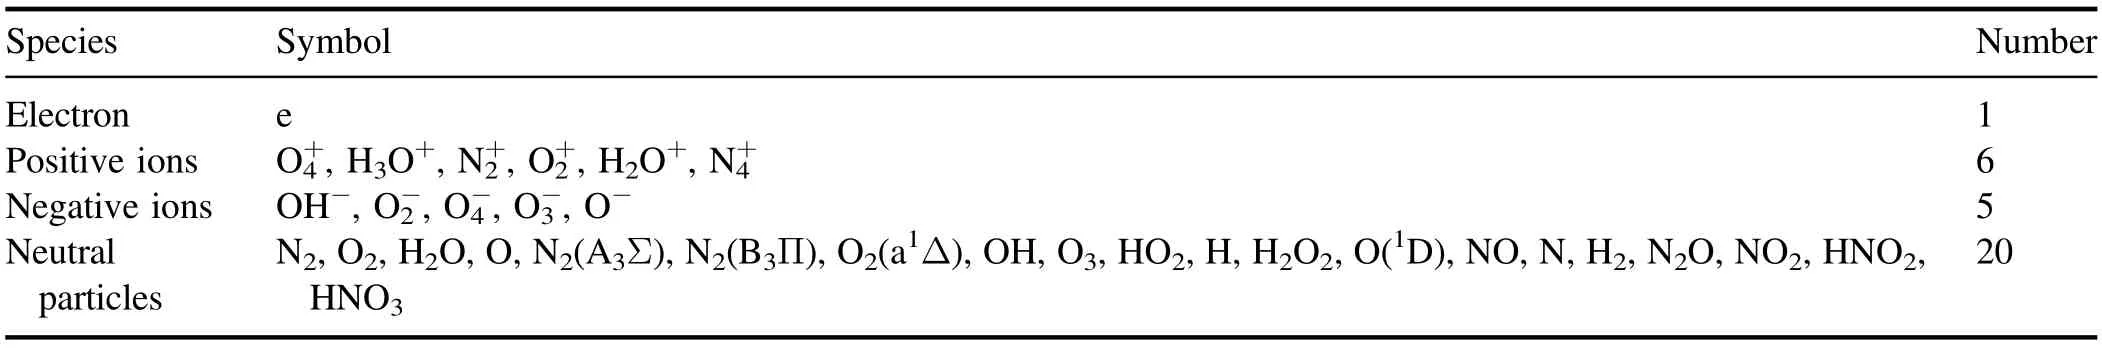
Table 2.Key particles retained after screening.
5.3.Verification of key particles and reactions
To verify the consistency between the model containing only the key particles and reactions and the original model, simplified model 1, containing key particles and reactions, was developed.The results are displayed in figures 9 and 10.
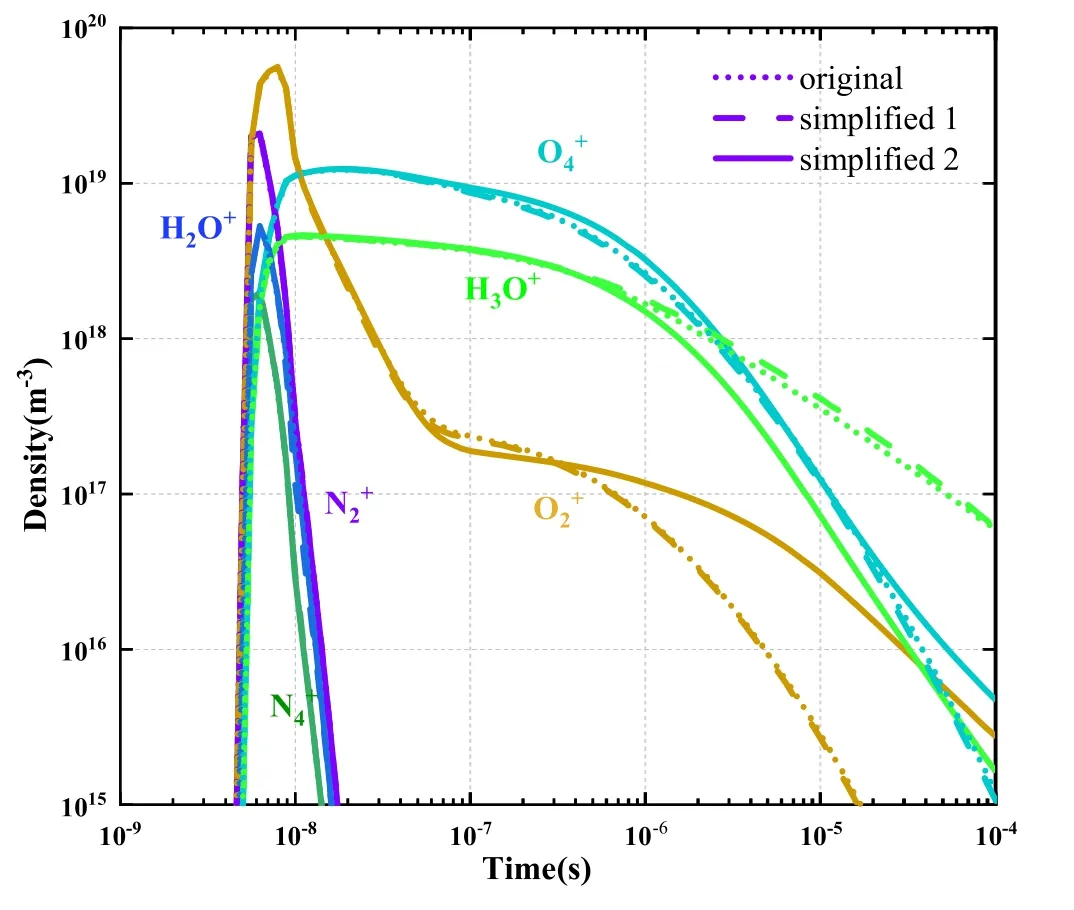
Figure 9.Comparison of original and simplified models in terms of key positive ion results.
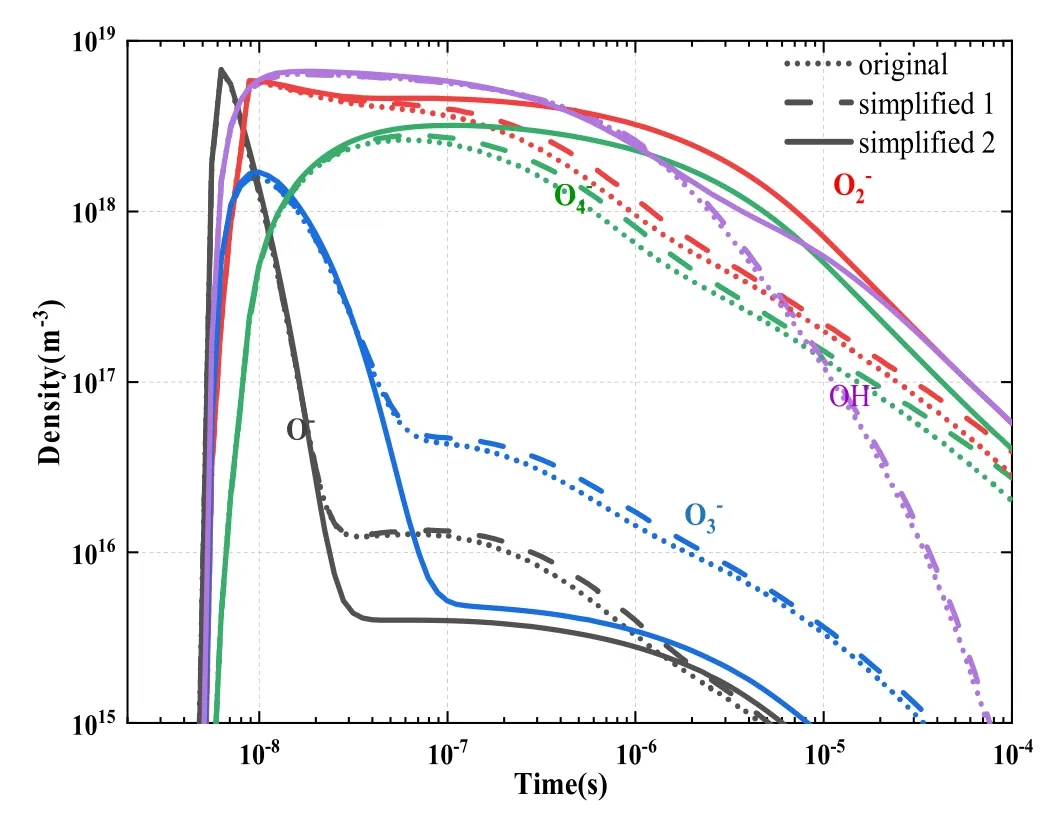
Figure 10.Comparison of original and simplified models in terms of key negative ion results.
A comparison of the key charged particle density distribution of simplified model 1 with that of the original model suggests that the simplified model 1 (containing 149 key reactions) was highly consistent with the original model(including all 673 reactions).Notably,at all times,the results of the original model (indicated by dotted lines) nearly coincide with those of simplified model 1 (indicated by dashed line).It indicates that the chemistry system composed by the key species and reactions selected in the present work can be a good representative to the original model.
The results for electron density and its relative error are illustrated in figure 11, which indicates that the electron density curves of simplified model 1 and the original model are highly consistent.The overall change reached 106m-3,and the relative error was within 10%.
A comparison between the original model and simplified model 1 in terms of the current Ipis shown in figure 12.The results of simplified model 1 and the original model are more consistent.Because the main part of the loop current was electron current, its relative error curve was similar to that of electron density.The overall variation range of the loop current reached 107m-3, and the relative error was less than 10%.
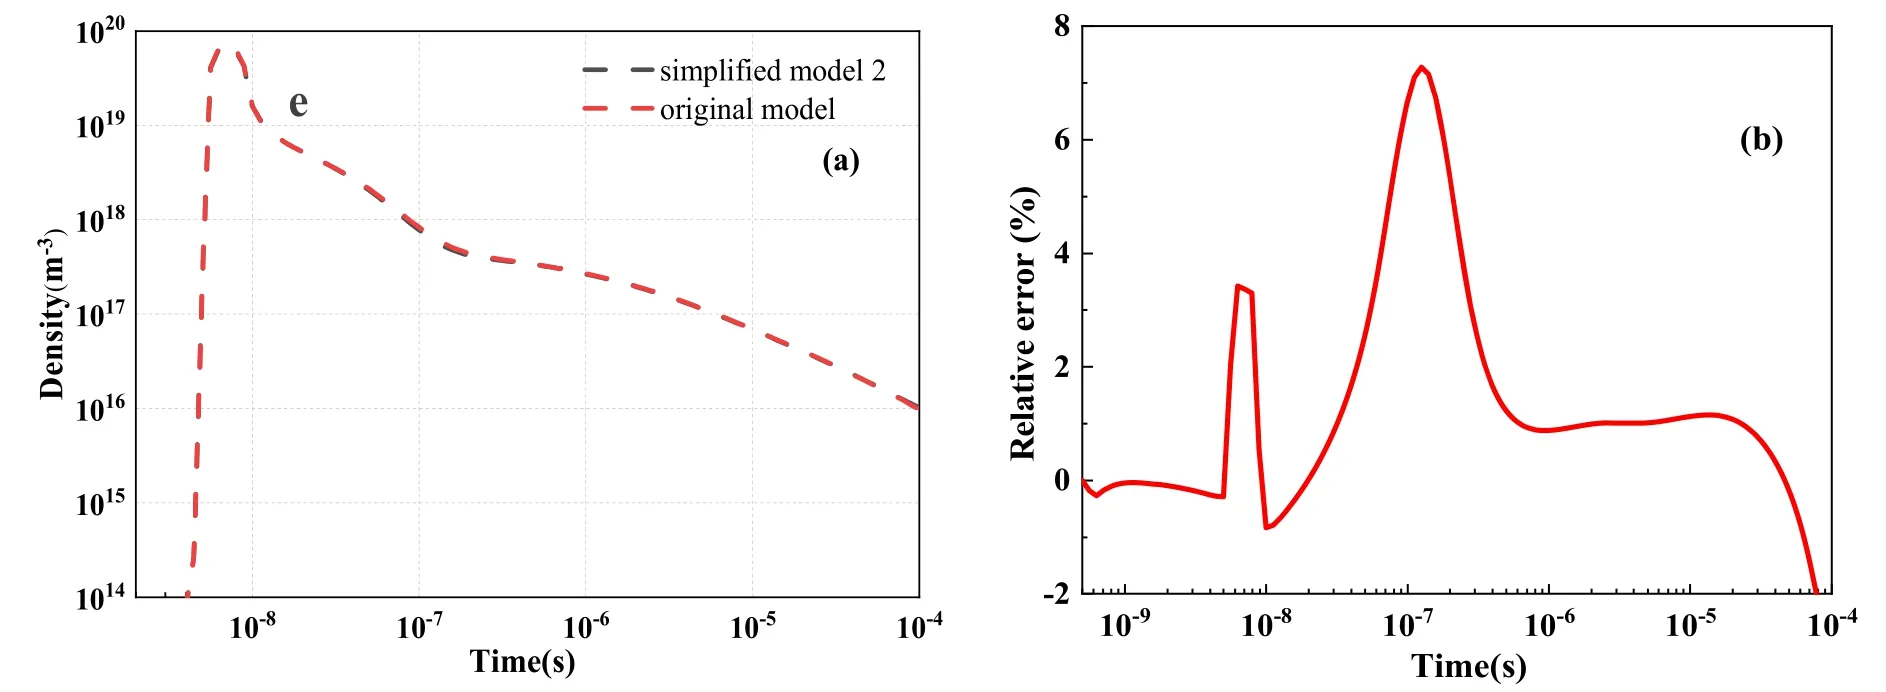
Figure 11.Comparison between simplified model 1 and original model in terms of (a) electron density and (b) relative error (%).

Figure 12.Comparison between simplified model 1 and original model in terms of (a) current and (b) relative error (%).
With the same calculation conditions as used with the original model(64G RAM and AMD1800x process),the time required for a single simplified model 1 calculation was l hour, which was one-third of the calculation time required with the original model.
Therefore, simplified model 1 and the original model exhibited good consistency in model parameters such as charged particle density distribution and loop current,and their relative errors were acceptable compared with the overall variation across multiple orders of magnitude.The simplified model 1 delivers performance comparable to that of the original model.In addition,as required,the simplified model can be further optimized by adjusting the screening threshold of the key particles and chemical reactions.If a greater degree of equivalence(with the original model)is required,the screening threshold of key reactions can be increased in the simplified model,with the number of key reactions increased accordingly.If an even simpler chemical reaction model is required, the screening threshold of key reactions can be appropriately reduced, but the proportion of errors increases.
Because we focused on the plasma chemistry of discharge process, to verify the role of charged particles and related reactions, we developed simplified model 2 (the solid lines in figures 9 and 10), pertaining only to the key charged particle reactions.
Figures 9 and 10 show that before 10-7s,the changes in the curves of positive and negative ion densities with time(based on the original and simplified models) almost completely coincided.The migration speed of charged species is faster than the diffusion speed of the neutral species, and electron migration speed is fast than ions.As mentioned in figure 2 of reference [24] of our manuscript, the electron impact reactions occur since nanoseconds,the charge transfer and recombination reactions occur since microseconds, and neutral reactions occurs after charge transfer and recombination reactions.So the charged species are able to dominate the early stage of the plasma chemistry process, which compose the main discharging process of corona.
Subsequently, as the density of neutral species gradually increases, the difference between charged particles on that density also gradually increases.Therefore, the neutral particles could be ignored during the fast discharge pulse time in 10-7s.But they could not be ignored when studying the plasma process in long time.
5.4.Reaction road map
Based on the key particles and reactions determined in sections 5.1 and 5.2, a reaction road map was devised, as shown in figure 13.It includes 31 key particle types and 149 key reactions.Compared with the original reaction model,which involved 65 particles and 673 reactions, it is substantially simpler.The red line in the figure denotes the reactions involving H2O.The reaction pathways of key particles during humid air plasma discharge are displayed in the road map.These pathways can be divided into three groups associated with three elements: N, O, and H-O.The charge transfers involved the following key positive and negative ions are summarized after figure 13.
(1) N: N2,, andformed the main cycle between neutral molecules and ions.A cycle was formed between N2and its excited-state molecules.The elements N and O were connected as NO and N2O and then transformed to generate other N-O compounds and H-N-O compounds.
(2) O: O2, O, O3,,O-, andformed the main cycle of element O., and O2formed a separate cycle.Among them,the main products were O3and O2,and O was both the main product and the main intermediate product.The O element formed a link with the N and H elements through O, O2, and O-, and the first products were mainly NO and OH.
(3) H2O: H in the reaction model largely appeared in the form of O-H compounds.The main cycle of its particles was composed of H2O, H2O+, H3O+, OH-,and OH, and its key products were HO2and OH.
5.5.Analysis of key reaction pathways
5.5.1.Key electronic reactions.The reaction pathways between key ions and neutral particles are presented in figure 13.As the most active particle in the discharge process,an electron is the key particle by default,and its key reactions are listed in table 3.
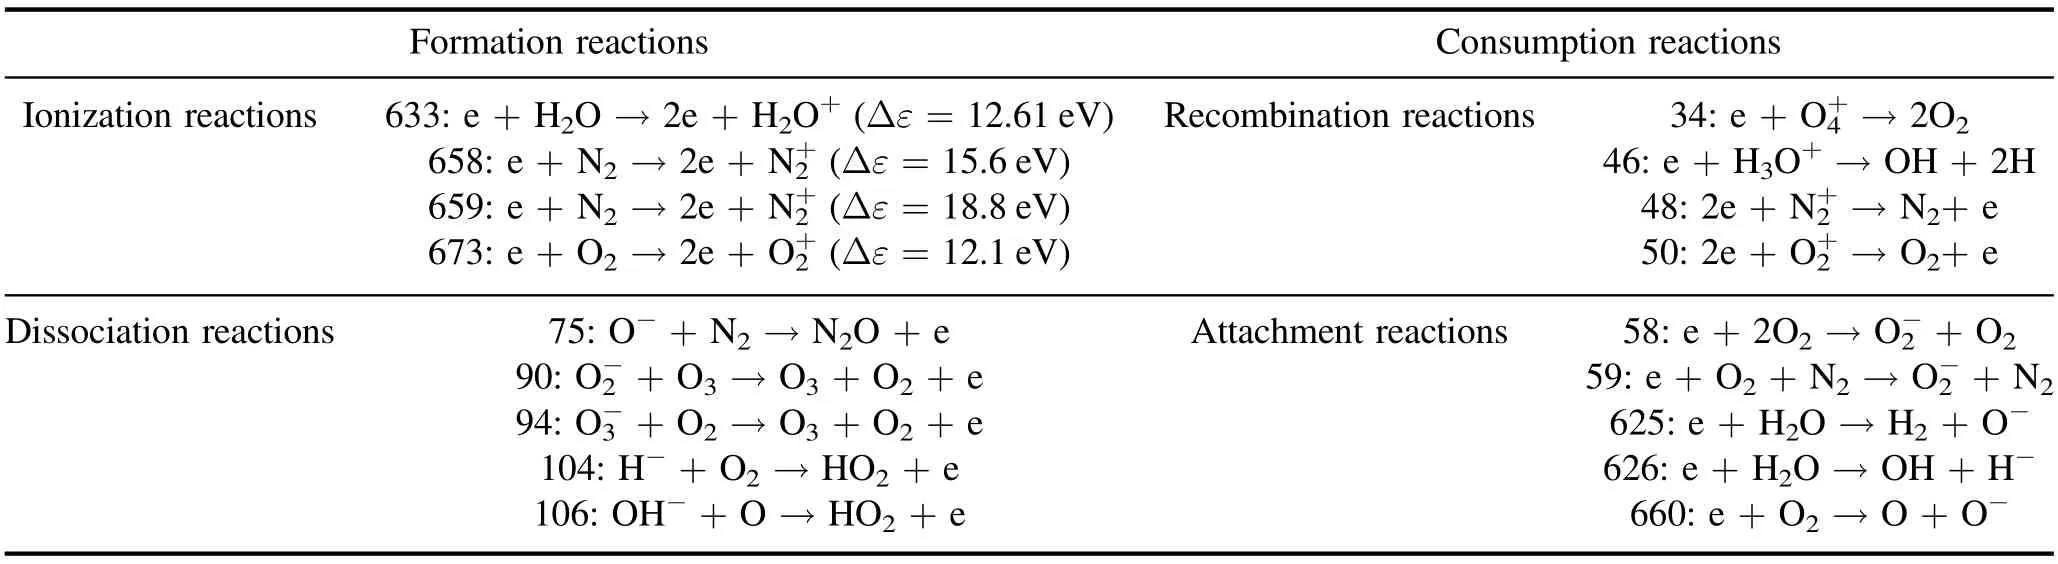
Table 3.Key electronic reactions.
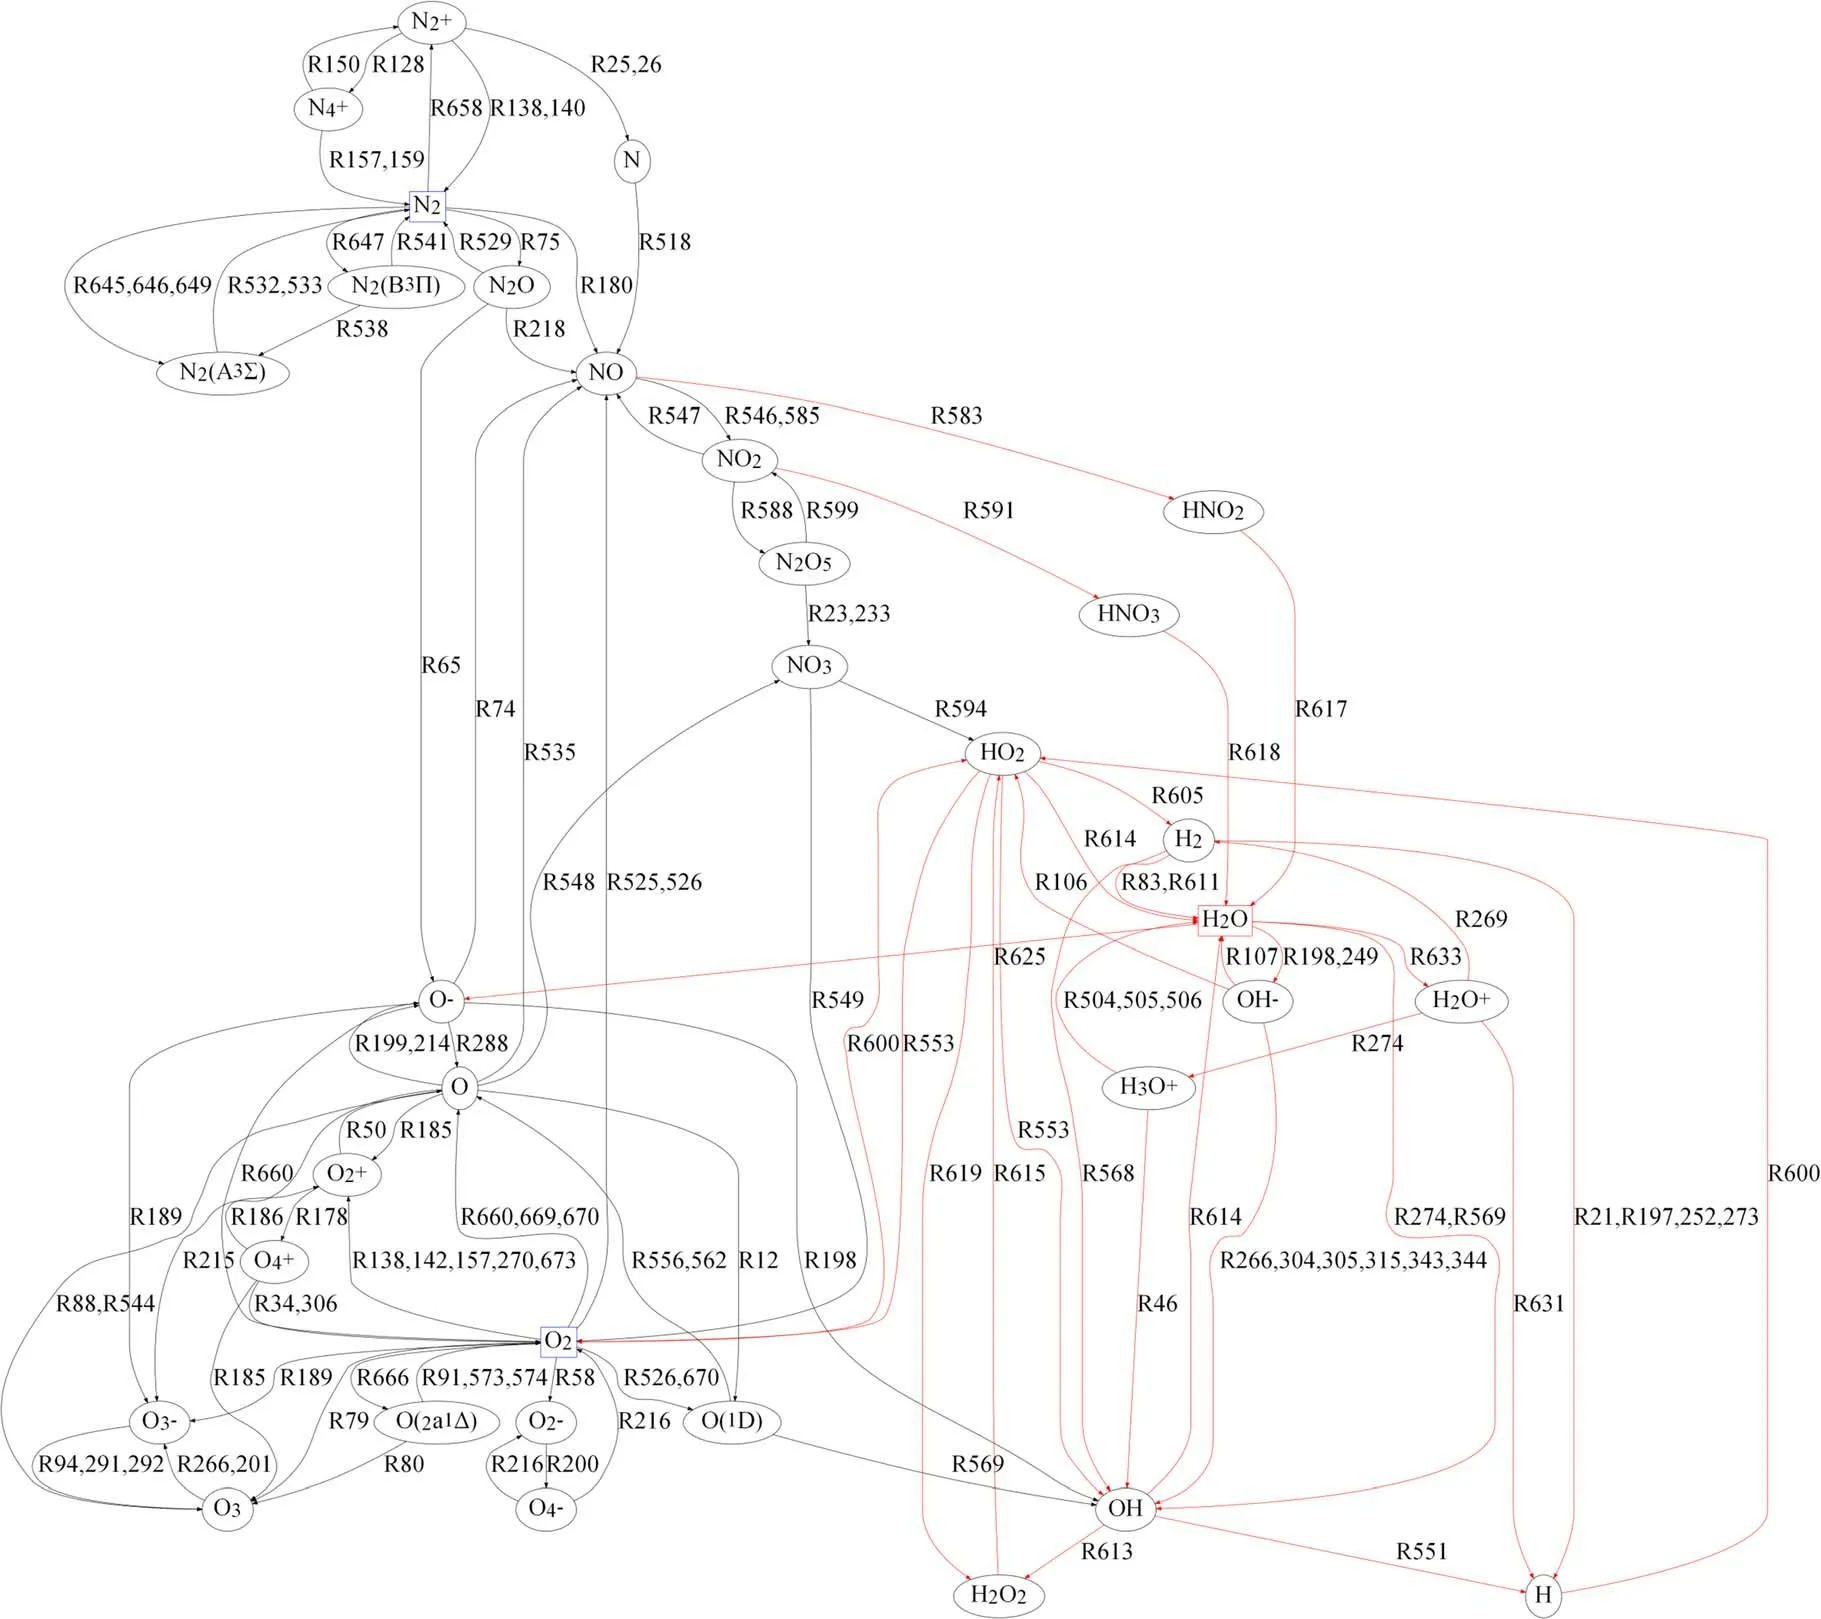
Figure 13.Reaction road map of key particles.
Table 3 details 18 electronic key reactions screened based on our predefined rules.The electron generation reaction was mainly composed of 4 key ionization reactions and 5 key dissociation reactions.The sum of their respective reaction rates is shown in figure 14(a).At the approximate time of the power pulse (10-8s), the sums of the ionization and dissociation reactions increased rapidly, and the sum of the ionization reaction rate was two orders of magnitude larger than that of the dissociation reaction rate.After the power pulse,the sum of ionization reaction rates was approximately six orders of magnitude smaller than the sum of the dissociation reaction rates.Hence, after 10-8s, electrons were primarily provided by the dissociation reactions.The electron consumption reaction was mainly composed of 4 key composite reactions and 5 key attachment reactions.The sum of their respective reaction rates is shown in figure 14(b).The peak value of the sum of the composite reaction rates was slightly low but was greater than that of the sum of the adhesion reaction rates.The sum of composite reaction rates decreased more rapidly than that of the adhesion reaction rates.After 10-6s, the sum of electron attachment reaction rates was greater than the sum of composite reaction rates.
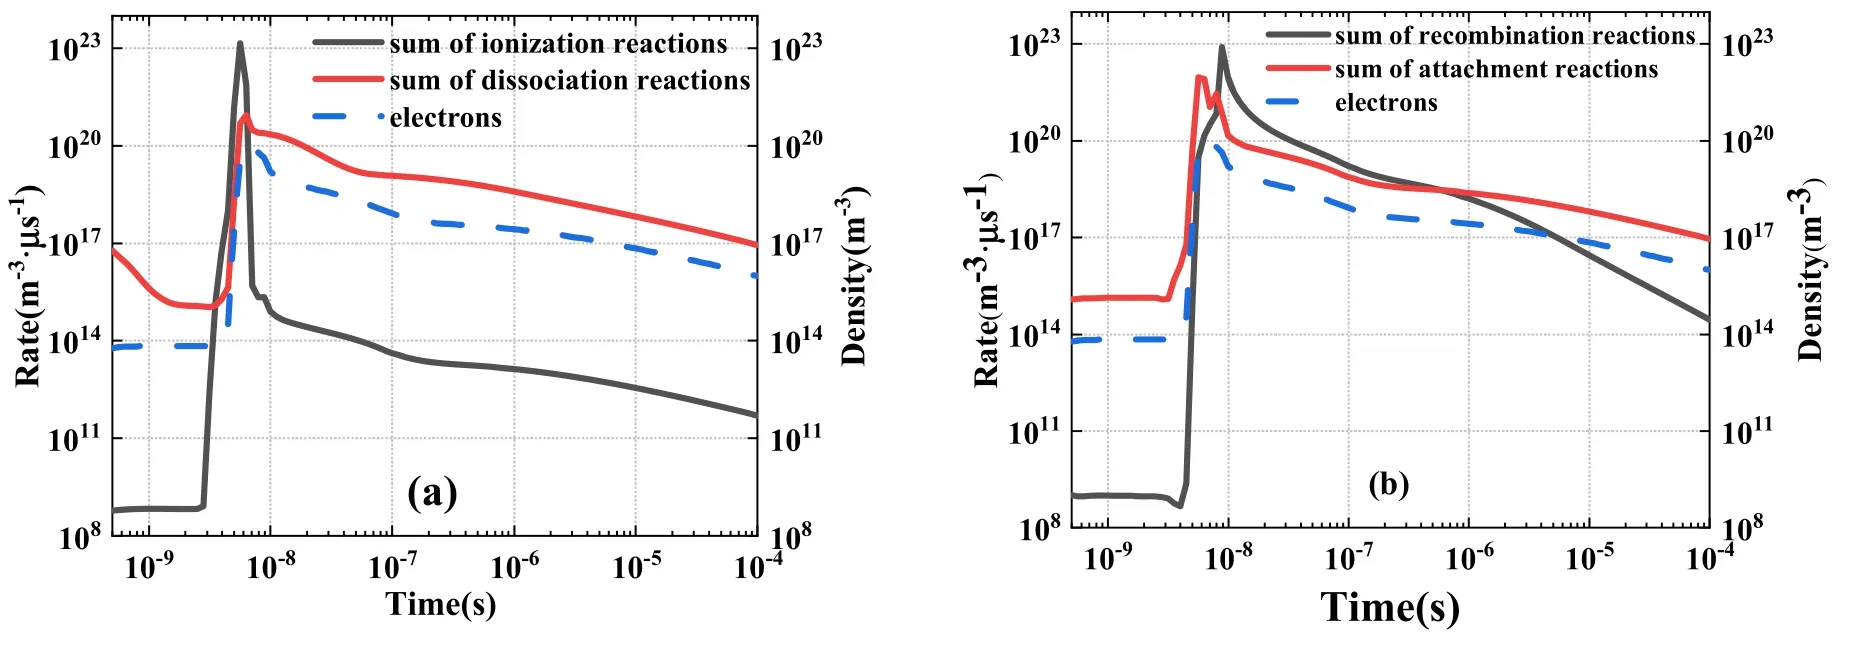
Figure 14.Key reactions of electron (a) generation and (b) consumption reaction rates.
The net electron generation rate is obtained by subtracting the sum of the key consumption reaction rates from the sum of the key electron generation reaction rates.Figure 15 illustrates that the net generation rate reached the maximum value of 1.3×1029m-3s at the peak of the power pulse and then decreased rapidly, reaching the minimum value of(-0.8×1029) m-3s at 9 ns.Thereafter, as shown in the magnified inset of the figure,the net generation rate gradually increased,reached the peak value,and then began to decrease gradually.
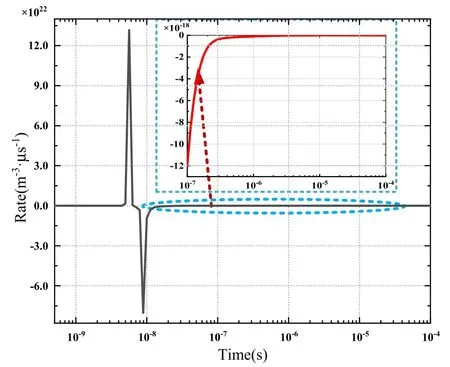
Figure 15.Generation rate of electrons.
5.5.2.Reactions of discharge involving water molecules.Of the 18 electronic key reactions noted in table 3, those related to H2O molecules were R46, R104, R106, R625, R626, and R633.Among these, R633 was an ionization reaction, and H2O molecules mainly increased the collision cross section and enhanced ionization through this reaction.R625 and R626 were attachment reactions, and H2O molecules adsorbed electrons, which increased the adsorption coefficient and weakened effective ionization.R46 is a recombination reaction in which electrons combine with H3O+ions, consuming electrons.R104 and R106 were the key dissociation reactions, and after 10-8s, these reactions mainly generated electrons.Ions produced by water molecules mainly included H2O+, H3O+, and OH-.
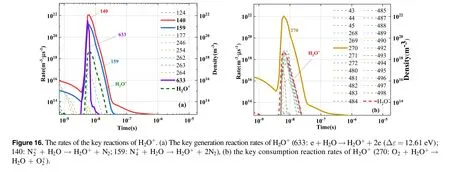
Figure 16 shows the formation reaction and consumption reaction rates of H2O+.According to the observation of the key H2O+reactions,after the addition of H2O(g),the positive charges ofandions were transferred to H2O+ions,primarily through R140 and R159.The R270 reaction then transferred the positive charge of H2O+to theion.In this process,H2O+ions served to transfer positive charges,which increased the pathways of charge transfer between charged particles.The observation of H2O+ion density suggested that H2O+ions existed only for a short time.In addition, the screened key reactions of H2O+were mainly the reactions between other key particles and H2O molecules, which indicated that the density exerted a considerable effect on the reaction rate.
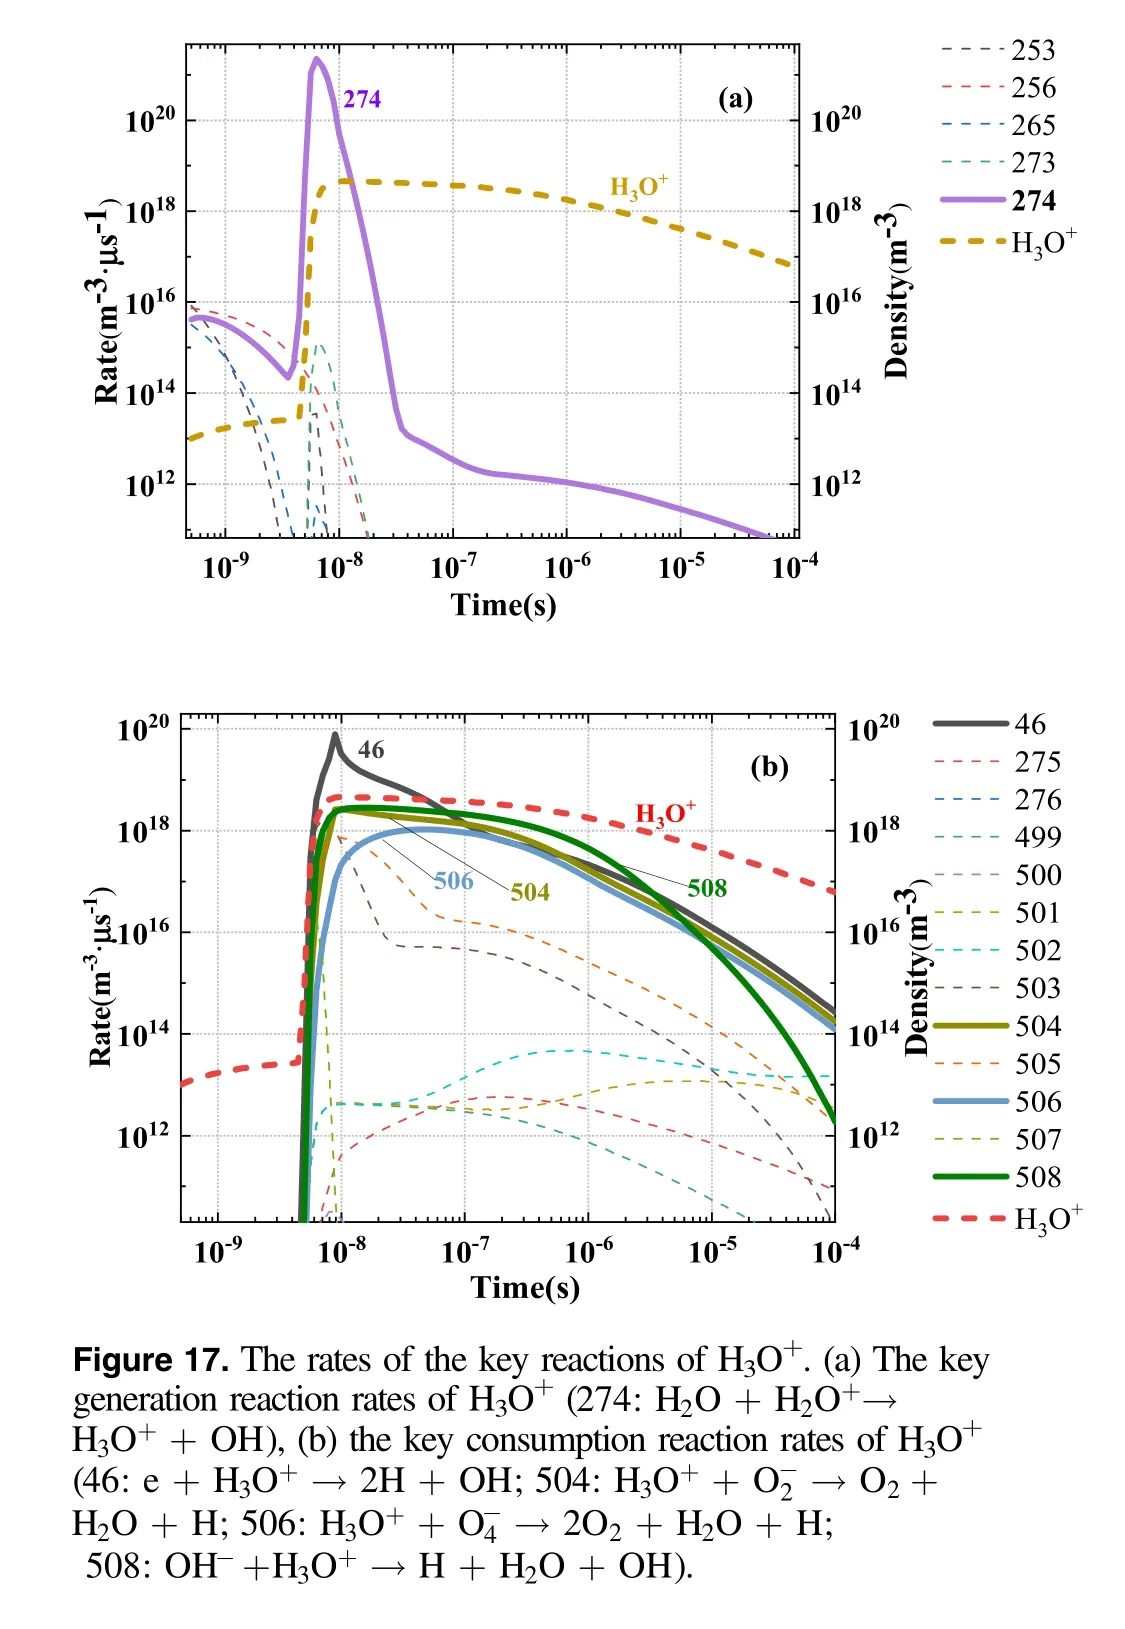
Figure 17 shows the formation reaction and consumption reaction rates of H3O+ions.The main formation reaction was R274,and the reactants were H2O+ions and H2O molecules.For the duration of the power pulse,the reaction rate was high and H3O+increased markedly.The main consumption reaction was R46, and its reaction rate was high throughout the duration of the power pulse.However, after the pulse concluded, the consumption reaction rate was low, and therefore, the density of H3O+gradually decreased.
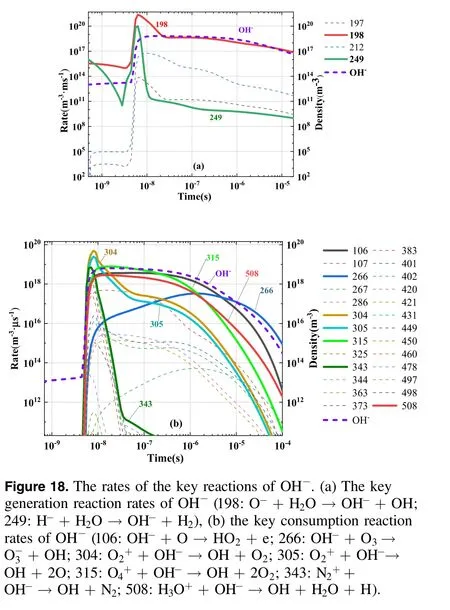
Figure 18 shows the formation reaction and consumption reaction rates of OH-ions.The main generation reactions of OH-were R198 and R249, which were generated by the reactions that O-and H-collide with H2O molecules.Oand H-were the primary negative ions formed through the collision of electrons with H2O molecules.Among the key consumption reactions of OH-, R106 was a dissociation reaction that consumed OH-and released HO2active particles and electrons.R266 was a charge transfer reaction with O3that generated OH active particles.R304-R508 were combination reactions between positive and negative ions,the reactants of which were OH and other key ions, and the products were largely background gas molecules such as N2,O2, and H2O.The reaction of OH-was the main reaction generating the OH radical, which has demonstrated notable value in plasma medicine, a crucial application of humid air plasma.
Water molecules also tend to form clusters, which are generally most stable in a cage structure formed with 12 water molecules.This study mainly investigated the influence of water molecules on charged particles in corona discharge.Hence,the characteristics of water molecule clusters were not thoroughly examined.
6.Conclusion
In this work, a global model of atmospheric pressure pulse corona discharge in humid air was developed,and a screening method to select the key particles and chemical reactions for the study of the discharge process was proposed.The key particles and key chemical reactions in the original model were screened out using this method.A simplified global model was devised.By comparing the results of the original model with those of the simplified global model, the simplified model’s performance, in terms of the key particles and reactions screened,was verified as being equivalent to that of the original model.Based on the key particles and chemical reactions selected, a road map of the key reactions of humid air corona discharge was compiled,and the specific reactions and functions of water molecules involved in the discharge were analyzed.On the basis of these comparative analyses,the following conclusions are drawn:
(1) A comparison of the particle density distribution of the original model with the results of Sakiyama et al [24]demonstrated that the original model can adequately reflect the chemical reaction process in humid air corona discharge.
(2) The ion density results of the original model and simplified model l (which only contains charged particles and their chemical reactions) were notably similar before 1×10⁻⁷s.After 1×10⁻⁷s, the difference in ion density gradually increased,indicating that neutral particles play a pivotal role in the discharge process and cannot be ignored.Such neutral particles exerted an effect after 1×10⁻⁷s, as evident in the neutral particle density being unaffected by the electric field force and only thermal diffusion producing displacement and collision.
(3) The particle density and parameters associated with the original model and simplified model 2(composed of the key particles and chemical reactions detailed in this paper) were highly consistent, which indicated that simplified model 2 can also adequately represent the chemical reaction process in humid air corona discharge.Moreover, the method to select key particles and key reactions can be used in other discharge plasma process.
(4) H2O molecules increased the collision cross section and enhanced ionization mainly through R633, and H2O molecules absorbed electrons through R625 and R626,which increased the adsorption coefficient and weakened the effective ionization.R46 was a recombination reaction in which electrons combined with H3O+ions and were consumed.R104 and R106 were the key dissociation reactions.After 10-8s,these two reactions mainly generated electrons.The charge transfer path was increased primarily by H2O+, and the ionic mobility was weakened by hydrated ions such as H3O+.OH radicals,HO2,O3,and other active particles were formed by OH-.

Table A1.Summary of reaction equations.
Acknowledgments
This work was supported by National Natural Science Foundation of China (No.51907145).
Appendix
The first 624 reactions are cited in the reaction list of Sakiyama et al [24], whose reaction numbering system we have retained.Reactions 625-673 were derived from the collision section data of Lisbon and Morgan in the LXCat database and are different from the data of Sakiyama et al[24].The equations of reactions 625-673 are listed in this appendix.

Table A1.(Continued.)
猜你喜欢
名作欣赏(2023年17期)2023-06-28 00:48:08
陶瓷学报(2021年2期)2021-07-21 08:35:06
Plasma Science and Technology(2021年6期)2021-06-21 02:00:36
北京汽车(2021年2期)2021-05-07 04:00:20
陶瓷学报(2020年5期)2020-11-09 09:23:12
传媒评论(2019年3期)2019-06-18 10:59:14
领导决策信息(2018年12期)2018-05-23 13:30:22
摄影之友(2018年3期)2018-04-12 01:53:12
晚晴(2016年10期)2016-11-16 22:13:59
——秦汉时期“伏日”考论
古代文明(2013年4期)2013-07-18 12:08:45
 Plasma Science and Technology2022年5期
- Plasma Science and Technology的其它文章
- Integrated data analysis on the electron temperature profile of HL-2A with the Bayesian probability inference method
- Prompt acceleration of a μ+ beam in a toroidal wakefield driven by a shaped steeprising-front Laguerre-Gaussian laser pulse
- The influence of weak transverse magnetic field on plasma dissipation process in the post-arc phase in a vacuum interrupter
- Numerical study of the effect of coflow argon jet on a laminar argon thermal plasma jet
- On the green aurora emission of Ar atmospheric pressure plasma
- Dynamic characteristics of multi-arc thermal plasma in four types of electrode configurations