Quantitative prediction and ranking of the shock sensitivity of explosives via reactive molecular dynamics simulations
Kun Yang, Lang Chen, Dan-yang Liu, De-shen Geng, Jian-ying Lu, Jun-ying Wu
State Key Laboratory of Explosion Science and Technology, Beijing Institute of Technology, Beijing,100081, China
Keywords:Explosive Shock sensitivity Quantitative prediction Reactive molecular dynamics simulation
ABSTRACT A deep understanding of explosive sensitivities and their factors is important for safe and reliable applications.However, quantitative prediction of the sensitivities is difficult.Here, reactive molecular dynamics simulation models for high-speed piston impacts on explosive supercells were established.Simulations were also performed to investigate shock-induced reactions of various high-energy explosives.The fraction of reacted explosive molecules in an initial supercell changed linearly with the propagation distance of the shock-wave front.The corresponding slope could be used as a reaction rate for a specific shock-loading velocity.Reaction rates that varied with the shock-loading pressure exhibited two-stage linearities with different slopes.The two inflection points corresponded to the initial and accelerated reactions, which respectively correlated to the thresholds of shock-induced ignition and detonation.Therefore,the ignition and detonation critical pressures could be determined.The sensitivity could then be a quantitative prediction of the critical pressure.The accuracies of the quantitative shock sensitivity predictions were verified by comparing the impact and shock sensitivities of common explosives and the characteristics of anisotropic shock-induced reactions.Molecular dynamics simulations quantitatively predict and rank shock sensitivities by using only crystal structures of the explosives.Overall, this method will enable the design and safe use of explosives.
1.Introduction
Explosives are metastable hazardous materials that may ignite and detonate under external stimulation.Sensitivity is usually used to characterize the degree of danger.Depending on the stimulus,the sensitivity can characterized as thermal,impact,shock,friction,or electrostatic [1,2].The sensitivity is usually determined by experimental methods because it remains a challenge to accurately predict it from theoretical calculations.
Shock loading is the main factor that induces the violent reaction of an explosive [3], and the reaction threshold can be used to evaluate the sensitivity[4,5].Impact sensitivity and shock initiation tests are used to obtain reaction thresholds and to evaluate the sensitivity.Impact sensitivity is determined by dropping a weight from a specific height onto a striker plate.The height at which the probability of explosion is 50%is denoted by,and the explosion probability is obtained either by the first decomposition reaction or by sound detection [6].Impact sensitivity reflects the ignition response under a weak shock.Under strong impact,the critical gap thickness, input impact pressure, and distance to detonation are obtained by a gap test[7],a wedge test[8]and a flyer-initiating test[9-11], respectively, to quantitatively determine the shock sensitivity.Shock sensitivity comparisons for various explosives can be determined by these tests [12]; however, they cannot predict sensitivity under shock-loading.Shock initiation can be simulated by a “phenomenological” reaction model [13,14].However, the parameters must be optimized by shock initiation experiments.Moreover, these models also ignore the composition of the explosives, and, therefore, cannot be used to predict shock sensitivity.
The correlation between molecular structure and explosive sensitivity has been examined for many years [15].By combining regression analysis [16,17], artificial neural networks [18,19], and other methods, relationships between molecular structure descriptors and sensitivity have been established to predict the sensitivity of explosives.Keshavarz et al.reported that shock sensitivity was related to structural parameters, such as the number of oxygen atoms, nitro groups, and amino groups.By analyzing gap tests of various explosives, empirical models for shock sensitivity prediction have been based on molecular composition descriptors [16,20].However, these models have ignored detailed chemical reactions and can only predict the sensitivity from specific structures and groups.Bisheng et al.reported that the bond dissociation energy of X-NO2(X=C,N,O)and the Mulliken charge of nitro groups may be important factors affecting the shock sensitivity of nitro compounds.The relationship between shock sensitivities and the Mulliken nitro group charges and the dissociation energy parameters of the weakest X-NO2(X=C,N,O)bonds was established by partial least-squares fitting[21,22].Mathieu reported that shock sensitivity was related to the propagating decomposition reaction that initiated self-sustaining reactions.The molecules reacted under shock loading and released enough energy absorbed by nearby molecules to rapidly reach a critical high temperature.This was key to triggering further reactions between neighboring molecules.Bond strengths and energy content are primary factors for determining mechanical sensitivities.The ratios of the weakest dissociation energies of nitro compounds to their decomposition enthalpies per covalent bond was suggested as a shock sensitivity index [23,24].Although the above methods considered the dissociation energies of the chemical reactions,they only focused on single nitro compounds,and did not consider packing characteristics.The predictions of shock sensitivities for various explosives with similar structures did not involve the kinetics of the chemical reactions [17,25-28].
The sensitivity of explosives to external shock stimuli is largely attributed to the dynamic response and initial reactivity of energetic molecules[1,29].Molecular dynamics(MD)simulations have been used to investigate anisotropic, shock-loaded explosive reaction mechanisms at the atomic level [30-33].Shan et al.obtained the most sensitive shock-loading direction for PETN, based on the Reaxff reaction force-field, combined with a multi-scale shock technique [34].The anisotropic characteristics of PETN were thus analyzed [35].Goddard et al.developed a compression-and-shear reactive dynamics model based on the ReaxFF force-field and applied it to the anisotropic shock sensitivities of PETN [36], RDX[37], and HMX [38].The simulations demonstrated that the molecular origins of anisotropic shock sensitivities resulted from steric hindrance in adjacent slip planes sheared during shear deformation.Ying et al.studied the initial hydrogen-transfer mechanisms of eighteen nitro compounds under shock-loading via first-principles MD simulations.They concluded that reversible hydrogen-transfer under shock-loading could absorb energy and release it through reverse reactions, thus alleviating an external shock stimulus and reducing the shock sensitivity of the explosives [39].Current MD studies have simulated shock-induced chemical reactions of explosives at the crystalline level, but they examined initial reaction mechanisms and anisotropy and did not compare different reactions.Therefore, the results could not be used to predict shock sensitivity.
Here, reactive MD simulations were used to quantitatively predict shock sensitivities via reaction thresholds.Models for the high-speed piston impact on explosives supercell directly were established, and the simulations investigated shock-induced reactions of various explosives.The ratio of reacted explosive molecules to the total number of molecules in the initial supercell was defined as the reacted fraction, and the method of calculating the explosive reaction rate under various loadings is given.Relationships between reaction rates and shock wave pressure were then analyzed and quantitative methods to determine the reaction threshold under shock are presented.MD simulations were performed for commonly used nitrate explosives, such as PETN,ammonium nitrate explosives, such as CL-20, HMX, and RDX, and nitrobenzene derivative explosives, such as TNT and TATB.The critical pressures of shock-induced ignition and detonation were determined.The accuracies of the quantitative shock-sensitivity predictions were verified by comparison with shock-sensitivity of common explosives and with anisotropic shock-induced reactions of PETN, RDX, and HMX.
2.Simulation models of high-speed piston impact on an explosive supercell
The initial unit cell structures were obtained from the Cambridge Crystallographic Data Centre.Equilibrium structures for orthorhombic crystals were initially obtained by relaxation, then the cells were enlarged along shock-loading directions to construct supercells.For non-orthorhombic crystals, the general crystalcutting method [40,41] was used to obtain unit cells with orthorhombic structures, and then the above procedure was used to construct supercells.To obtain the equilibrium structure at 0 K,the orthorhombic cell was first relaxed by energy minimization,adopting a conjugate gradient algorithm at a force convergence tolerance of 10(kcal/mol)/Å.According to the Maxwell-Boltzmann distribution, the initial speed, for all atoms, were set at 298 K.A molecular dynamics simulation was thereafter performed for 5 ps, with the canonical ensemble (NVT) set at 298 K,using the Berendsen thermostat.Finally, the equilibrium structure was obtained by an isobaric-isothermal(NPT)molecular dynamics simulation at 0 Pa and 298 K for 5 ps [30,42,43], Detailed construction methods are in the Appendix.
As non-equilibrium molecular dynamics simulation method of direct piston impact and ReaxFF-lg force field have been integrated into the large-scale atomic/molecular massively parallel simulator(LAMMPS), so the LAMMPS and the ReaxFF-lg reactive force-field[44] were used to investigate the reactions by direct piston impact of explosive supercells along different directions.Fig.1 shows the reactive molecular simulation model of the high-speed piston impact on a supercell [45].The piston directly impacted the supercell from the left side along the z-axis,and the shock wave that formed in the supercell propagated to the right side.After the shock wave propagated,explosive atoms were accelerated and the supercell was compressed.The supercell was divided into shocked and non-shocked zones by the shock wave front.
The chemical reactions of explosives under piston impact were simulated across various velocities ranging over 400-4000 m/s,with intervals of 200 m/s.The timestep was 0.1 fs, energy conservation can be maintained at this time step [46].And periodic and nonperiodic boundaries were applied along the non-impacted and impacted directions,respectively.The atom trajectories,molecules,and molecular bonds were recorded every 50 fs.A bond order of≥0.3 was used to determine the formation of chemical bonds[47,48].The supercell was evenly divided into 40 bins along the impact direction, and the average temperature, pressure, density,and particle velocity of each bin were recorded every 10 fs.Python language was used to write a large number of scripts to process the bond-order files.Bonds between various atoms during the chemical reactions were tracked by atom numbers[30,42],and the shockinduced reaction mechanism of the explosive was then analyzed.
MD simulations were performed for PETN, CL-20, HMX, RDX,TNT, and TATB by high-speed piston impact on the explosive supercells along various directions.The ReaxFF-lg has been proven to be suitable for describing the reactions of PETN, CL-20, HMX,RDX, TNT, and TATB under extreme conditions [38,45,49,50].
3.Quantitative characterization of shock sensitivity
Fig.2 shows snapshots of velocity distributions of atoms in a CL-20 supercell at different times under piston impact at 2000 m/s.At 0 ps,the atom velocities were still zero,the entire supercell had not been shock compressed,and the total length was.At 1 ps,a shock wave due to piston impact formed in the supercell and propagated to right side.After the shock wave propagated, explosive atoms were accelerated and the supercell was compressed.The shockwave propagation distance was determined by the velocity of the atoms.When that velocity was the same as that for the piston,the shock wave was considered to be propagating to the atoms.In this way, the shock-wave propagation distance in the supercell was determined.was the propagation distance at time.As the shock wave continued to propagate in the supercell,increased at time 2 ps.

Fig.1.Reactive molecular simulation model of high-speed piston impact on a supercell.
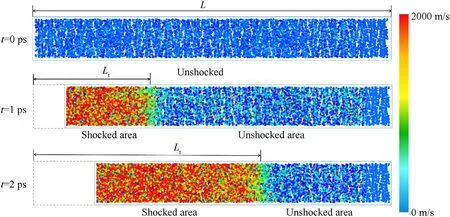
Fig.2.Snapshots of the velocity distribution of atoms in the CL-20 supercell at different times under piston impact at 2000 m/s.
The ratio of the shock-wave propagation distance in the supercell to the initial lengthof the supercell was defined as the relative propagation distance of the shock wave front λ:

As noted above,the fraction of the reacted explosive molecules η is defined as:

whereis the number of explosive molecules in the initial supercell, andis the number of explosive molecules in the supercell at time.
Under various shock-loading velocities,η changed linearly with the relative propagation distance of the shock-wave front.The slope reflects the reaction rate of the explosive under shock-loading at a specific velocity.Fig.3 shows this relationship when the shockloading at various velocities was along the [001] orientation of CL-20, the [100] orientation of HMX, and the [001] orientation of TATB.The value of η increased with the shock-loading velocity.Fig.3 shows the method to determine the reaction rate;the rates of all the other explosives were similarly calculated.
The relationship between η and the relative propagation distance of the shock-wave front is given by:

where σ is the reaction rate under a specific shock strength,andis a constant.
According to the basic relationships of shock waves [51], the shock-wave pressurecan be calculated from:

where ρis the initial density of the explosive,is the shock-wave velocity, andis the particle velocity after the shock wave.After the shock wave propagates,is the same as the velocity of the piston.
Based on Eqs.(1)-(4), we obtained the relationship between reaction rate and shock-wave pressure under various impact strengths.Detailed data are in Table A1 of Appendix.Fig.4 shows the relationship between the reaction rate and shock-wave pressure when shock-loading was orientated along the [001] orientation of CL-20, the [100] orientation of HMX, and the [001]orientation of TATB.The reaction rate increased with shock-wave pressure,and exhibited a piecewise linearity.The reaction rates of various explosives had similar trends vs.shock-wave pressure.The rate was close to zero for a small initial pressure,indicating almost no reaction.The rate then increased with pressure and had two inflection points.The first corresponded to the beginning of the reaction, and the second to a transition to a faster rate.The significant difference between combustion and detonation reaction rates is well known; the detonation reaction rate is significantly higher.Therefore, the first inflection point observed under weak shock-loading correlated with the critical pressureof shockinduced ignition.The second inflection point observed under strong shock-loading correlated with the critical pressureof shock-induced detonation.The explosive did not react when subjected to shock-loading because the pressure was lower than the ignition threshold.When the pressure is higher than the ignition threshold,but lower than the shock induced detonation threshold,it will burn.When the pressure is higher than the shock-induced detonation threshold, the detonation reaction will occur.
The critical pressures for ignition and detonation of CL-20 when shock-loading along the [001] orientation were 16.85 GPa and 33.43 GPa, respectively [Fig.4(a)] They were 33.86 GPa and 48.14 GPa for HMX when shock-loading along the[100]orientation[Fig.4(b)], and 46.43 GPa and 59.48 GPa for TATB when shock loading along the [100] orientation [Fig.4(c)].A low critical pressure indicated high sensitivity.In Fig.4,the most sensitive was CL-20[001], and the least sensitive was TATB[001].This is consistent with experimental results.
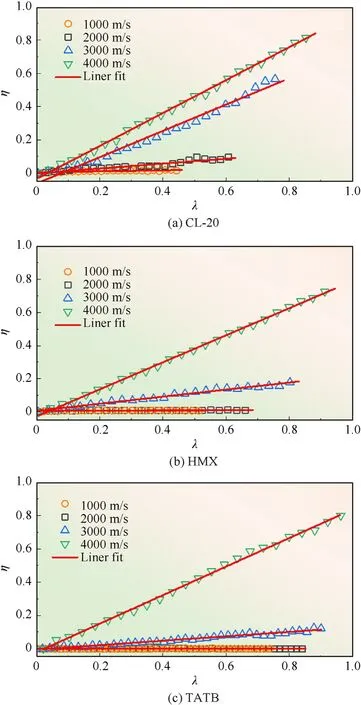
Fig.3.Relationship between the fraction of the reacted molecules η and the relative propagation distance of the shock-wave front.(a)CL-20[001],(b)HMX[100],(c)TATB[001].
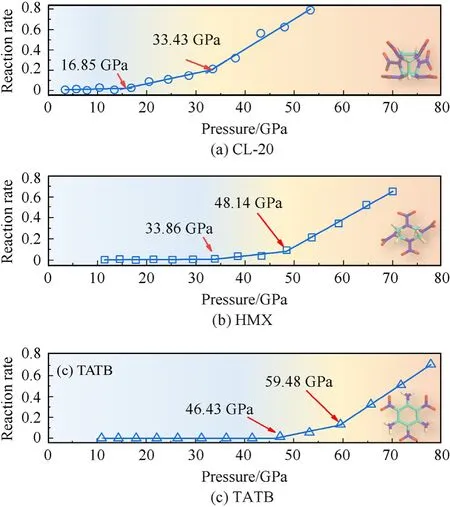
Fig.4.Relationship between reaction rate and shock-wave pressure.(a) CL-20 [001],(b) HMX [100], (c) TATB [001].
4.Shock sensitivity prediction and verification for common explosives
The critical pressures for shock-induced ignition and detonation of CL-20,PETN,HMX,RDX,TNT and TATB are listed in Table 1.PETN,RDX, HMX had anisotropic reaction thresholds under shockloading.Under weak shock-loading, the most sensitive PETN ignition was along the [110] orientation.It was along the [100] orientation for RDX,and along the[100]orientation for HMX.However,under strong shock-loading, the most sensitive orientation for PETN detonation was along the [110] orientation.It was along the[001]orientation for RDX,and along the[100]orientation for HMX.For explosives with significantly anisotropic reaction thresholds,the threshold pressure along the most sensitive orientation could be used to indicate the sensitivity.Thus,the order of shock-induced ignition sensitivity was CL-20>PETN>RDX>HMX>TNT>TATB,and that for shock-induced detonation sensitivity was CL-20 > PETN > HMX > RDX > TNT > TATB.
The impact sensitivity test involved weak shock-loading, and the main mechanism of the explosive reaction was the formation and growth of hot spots [6] that corresponded to shock-induced ignition.The impact sensitivity reflected the ignition response sensitivity under weak shock loading.The gap test was used to evaluate the shock sensitivities of various explosives.Shock initiation induces explosive reactions in the gap test; thus, the test reflects the detonation sensitivity under strong shock-loading.Theobtained from the dropped-weight test [27,52], the gap thicknesses obtained from the gap test, and the critical input pressures[12,16,21,22,52,53] are in Table A2 and A3 of Appendix.
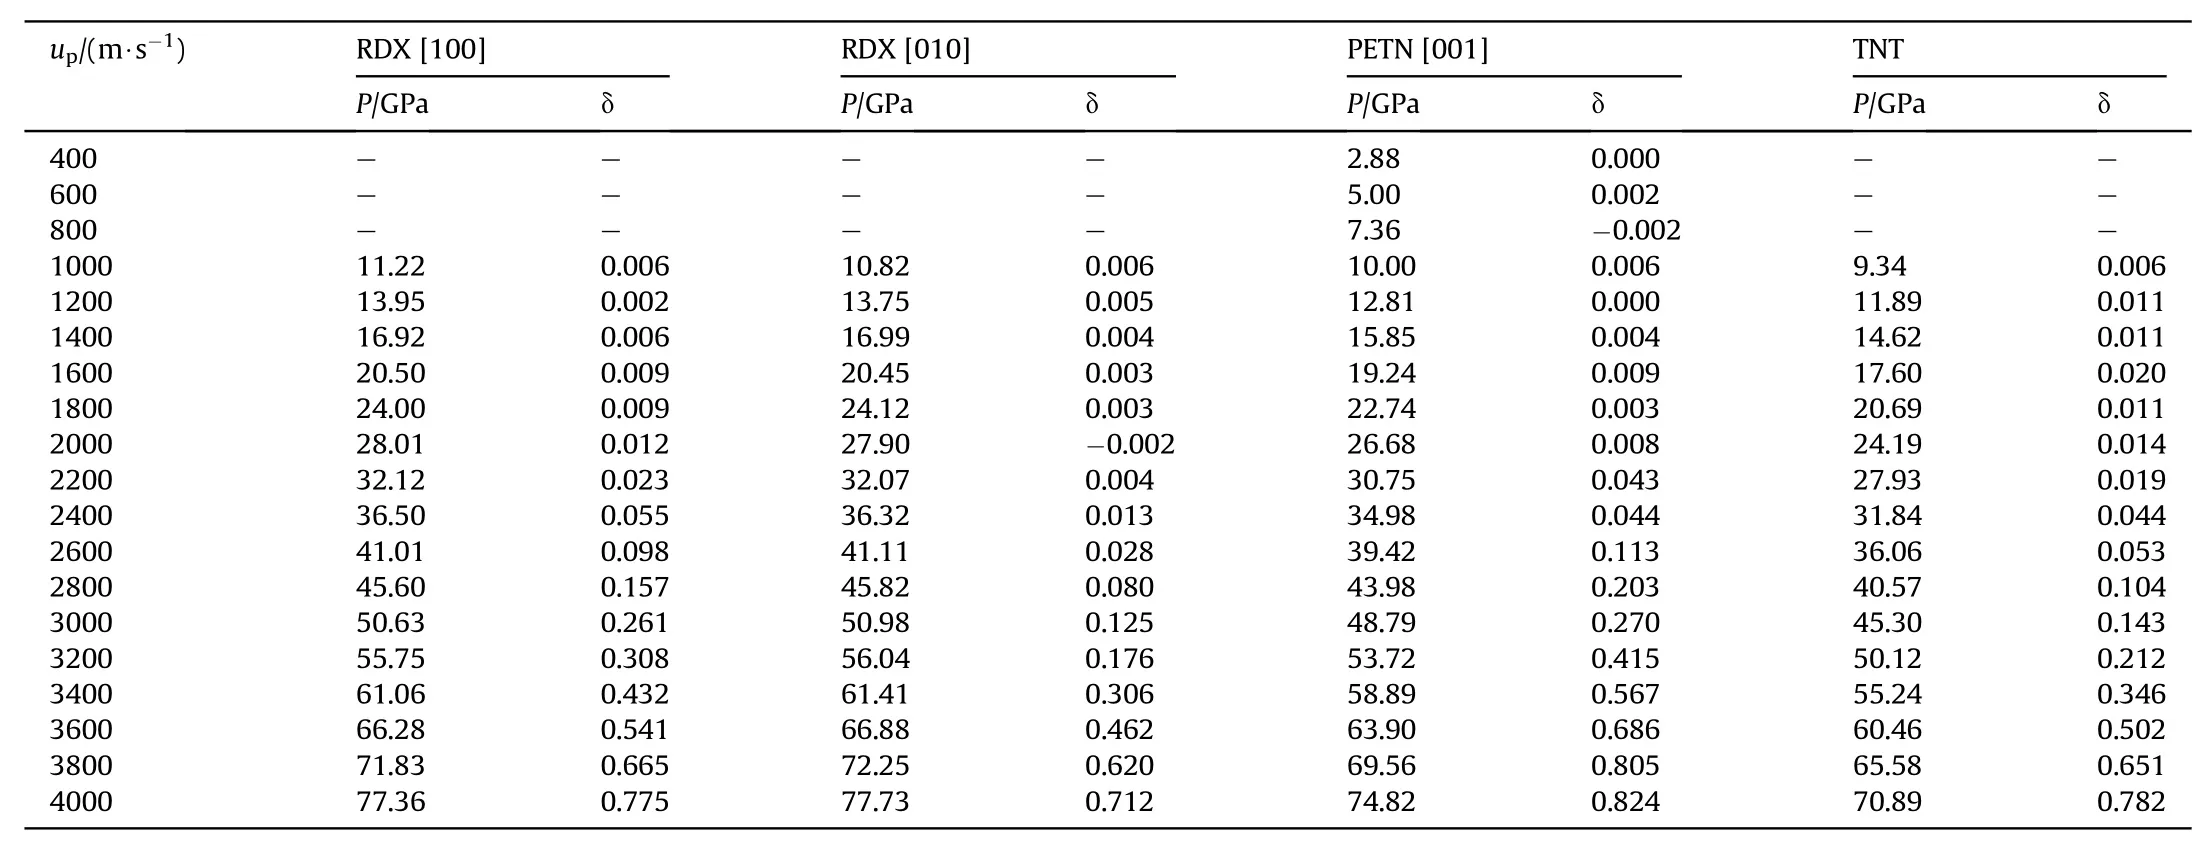
Table A1(c)Reaction rate and shockwave pressure when the explosive under shock loading along with various velocities.
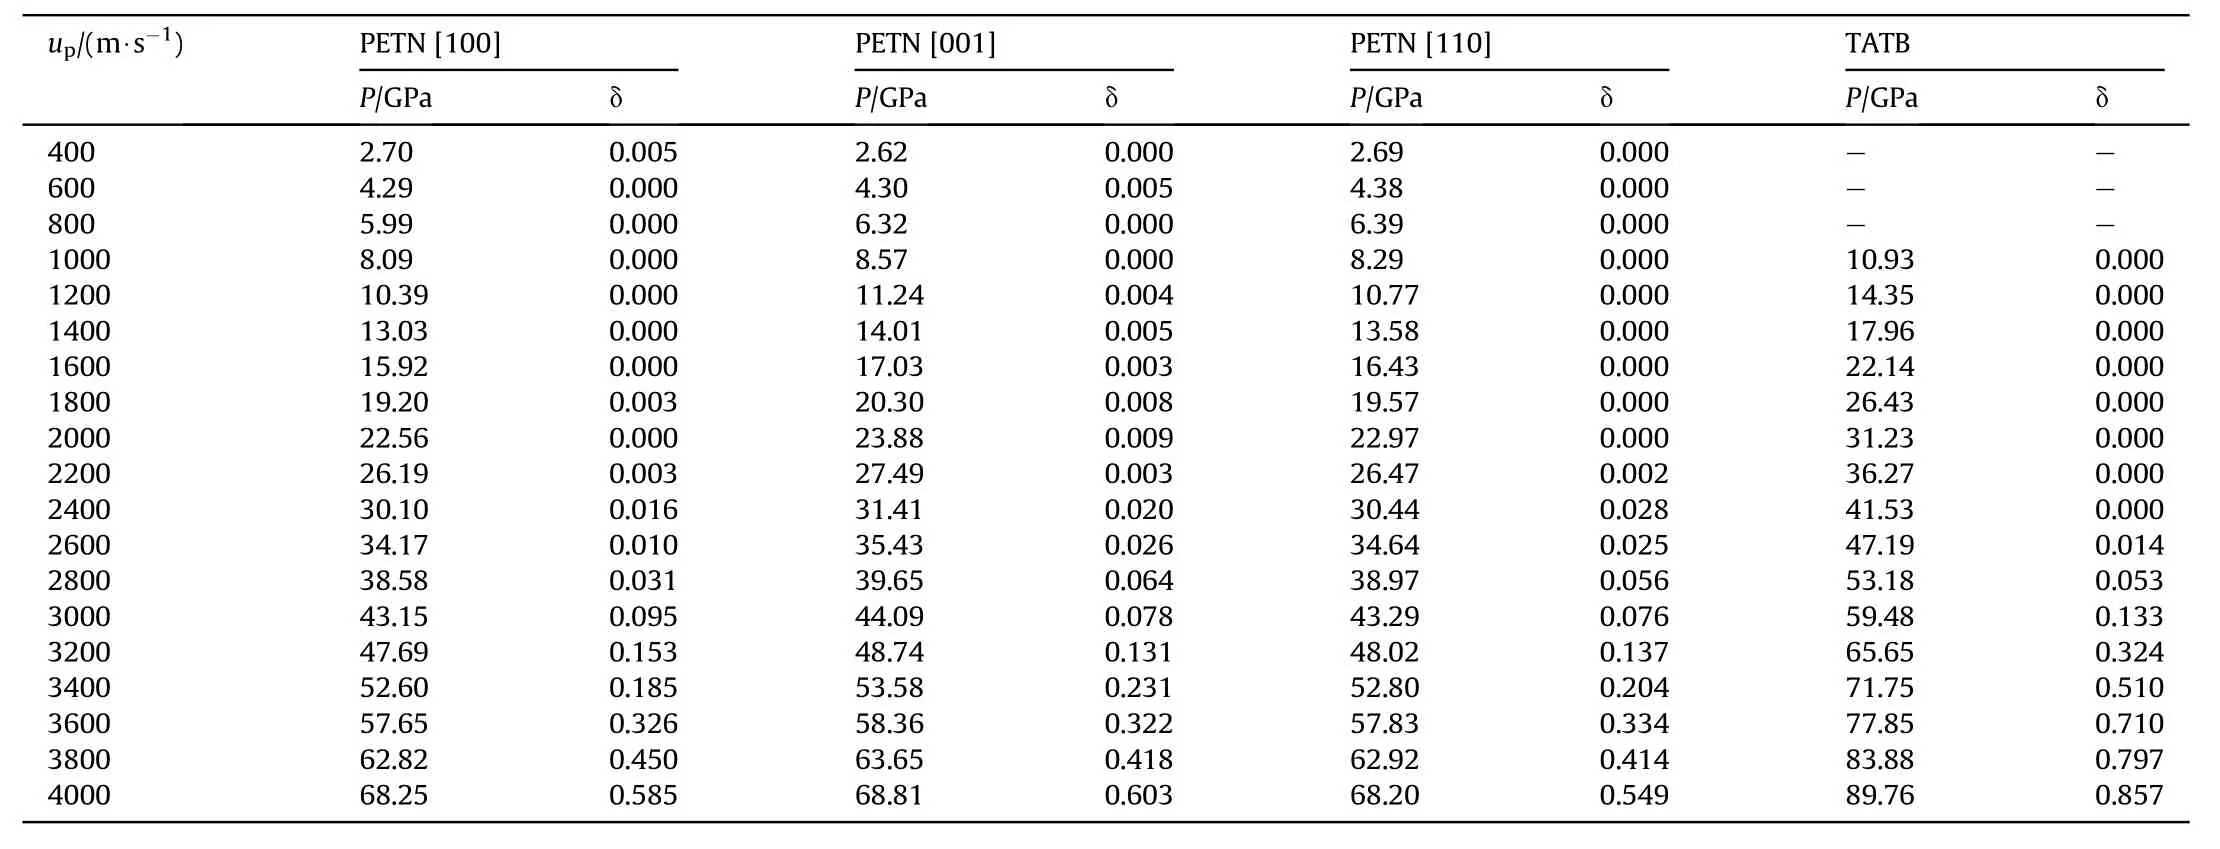
Table A1(b)Reaction rate and shockwave pressure when the explosive under shock loading along with various velocities.
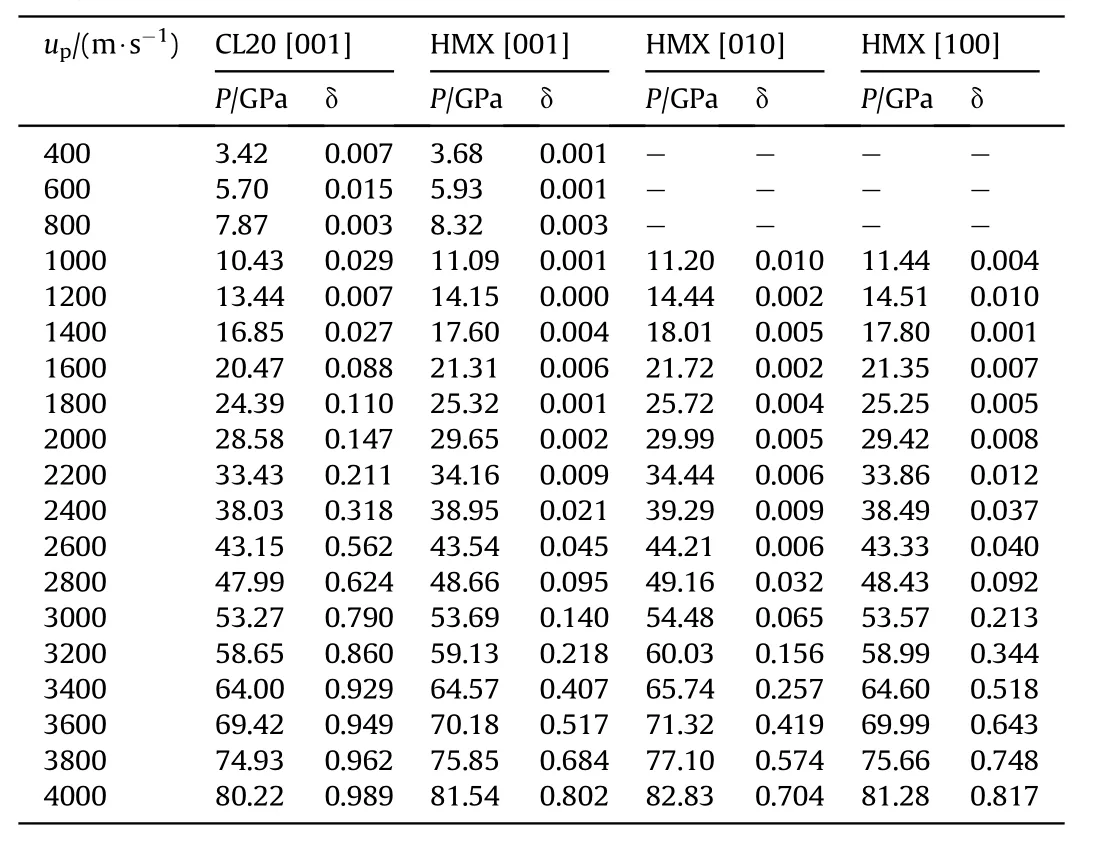
Table A1(a)Reaction rate and shockwave pressure when the explosive under shock loading along with various velocities.
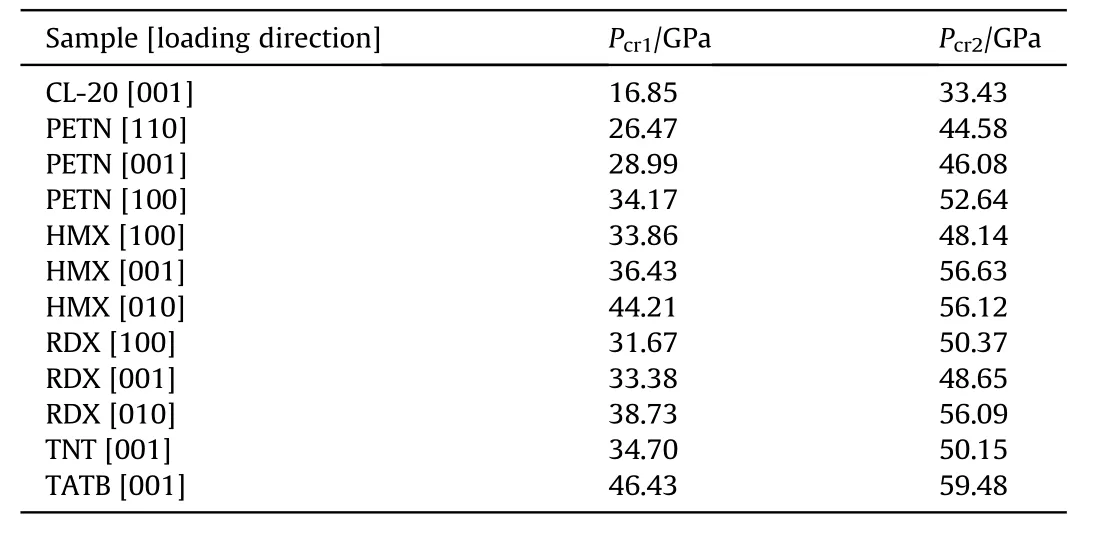
Table 1 Critical pressures for shock-induced ignition and detonation of common explosives.

Table A2 H50 obtained from the dropped-weight test[27,52].

Table A3 Gap thicknesses obtained from the gap test,and the critical input pressures [12,16,21,22,52,53].
Fig.5 compares the critical shock-induced ignition and detonation pressures obtained from reactive MD simulations, withdata obtained from the dropped-weight test [27,52] and critical input pressures calculated by Keshavarz[16,53].The critical shockinduced ignition pressureincreased in the order CL-20, PETN,RDX, HMX, TNT, and TATB, and thealso increased.The rank of shock-ignition sensitivity arranged by critical pressurewas consistent with the impact sensitivity test.Fig.5(b) shows that critical shock-induced detonation pressurefor CL-20, PETN,HMX,RDX,TNT,and TATB under strong shock-loading increased in that order,and the critical input pressure also increased.The rank of shock detonation sensitivity arranged by the critical pressurewas consistent with the gap test.Hence, the results indicate that the critical pressure obtained from reaction MD simulations can accurately and quantitatively characterize shock sensitivity.
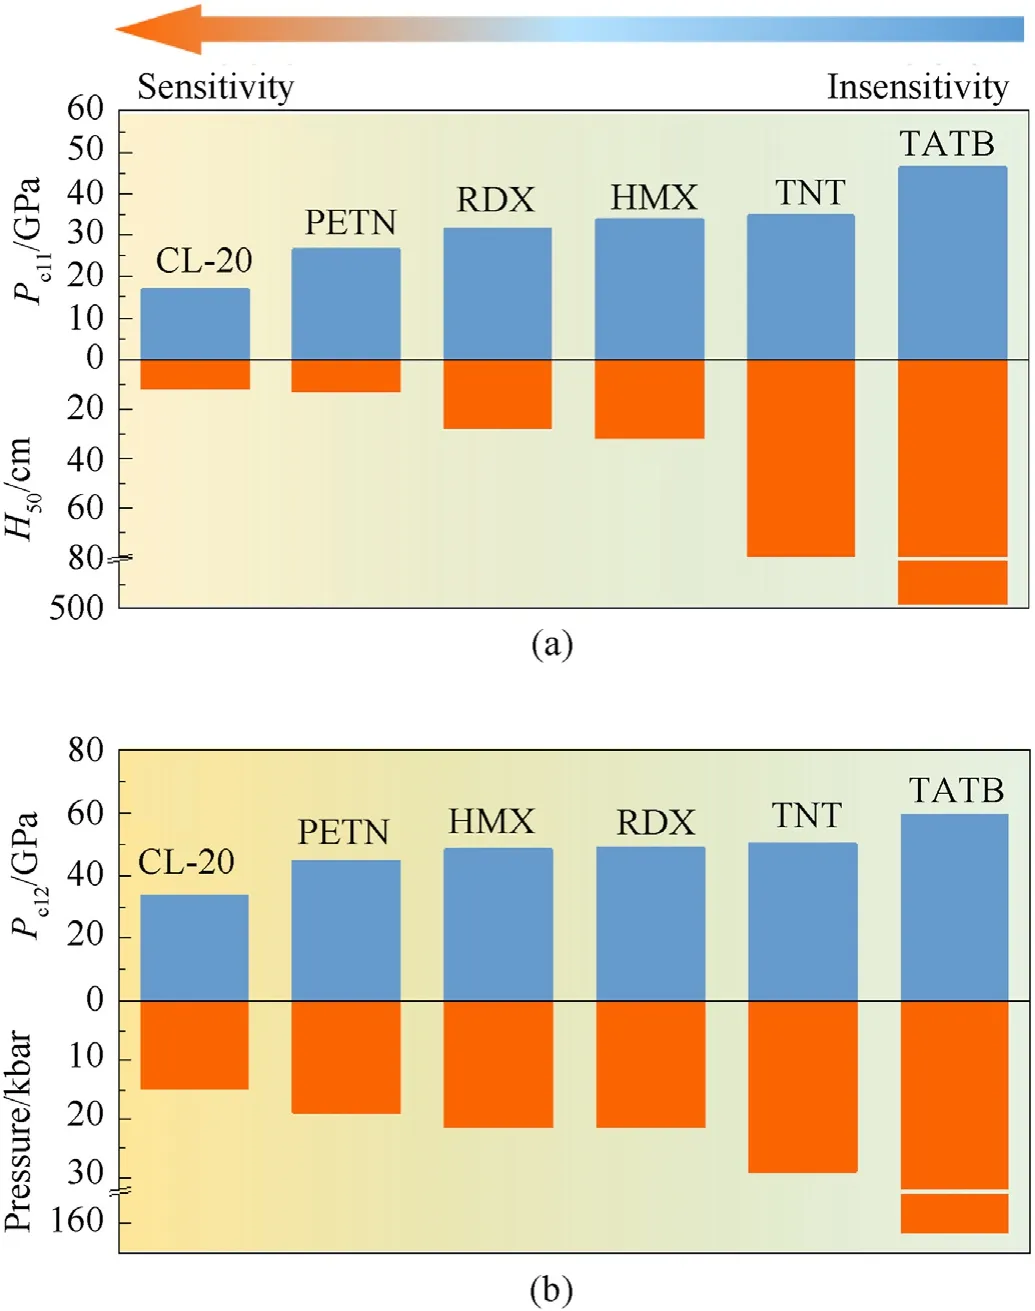
Fig.5.Comparisons of critical shock-induced ignition and detonation pressures obtained from reactive molecular dynamics simulations, with H50 obtained from the dropped-weight test [27,52] and critical input pressures calculated by Keshavarz[16,53].(a) shock-induced ignition, (b) shock-induced detonation.
Schematics of the shock-loading directions and the critical shock-induced ignition pressures of PETN, RDX, and HMX are shown in Fig.6.As shown in Fig.6(a),the critical pressure for PETN ignition was 34.17 GPa when shock-loading was along the [100]orientation.It was 28.99 GPa when shock loading was along the[001] orientation.The lowest was 26.47 GPa along the [110]orientation.As noted above,a low critical pressure indicates a high sensitivity.Thus, the most sensitive shock-loading of PETN was along the [110] orientation, which was consistent with previous results [35,54,55].
When shock loading RDX along the [100], [001], and [010] orientations, the critical pressures for ignition were 31.67 GPa,38.73 GPa, and 33.38 GPa, respectively [Fig.6(b)].It was lowest along the[100]orientation,indicating that impact in this direction was most likely to trigger a violent RDX chemical reaction.This was consistent with previous results [35].In Figure A8, RDX molecules were more likely to slide along the slip channel, because of steric hindrance, when shock loading was along the [100] orientation.That led to a rapid temperature rise and was more likely to trigger violent chemical reactions.
Fig.6(c) shows that the critical pressures of shock-induced ignition for HMX were 33.86 GPa, 44.21 GPa, and 36.43 GPa along the [100], [010], and [001] orientations, respectively.Hence, the most insensitive direction was along the[010]orientation.Because the crystal structure of β-HMX is monoclinic, the general crystal cutting method was used to obtain cells with orthogonal structures.Hence, the results could not be directly compared with those of Zhou and Ge[38,56].However,the anisotropic reaction mechanism of orthogonal HMX under shock-loading could still be understood in terms of steric hindrance and slip channels.Fig.A9 shows the detailed orthogonal cell structure of HMX.There were slip channels along the [100] and [001] orientations of the supercells.Whereas,along the [010] orientation, the molecules stacked almost perpendicularly to the shock-loading direction.Therefore,relative slippage was difficult under shock-loading.As a result,when shock-loading was along the [100] and [001] orientations of HMX, steric hindrance made it was easier to cause relative sliding along the slip channel.This led to rapid temperature increases, which made the[100] and [001] orientations more sensitive.
The results show that critical pressures calculated from reactive MD can accurately characterize shock sensitivities and can be used to analyze anisotropic reactions of explosives under shock-loading along different directions.
Then we predicted the sensitivity characteristics of PETNA.PETNA is a polynitramino compounds outperform PETN,which was synthesized though replaced O in PETN with NH by Young-Hyuk Joo and Jean'ne M.Shreeve [57].At present, there is no experimental data on the shock sensitivity of PETNA.Fig.7 shows the molecular structure of PETNA and the relationship between the reaction rate and shock-wave pressure when shock-loading was orientated along the[001]orientation of PETNA.From Fig.7 we can see that molecular structure of PETNA is similar with PETN and the critical pressures for ignition and detonation of PETNA when shockloading along the [001]orientation were 29.11 GPa and 49.15 GPa,respectively.The critical pressures show that PETNA is less sensitive than PETN.

Fig.6.Schematic of shock-loading directions and critical shock-induced ignition pressures of PETN, RDX, and HMX.
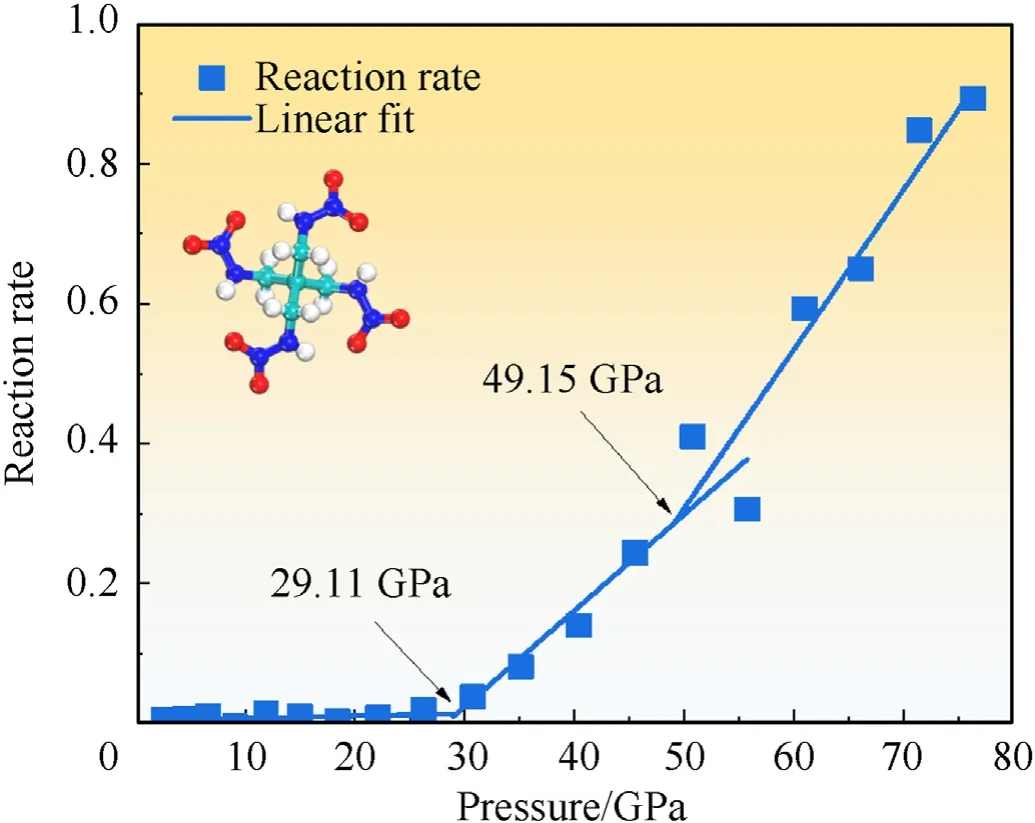
Fig.7.Molecular structure of PETNA and relationship between the reaction rate and shock-wave pressure when shock-loading was orientated along the [001] orientation of PETNA.
5.Conclusions
A method for predicting explosive shock sensitivity was discussed.It was based on critical pressures of shock-induced ignition and detonation calculated via reactive MD simulations.The fraction of reacted explosive molecules in an initial supercell varied linearly with the shock-wave propagation distance.The slope could be used to determine the reaction rate of the explosive under shockloading.The rates of various explosives differed with the shockloading pressure, as indicated by two-stage linearities with different slopes.The two inflection points corresponded to the thresholds of shock-induced ignition and detonation,which helped to determine their corresponding critical pressures.The calculated shock sensitivities of common explosives and anisotropies of PETN,RDX, and HMX were consistent with previous studies.The quantitative predictions of shock sensitivity based only on crystal structure were accurate and practical.Therefore, this method will be of great significance for the design and safe use of explosives.
The authors declare that they have no known competing financial interests or personal relationships that could have appeared to influence the work reported in this paper.
This work was supported by the National Natural Science Foundation of China (Grant No.11832006).
The initial unit cell structure of CL-20 was obtained from the Cambridge Crystallographic Data Centre (CCDC, CCDC number 25140) (Fig.A1 (a)).For non-orthorhombic crystals CL-20, the general crystal-cutting method[40,41]was used to obtain unit cells with orthorhombic structures (Fig.A1 (b)).Equilibrium structures for orthorhombic crystals were initially obtained by relaxation(Fig.A1 (c)), then the cells were enlarged along shock-loading directions to construct supercells (Fig.A1 (d)).To obtain the equilibrium structure at 0 K,the orthorhombic cell was first relaxed by energy minimization,adopting a conjugate gradient algorithm at a force convergence tolerance of 10(kcal/mol)/Å.According to the Maxwell-Boltzmann distribution, the initial speed, for all atoms,were set at 298 K.A molecular dynamics simulation was thereafter performed for 5 ps,with the canonical ensemble(NVT)set at 298 K,using the Berendsen thermostat.Finally, the equilibrium structure(Fig.A1c)was obtained by an isobaric-isothermal (NPT)molecular dynamics simulation at 0 Pa and 298 K for 5 ps [30,42,43].The supercell dimensions when undergoing the shock were:27.04 Å×25.61 Å×234.57 Å(Fig.A1(d)),and consisted of 432 unit cells with 15552 atoms.
The above procedure was also used to construct supercells for non-orthorhombic crystals HMX and TATB,as shown in Fig.A2 and A3.Equilibrium structures for orthorhombic crystals such as PETN,RDX TNT were directly relaxed by the above procedure, then the cells were enlarged along shock-loading directions to construct supercells, as shown in Fig.A4, A5 and A6.
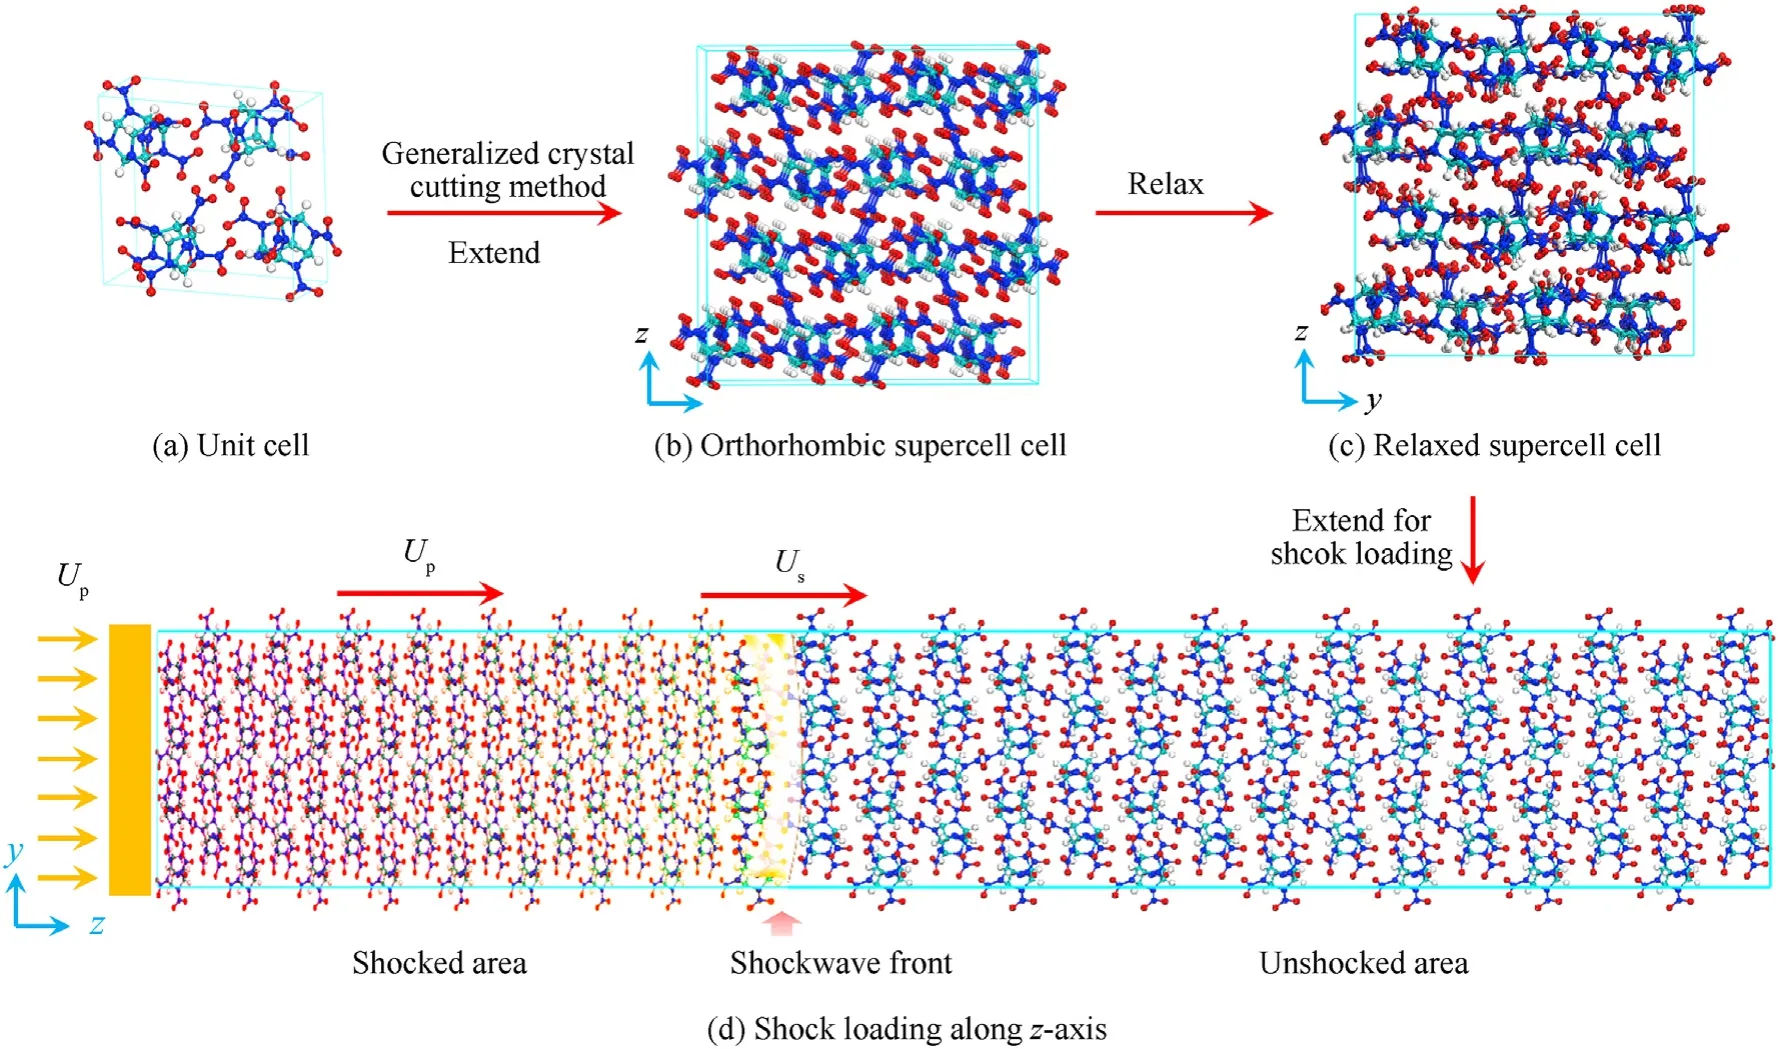
Fig.A1.The CL-20 supercell construction process, in which C, H, N and O atoms of CL-20 are colored cyan, white, blue and red, respectively.
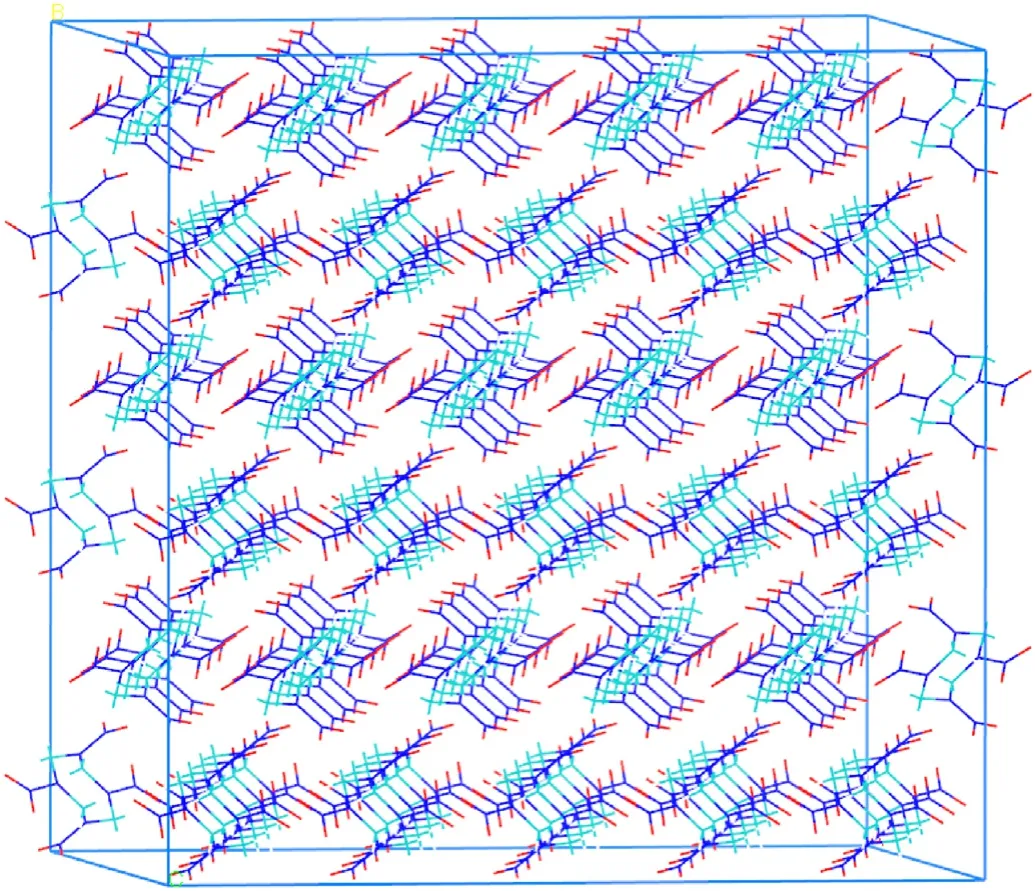
Fig.A2.Orthorhombic crystals of HMX obtained by general crystal-cutting method.The supercell dimensions when undergoing the shock were:229.88 Å × 33.30 Å × 28.85 Å, and 840 unit cells with 23520 atoms;32.85 Å × 232.91 Å × 28.85 Å, and 840 unit cells with 23520 atoms;32.85 Å×33.30 Å×231.06 Å,and 960 unit cells with 26880 atoms,for the[100],[010]and [001], respectively.
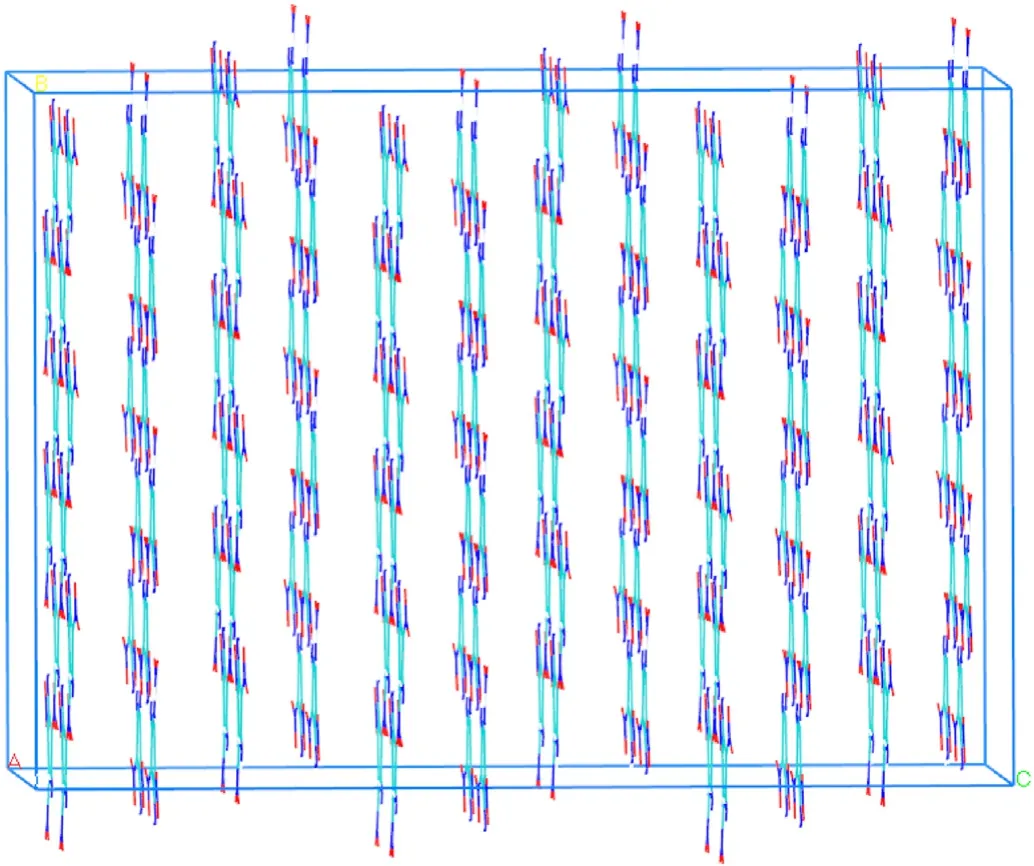
Fig.A3.Orthorhombic crystals of TATB obtained by general crystal-cutting method.The supercell dimensions when undergoing the shock were 31.22 Å × 27.08 Å × 224.92 Å, and 1152 unit cells with 27648 atoms.
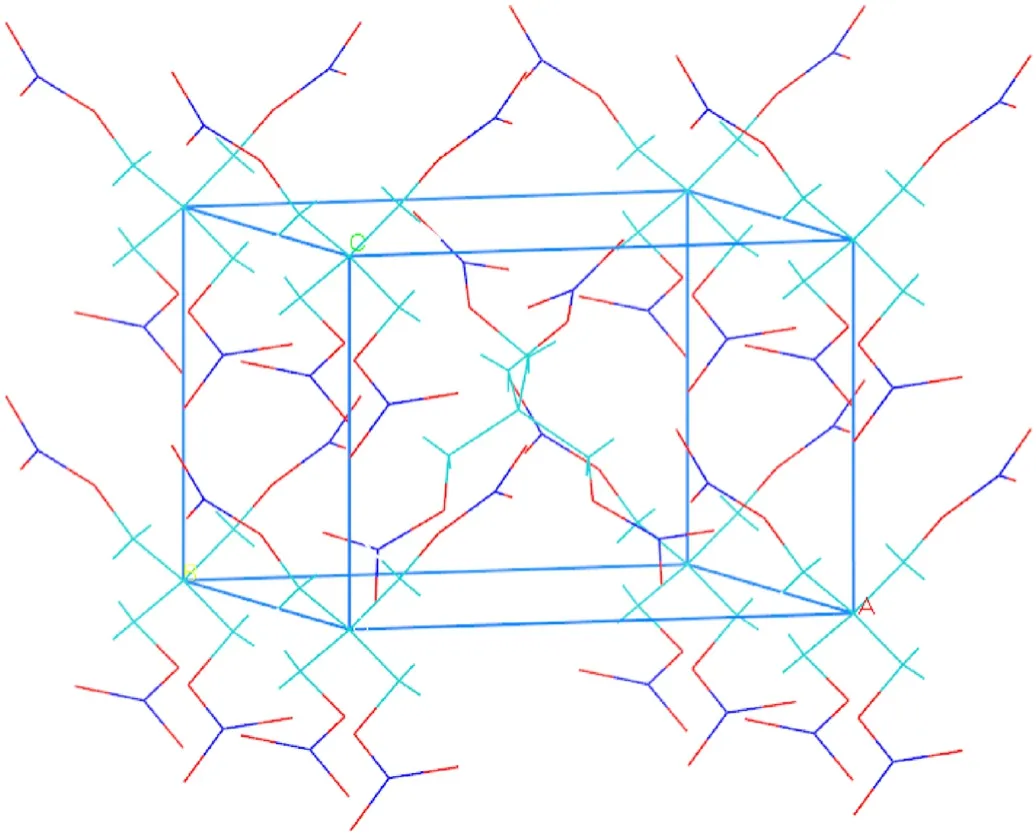
Fig.A4.Orthorhombic crystals of PETN obtained from the Cambridge Crystallographic Data Centre (CCDC, CCDC number 669555).The supercell dimensions when undergoing the shock were: 226.82 Å × 28.35 Å × 27.00 Å, 28.35 Å × 28.35 Å × 215.66 Å,26.71 Å × 26.71 Å × 240.46 Å, for the [100], [001] and [110], respectively.All the supercells consisted of 576 unit cells with 16704 atoms.
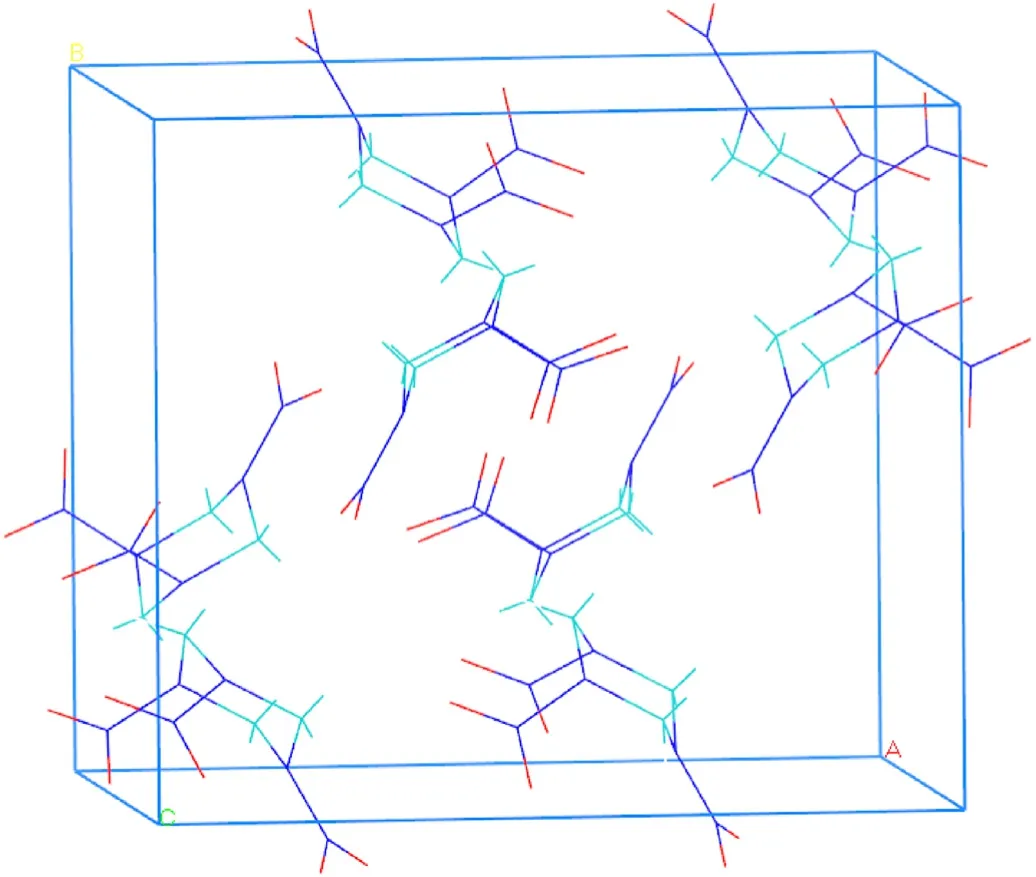
Fig.A5.Orthorhombic crystals of RDX obtained from the Cambridge Crystallographic Data Centre (CCDC, CCDC number 1131953).The supercell dimensions when undergoing the shock were: 210.46 Å × 34.64 Å × 32.05 Å, and 1152 unit cells with 24192 atoms; 26.43 Å × 230.42 Å × 32.05 Å, and 960 unit cells with 20160 atoms;26.43 Å×23.20 Å×268.41 Å,and 800 unit cells with 16800 atoms,for the[100],[010]and [001], respectively.
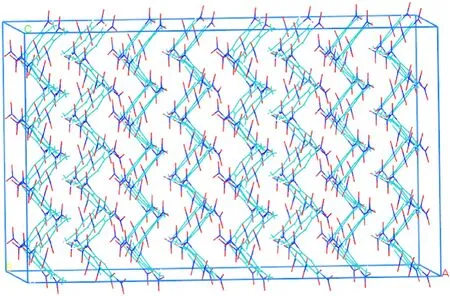
Fig.A6.Orthorhombic crystals of TNT from the Cambridge Crystallographic Data Centre(CCDC,CCDC number 1319538).The supercell dimensions when undergoing the shock were 39.51 Å × 29.59 Å × 239.88 Å, and 1280 unit cells with 26880 atoms.
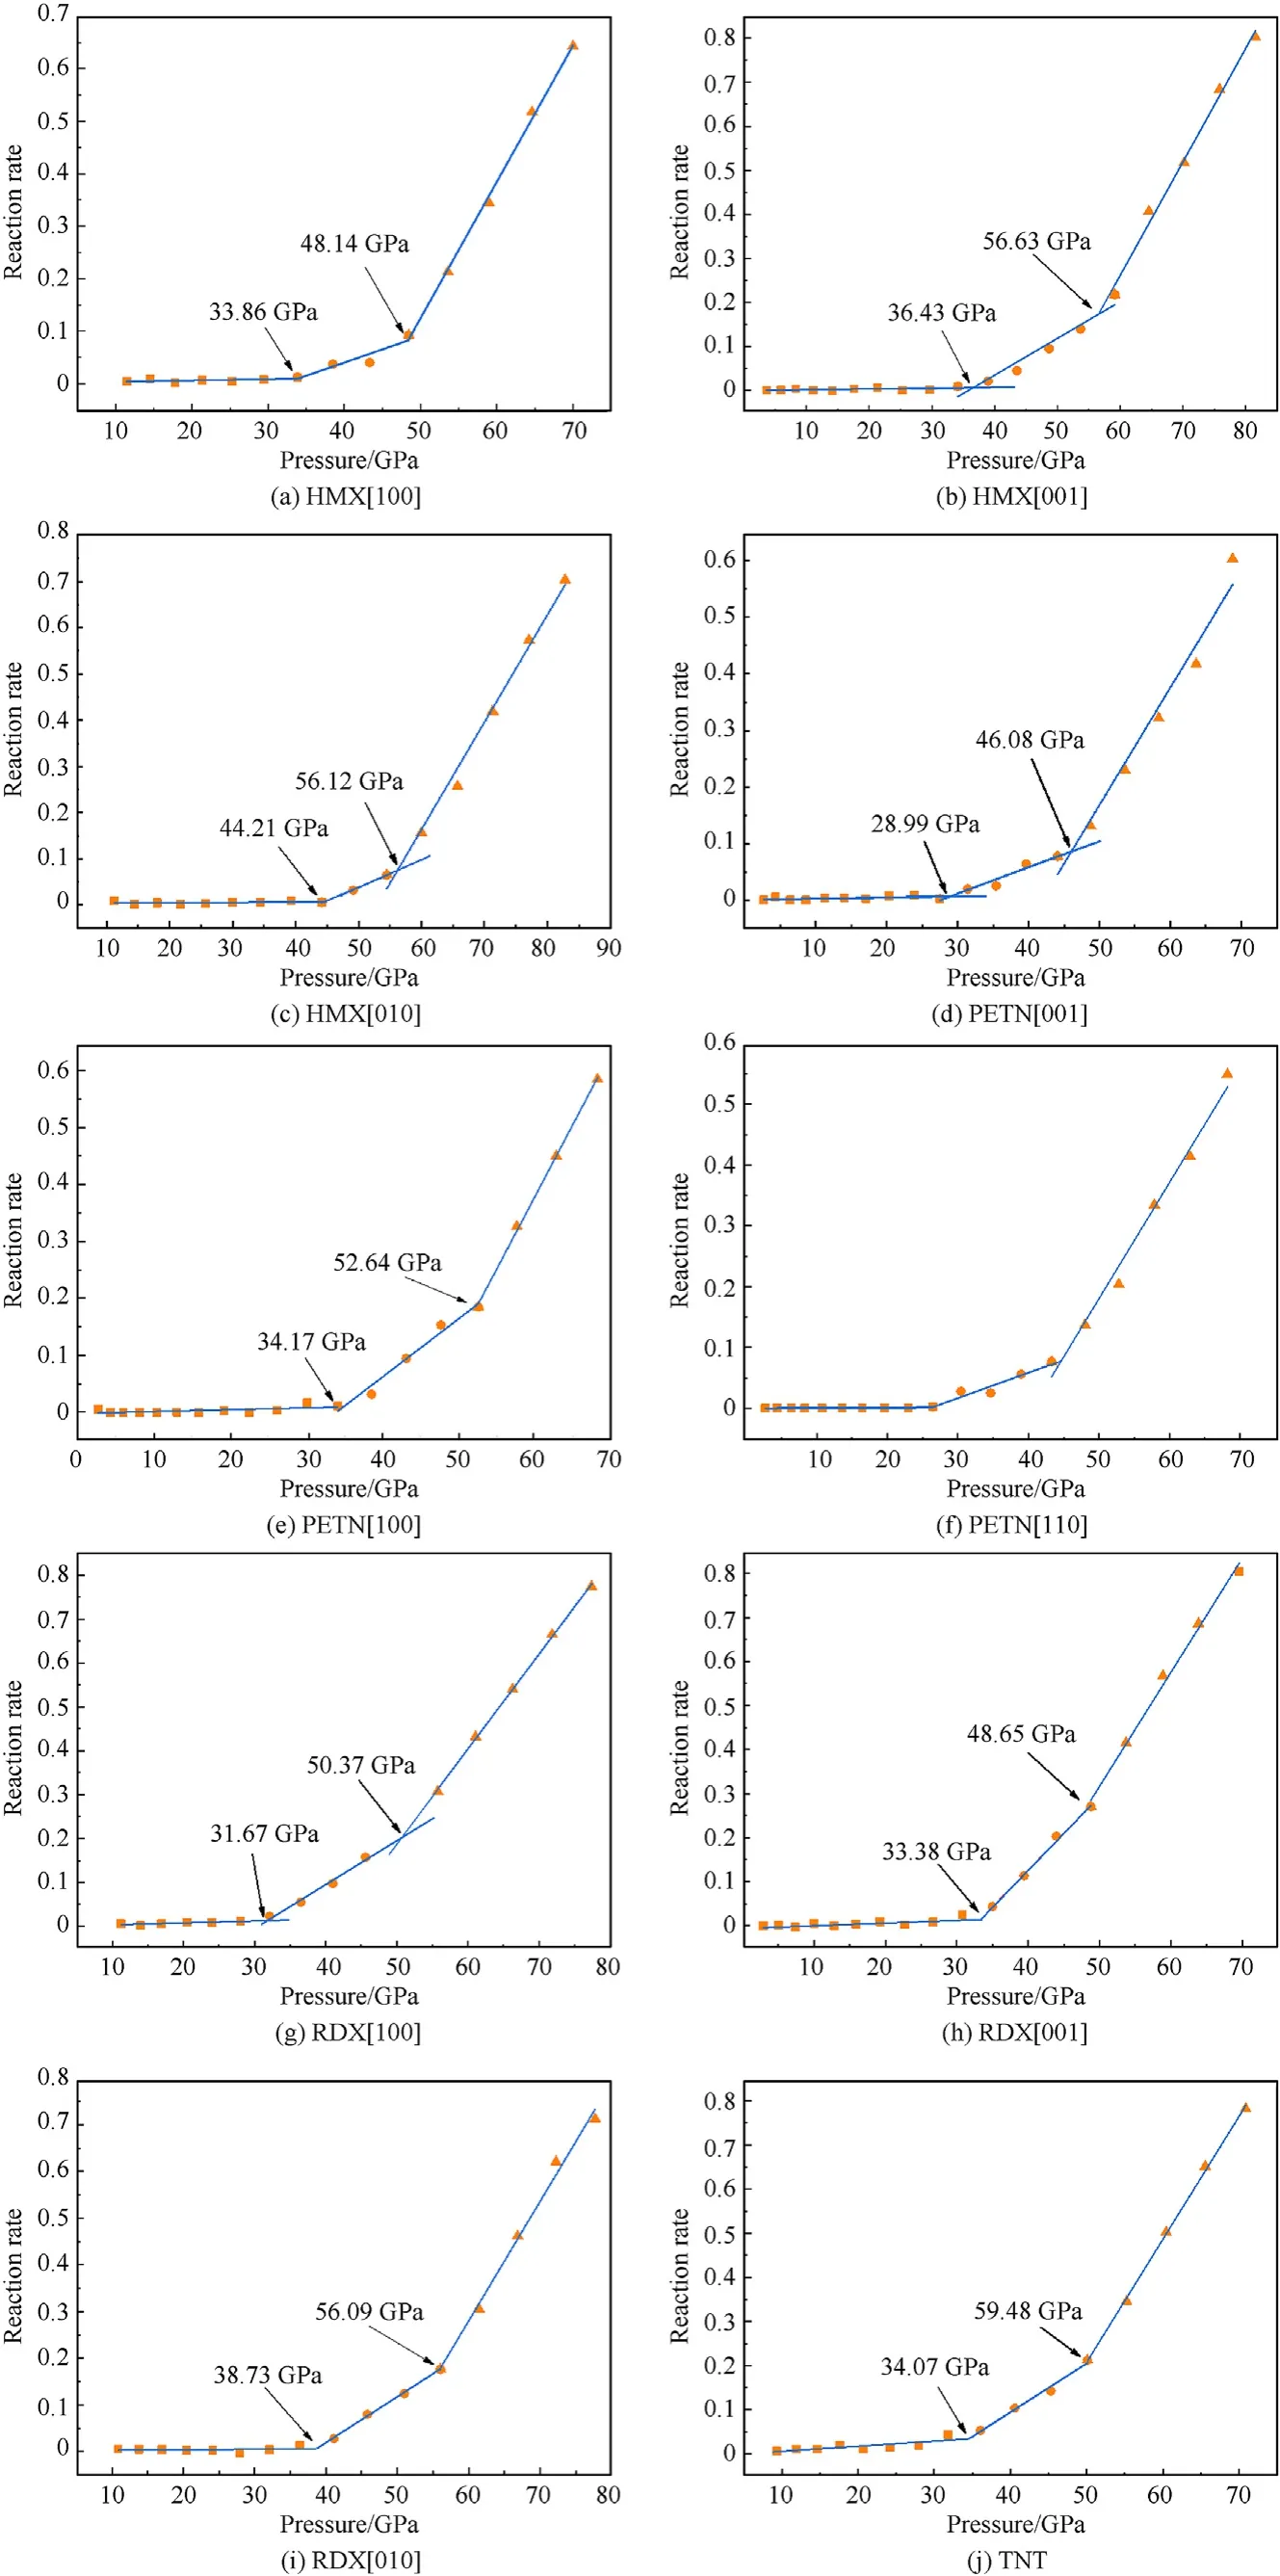
Fig.A7.Relationship between reaction rate and shock-wave pressure.
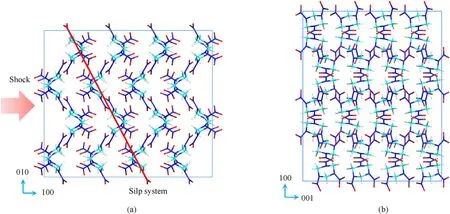
Fig.A8.Slip system for orthogonal cell structure of RDX.
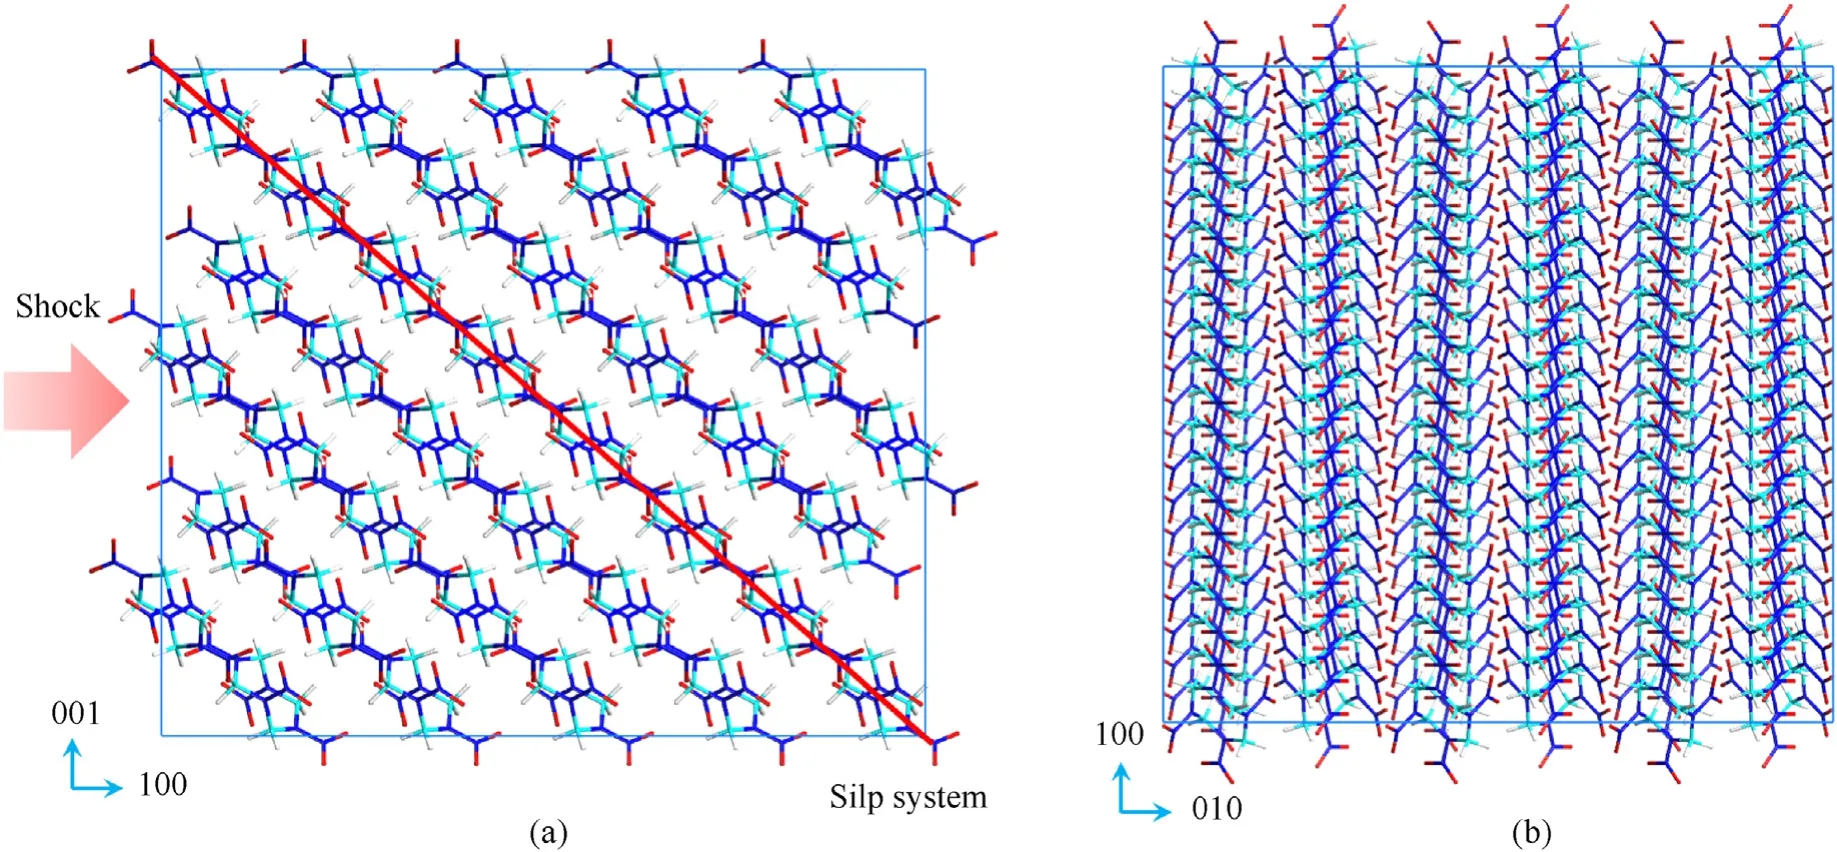
Fig.A9.Slip system for orthogonal cell structure of HMX.
- Defence Technology的其它文章
- Defence Technology
- Roll angular rate extraction based on modified spline-kernelled chirplet transform
- Buckling of composite cylindrical shells with ovality and thickness variation subjected to hydrostatic pressure
- Preparation of the core-shell HMX@CS microparticles by biological excitation:Excellent hydrophobic-oleophilic properties and decreased impact sensitivity effectively
- An efficient light-to-heat conversion coupling photothermal effect and exothermic chemical reaction in Au NRs/V2C MXene membranes for high-performance laser ignition
- Hygrothermal effect on high-velocity impact resistance of woven composites

