Robust ordinal mislabel logistic regression based on γ-divergence*
GUO Meijun, REN Mingyang, LI Shiming, ZHANG Sanguo†
(1School of Mathematical Sciences, University of Chinese Academy of Sciences,Beijing 100049,China; 2 Key Laboratory of Big Data Mining and Knowledge Management, Chinese Academy of Sciences,Beijing 100049,China; 3 Beijing Tongren Eye Center, Beijing Tongren Hospital, Beijing Ophthalmology & Visual Science Key Laboratory, Beijing Institute of Ophthalmology, Capital Medical University,Beijing 100730, China) (Received 3 January 2020; Revised 13 April 2020)
Abstract Ordinal multi-classification methods have been studied widely. Traditional ordinal multi-classification methods assume that the sample label is not mislabeled. Due to the complexity of the real data and the limited artificial experience, it is unrealistic to obtain completely accurate labels, in which conventional methods perform poorly. In this article, we propose an ordinal mislabel logistic regression method based on γ-divergence, which possessing strong robustness when dealing with ordinal mislabeled response data. That is to say, when mislabeled, the weight of the sample in parameter estimation equation diminish compared to the case that the sample is properly labeled. Our method not only possesses the robustness but also can ignore the mislabel probabilities in the model. We construct the model by minimizing γ-divergence estimation and solve the model by gradient descent algorithm. Both simulation studies and real data analysis demonstrate that the method, namely robust ordinal mislabel logistic regression, is efficient to analyze ordinal mislabeled response data.
Keywords γ-divergence; logistic regression; mislabeled response; ordinal classification; robustness
The classification problem of ordinal response data, examples of this including cancer patients grouped in early, mediocre and terminal stages, customers grouped into low, middle and high credit levels, are widely discussed in recent years. Some methods[1-3]have been proposed to solve the problem. A direct method for ordinal response data is to convert ordinal labels to numerical values, such as the conversion of {excellent, good, moderate,poor} to {1,2,3,4}. As a result, a regression method can be applied to the converted dataset. However, not all class labels can be converted to positive integers. Another method is to convert class labels to common numerical value rather than positive integers by a map. Nevertheless, it is difficult to define the mapping function. Frank and Hall[4]proposed a method that converted ordinal classification problem to several binary classification problems. For eachi∈{0,1,2,3,…,K}, each sample is classified between the meta-class including classes 0 toiand the meta-class including classesi+1 toK. The final classification result can be inferred from theKbinary predictions. Shashua and Levin[5]extended SVM for ordinal regression by findingKordinal thresholds, namelyb1≤b2≤…≤bK, spliting the real line intoK+1 ordinal parts. Wang et al.[6]proposed nonparallel support vector for ordinal regression by constructing a hyperplane in each class. However, these methods perform poorly when the ordinal label is mislabeled.
More and more literatures studied mislabeled response data by means of binary logistic regression[7]. Tian and Sun[8]proposed a new fuzzy set method to detect suspectable mislabeled points, and then delete their labels and construct a semi-supervised model. Logistic regression based on different mislabel probabilities are also widely used to mislabeled unordered response data. Copas considered equal and constant mislabel probabilities[9]and Komori et al.[10]assumed mislabeling occurs only the 0-group. In addition, Hung et al.[7]proposed a robust mislabel logistic regression based onγ-divergence with the property of strong robustness in dealing with binary mislabeled response data. Neverthelss, above studies is not suitable to mislabeled ordinal response data.
In this article, we applyγ-divergence to ordinal multiple classification logistic regression and construct a robust ordinal mislabel logistic regression model, which not only possess the strong robustness but also the mislabel probabilities need not to be modeled. Our method have better effectiveness on ordinal mislabeled response data. It is noted that althoughγ-divergence has been previously adopted for regression analysis, to the best of our knowledge,γ-divergence has never been applied to ordinal response data.
1 Methodology
Given a dataset {(xi,y0i),i=1,2,…,n} in binary logistic regression, wherexi∈p,y0i∈{0,1}, letp=P(y0=1|X=x),1-p=P(y0=0|X=x), the log-odds (or logit) of probabilitypof an event is defined as logit(p)=log [p/(1-p)]=βTx+b.
1.1 Ordinal logistic regression
logit[π0(x)+π1(x)+π2(x)+…+πj(x)]
=βTx+bj+1,j=0,…,K-1.
(1)
And the coefficient vectorβ=(β1,β2,…,βp)Tis the same for alljin equation (1). Their intercept termsb1,b2,…,bKsplit the plane intoK+1 ordinal parts. Therefore, we only need to estimate parametersβ,b1,b2,…,bK, andβj+1=(βT,bj+1)Tdenotes (j+1)-th hyperplane,j=0,1,2,…,K-1.
According to Eq.(1), we obtain the category probability functions as follows:
(2)
1.2 The minimum γ-divergence estimation and its estimation equation
Letgbe the data generating probability density function andfθbe the model probability density function indexed by the parameterθ, theγ-divergence betweengandfθis defined as[7]
(3)
where
In the presence of contamination,g=εfθ*+(1-ε)τ,θ*is the true model parameter, 1-εis the contamination proportion andτis the contamination density function. The estimation criterion of the minimumγ-divergence estimates parameter by minimizingDγ(g,fθ), which is equivalent to minimizing


1.3 Robust ordinal mislabel logistic regression method
Considernindependent samples and combine the discussions ofHγ(ε,τ;θ), the empirical version of theγ-divergence loss function[7]is
(4)

In conventional ordinal logistic regression model withK+1 classes, namelyy0∈{0,1,…,K}, the probability density function
(5)

F(β,b1,…,bK)
(6)
where
‖f(·|x;β,b1,…,bK)‖1+γ

(7)
(8)
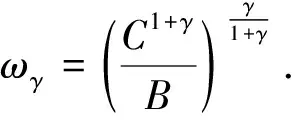
with the weight function
(9)
and whereAi=exp(βTxi),
Bi=
(10)
Ci=
(11)

1.4 Computation
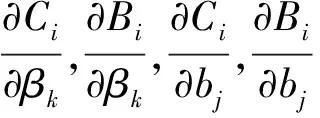
Due to the complexity of the second derivative of the objective function based onγ-divergence, in this paper, we adopt the gradient descent algorithm to solve model, which is summarized in Algorithm 1.

Algorithm1Gradient descent algorithm
--------------------
Require:The dataset: (xi,yi),i=1,2,…,n, the tuning parameter:γ.

repeat
s=s+1;
fork=1,2,…,pdo
endfor
forj=1,2,…,Kdo
endfor
(β(s+1),b(s+1))=(β(s),b(s))-
until
returnβT(s+1),bT(s+1).

The proposed objective function has a complex form, so it is difficult to establish the convergence property. Experimental results demonstrate that, for all of our simulated and real datasets, convergence is successfully achieved within 50 overall iterations (mostly within 20 iterations).
The definition ofγ-divergence and studies suggest thatγbalances between robustness and efficiency. However, Fujisawa and Eguchi[12]said there could be not consistent best way to select an appropriate tuning parameterγ. In practice, there are some methods to select the tuning parameterγ, such as the adaptive selection procedure by Mollah et al.[13], the cross validation[14]and a sequence of the parameter[15]. In this article, we consider a sequence ofγas 1,2,3,4 and 5 following Zang et al.[15], and proceed the simulation study under each determinedγ.
2 Simulation studies
In the numerical simulation study, we consider ordinal three classification problem with possibly mislabeling, that’s to say, the labels of ordinal response datasy∈{0,1,2}, thenπ0(x),π1(x),π2(x), the probability density functionf(y|x;β,b1,b2), andCi,Bi,Aican be obtained by the (2), (5), (10)-(11), and the calculation results of them are placed in Appendix (A7)-(A13). Simulation results are reported with 500 replicates in the simulation studies.
2.1 Simulation settings
In each simulation run, we generate 300 random samplesxsin14, andxs~N(0,Σ), we consider three different structures of covariance matrixΣ=(σij)1≤i,j≤14,
1) the explanatory variables are independent, i.e.Σ=I,
2) the auto-regressive correlation (AR) given byσij=ρ|i-j|withρ=0.5 andρ=0.75,
3) the banded correlation (Band) given byσij=ρ|i-j|withρ=0.6 if |i-j|≤2,ρ=0 if |i-j|>2.
We generate ordered mislabeled labels {0,1,2} in the light of the following settings of mislabel probabilities:
(12)
where
ηij=P(y=j|y0=i,X=x),i,j=0,1,2.
We assumem={0.1,0.15,0.2,0.25,0.3} in the simulation. Considering the mislabel probabilities, the labels can be generated by following formulas:
(13)
2.2 Simulation results

Figure 1 displays the variation of classification error rate of 800 test samples withmunder different structures ofΣ. It can be seen clearly that the classification error rate obtained by COLR method increases more greatly than the classification error rate acquired by robust ordinal mislabel method with the increase of the mislabel probability (MP). Furthermore, we can selectγby the performance of classification from Fig.1. We can also note that there exists the best effectiveness whenγ=4.
WhenΣ=I, the comparisons between the true values and the estimates ofβ,b1,b2under differentγandmare presented in Fig.2 (a)-Fig.2 (d) and the comparisons between the true values and the estimates ofβ,b1,b2under differentγandmare displayed in Fig.2 (e)-Fig.2 (h) when the structure ofΣis AR withρ=0.5. Figure 2 show that, for all givenmandγand the structure ofΣis AR (ρ=0.5) orI, the estimates ofβ,b1,b2from the robust ordinal mislabel method are closer to the true values ofβ,b1,b2than from COLR method.
When the structure ofΣis Band, MAE of parameter estimation under differentγandmvalues are displayed in Fig.3 (a)-Fig.3 (d). When the structure ofΣis AR withρ=0.75, the MAE of parameter estimation are presented in Fig.3 (e)-Fig.3 (h). Figure 3 illustrate that the MAE of parameter estimation from the robust ordinal mislabel method is smaller than from COLR method. Both Fig.2 and Fig.3 demonstrate the robust ordinal mislabel method possesses better performance in estimating coefficients of the classification hyperplanes.
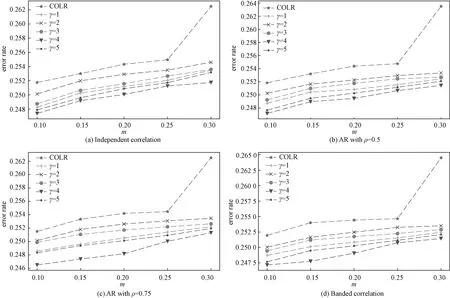
Fig.1 Variation of classification error rate with m under different Σ
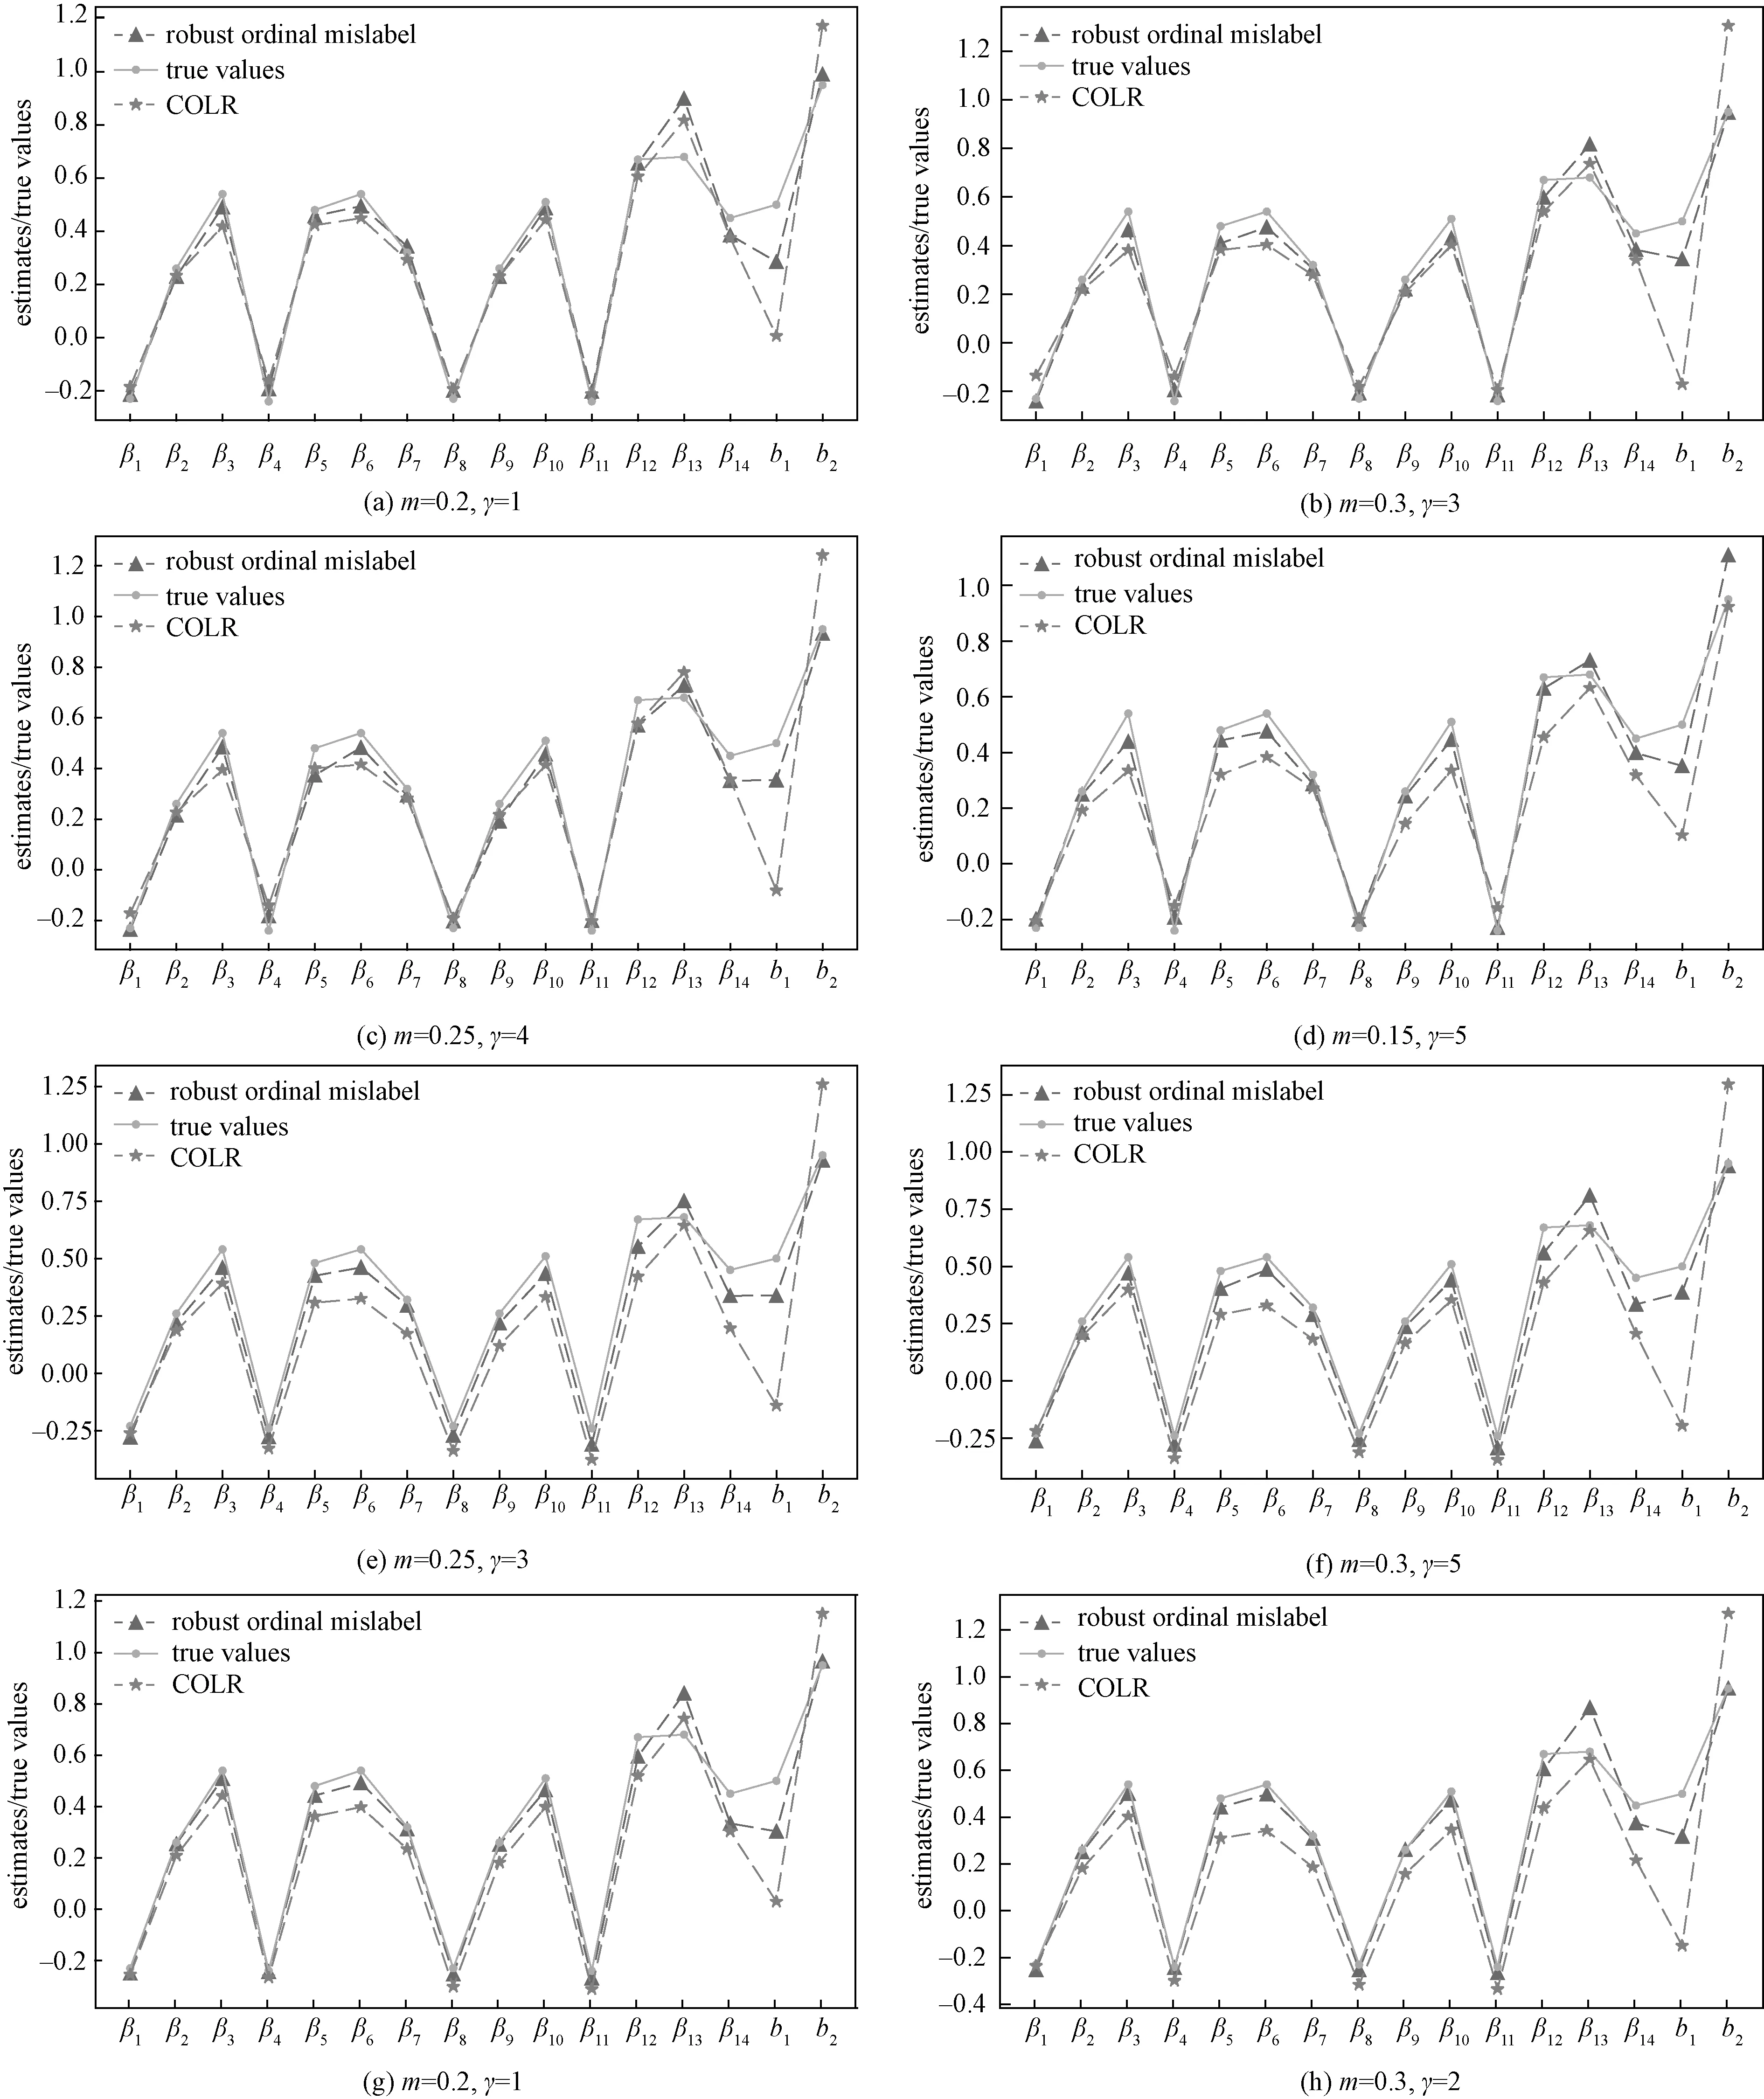
Fig.2 The comparisons between the true values and the estimates of β,b1,b2 under different settings
Table 1 displays MAE of parameter estimation and SD of the estimates from the COLR method and the robust ordinal mislabel method under differentΣ, MP andγvalues. We can obviously find that the MAE and the SD from robust ordinal mislabel method are smaller than from COLR method respectively. It also demonstrates that the robust ordinal mislabel method performs well and more robustly than COLR method in estimating coefficients.
In addition, we verify the effectiveness of the proposed method on samples conforming to the heavy tailed distribution, such ast-distribution, mixture of normal distribution. In each simulation, we generate two groups of random samplesxsin14, 300 in each group.xsare from the distributiont(0,Σ,df=3) in the first group andxsare from mixture of normal distribution (0.2,0,I; 0.3,0,AR(ρ=0.5); 0.3,0,AR(ρ=0.75); 0.2,0,Band) in the second group.
Whenγ=4 andxsare from the mixture of normal distribution, the MAE and SD of parameter estimation are displayed in Table 2. Whenγ=2 andxsare from the distributiont(0,Σ,3), the MAE and SD of parameter estimation are displayed in Table 3. From the resluts, we can obviously find that both MAE and SD from the COLR mtehod are larger than both MAE and SD from the robust ordinal mislabel method whenxsare from heavy tailed distributions. This also means that the robust ordinal mislabel method has better effectiveness than COLR method in estimating coefficients. Simultaneously, we can find from the Table 2 and Table 3 that MAE of parameter estimation is smaller when samples are from normal distribution in contrast with the situation that samples are fromt-distribution or mixture of normal distribution.
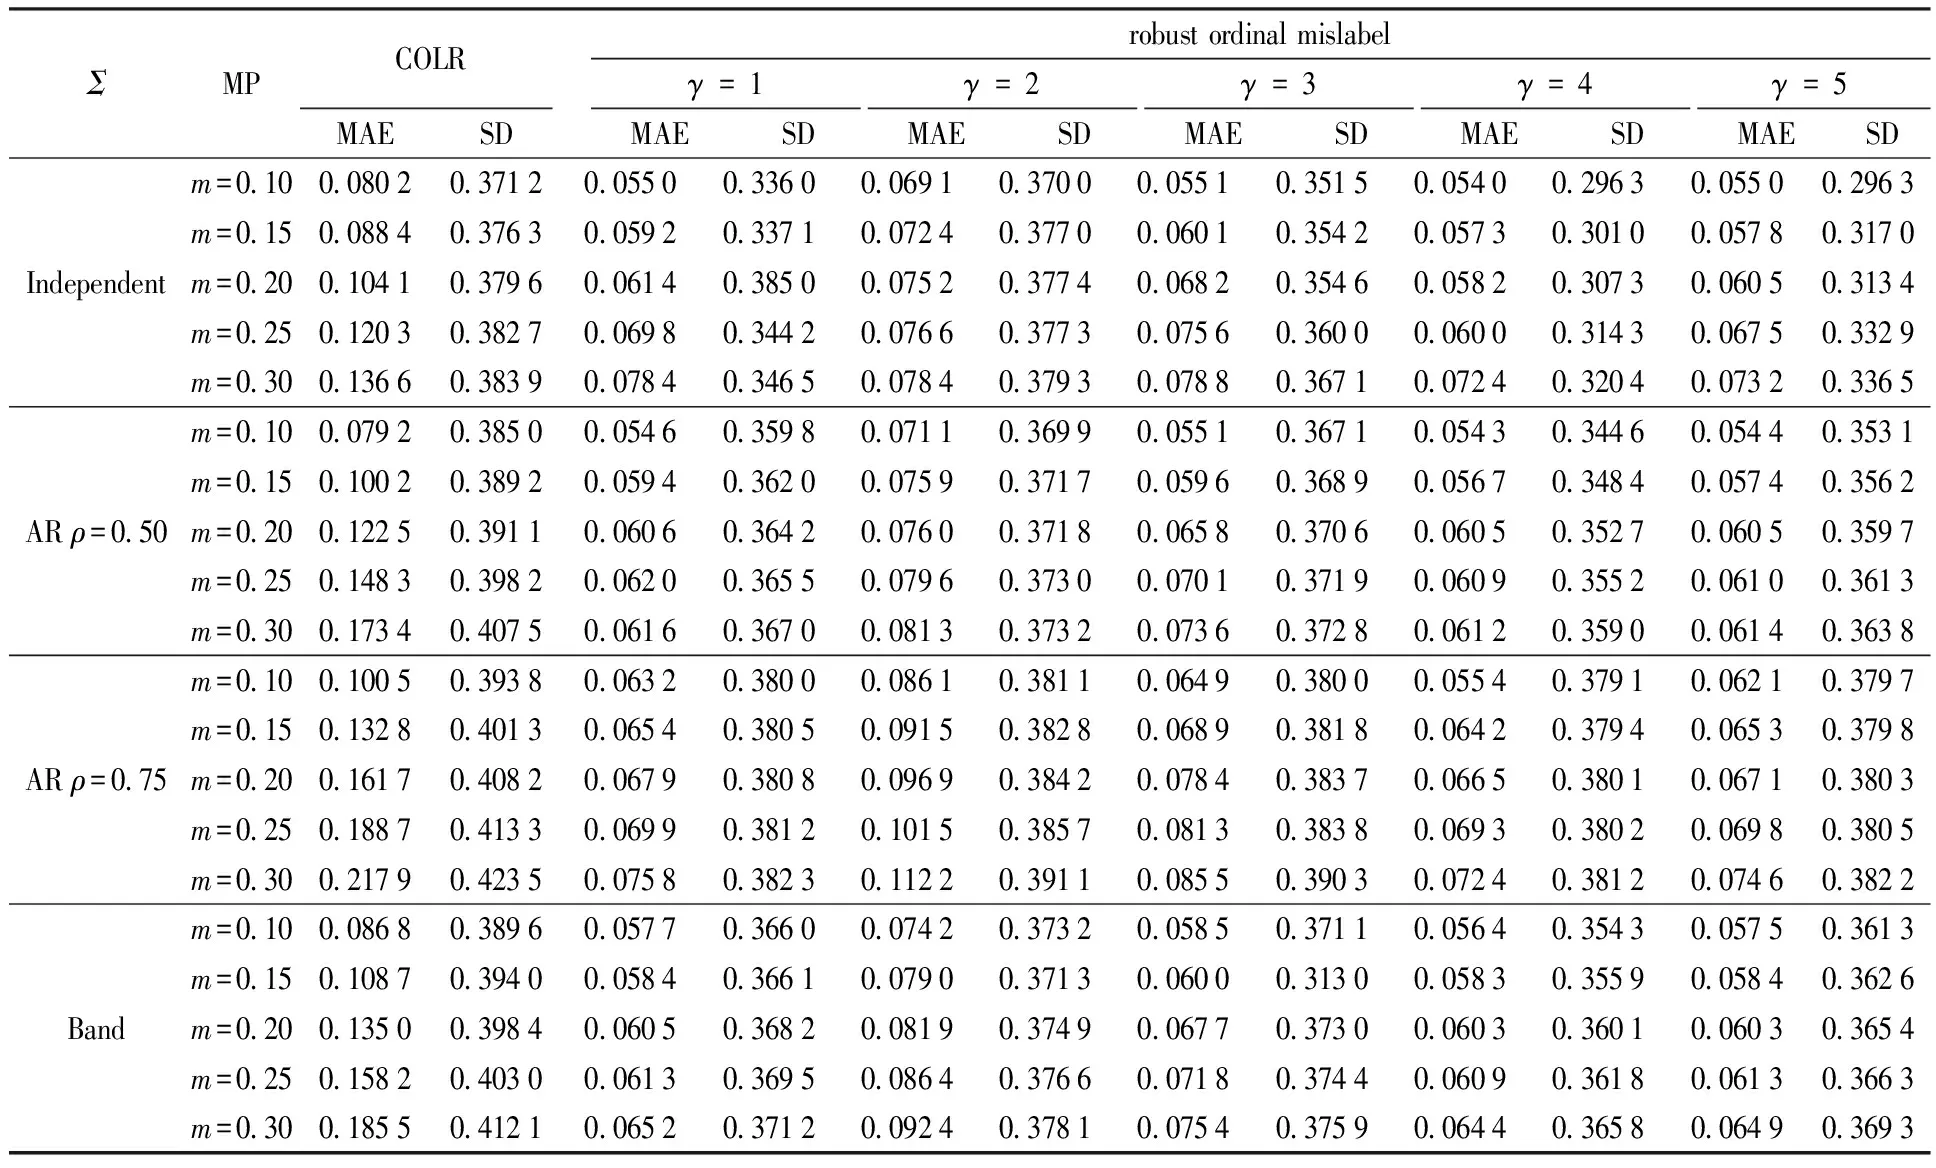
Table 1 MAE and SD from two methods under different settings

Table 2 MAE and SD from two methods under different distributions of X
3 Real data analysis
In this section, we demonstrate the effectiveness of the proposed method on real data. Our dataset, i.e. the childhood eye data, is from Beijng Tongren Hospital[16], which contains 6 years of data from the first grade to sixth grade, and the variables include ocular biometry, near work, food habits, living habits, habits of wearing spectacles in this school year, accommodative response, times outdoors, and parental myopia and so on.
In the childhood vision research, we regard the change of spherical equivalent (CSE) after mydriasis from first grade to sixth grade as dependent variable. We divide the range of myopia into high myopia, moderate myopia and low myopia. The CSE <-2.5 denotes high myopia, corresponding to class 2 and the label is 2 in this class. The -2.5≤ CSE≤-1.5 denotes moderate myopia and corresponds to class 1. The CSE>-1.5 denotes low myopia and corresponds to class 0. The level of myopia is an ordinal response data and spherical equivalent might be inaccurate because of limitation of mydriasis examination, so there might be some mislabeled responses in the data.
We use the factors of vision from the first grade students as the independent variables to construct regression model, which can analyze the effectivenss of variables on the myopia progression in primary school. These variables are divided into three categories: continuous variables, nominal variables and multi-class variables. The data used in the model contains 1 370 samples and 28 independent variables and the meanings of the variables are presented in Appendix B.
We analyse the real data from two cases.
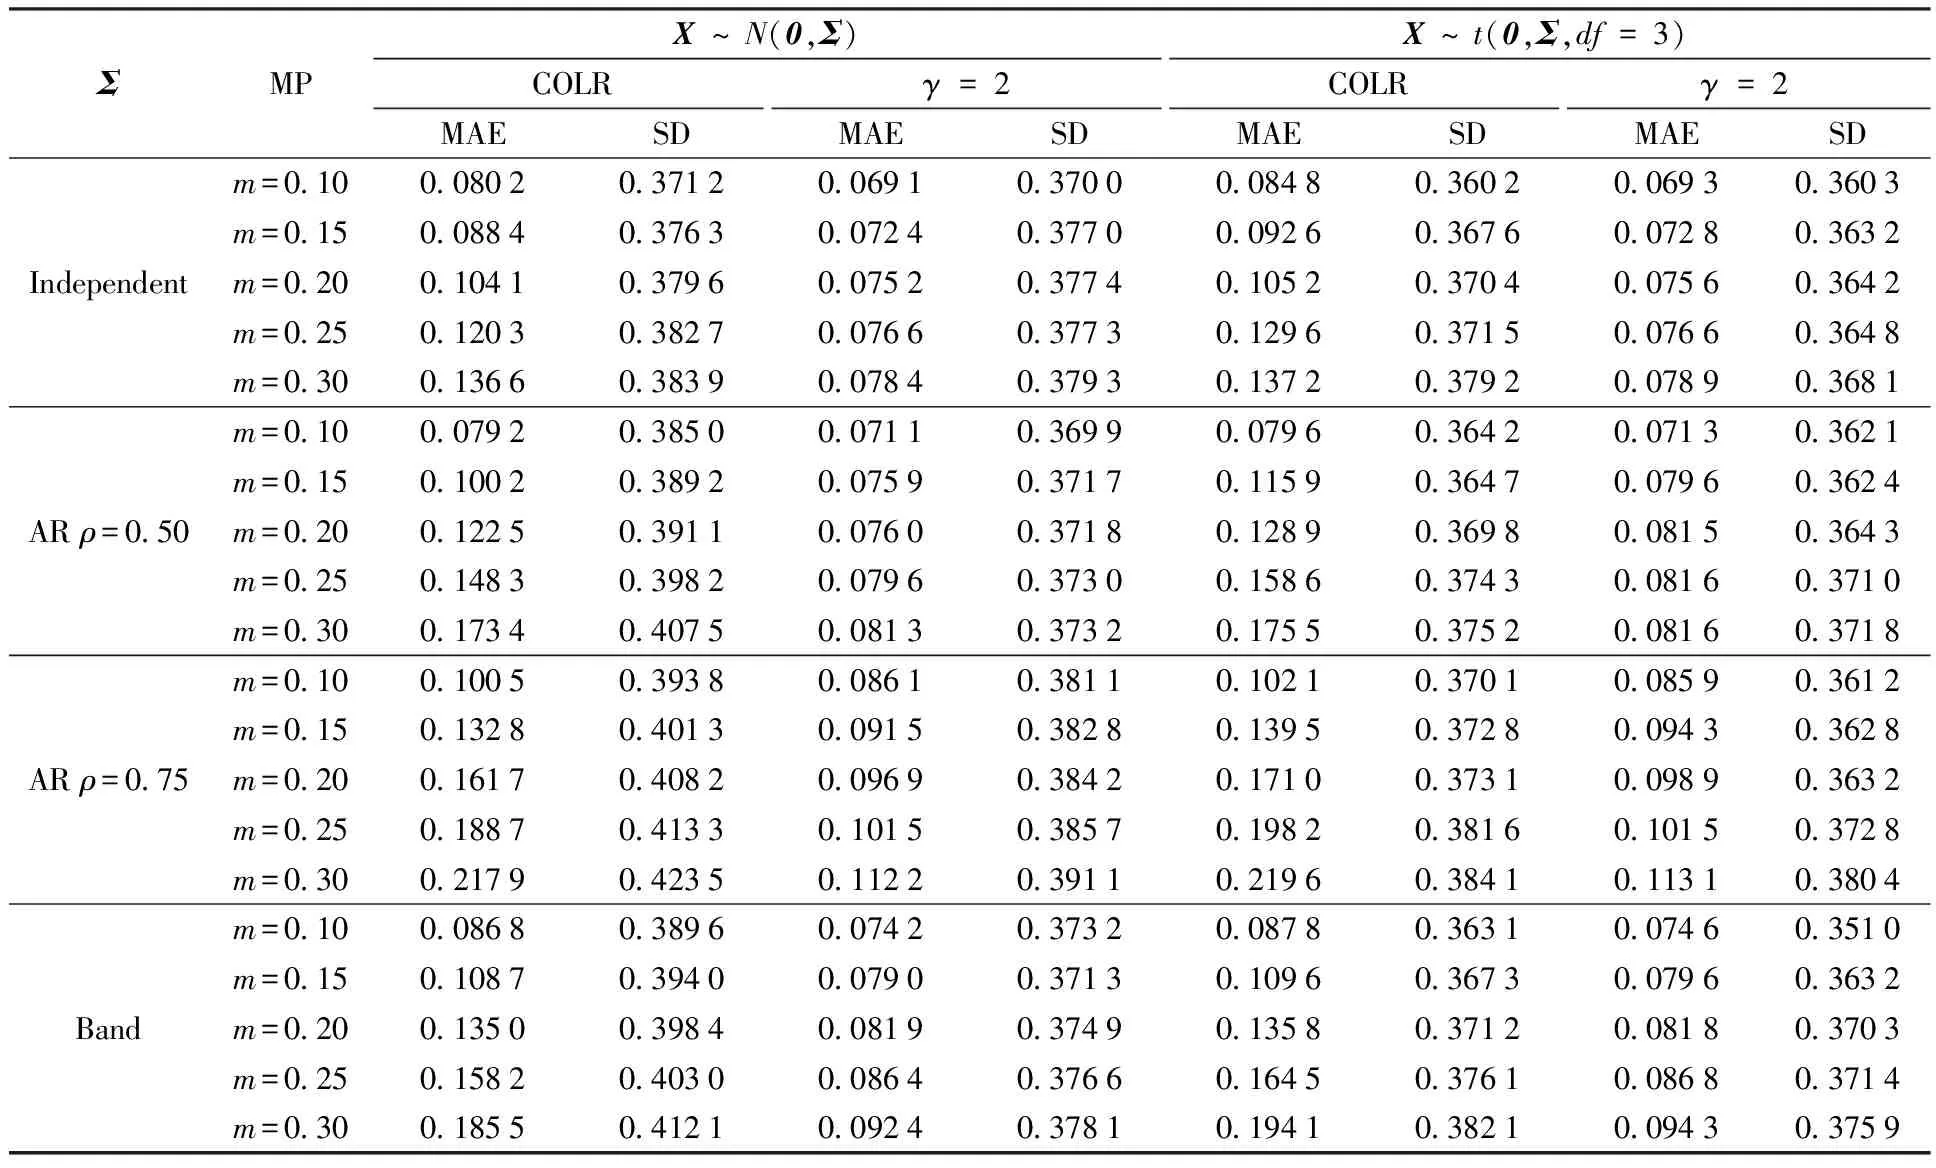
Table 3 MAE and SD from two methods under different distributions of X
Example3.1(assessment of robustness) We first delete 10% samples before running and then calculate the mean (Mean) and SD of ten runs of each variable. The Mean and SD are presented in Table 4. Our method performs more robustly than COLR by SD obviously. Most important variables[17], such as “AL”, “SE”, “DUCVA”, “D_COMR2”, “BREAK3”, have smaller SD by means of robust ordinal mislabel method than COLR method. It demonstrates that our method have strong stability.
Example3.2We take the Mean as the estimates ofβ,b1,b2. The absolute value of the Mean can reflect the importance of variables. Our method can better reflect the importance of important variables, such as “AL”, “SE”, which are regarded as important variables[18], having greater absolute estimate with the help of robust ordinal mislabel method than COLR method. “LT” is positively correlated with the degree of myopia[19]. However, the estimate of it from robust ordinal mislabel method is positive than from COLR method is negative. It shows that the robust ordinal mislabel method proposed in the paper can more accurately reflect the relationship between independent variables and dependent variables. In addition, “K1” is negatively correlated with the degree of myopia. It can reflect this point from the case ofγ=1,4,5. However, the case ofγ=2,3 can not reflect the situation. The absolute value of the estimate of “K1” is the largest for the case ofγ=4 and the result is consistent with classification error rate under differentγ.
4 Conclusion and future work
In this paper, we proposed a robust ordinal mislabel logistic regression method based onγ-divergence. The model is obtained by minimizingγ-divergence estimation. Both theoretical analysis and simulation studies make clear that the proposed method is quite efficient for solving classification problems with ordinal and mislabeled response data. Firstly, the mislabel probabilities need not to be modeled in our method. Secondly, our method performs more robustly than conventional ordinal logistic regression by the ways of simulation results and real data analysis. However, the robust ordinal mislabel logistic regression based onγ-divergence is applied to low dimensional data. There exists mislabeled response data on some high dimensional ordinal data, we can consider further research for ordinal mislabel method to high dimensional data.
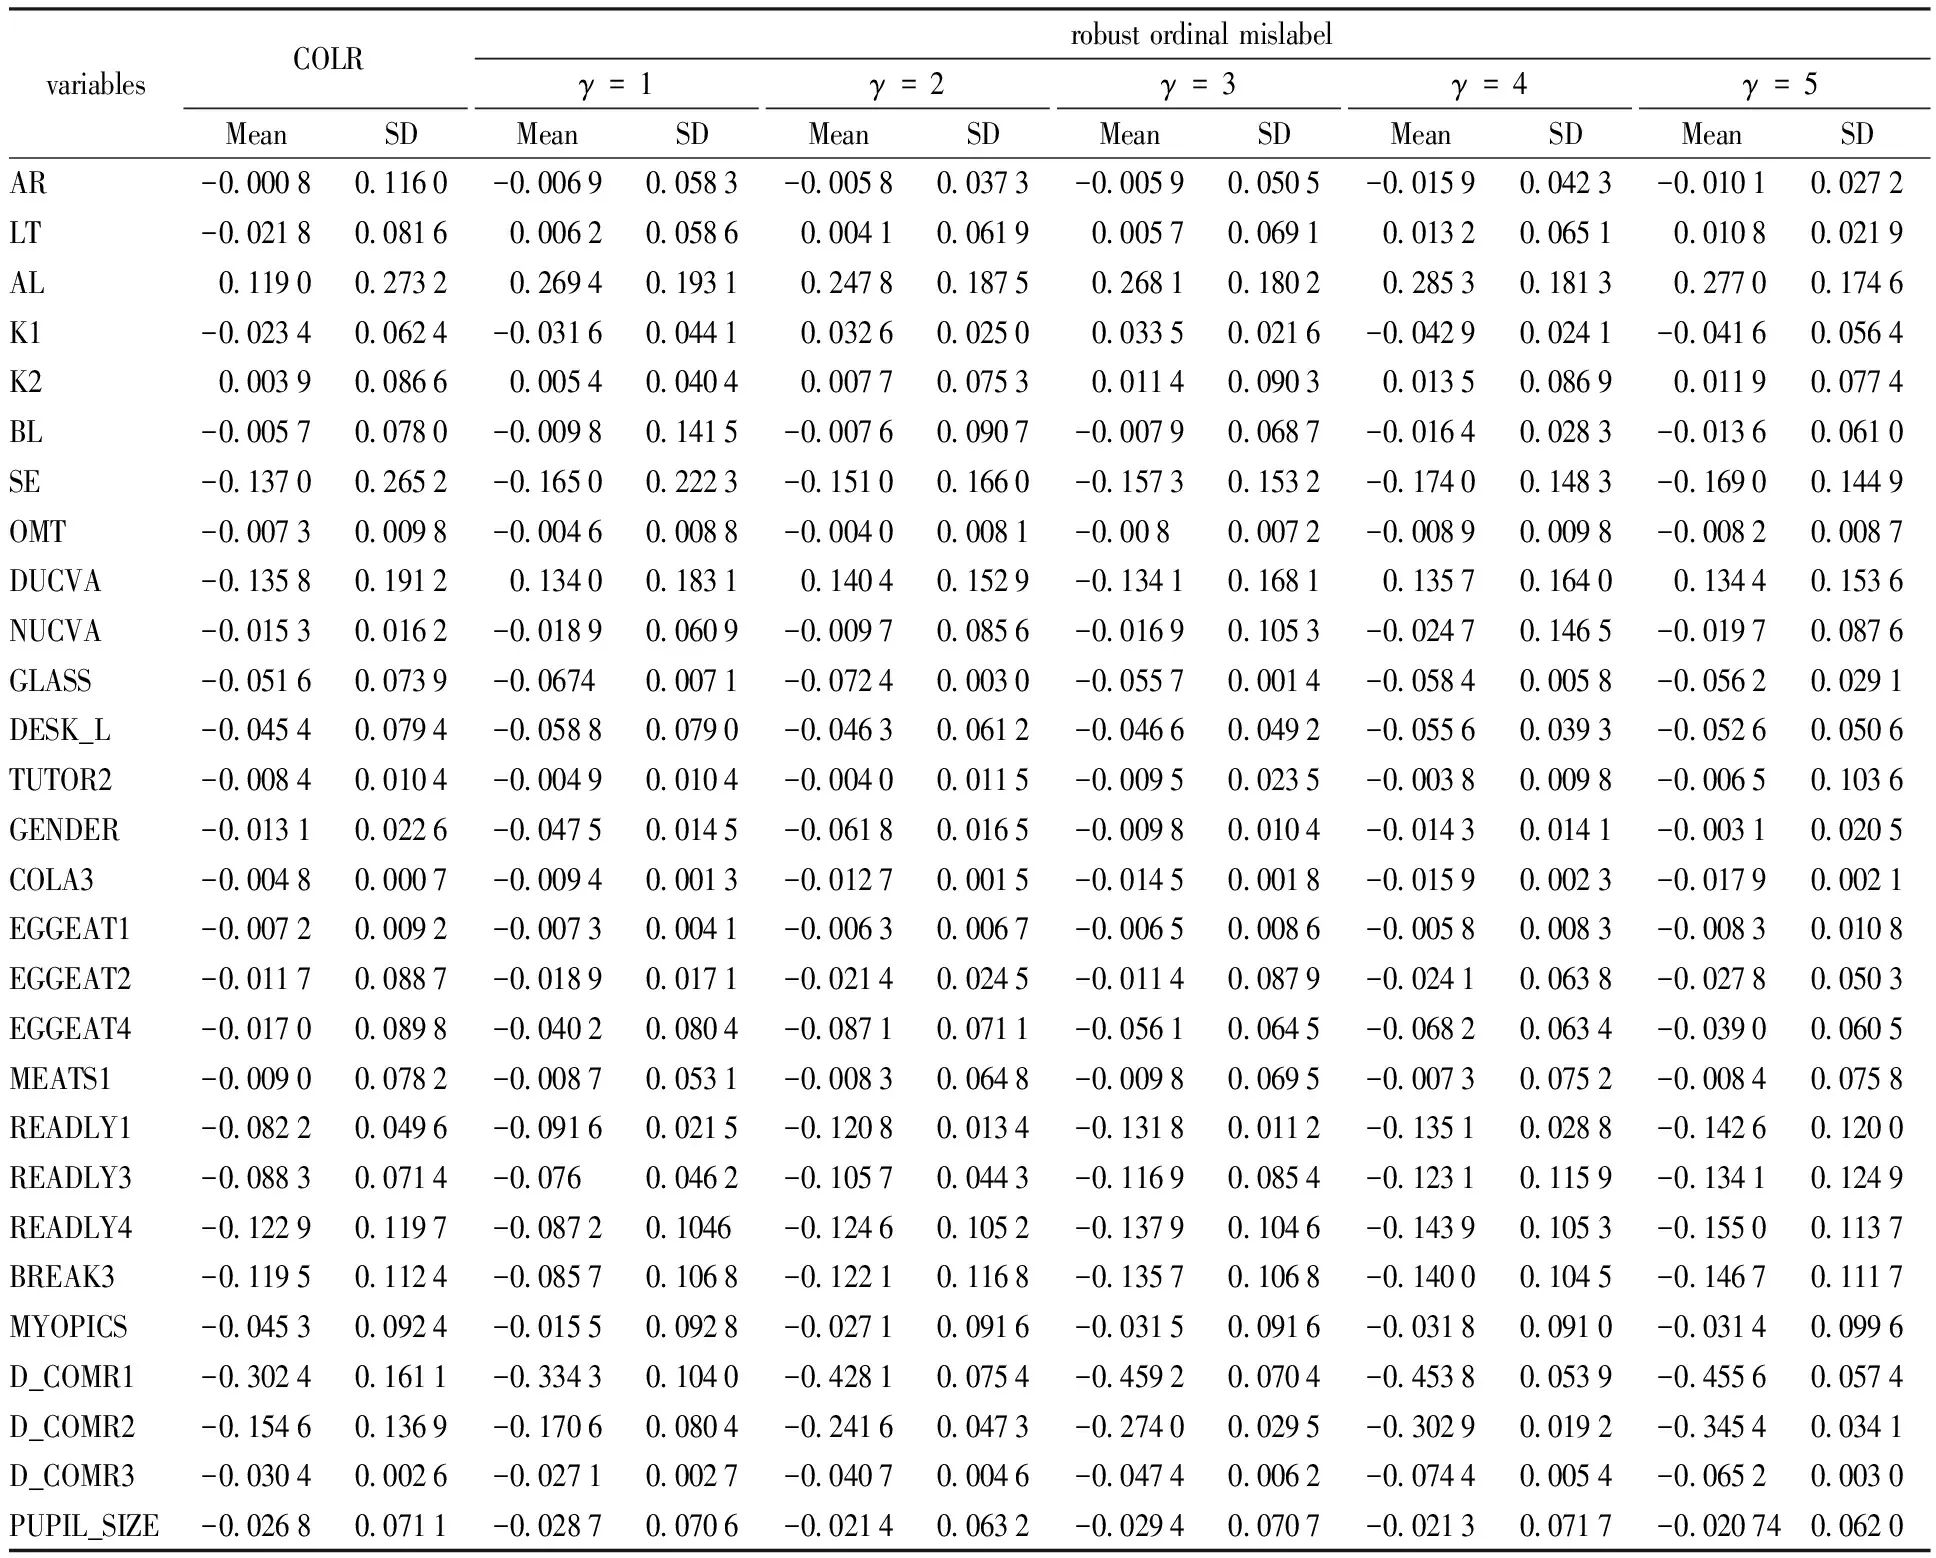
Table 4 The Mean and SD of the variables from two methods

