Unintentional modulation evaluation in time domain and frequency domain
Liting SUN, Xiang WANG, Zhitao HUANG
Department of Electronic Science, National University of Defense Technology, 410073 Changsha, China
KEYWORDS Instantaneous phase estimation;Pattern recognition;Radio Frequency Fingerprint (RFF);Singular Value Decomposition (SVD);UnIntentional Modulation(UIM)
Abstract With the development of wireless communication technology, the electromagnetic environment has become more and more complex. Conventional signal identification methods are difficult to accurately identify illegal devices. However, electromagnetic signals have an unavoidable device-specific characteristic unintentionally generated by a transmitter, appearing in the form of an UnIntentional Modulation (UIM), namely Radio Frequency Fingerprint (RFF). RFFs can be used to uniquely identify an emitter to match a received signal with its source. In this paper, the authors propose a novel RFF scheme to separate UIM part from the original signals from the time and frequency domain,and then utilize non-Gaussian measuring tools to extract a set of dimensionreduced secondary features. Additionally, Singular Value Reconstruction (SVR) is developed to extract UIM in the frequency spectrum.In time domain,a curve-fitting residual method is proposed to extract the UIM on the estimated instantaneous phase based on Maximum Likelihood Estimator(MLE). Various aspects of the proposed method are evaluated, including identification accuracy under various Signal-to-Noise Ratio (SNR) conditions, energy relationships between the UIM and the whole signal,and sensitivity to training set size.Compared with other methods,experimental results based on real-world signals prove that the proposed method has remarkable performance and high practicability.
1. Introduction
Radio Frequency Fingerprints (RFFs) are unavoidable characteristics of electromagnetic signals, introduced by imperfections of transmitter hardware chain.Furthermore, RFF is unintentionally modulated in each signal, which is unique to a specific device and difficult to eliminate or clone.Therefore,the RFF caused by hardware or manufacturing inconsistencies can be used as unique identifier of a specific transmitter device;with this identifier,the specific emitter of a received signal can be distinguished.
RFF has been widely studied as a lightweight noncryptographic authentication technology, which uses external features of a transmitting signal (instead of a cryptogram) of the authenticated target for identification and enhances the physical layer security of Internet of Things (IoT).These features should be sensitive enough to discriminate signals from different emitters of the same model and batch number and made by the same manufacturer.
Considering the feature extraction process, the RFFs can be divided into four groups: time domain features, frequency domain features, time-frequency domain features, and other domain features. In the time domain, the most popular RFFs include envelope variations such as rising-edge,fitting-downangleand instantaneous featuresas Instantaneous Amplitude(IA)/Frequency(IF)/Phase(IP).In the frequency domain,estimated frequency values can be applied to RFFs.However, theoretically, RF fingerprinting requires a low estimated error to ensure the capture of device-specific variations, which is difficult to achieve in practical applications. RFFs can also be extracted from magnitude responses in the spectral domain.In the time-frequency domain, there are various time-frequency analysis tools transforming the received time series into various two-dimensional planes of time and frequency that show the emitter-specific details.. In Ref.,wavelet-based fingerprinting was extracted.Additionally,there are several RFF methods in other domains, such as bispectrumand Hilbert-Huang Transform (HHT) spectrum analysis.However, those RFFs usually have higher calculation complexity and generally have limitations to signal adaptability.
Due to manufacturing deviations and devices aging in the emitter, RFFs are unintentionally generated in a transmitter during modulation and transmission of a signal at the radio hardware front-end, appearing in the form of UnIntentional Modulations(UIMs).Thus,UIM information is more significant than Intentional Modulations (IMs) for distinguishing the specific emitter device. Furthermore, occasionally the IM is more than a useless factor,but a disturbing factor that interferes with the accuracy of recognition.However,most previous research on RFF is prone to focus on the whole signal including both IM information and the UIM portion.The RFF of a signal is then extracted from a higher-dimensional space with more precise details using various tools, instead of reducing the impact of UIM.
Actually, UIM, carrying the device-relevant individual information,only accounts for a small proportion of the information imparted on the received signal.Compared to IMs,UIMs are weak and imperceptible,which implies that the main obstacle is separating the UIM for emitter identification.
Up to now, several studies have been carried out on estimating the UIM portion of a signal. In Ref., the UIM in the frequency domain was expressed as the absolute value of fitting error between a frequency magnitude spectrum curve and a sinusoidal function. It ignores the UIM reflected in the signal phase angle, and is based on the assumption that the magnitude spectrum of all signals can be expressed as a sinusoidal function. The emitters are non-ideal, which means that there is asymmetry between the left part and the right part of spectrum, which is also utilized as one type of UIM.However,the asymmetry is not the only indicator,but the distribution of the frequency spectrum after eliminating the main information also indicates the identification-relevant differences.Recent research in Ref.utilizes the time-domain based complex baseband signal error for transmitter identification.These error signals are generated by subtracting the estimated ideal signal from the recorded transmissions. To some extent,this algorithm can be approximatively regarded as one that evaluates the UIM in time domain. However, the error signal is a time-domain sequence and not a precise UIM RFF feature, and it cannot be directly used for emitter identification.Thus, the authors feed the signal error series into a Convolutional Neural Network (CNN) to extract additional RFF features.
To address these challenges, it is necessary to evaluate the UIM more accurately according to its distribution characteristics, and perform more detailed analysis on it in different domains to separate the transmitter fingerprint information contained in the signal. Therefore, we construct a new algorithm tailored to extract an RFF by separating UIM from the Frequency Spectrum (FS) and Instantaneous Phase (IP)of the original received signal at the feature level,which builds upon our previous work.In the frequency domain,the UIM in Frequency Spectrum(UIMFS)is measured by a newly proposed SVD-based method called SVR. The low-order curve after fitting the main distribution characteristics of the original IP is subtracted from each transmission to obtain the UIM in Instantaneous Phase (UIMIP). Considering the practicality of the algorithm, the High-Order Statistics (HOS) tools called Linear Skewness (LS) and Linear Kurtosis (LK) are defined as the secondary analysis feature used to reduce the dimensionality and fuse the UIM in the frequency and time domain.A series of experiments (based on real-world data) are conducted to evaluate the effectiveness of the proposed method.
The main contributions of this paper are as follows:
(1) we propose a new systemic scheme to extract the UIM of a received signal for RFF. In this scheme, a UIM evaluation step is first proposed to measure and evaluate the UIM in two domains. Then, a secondary feature is defined to further optimize the preliminary extracted fingerprint feature and achieve a feature-level fusion.
(2) a Singular Value Reconstruction (SVR) method based on the Singular Value Decomposition (SVD) is proposed.This method selects the appropriate singular values and singular vectors according to a contribution rate to reconstruct the spectrum based on the UIM of signal in the frequency domain, that is UIMFS.
(3) a curve residual function is utilized to fit the main distribution characteristics of IP curve in the time domain.Additionally, the residual series between the average fitted curve and the original IP is approximately regarded as UIMIP.
(4) we propose a secondary feature extraction algorithm,based on non-Gaussian tools(Linear Skewness and Linear Kurtosis, LSLK), to fuse UIMFS and UIMIP, and to reduce feature dimensions without much loss in the identification rate.In addition,the piecewise calculation is used to preserve the asymmetry in the original RFF features.
(5) we evaluate the performance of the proposed algorithm from various aspects including under various Signal-to-Noise Ratio(SNR)conditions,with different sizes of the training data set and various numbers of transmitters.Additionally, the energy relationship between the measured UIM part with the whole signal is analyzed.Experimental results verify that the proposed method has remarkable performance.
The rest of this paper is organized as follows. In Section 2,the related signal models of UIM and the mathematical methods to calculate UIMFS, UIMIP and LSLK are presented.Section 3 describes the framework structure and detailed steps to implement the proposed algorithm. Experimental results based on real-world data and corresponding analysis are provided in Section 4. Conclusions are drawn in Section 5.
2. Computation scheme
In this section, the related signal model with UIM is introduced in Section 2.1. Then the algorithms for extracting the UIM RFFs in the frequency domain and time domain are illustrated in Section 2.2 and Section 2.3, respectively. A secondary feature extraction method based on the non-Gaussian tools is also presented in Section 2.4.
2.1. Signal representation
An ideal digital signal after modulation can be modeled as

where frepresents the carrier frequency;φis the initial phase;φ(t)and A(t)represent phase modulation and amplitude modulation, respectively; T is the time length of the signal; ε(t) is the additive Gaussian noise.
However, the non-ideality and non-linearity of the emitter devices are unavoidable, relatively stable for one emitter and varying in different emitters, usually affecting the characteristics of the signal in the form of a UIM.Considering the influence of UIM, the received signal can be expressed as

where Δφ(t)and ΔA(t)are UIMs of the phase and amplitude,respectively. Without loss of generality, Δφ(t) and ΔA(t) are assumed to be zero-mean.Because there is very little amplitude modulation of a radar signal,to avoid complex power control,the intentional modulated amplitude A(t) can be approximately regarded as a constant function, abbreviated as A.Specifically, the main thought of our proposed algorithm is to extract Δφ and ΔA(t) as new RFF features to represent UIMs.
In addition, the UIM estimation methods proposed in this paper are based on the following remarks:
Remark 1. Signals of the same modulation type (with the same parameters) have similar signal characteristics, even if they are emitted from different transmitters.
Remark 2. According the RFF mechanisms, the UIM is a nonessential component of the signal and its energy is far less than that from the main component.
2.2. RFF in frequency domain
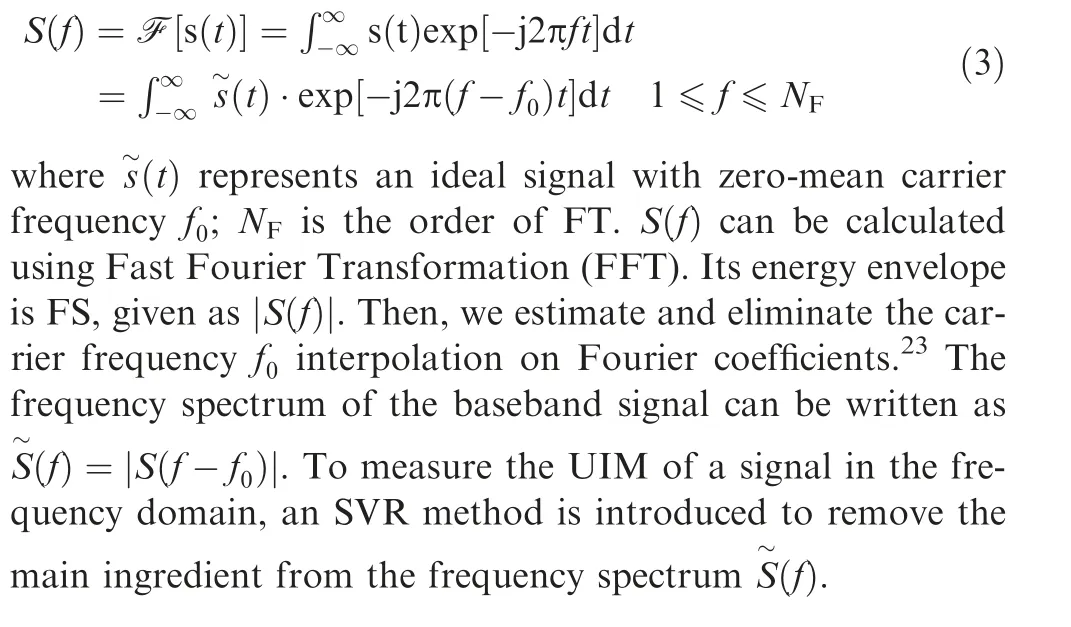
According to the previous research, values of various carrier frequencies have been analyzed for RFF,while estimation precision of the frequency tends to limit real-world applications.On the other hand, a frequency spectrum distribution is a potential option to find RFF,especially for signals with a simple modulation mode.The Fourier Transform (FT) of a signal s(t) is expressed as
2.2.1. Singular value reconstruction
Given a m×n matrix Q,performing SVD means decomposing it into
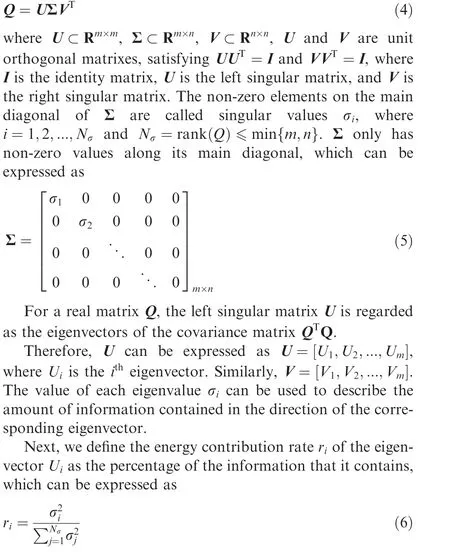
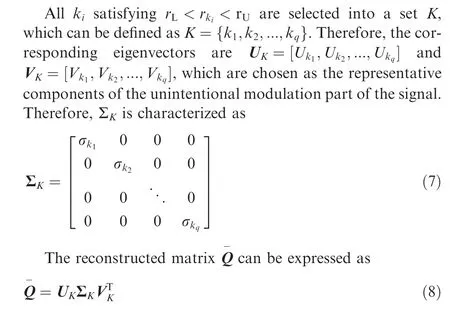
The larger the contribution rate is,the higher proportion of information contained in the corresponding eigenvector will be. Then, an upper threshold value rand lower threshold value rare set to filter the appropriate reconstruction ingredients. The corresponding eigenvectors related to the contribution rate values r, which are greater than the threshold(r>r), are regarded as the main portions or trends; these eigenvectors with energy contribution values (r) less than the threshold r<rare assumed as stray noises.
2.2.2. UIM in frequency domain
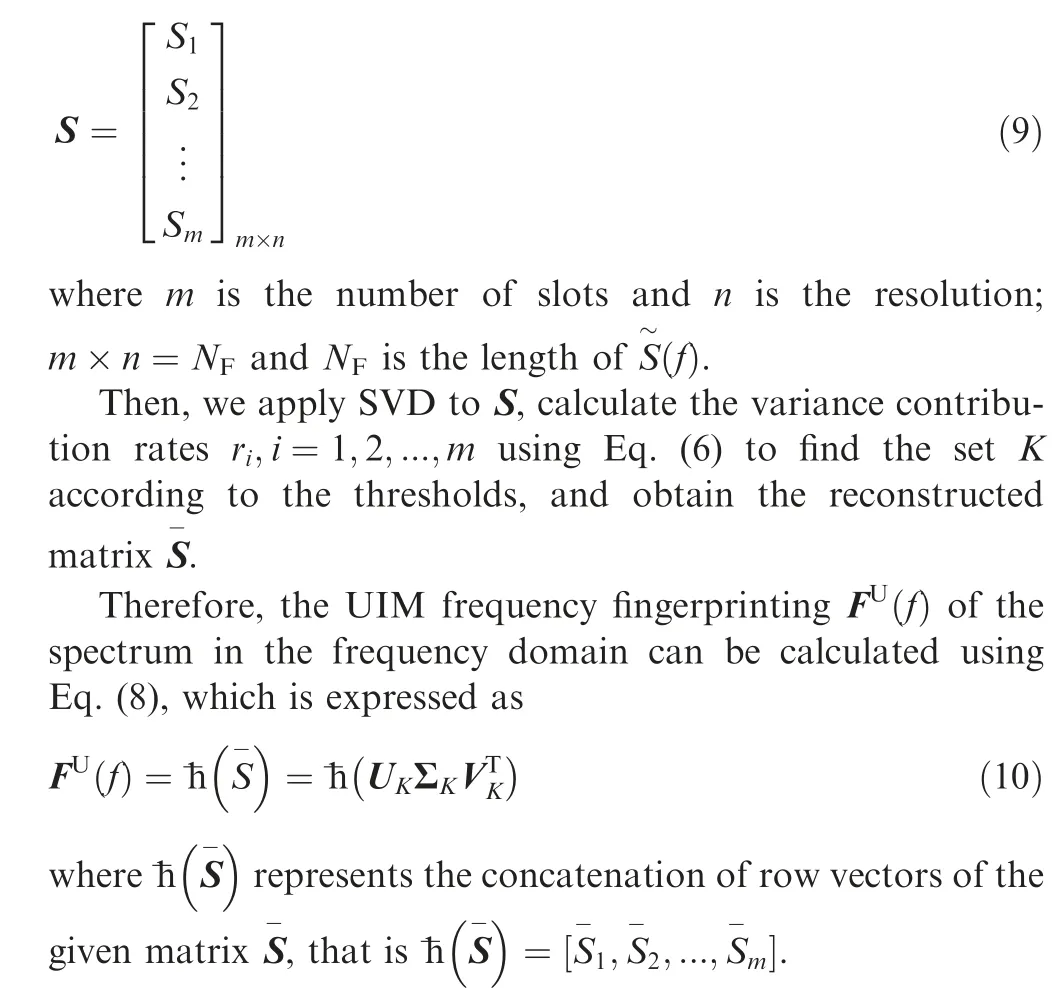
To find the UIM in the frequency domain, we construct the signal matrix S. First, the frequency spectrum S(f) is divided into several equal slots without overlapping. Suppose that S(i=1,2,...,m) denotes the islot of S(f), the signal matrix S can be described as
2.3. RFF in time domain
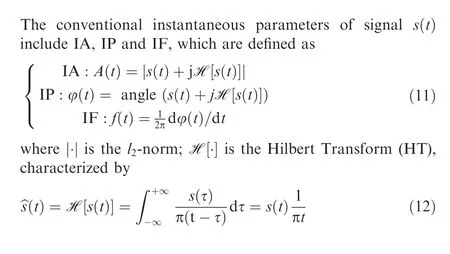
Note that,in Ref.,the authors compared the performance of IF and IP,and drew the conclusion that IP is better than IF in unique radio device identification. And IA is susceptible to noise and multi-path effects. Therefore, we choose IP as the representative time domain RFF feature in this work.For analytic discrete-time series ^s(t), the unwrapped phase angle φ(t)can be given as

where q(t) and i(t) are the real and imaginary components of^s(t); Nis the length of φ(t). However, in actual observation,the phase angle is not the same as the instantaneous phase,and the calculation result is greatly affected by noise. Therefore,the calculations in Eq. (11) cannot be directly used for RFF analysis, which are improved according to the estimation theory in this work.First,we estimate the frequency ^ω by the Kay method,and then calculate the corresponding phase according to Maximum Likelihood Estimation (MLE).
Note that, in this work, the whole signal is segmented by a sliding window with the step length of 1.When the width of the window Nbecomes tight enough, the segmented waveform can be approximately regarded as the sinusoidal signal. The aforementioned parameter estimation is performed in each segment, and the estimated frequency value of the isegment can be regarded as the corresponding instantaneous frequency of the current moment t.
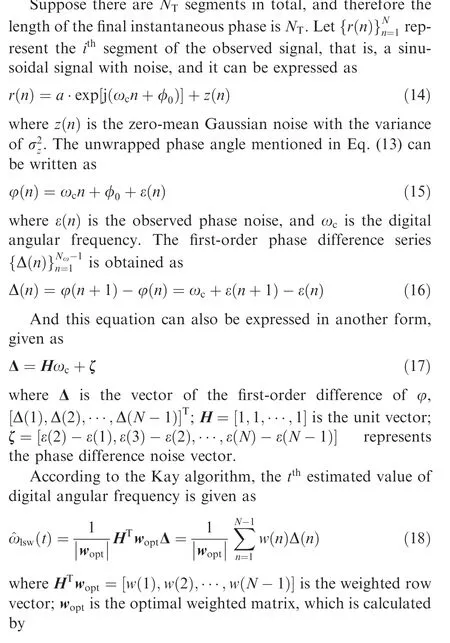

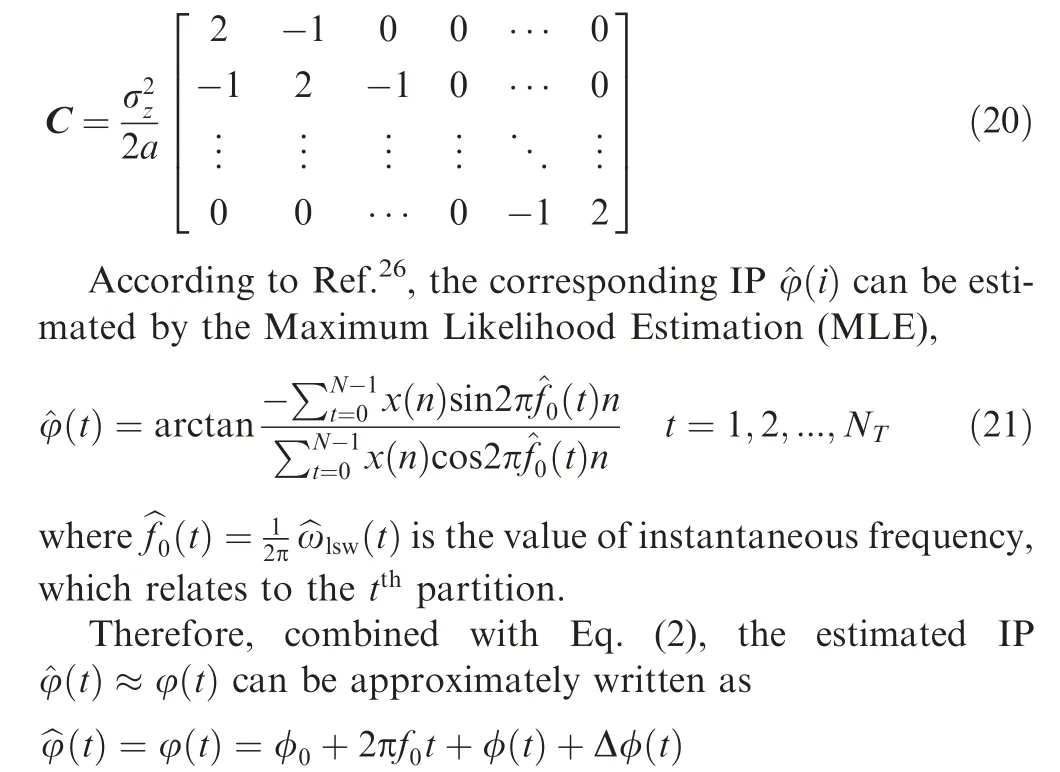
where C is the covariance matrix of ζ and expressed as C=E ■ζζ■. Assuming that the phase difference is approximately zero-mean Gaussian noise, and the variance is σ/2a,the covariance matrix C is represented as
2.3.1. Curve-fitting model
The (p-1)-order polynomial is utilized to fit the feature curves, whose model is

where ω(t) is the fitted noise. And its linear model expression can be given as

where θ=[θ,θ,···,θ]represents the fitting coefficient vector; D is the observed matrix in the shape of Vandermonde matrix, given as

The Minimum Variance Unbiased(MVU)estimation of the coefficient vector θ can be calculated by least squares method,expressed as

Therefore, the fitted curve is denoted as

2.3.2. UIM in time domain
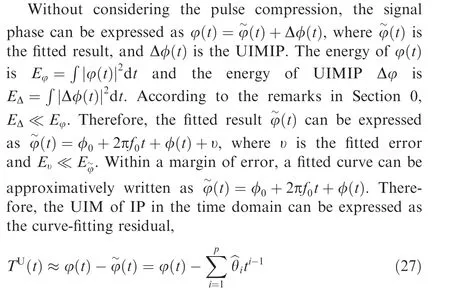
Rather than utilizing the fitting coefficients of the envelope curve as RFF in Ref., the fitting method is used to describe the main trend or main shape of specific feature curves here.Let x(t)equal the estimated IP ^φ(t)in Eq.(21),the IP fitted curve φ(t) can be calculated according to Eqs. (22)-(26),expressed as φ(t)= ^f(t)=∑^θt.Additionally,it is important to set the appropriate fitting order p.To describe the main trend, low n-order functions are used, usually p=2 to 3.
2.4. Secondary distribution feature
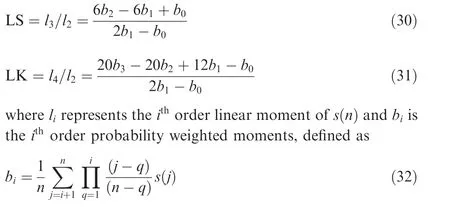
HOS has advantages describing data distribution. There are several HOS tools that have been used to extract a lowerdimensional RFF features in many scenes, including variance,skewness and kurtosis.. In probability and statistical theory,skewness S and kurtosis K are classic measuring tools for measuring a non-Gaussian distribution of random variables

where μ is the average value and σ is the variance of the given series s(n).
Skewness describes the symmetry of a variable distribution about its mean, and is very sensitive to outliers, which may consist of erroneous or irrelevant observations. Kurtosis describes the steepness of the Probability Density Function(PDF) of variables, which is easily affected by outliers.
Hence,we choose the skewness and kurtosis based on a linear moment, that is, Linear Skewness and Linear Kurtosis(LSLK) are tools used to extract secondary distribution features, which can be expressed as
3. Algorithm implementation
In this section,we introduce the details of the algorithm implementation, including the flowchart of the whole RFF and the computational complexity of the proposed UIM features. The flowchart of the newly proposed scheme to implement RFF is introduced,as shown in Fig.1.It consists of five primary components: (A) signal receiving and pre-elaboration; (B) domain transformation,including phase estimation and FFT transformation; (C) UIM evaluation, including IP analysis and FS analysis; (D) secondary feature extraction, namely LK and LS;(E)classification.Each component will be briefly described below.
3.1. Signal receiving and pre-elaboration
The first step is the signal receiving stage and some necessary pre-elaboration processing,including detecting the original signal from the environmental noise, filtering the frequency noise, normalizing signals by subtracting the mean value,and dividing using the standard deviation. Then, the original pulses of the signals are detected.Besides,to reduce the estimation error, we achieve a time-frequency alignment of each pulse based on Cross-Ambiguity Function (CAF).Finally,samples s(t) are ready for further processing.
3.2. Domain transformation
After pre-elaboration, a domain transform is performed, that is, an FFT transform in the frequency domain and HT in the time domain. Then, we calculate a basic frequency spectrum S(f) using Eq. (3) to estimate and eliminate the carrier frequency fand to obtain Original Frequency Spectrum(OFS) S(f). Similarly, the Original Instantaneous Phase(OIP)φ(t)is estimated using the Kay method and MLE in Section 2.3. The corresponding procedures are shown as phase estimation and FFT transform in Fig. 1.
3.3. UIM evaluation
The next step is UIM evaluation, which is the core of this scheme. In this work, we eliminate the IM of frequency and phase which characterizes the radio fingerprints in the form of UIM. The UIM evaluation in the FS and IP are separately accounted for as FS analysis and IP analysis in Fig. 1. In the frequency domain, we separate the main component and the stray noises of S(f) using Eqs. (4)-(10) and calculate the UIMFS F(f) according to SVR in Section 2.2. In the time domain, the UIMIP T(t) can be obtained according to the curve-fitting residual method described in Section 2.3. The resulting features in each domain can be directly fed into the classifier for identification, which are shown as the top line and bottom line connected to the classification of the flowchart in Fig. 1. In addition, they can be further analyzed by non-Gaussian tools to convert into dimensionality-reduced domain fusion features.
3.4. Secondary feature extraction
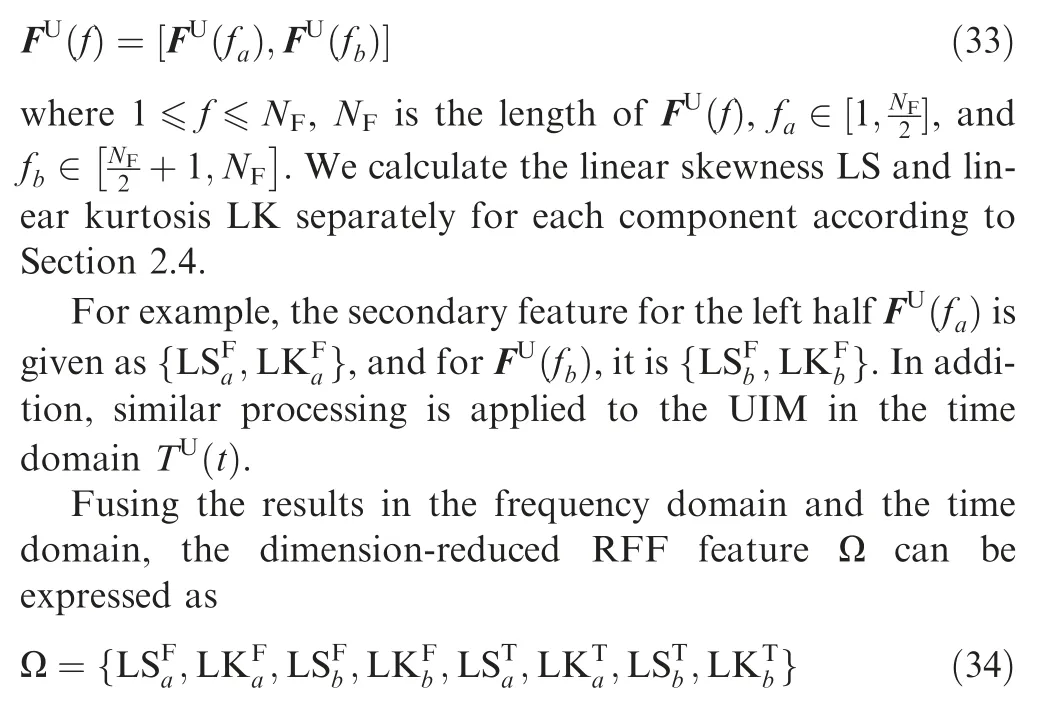
Because the dimensions of the resulting UIM RFFs are large and affected by the length of the given signal, to make the computation more efficient and fuse the UIM in different domains, secondary non-Gaussian features, linear skewness and linear kurtosis,are calculated using Eqs. (28)-(31).
According to Ref., the spectrum symmetry is an intrinsic and widespread property of modulated signals and it is often affected by UIMs. In order to describe the data distribution on a smaller scale, and measure the asymmetry caused by UIMs,the UIM feature vectors(UIMFS and UIMIP)are segmented into two halves (a,b), which can be expressed as
3.5. Classification
In this paper, the aforementioned features are fed to a multiclass linear Support Vector Machine (SVM) classifier or a Gaussian Mixture Model (GMM) classifier for emitter identification. The GMM classifier is utilized to deal with the highdimensional RFFs, i.e., F(f) and T(t), while the SVM classifier is for the secondary lower-dimensional RFF,i.e., Ω.The results of the classification are used to evaluate the performance of the proposed method.
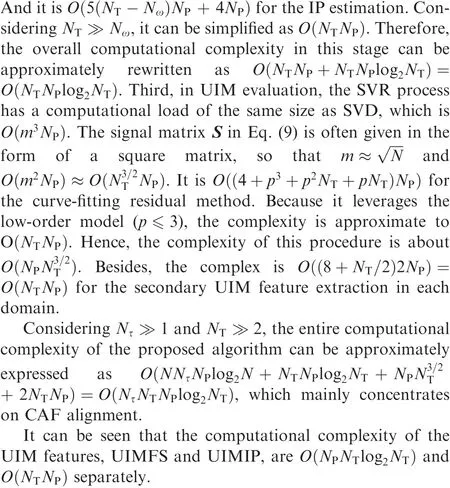
3.6. Computational complexity analysis
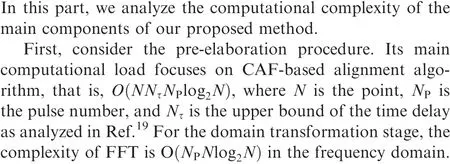

Fig. 1 Identification flowchart of proposed framework to measure and evaluate the UIM.
4. Experimental results and analysis
In this section,we investigate and analyze the recognition performance of the proposed algorithm through various experiments.
4.1. Data and parameter setting
In order to investigate the performance and the practicality of the proposed method, experiments are performed based on real-world data. The collected signals are transmitted by secondary surveillance radars of 15 civil aircraft with a 1090 MHz RF frequency,and down-converted to the intermediate frequency of 60 MHz.All radars work in the S mode,which makes sure that all signals have the same intra-pulse modulation. The sampling frequency is set to 250 MHz, and the sampling intermediate frequency is 60 MHz. There are at least 300 samples after pre-elaboration for each transmitter device, and 4703 samples in total. In addition, since the signal reception is completed within a limited time on the same day when the weather is clear,it can be considered that the channel conditions have not changed. Details of the test data set are listed in Table 1.
In addition, we use the probability of correct identification(P)as the performance measurement of the methods,which is defined as
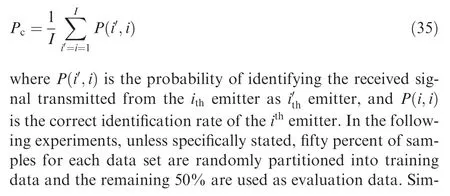

Table 1 Configuration parameters.
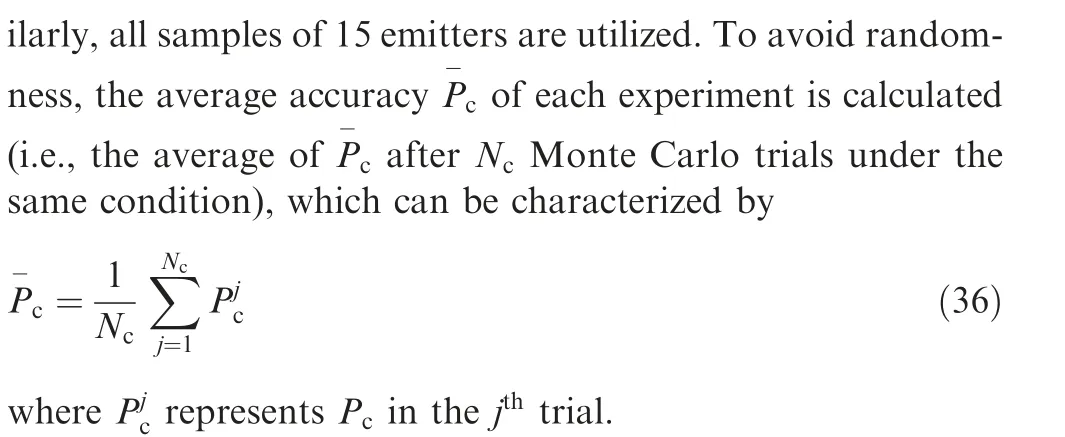
The resolution n is 20. The order of the fitting function models is set to 3 to fit the main trend. The threshold of the SVR should be set according to the energy distribution of the given signals.For instance,the representation of the energy contribution rate rin Eq.(6)is shown in Fig.2,where lines of different colors are rfor different emitters. The excessively concentrated points in the upper left corner indicate that the differences between emitters are too small, which are of a higher energy ratio and considered as the common main component.And the points beneath the lower threshold rare too scattered and of lower energies, indicating that they are not stable and are regarded to be spurious noise. These values should be all deleted. Therefore, the upper threshold ris set to 70% and the lower one ris 0.1% in this work.
4.2. UIM
To illustrate the performance of the proposed UIM extraction method, the recognition capability is illustrated in the form of a confusion matrix. In addition, the performance of the proposed UIM portions(UIMIP,UIMFS and UIM),and its original features under different SNR conditions, are tested. We also analyze the sensitivity to training set size, and the energy relationship between the UIM and the whole signal.
4.2.1. Identification confusion matrixes
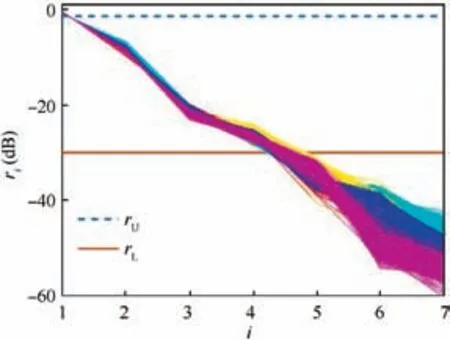
Fig. 2 Representation of energy contribution rate and the thresholds.
The identification performance of the two proposed UIM extraction methods (UIMFS, UIMIP and their fusion feature UIM)using GMM with 32 Gaussian distributions for one trial are shown in the classification confusion matrixes, as listed in Tables 2-4.The elements of the matrixes are the values of identification probability P(i,i), and the idiagonal element represents P(i,i), which is the correct identification rate of the iemitter. The probability of correct identification (P), listed in Tables 2 and 3, are P=98.10% and P=97.56%, respectively, which indicates the effectiveness of the proposed UIM. Additionally, the average identification rates after 100 Monto Carlo runs are 98.13% (UIMIP) and 98.04%(UIMFS), respectively. Therefore, both UIMIP and UIMFS can provide high recognition rates.
Note that there is complementarity among UIMs in different domains. As can be observed in Table 2, the UIMFS provides a good performance P(i,i)>92%, (i=1,2,...,15) for each emitter (R01-R15). R04 has the lowest recognition rate using UIMFS and can be correctly identified with P(4,4)=99.33% using UIMIP as shown in Table 3, which hints at the necessity of feature fusion. Similarly, though part of the instances of R09 are misclassified as R06 with UIMIP,as shown in Table 2, they can be clearly discriminated in Table 3.
The distribution of feature recognition results in different domains is shown in Fig. 3. The horizontal ordinate denotes the true labels(the numbers from 1 to 15 represent transmitters R01-R15 respectively), and the coordinates on the vertical are the predicted labels. The points on the diagonal line indicate correct recognition, while discrete dots indicate wrong judgments.It can be seen that the misjudgments of the two features are not consistent, indicating the complementarity between features and the necessity of feature fusion.
The identification result of the UIM, obtained by fusing UIMIP and UIMFS in a cascade approach,in one trial is illus-trated in Table 4. The average accuracy is P=98.69%. For each emitter (R01-R15), it can be obtained that P(i,i)>95%,(i=1,2,...,15).Therefore,combining the UIMs can enhance the separability of transmitted signals and improve identification performance significantly.
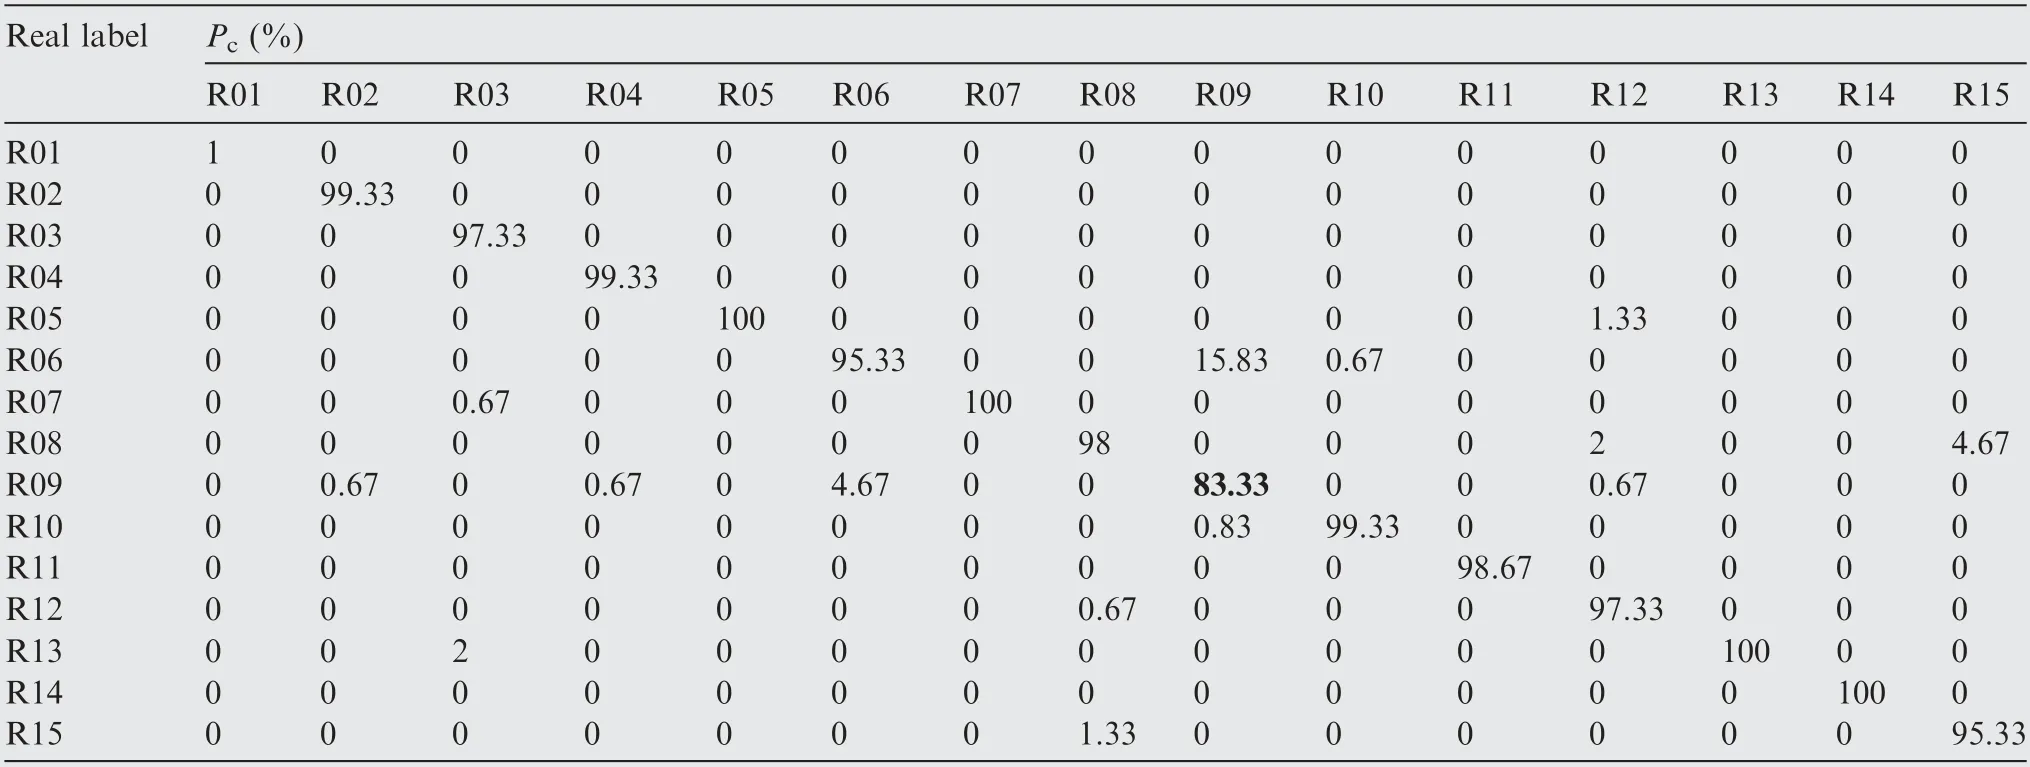
Table 2 Results of proposed unintentional modulation radio frequency fingerprinting of instantaneous phase in time domain(UIMIP) using GMM.
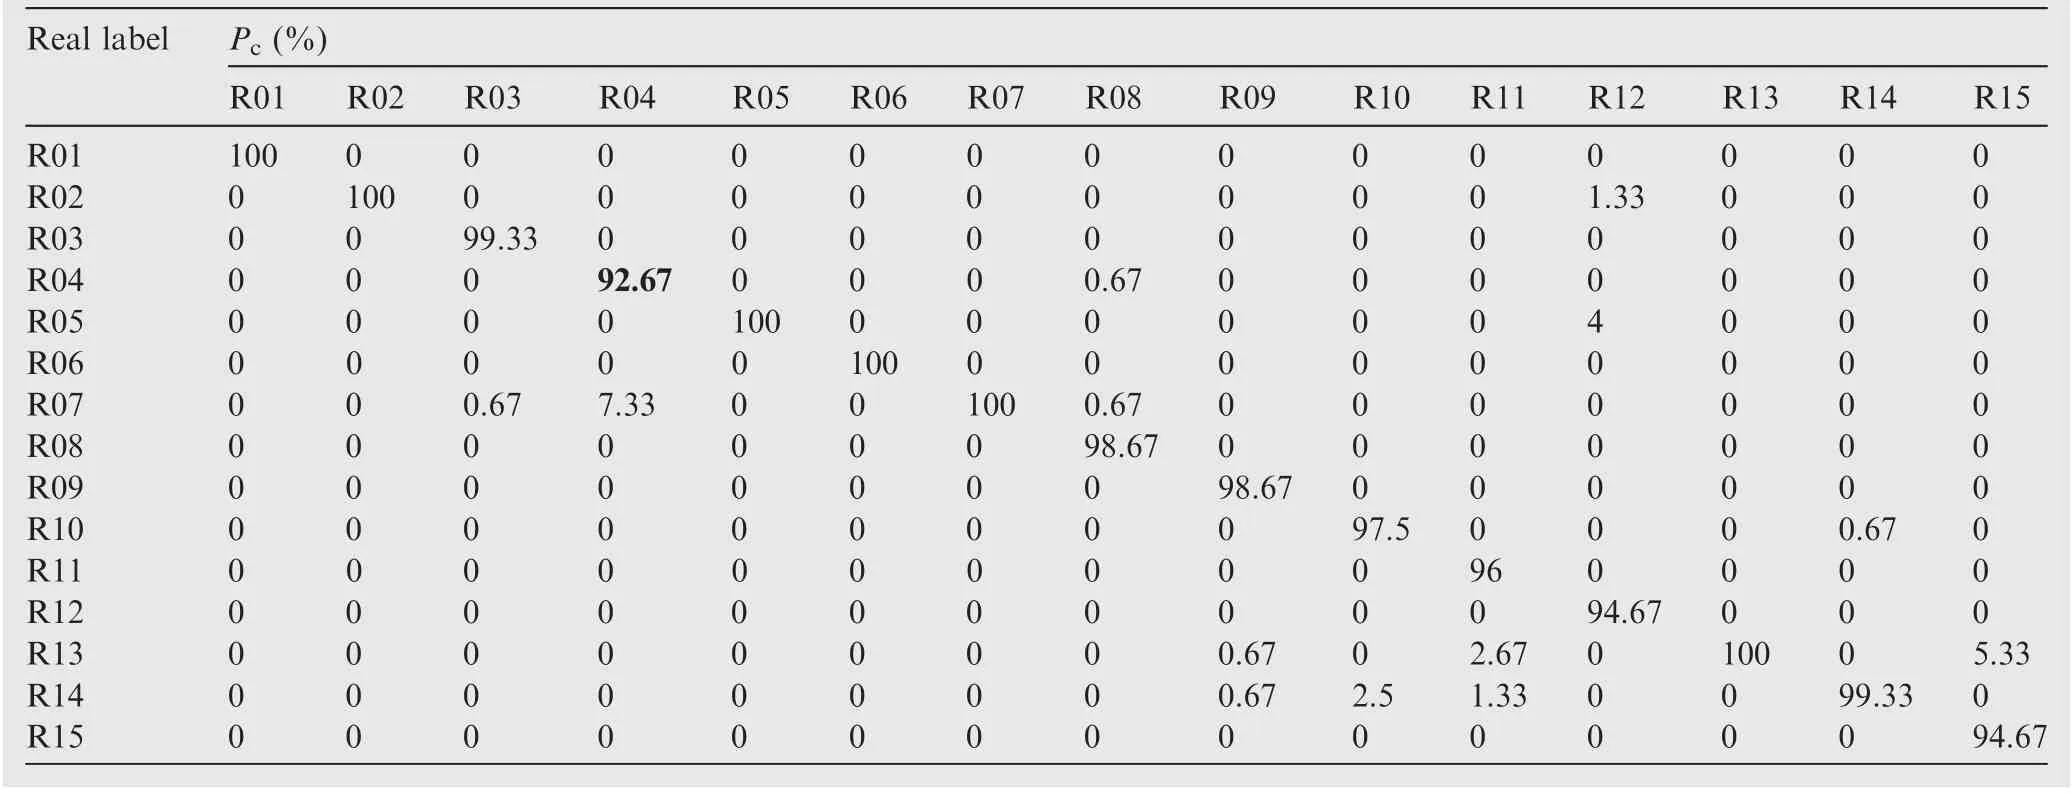
Table 3 Results of the proposed unintentional modulation radio frequency fingerprinting of frequency spectrum in frequency domain(UIMFS) using GMM.
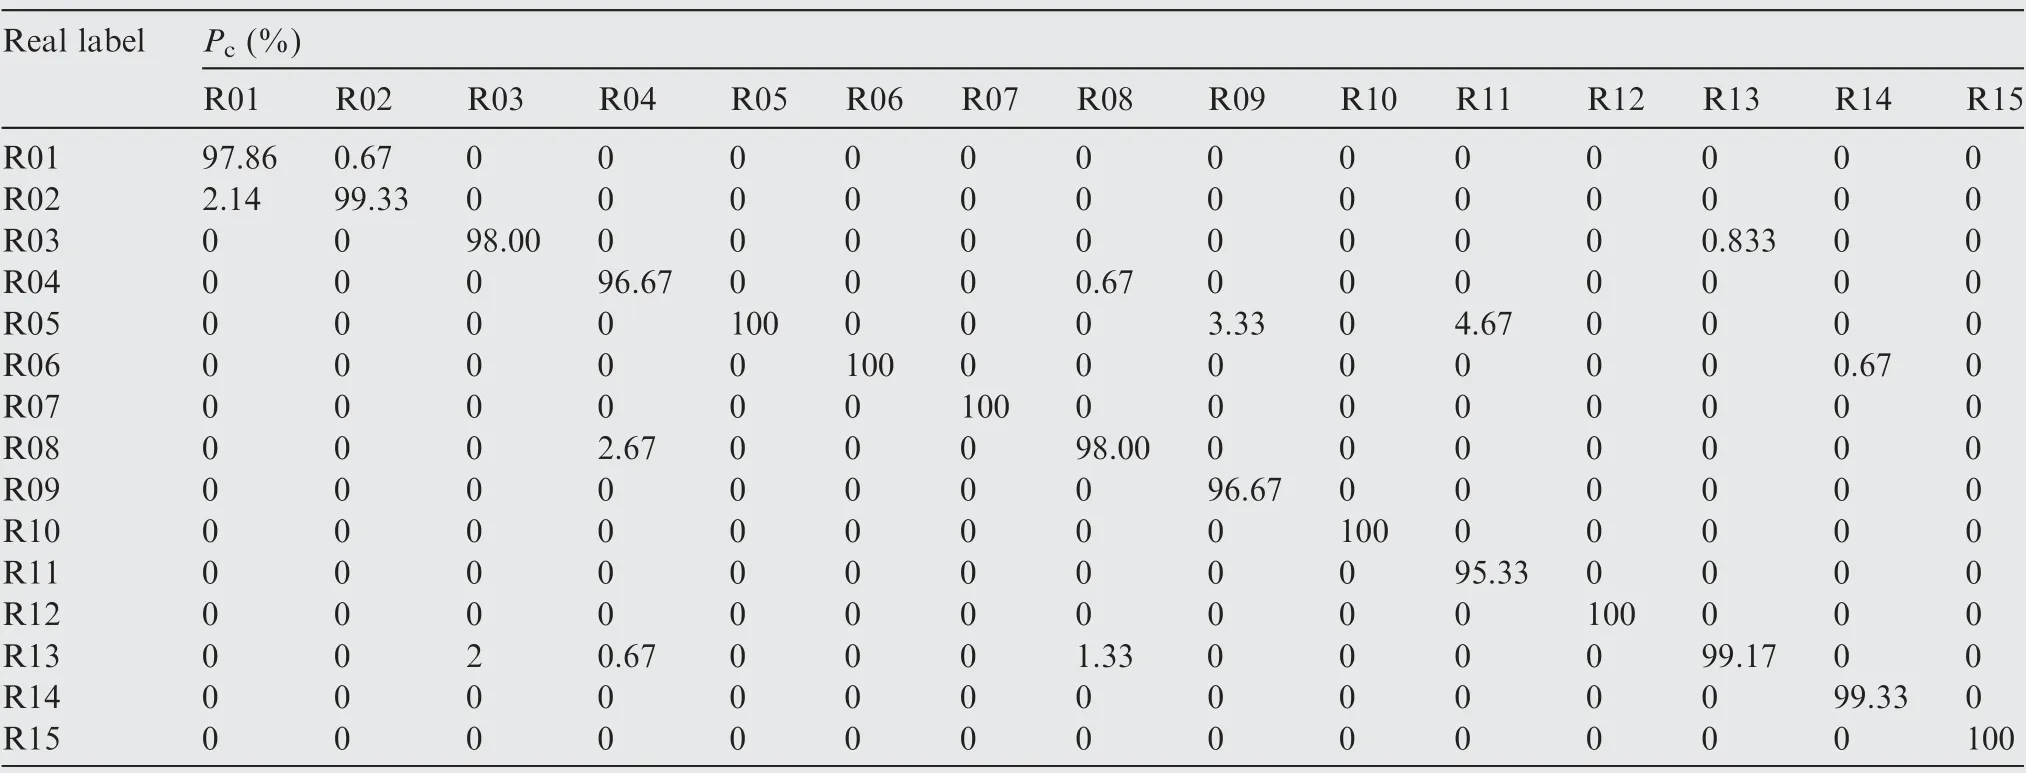
Table 4 Results of proposed unintentional modulation radio frequency fingerprinting in two domains (UIM) using GMM.
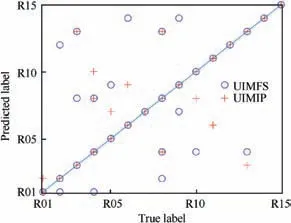
Fig. 3 Distribution of feature recognition results in different domains.
4.2.2. SNR

The proposed UIM features are much better than the original ones at all SNRs and for different numbers of emitter in each domain. The original features contain a large amount of IM without device-individual information, so the recognition is not high after being affected and cannot be directly used for radiation source recognition.
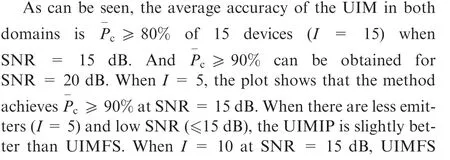
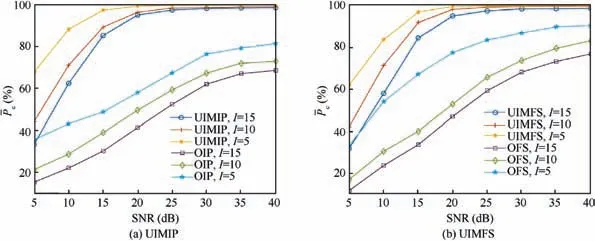
Fig. 4 Performance of unintentional modulation extraction methods with different values of Signal to Noise Ratio (SNR) after 100 Monte Carlo runs.

4.2.3. Energy analysis
To show the energy relationship between the extracted UIM part and the original feature, the energy ratio α in the frequency domain and time frequency are defined as
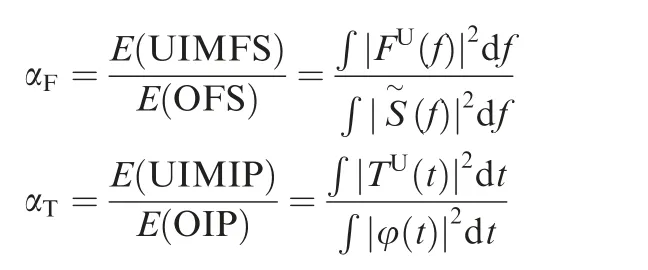
Fig.5 shows the boxplot representation of the UIM energy ratio α of the frequency spectrum and instantaneous phase.These boxplots illustrate the statistical characteristics of all samples of emitters R01 to R15. The vertical axes represent the value of the energy ratio α and horizontal axes represent the IDs of different emitters. There are five lines on each box from bottom to top representing the minimum,the lower quartile, the median, the upper quartile and the maximum, respectively.Fig.5(a)illustrates that the UIM parts extracted from all samples in FS have the energy ratios ranging from 2.4%to 4% of the whole signal. Fig. 5(b) illustrates that the energy ratios of UIMIP are less than 35%. Therefore, it can be concluded that the UIM extracted in this paper is not the main component of the signal. The energy ratio distributions of all samples of each transmitter device are relatively concentrated.
4.2.4. Training size

When only 40 training samples are used in the time domain based UIMIP and 50 training samples are used in UIMFS,the recognition rate can significantly increase to 90%. In the case when a small training set is used,UIMIP performs better than UIMFS. As the training sample increases, the gap gradually narrows. Therefore, UIMs require less training samples to achieve a higher accuracy, which not only shows that the proposed UIM feature is effective, but also shows that it is closer to the true UIM to some extent. On the other hand, in the accurate modeling process, these features reduce the demand for the amount of training data, which is more promising and practical.
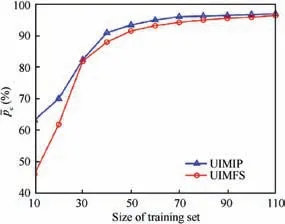
Fig. 6 Performance of the proposed unintentional modulation extraction method in two domains with different sizes of training set.
4.3. Dimension reduction
To illustrate the effectiveness of the secondary feature, we investigate and analyze the distribution characteristics of the HOS features (Linear Skewness and Linear Kurtosis, LSLK)in the form of boxplots, as shown in Figs.7 and 8. As the distances in the vertical axes between the boxes representing different transmitters grow, the HOS feature provides more identification information.Conversely,the closer the transmitters become, the worse the separability of the features is.
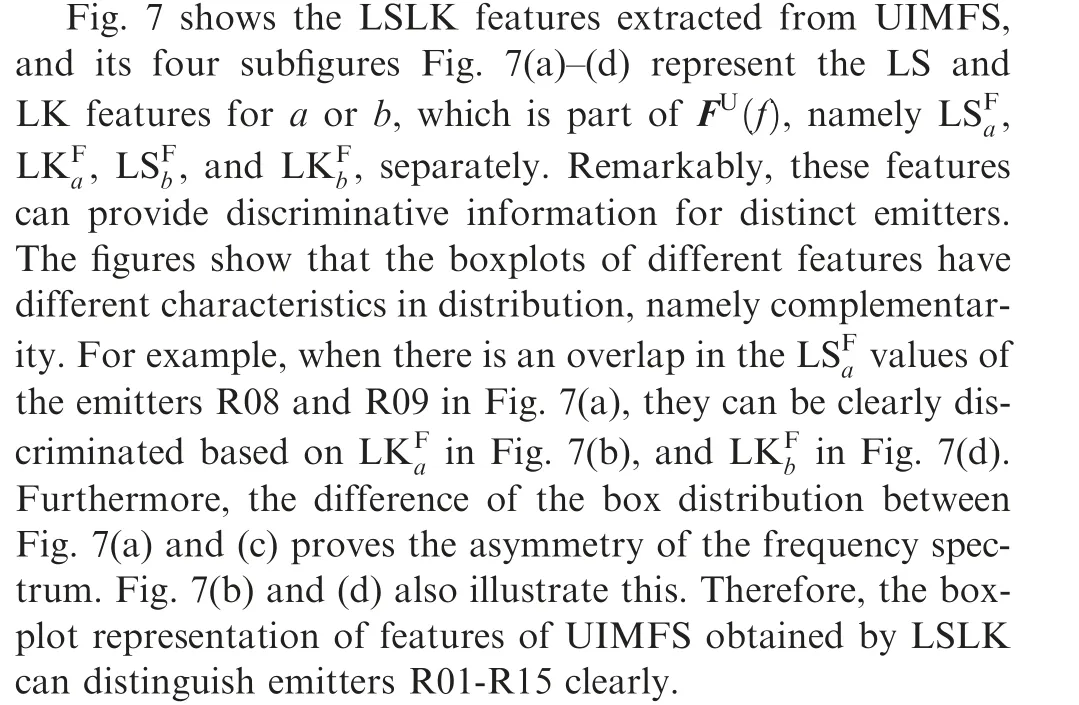
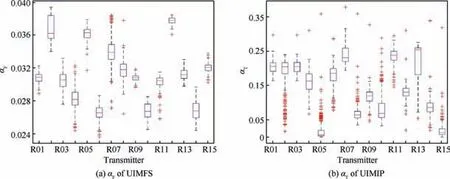
Fig. 5 Boxplot representation of the energy ratio of frequency spectrum (αF) and instantaneous phase (αT).
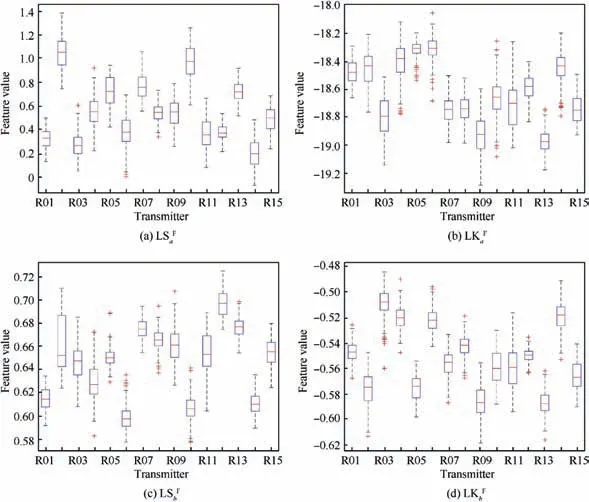
Fig. 7 Boxplot representation of the Linear Skewness and Linear Kurtosis (LSLK) feature of UIMFS.
There are similar situations of the LS and LK features for the a or b part of UIMIP T(t) in the time domain, as illustrated in Fig.8.Although the features of UIMIP perform better in aggregation, the features in UIMFS can provide more complementary information for identification, and vice versa.
Concatenating all features into the dimension-reduced RFF feature Ω using Eq. (34), we use a multiclass SVM (One vs One) with a cubic kernel function for identification. After 100 Monte Carlo trials, the average accuracy Pcan reach up to 97.3% for 15 emitters. The confusion matrix shows the details of the identification result in one trial, as shown in Fig. 9. The horizontal ordinate denotes the predicted class(the numbers from 1 to 15 represent transmitters R01-R15 respectively), and the coordinates on the vertical are labels of the true class.The numbers in green boxes are the correct identification rate while pink ones are the misidentification rates.Only a few samples have been misidentified. Thus, the LSLK RFF feature Ω has good identification performance and succeeds in reducing dimension without losing the separable information of transmitters.
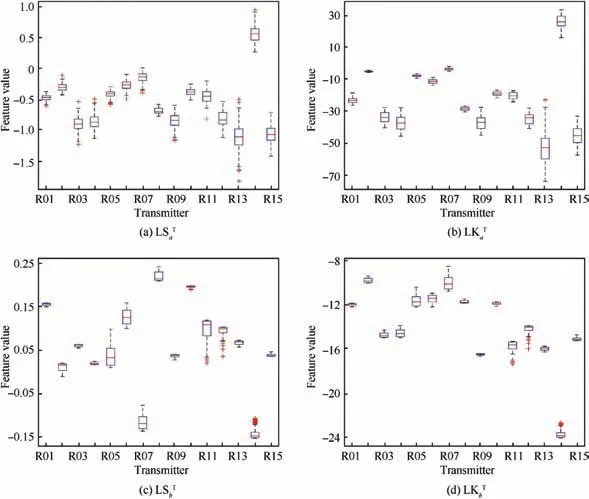
Fig. 8 Boxplot representation of the Linear Skewness and Linear Kurtosis (LSLK) feature of UIMIP.
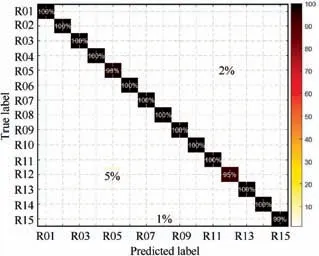
Fig. 9 Confusion matrix of the proposed feature Ω using SVM.
4.4. Compared classification accuracies
To further illustrate the effectiveness of this method, we choose several comparative algorithms: (A) the instantaneous phase feature (IP) proposed in Ref.; (B) the fractal features proposed in Ref.The information dimension and box dimension have been chosen as comparative methods to the secondary feature, which is abbreviated as Frac. (C) The mean and variation are also utilized as comparative method,referred to as MV. Furthermore, the original features in the time domain (OIP) and frequency domain (OFS), and their combination of different secondary features are also tested, namely(OIP & OFS), (OIP & OFS + Frac), and (OIP &OFS + LSLK).


Considering the secondary features, it can be seen that the results (UIM + LSLK) obtained after the dimensionality reduction of non-Gaussian HOS features (LSLK) can reach up to 98.12% for the corresponding high-dimensional feature UIM. The feature dimension has been greatly reduced to only 8 dimensions,and its performance is not worse than the singledomain feature UIMIP or UIMFS, which is still appreciable and proves the effectiveness of the proposed strategy in terms of extracting secondary features. Note that UIM + LSLK is the fusion of UIMIP+LSLK and UIMFS+LSLK in a cascade approach. In a single domain, compared with the corresponding high-dimensional feature, the performance of LSLK (UIMFS + LSLK or UIMIP + LSLK) degrades.However,it can be improved by utilizing the complementarity between multiple domains(that is,extracting the fusion feature UIM + LSLK). Compared with the 500-dimensional UIM(98.95%), the 8-dimensional feature UIM + LSLK(98.12%)does not decrease much,which is acceptable in practical applications.Additionally,the performance improvement of UIM + MV over UIMIP + MV and UIMFS + MV also proves the superiority of the comprehensive utilization of UIM in the two domains.
Compared with other secondary features, in the time domain, the performance of LSLK (UIMIP + LSLK) is similar to that of MV (UIM + MV). However, in the frequency domain, LSLK is much better. Besides, when fusing the domains, LSLK significantly outperforms MV and Frac,which proves the superiority of LSLK for secondary feature extraction.
In summary, the UIM evaluation method proposed in this paper is superior to other feature extraction methods in recog-nition accuracy, works well under various SNRs, and requires fewer samples for training. Considering the high dimensionality of the original UIM, the LSLK-based secondary feature extraction strategy can greatly reduce the feature dimension,and realize feature fusion in different domains,with less recognition effect decrease to satisfy the actual application requirements.

Table 5 Compared classification accuracies and feature dimension.
5. Conclusions
In this work, we introduce a novel scheme to measure and evaluate the UIM as Radio Frequency Fingerprint(RFF)features. And the UIMIP in the time domain and UIMFS in the frequency domain are separated from the main components by the proposed SVR method and curve-fitting residual method.Additionally,to reduce the feature dimensions and achieve feature fusion, Linear Skewness and Linear Kurtosis (LSLK) of the UIMs are calculated as secondary features.The experimental results based on real-world data indicate that the proposed method has high recognition accuracy and can be viable for practical applications.We also show that the extracted UIMIP and UIMFS features account for a low proportion of energy and need fewer samples for training.It is proved that the accurate extraction of UIM is an important part of RFF, and the analysis on this basis is closer to the essential mechanism of RFF. However, the emitter identification performance is degraded in the cases of lower SNR (<10 dB). Therefore,the definition of UIM features must be more precise and unambiguous to reduce the negative effect of noise, which is the subject of future work. In addition, more signals from different modulation modes should be applied in future research.
The authors declare that they have no known competing financial interests or personal relationships that could have appeared to influence the work reported in this paper.
This research is supported by the Program for Innovative Research Groups of the Hunan Provincial Natural Science Foundation of China (No. 2019JJ10004).
