Detail fatigue rating method based on bimodal Weibull distribution for DED Ti-6.5Al-2Zr-1Mo-1V titanium alloy
Tianshuai WANG, Xiaofan HE, Jinyu WANG, Yuhai LI
School of Aeronautic Science and Engineering, Beihang University, Beijing 100083, China
KEYWORDS Bimodal weibull distribution;Detail fatigue rating method;Directed energy deposition;Distribution parameter estimation;Fatigue reliability
Abstract Previous studies have shown that the fatigue life distribution of metal materials fabricated with Additive Manufacturing (AM) methods, such as Direct Energy Deposited (DED) Ti-6.5Al-2Zr-1Mo-1V alloys, exhibits two peaks. To promote the application of AM in aerospace and other engineering fields,developing a fatigue strength evaluation method suitable for AM materials based on their unique fatigue behaviours and fatigue life distributions is necessary. In this paper,a novel Detail Fatigue Rating(DFR)method was developed to evaluate the fatigue strength of DED Ti-6.5Al-2Zr-1Mo-1V based on a bimodal Weibull distribution and the excessive restriction on the allowable stress of potential was improved.Meanwhile,a Bimodal Weibull distribution model for fatigue life and its parameter estimation method were established based on a twoparameter Weibull distribution. The fatigue life at a specific reliability level and confidence level was calculated by using the bootstrap method.The calculation results showed that fatigue life estimated by using the bimodal Weibull distribution at the high reliability level and high confidence level is higher than that estimated by using the two-parameter Weibull distribution. Furthermore,The S-N curve at the specified confidence level and reliability level was fitted.
1. Introduction
With the increasing requirements of the civil aviation industry regarding the safety and economy of aircraft structures, civil aviation components are becoming integrated and complex.The traditional manufacturing process of casting and forging combined with subtractive processing cannot meet the needs of low-cost and rapid manufacturing methods.Metal Additive Manufacturing (AM) is a novel manufacturing technology that integrates computer designs, heat sources (laser and electron beams,for example.), materials,controls and many other advanced techniques to achieve rapid and free formation of metal parts. Compared with traditional subtractive manufacturing processes,AM has the following advantages:(A)a considerably shortened process flow, (B) no mould requirement,(C) a high material utilization rate, (D) minimal processing after fabrication and (E) flexibility to produce components with complex geometries. Moreover, heat sources with a high power, such as lasers and electron beams, are not affected by the properties of the materials being processed and are suitable for fabricating materials that are difficult to process with traditional methods, such as titanium alloys.
Titanium alloys have many advantages, such as low density,high strength and corrosion resistance.However,the poor forming of titanium alloys limits their application in engineering fields. The AM process is very suitable for the processing and forming of titanium alloy structures, which significantly promotes the engineering applications of titanium alloys.The engineering application of AM in forming titanium alloys has caused a series of new mechanical and material problems.Yang et al.studied the hot deformation behaviour and microstructure evolution of Ti-6Al-4V titanium alloy during the AM process. Qiu et al.have performed researches on the microstructures and the mechanical properties of several different titanium alloys fabricated with AM. Qiu et al.considered that the fine mechanical properties of the AM Ti-6Al-4V are due to the microstructure is characterized by columnar grains with martensitic needle structure and a small fraction of β phase.Carroll et al.studied the tensile behaviour of Ti-6Al-4V component fabricated with Direct Energy Deposition (DED) and found that the components are commensurate with those of wrought materials.
Aeronautical structures experience repeated loads over their long periods of service, and fatigue is one of the main modes of damage in aerospace metallic structures.Many studies have been conducted to illustrate the fatigue behaviours of metal materials fabricated with AM and consider that the unique microstructure, which includes relatively large columnar grains, multiple melt layers between the processing layers and fine basket microstructures, and inner defects, such as inner pores and lack of fusion,may be the main reason that the fatigue behaviour of titanium alloys fabricated with AM is different from that of conventional materials.He and Wanginvestigated the fatigue nucleation and propagation behaviours of a titanium alloy with a fully lamellar microstructure.Brandl et al.studied the microstructure and mechanical properties of both wire-fed and powder-bed Ti-6Al-4V alloys fabricated with AM. Their research indicated that the wire-fed alloy had a very fine lamellar α-β microstructure that consisted of basket-weave α and a small amount of martensitic α, while the powder-bed AM alloy had a basket-weave structure with α-lamellae that had a width that was approximately two times higher. The fatigue limits of the both wire-fed and powder-bed Ti-6Al-4V alloys fabricated with AM were comparable to that of the wrought material. Wycisk et al.found in their research on the High-Cycle Fatigue (HCF) behaviour of Ti-6Al-4V alloys fabricated with Selective Laser Melting(SLM) that fatigue cracks initiated from both the surface and internal pores in the specimens.°Akerfeldt et al.suggested that internal defects are the main factor affecting the fatigue performance of Ti-6Al-4V alloys fabricated with AM and that their effects on fatigue life are complicated.Greitemeier et al.considered that the location, shape and size of defects are the main factors affecting fatigue performance. Leuders et al.considered that the defects within specimens have a drastic effect on the fatigue behaviour of titanium alloys fabricated with SLM in the HCF regime. Edward and Ramulufound that the shape of pore defects has a significant impact on the fatigue life,and spherical pores may have a greater weakening effect on the fatigue life because of their elevated stress concentrations.The test conducted by Sterling et al.showed that the size of the defects has a significant effect on fatigue life. The distance between the defects also has a significant influence on fatigue life if there are multiple defects. Liu et al.showed that specimens with large defects or defects closer to the surface of the specimen may have a decreased fatigue life.
Fatigue damage is one of the most important failure modes of aviation structures, and the fatigue strength must be evaluated during the design stage of aircraft.Traditionally, many methods have been established to analyse and evaluate the fatigue quality of conventional materials and structures,including stress-life based methods and strain-life based methods. Stress life-based methods,such as the nominal stress approach,are generally suitable for HCF and were developed under the assumption that the elastic stress state controls the fatigue behaviour. The S-N curve and Miner damage accumulation theoryare two necessary theoretical foundations for stresslife-based methods.Compared to the stress life-based methods,strain life-based methods mainly consider the plastic deformation that may occur during fatigue loading and account for localized yielding. Therefore, these groups of methods are always used in the condition of Low-Cycle Fatigue (LCF).
The two methods above are deterministic and lead to a single estimation of the fatigue life. Due to the variability in the material properties, randomness of the manufacturing process and service environments,there are many uncertainties during the fatigue failure process. Deterministic methods cannot ensure the safety of structures in service. The fatigue strength should be evaluated under specific reliability and confidence requirements. The Detail Fatigue Rating (DFR) method is one of the most important probabilistic fatigue assessment methods, especially for civil aviation structures. It was first introduced by Boeing in the 1980s and has been widely used for aircraft structural reliability assessment at the design stage.DFR is a measure of the fatigue strength of a group of structures with multiple similar structural details. The vital result from DFR analysis is the calculation of the DFR value.
Describing the fatigue life distribution accurately by selecting an appropriate distribution model is the basis of fatigue reliability assessment and design.The DFR method was established with the assumption that the fatigue life follows a twoparameter Weibull distribution, and it is based on a large amount of experimental results and engineering experience.However, it may not be suitable for materials and structures fabricated with AM because their fatigue life distributions are probably not similar to those for materials manufactured by traditional processes due to their unique microstructures and the influence of inner defects.Walker et al.indicated that defects, such as pores, may lead to variations in fatigue crack initiation and propagation, resulting in an apparent variation in the fatigue life. Wang et al.investigated the fatigue behaviour and life distribution of a DED titanium alloy by conducting a large number of fatigue tests. Their studies showed that the fatigue failure of the titanium alloy fabricated with AM presented a mixed failure mode. Internal poreinduced cracks and surface cracks may have both caused specimen failure. The mixed failure mode led to two peaks in the fatigue life distribution. Furthermore, in their article, a bimodal lognormal distribution was established to describe the fatigue life distribution of the titanium alloy fabricated with AM.
Differences in the fatigue behaviour of materials may lead to changes in their fatigue strength evaluation methods.In this paper, to enable the DFR method to be applied to the fatigue reliability assessment corresponding to novel AM processes, a DFR value calculation method was developed based on a bimodal Weibull distribution. The data used to analyse and verify the method established in this article were mainly from Ref., which provided fatigue life data obtained by fatigue testing of a DED Ti-6.5Al-2Zr-1Mo-1V alloy at three stress levels. Furthermore, as the theoretical basis, the following work was done: (A) A bimodal Weibull distribution and its parameter estimation method were established, and (B) a calculation method for the fatigue life at a specific reliability level and confidence level was developed based on the bootstrap method.
2. Testing and calculation of DFR value
The DFR value represents the maximum nominal stress that allows the fatigue life of the structure to reach 100000 cycles under a constant amplitude fatigue load with a stress ratio(R) of 0.06, which corresponds to a 95% reliability and 95%confidence requirement. Due to the definition above, the DFR value can be calculated from the S-N curve with a 95% reliability and 95% confidence level, which can be obtained by conducting fatigue testing at several stress levels with a constant fatigue amplitude with an asymmetry of R = 0.06. In actual engineering applications, due to the sufficient accumulation of experimental data, the DFR value is always obtained by conducting one group of fatigue tests at a specific stress level and stress ratio. The steps for testing and calculating the DFR value are shown in Fig. 1.
The value of Nis the key intermediate quantity in the calculation of the DFR value. Its accuracy directly affects the reliability of DFR analysis results. It is essential to select an appropriate distribution model to describe the fatigue life data obtained from a fatigue test. Usually, a two-parameter Weibull distribution is used to describe the fatigue life data during DFR analysis, according to Ref.. Assume that the fatigue life N follows a two-parameter Weibull distribution, denoted as N ~W(α,β ). The Probability Density Function (PDF) and the Cumulative Distribution Function(CDF) are shown as Eqs. (1) and (2):


Fig. 1 Steps for testing and calculating the DFR value.

where β is the scale parameter, which is also considered the characteristic value of the fatigue life, and α is the shape parameter related to the material properties,which can be estimated by the Maximum Likelihood Estimation (MLE)method or Probability Weighted Moment (PWM) method.During DFR analysis,it is generally considered that α is a constant for the same material.
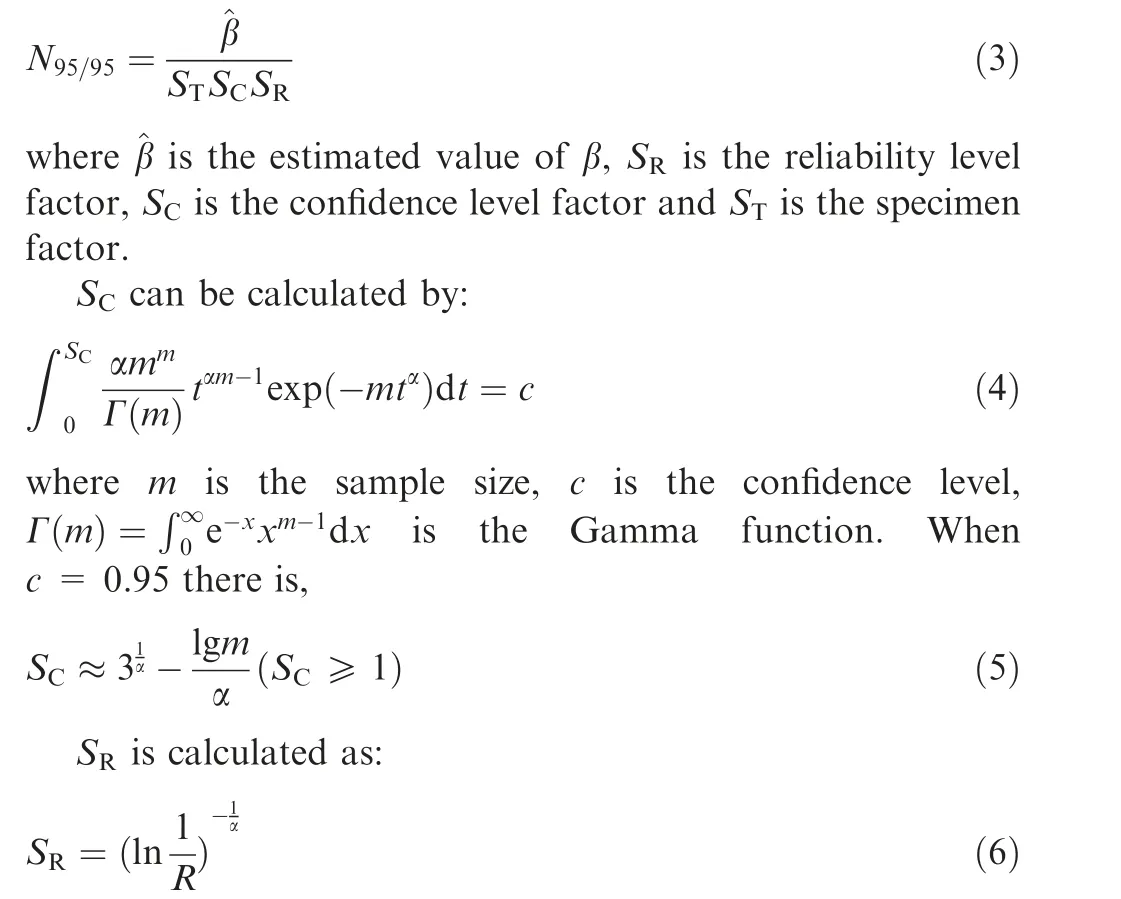
The value of Ncan be calculated easily according to the well-developed Weibull distribution theory,as shown in Eq. (3):
Sis a physical quantity that measures the difference between the specimen and the real structure. Theoretically, it has no relationship with the distribution of fatigue life. It is usually taken as S=1.0.
Under the assumption that the fatigue life follows the twoparameter Weibull distribution, the S-N curves at different confidence levels and reliability levels share the same slope value in logarithmic coordinates. Therefore, the DFR value can be obtained by conducting one group of fatigue tests at a specific stress level and stress ratio.
However, when the fatigue life distribution changes, a new distribution model is needed to describe it,and the calculation method for the DFR value should be improved accordingly.
3. Fatigue life data of the DED Ti-6.5Al-2Zr-1Mo-1V alloy
In Ref., the fatigue test of DED Ti-6.5Al-2Zr-1Mo-1V standard cylindrical specimens was performed on an Instron 8801-100 kN electrohydraulic servo fatigue system in the atmospheric environment at room temperature with a sine wave stress at a stress level of 0.06 and frequency of 10 Hz. Three sets of fatigue tests with peak stresses, namely Svalues of 720 MPa, 760 MPa and 800 MPa, were carried out. The fatigue life data of 54 specimens in total were obtained in Ref.(15 at 720 MPa, 17 at 760 MPa and 22 at 800 MPa). Considering the relative lack of fatigue life data at 720 MPa and 760 MPa, an additional seven fatigue life data points were obtained by conducting supplementary fatigue tests under the same conditions as those in Ref.to improve the analysis.
The fatigue life data of the 61 specimens are listed in Table 1 in descending order. Among them, the data marked with ‘‘*”in the upper right corner indicate the fatigue life data obtained through supplementary tests. The fatigue lives ranged from 65306 cycles to 1559870 cycles (720 MPa), 49758 cycles to 1037170 cycles (760 MPa) and 30293 cycles to 544102 cycles(800 MPa).
As shown in Table 1, the fatigue life data varies in large range compare to the traditional materials, which may due to the special forming processes and microstructures of DED titanium. Mixed failures appeared in all three sets of fatigue tests.This phenomenon is another reason leads to large variation of the fatigue life data. All the specimens were classified into two categories according to the crack initiation locations:specimens with cracks initiating from inner defects (SI) and specimens with cracks initiating from the surface (SS), as shown in Fig. 2. The relationship between microstructure,mixed failure behavior and fatigue life distribution were discussed in Ref..

Table 1 Fatigue life data.
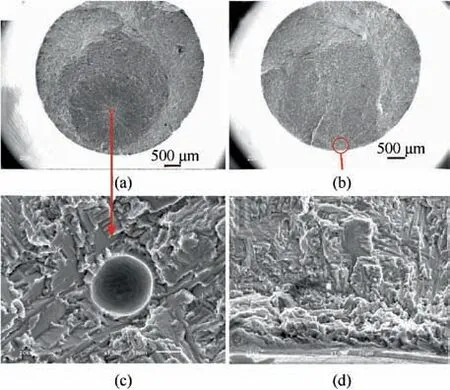
Fig. 2 Typical fracture photographs of (a) SI and (b) SS and high-magnification views of (c) SI and (d) SS.
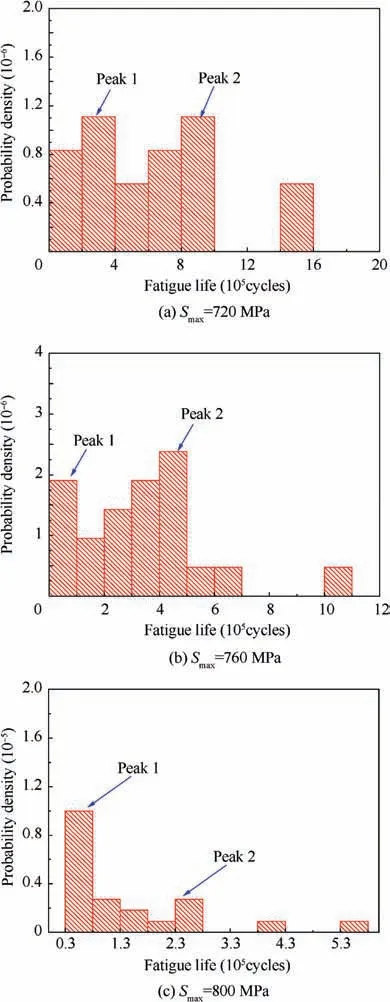
Fig. 3 FDHs for fatigue life data at three stress levels.
To elucidate the distribution of the fatigue life results, the Frequency Distribution Histograms(FDHs)for the fatigue life results at the three stress levels are plotted in Fig.3.The results indicated that the fatigue life of the DED titanium alloy had two peaks. In Ref., the two peaks were obvious in the logarithmic coordinate system.
4. Bimodal Weibull distribution
4.1. Distribution model

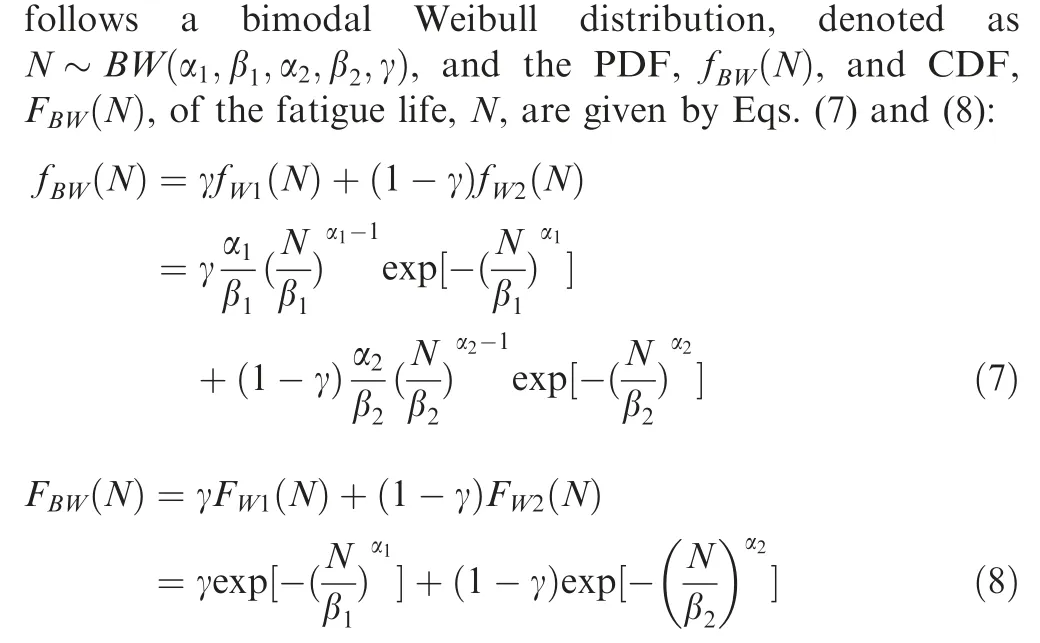
where f(N),F(N),f(N) and F(N) represent the PDF and the CDF of two independent random varieties following the two-parameter Weibull distribution; α,β,α,β,γ are distribution parameters; α,αare shape parameters; and β,βare scale parameters. Parameter γ represents the weight and 0 ≤γ ≤1. When γ=0 or γ = 1, the bimodal Weibull degrades into a single-peak two-parameter Weibull distribution.
4.2. Distribution parameter estimation
The MLE method, PWM method are always used to estimate the parameters of two-parameter Weibull distributions. Compared with the two-parameter Weibull distribution, bimodal Weibull distribution has five parameters in total and CDF with more complex form. If MLE method is used for parameter estimation, nonlinear equations with five unknown variables should be solved.It hard to ensure the accuracy of the estimation result due to it is greatly affected by the initial value. For PWM method, the inverse function of CDF is required and it is difficult to find the inverse function of CDF of bimodal Weibull distribution due to its complex form. Therefore, the Expectation Conditional Maximization (ECM) method, an improved Expectation Maximization (EM) method, is used to estimate the distribution parameters in the a bimodal Weibull distribution in this paper.
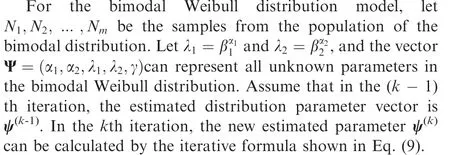
The detailed derivation process of Eq. (9) and the expressions of intermediate variables are listed in the Appendix.According to Eq. (9), the five distribution parameters in the bimodal Weibull distribution can be calculated iteratively.Estimates of βand βcan be calculated from estimates of α,αand λ,λ. An analysis of the data in Section 3 provided the estimated bimodal Weibull distribution parameters listed in Table 2.
5. Detail fatigue Rating method
5.1. Estimation of N95/95
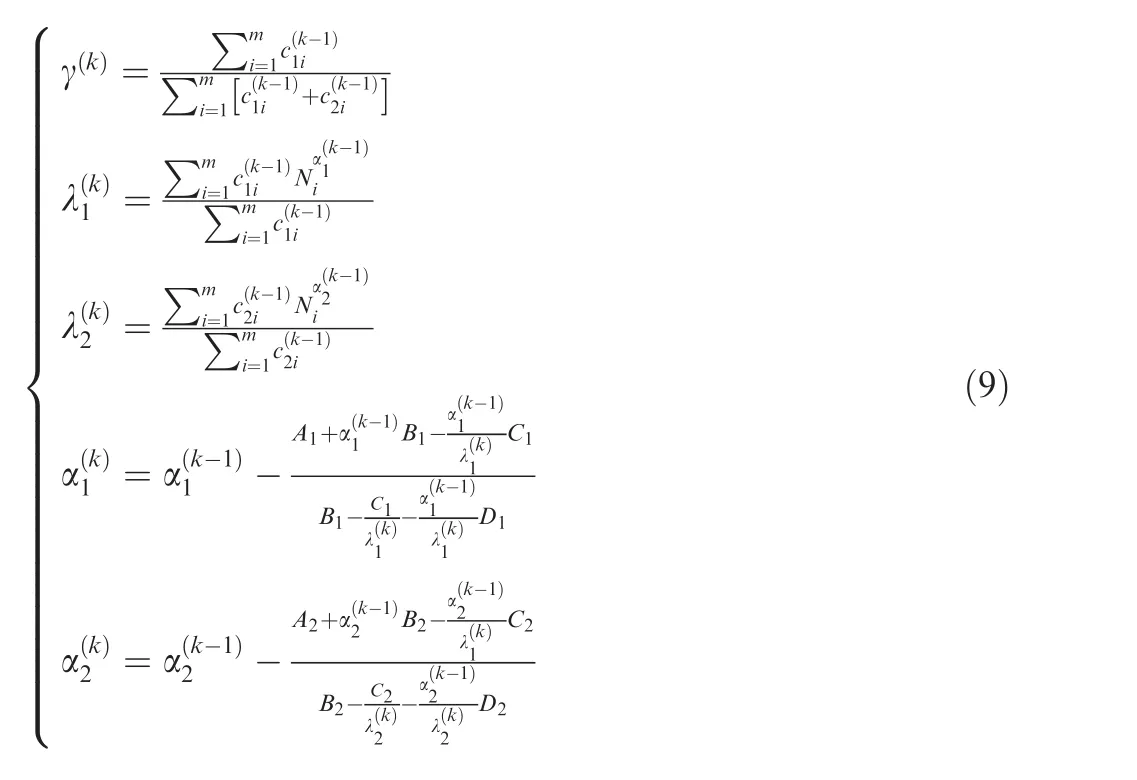
For the specific reliability value P, the fatigue life under P is denoted as Nand satisfies Eq. (10):
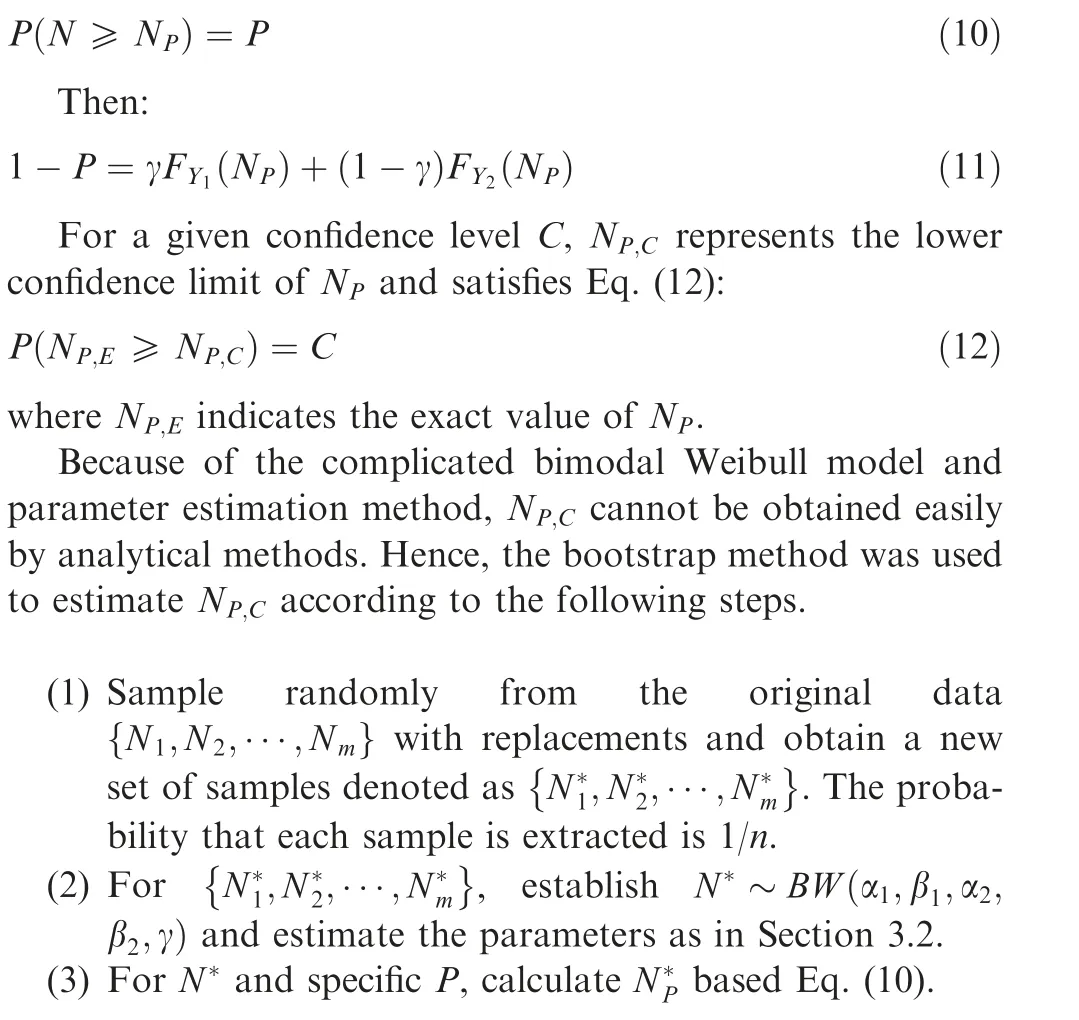

Table 2 Estimation results of bimodal Weibull distribution parameters.

When C = 0.95 and P = 0.95, Nrepresents the fatigue life at a reliability level of 95%and a confidence level of 95%,denoted as N, which is the most important physical quantity in DFR analysis.The calculated Nat three stress levels is listed in Table 3.
5.2. S-N curve and DFR value
Due to the lack of sufficient experimental data records, it is currently difficult to determine the DFR value of a material with a bimodal Weibull distribution based on one group of fatigue tests and the existing S-N curve parameters.Therefore,the S-N curve parameters corresponding to a 95% reliability and 95%confidence level must be calculated through multiple groups of fatigue test results at several different stress levels before the calculation of the DFR value.
The S-N curve is still described by the Basquin equation,and its logarithmic form is expressed as Eq. (13):

where mand Care parameters of the S-N curve at a reliability level of 95% and a confidence level of 95%. The two parameters can be obtained by the Least Squares Method(LSM), as shown in Eq. (14):

where Sis the maximum nominal stress of the i-th group of fatigue tests; Nis the fatigue life at a stress level of Scorresponding to the 95%reliability and 95%confidence level obtained by statistical analysis; i=1,2,...,l; and l the number of fatigue test groups.
According to the above method,S-N curve parameters at a reliability level of 95% and confidence level of 95% can be directly obtained. Therefore, the DFR value can be calculated directly from the abovementioned S-N curve, as shown in Eq.(15),based on the definition of the DFR value.The calculated parameters of the S-N curve and DFR value are listed in Table 4:


Table 3 N95/95 calculation results based on bimodal Weibull distribution.

Table 4 Parameters of S-N curve and DFR value based on the bimodal Weibull distribution.
6. Discussion
6.1. Comparison between bimodal Weibull distribution and Weibull distribution
Table 5 shows the estimated distribution parameters for the fatigue life following the Weibull distribution at three stress levels by MLE. Fig. 4 shows the FDH and PDF curves of the Weibull distribution and bimodal Weibull distribution drawn according to the estimated parameters listed in Table 4 and Table 5.Compared with the output from the Weibull distribution, using the bimodal Weibull distribution to describe the fatigue life data can better reflect the two peaks in the fatigue life data for the DED Ti-6.5Al-2Zr-1Mo-1V alloy.
Fig. 5 shows the CDF curves for the bimodal Weibull distribution and Weibull distribution.The cumulative probability values, P, calculated by Eq. (16), are also plotted in Fig. 5:

In Eq. (16) m is the number of samples in the fatigue life data at a certain stress level and i is the serial number of a fatigue life sample in all m samples after sorting in ascending order.It can be seen in Fig.5 that the CDF curve of the bimodal Weibull distribution can better fit the fatigue life data of the DED Ti-6.5Al-2Zr-1Mo-1V alloy than the Weibull distribution.
It is qualitatively indicated in Fig. 4 and Fig. 5 that the bimodal Weibull distribution can describe the distribution of fatigue life data well, and it is similar to that for the DED Ti-6.5Al-2Zr-1Mo-1V alloy in Section 3, which may exhibit two peaks. To further explain the conclusion mathematically,it is necessary to test the goodness-of-fit values of the two distribution models. Based on the Empirical Distribution Function (EDF) given in Eq. (17), the Anderson-Darling (AD)method was used to test the goodness-of-fit values for the parameter estimation results of the bimodal Weibull distribution and Weibull distribution:

In Eq.(17),φ(N)represents the value of CDF at N.When testing whether the fatigue life data follow the Weibull distribution,φ(N)represents the F(N)in Eq.(2),and when testing whether the fatigue life data follow the bimodal Weibull distribution, φ(N) represents the F(N) in Eq. (8).
The AD method is a goodness-of-fit test method based on the bootstrap method. Its main steps are as follows:
(1) Assume that the sample data follow the X distribution,and calculate the test statistic Aaccording to the estimated parameters and sample data.

Table 5 Estimated results for the Weibull distribution parameters.
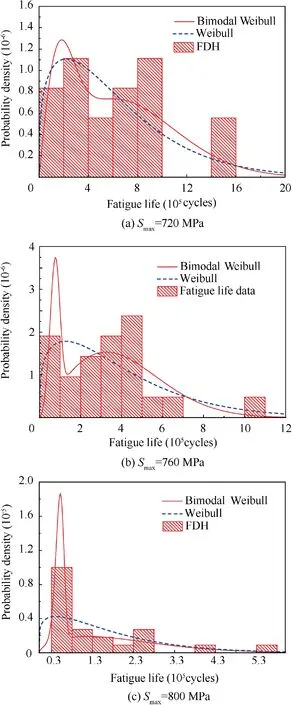
Fig. 4 PDF of bimodal Weibull and Weibull at three stress levels.
(2) Resample the sample data and re-estimate the parameters of the X distribution based on the bootstrap method mentioned in Section 5.1.
(3) Calculated the new test statistic Abased on the distribution parameters estimated in step (2).
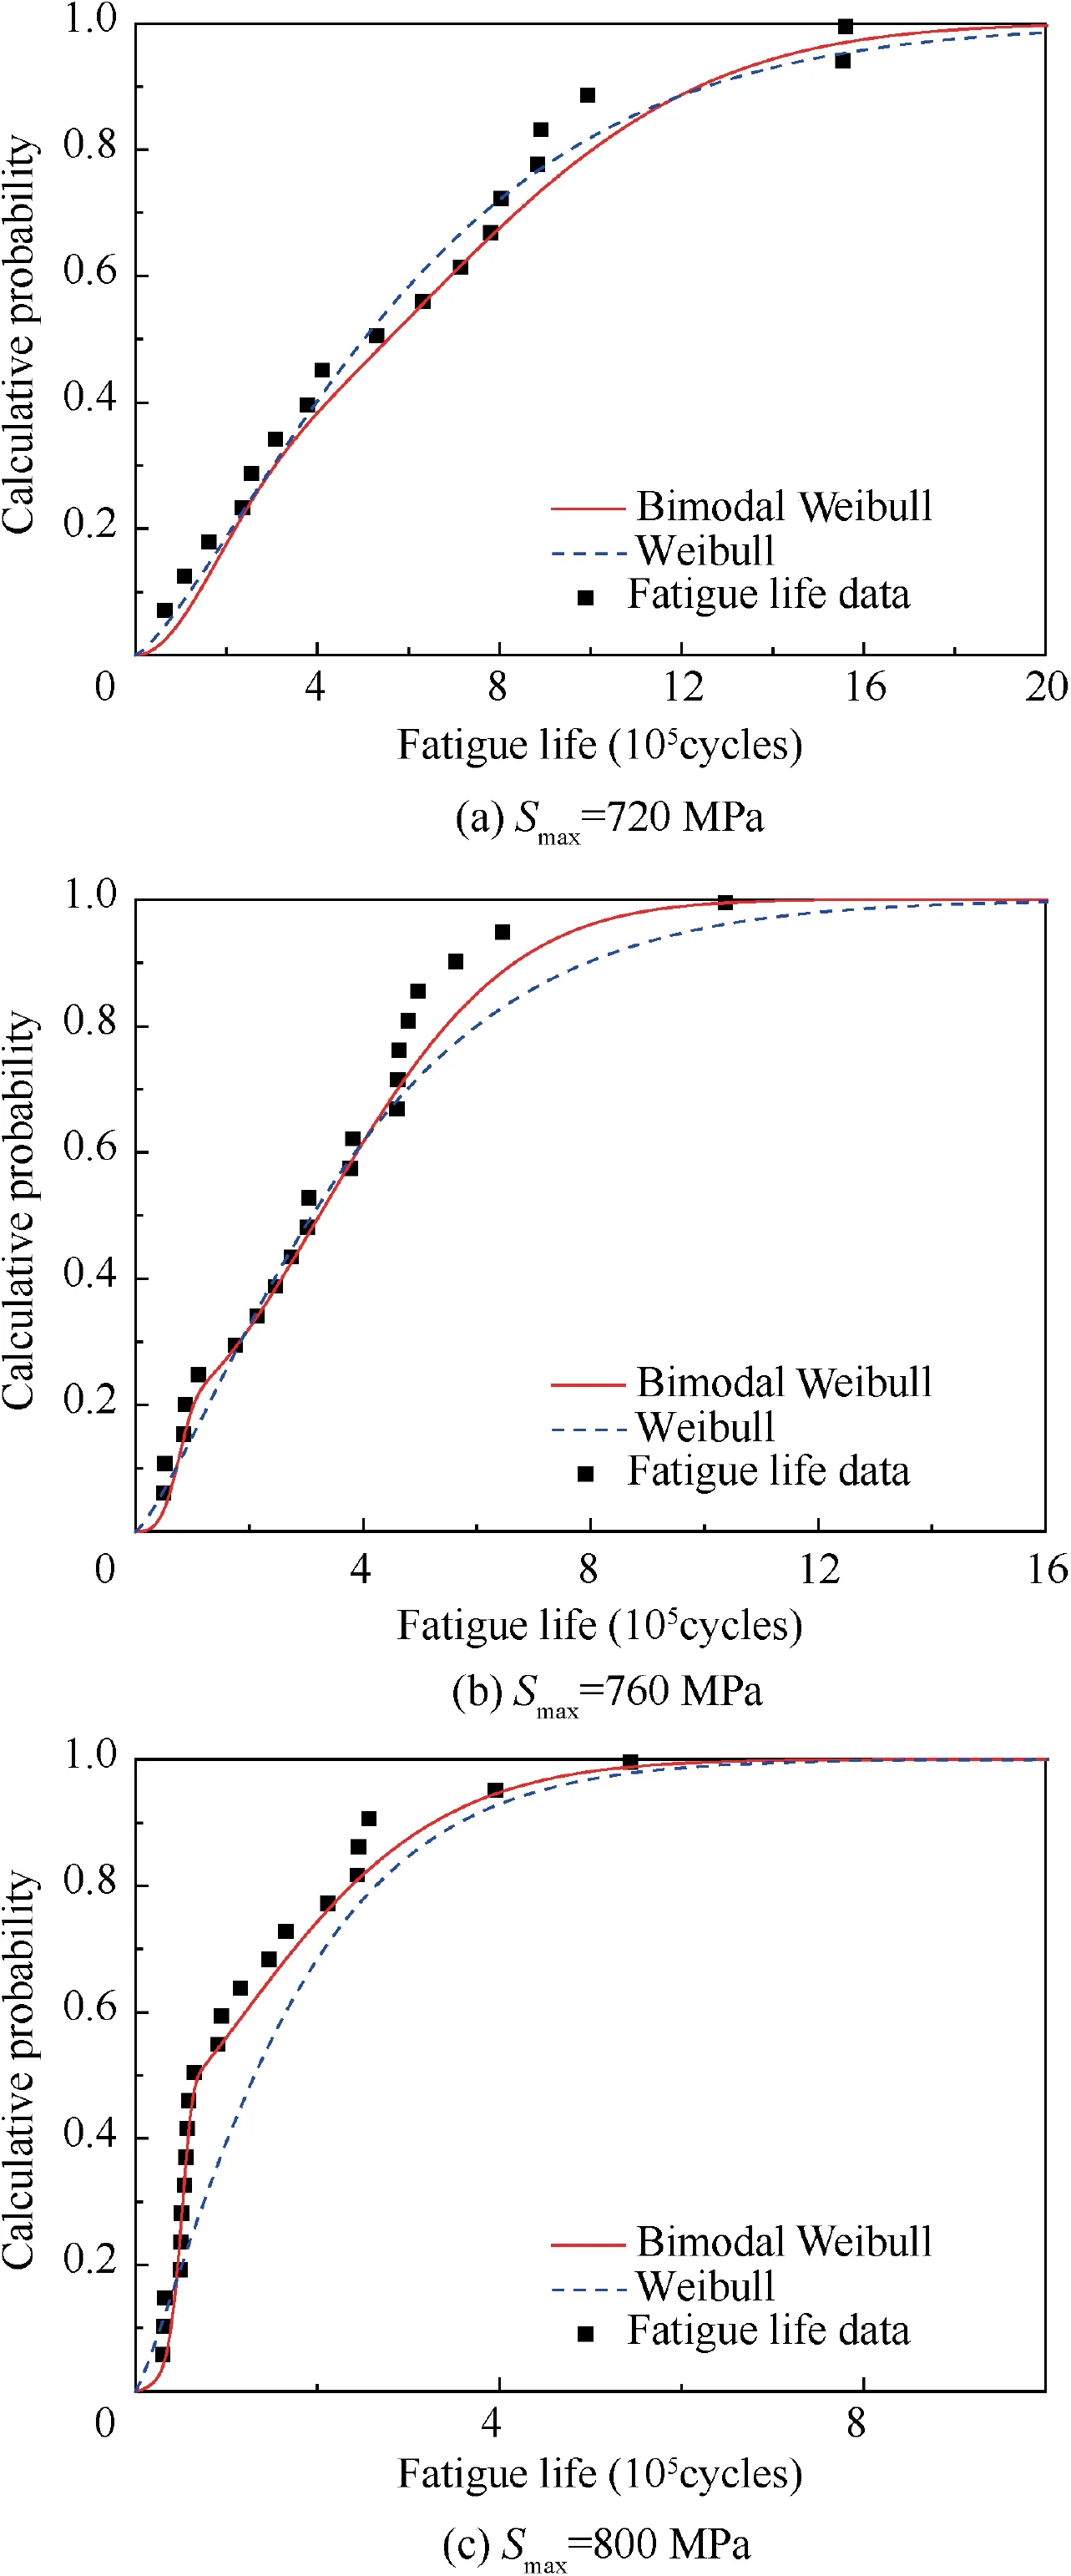
Fig. 5 CDF of bimodal Weibull and Weibull at three stress levels.
(4) Repeat steps(2)and(3)5000 times to obtain a sequence of 5000 test statistics.
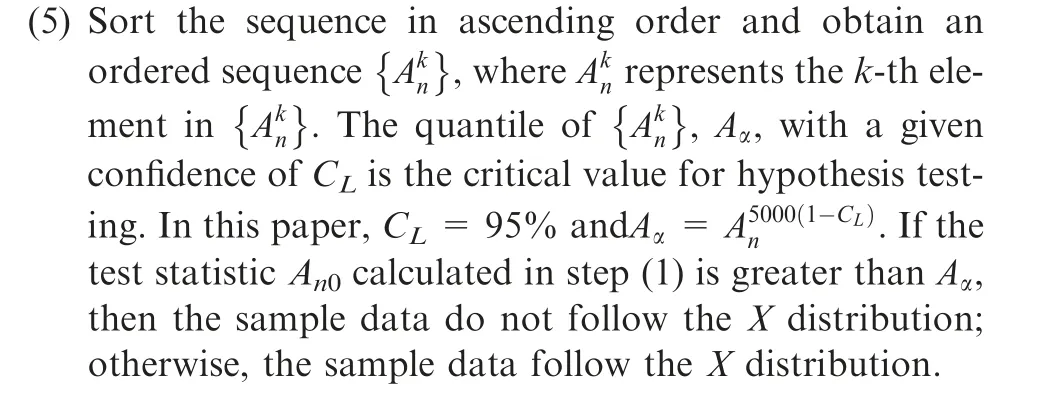
According to the method above, the goodness-of-fit test was performed on whether the fatigue life data at the three stress levels followed the Weibull distribution or the bimodal Weibull distribution. The test results are listed in Table 6.The values of Aof the bimodal distribution are smaller than

Table 6 Results of the goodness-of-fit tests.
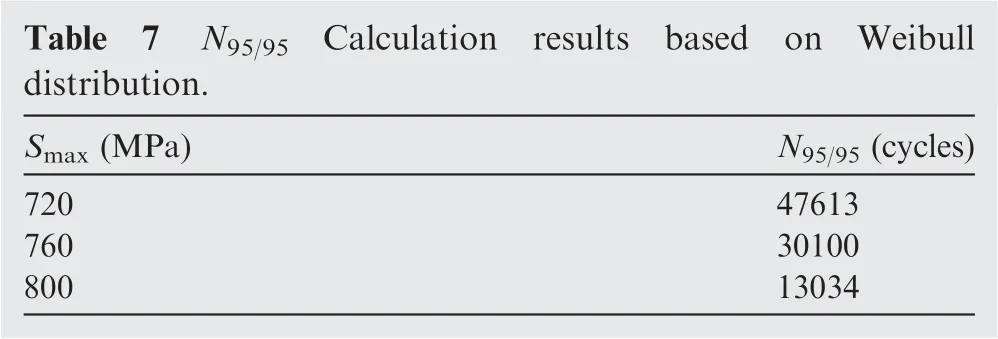
those of Aα,while those of the Weibull distribution are greater than those of Aα at all three stress levels. It was indicated that the bimodal Weibull distribution better described the fatigue life data than the Weibull distribution.

Table 7 N95/95 Calculation results based on Weibull distribution.
6.2. N95/95 For two distribution models
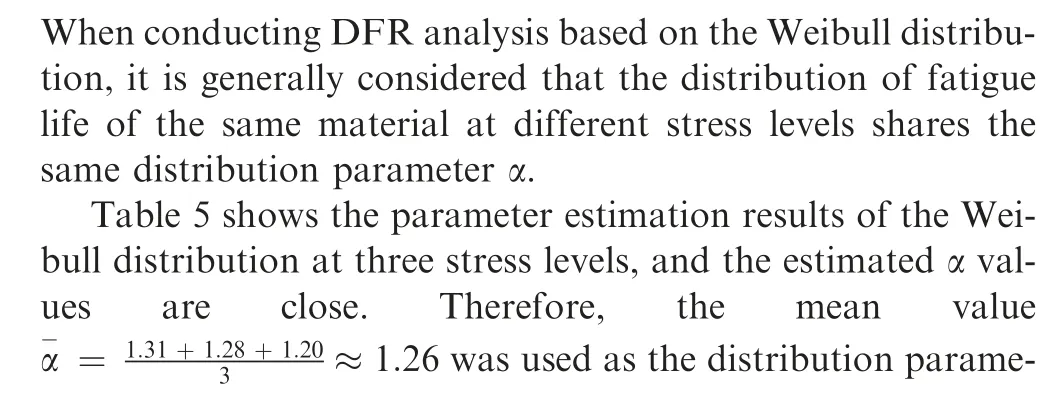
To further illustrate the differences between the bimodal Weibull distribution and Weibull distribution, fatigue lives at several specific reliability and confidence levels were calculated and are listed in Table 8 and Table 9. The data are shown in Table 8 and Fig. 6, where it can be seen from the figure that at the same confidence level (95%), the fatigue life at a high reliability (≥90%) estimated based on the bimodal Weibull distribution is greater than that based on the Weibull distribution. Fig. 7 shows a comparison of the estimated fatigue life with different confidence requirements at the same reliability level (95%) based on the data in Table 8. Fig. 7 shows that at the same reliability, the fatigue life at different confidence levels estimated based on the bimodal Weibull distribution is greater than that estimated based on the Weibull distribution.The conclusions above show that describing the fatigue life data by selecting an appropriate distribution model can significantly improve the estimated value of the fatigue life at high reliability and confidence levels.

Table 8 Fatigue life at a confidence level of 0.95 and several reliability levels.

Table 9 Fatigue life at a reliability level of 0.95 and several confidence levels.
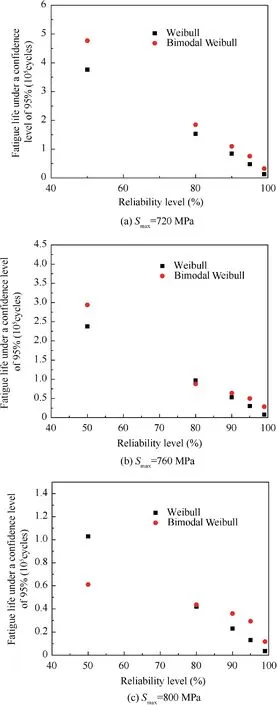
Fig. 6 Fatigue life at a confidence level of 95% and several reliability levels at three stress levels.
6.3. DFR value for two distribution models
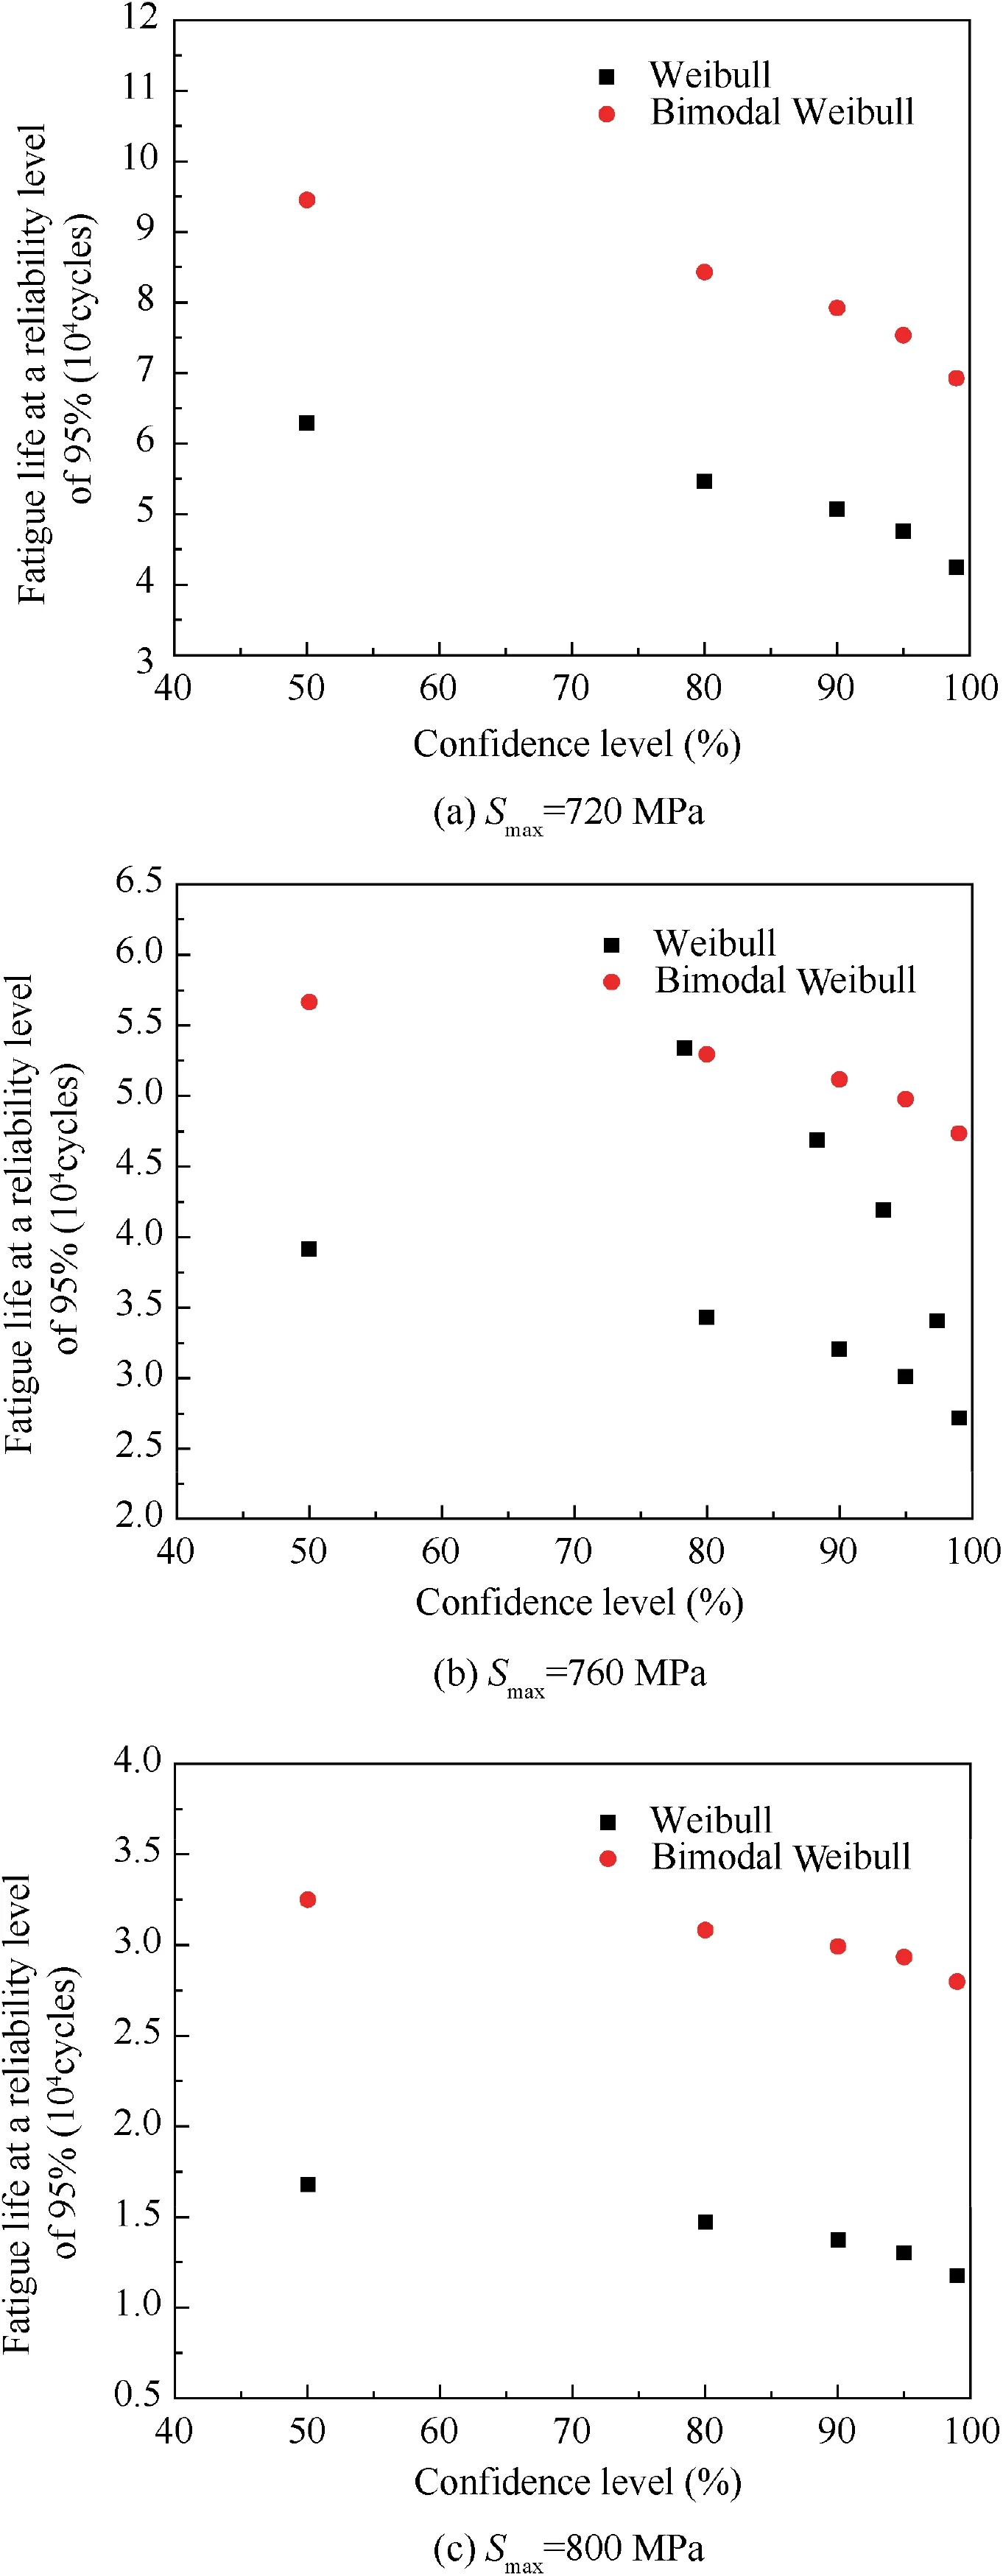
Fig. 7 Fatigue life at a reliability level of 95% and several confidence levels at three stress levels.
The S-N curve clusters at several different reliability levels and confidence levels, as shown in Fig. 8, were obtained by fitting the fatigue life data listed in Table 8 and Table 9. It can be observed in Fig.8(a)that the S-N curves under different reliability levels and confidence levels, fitted based on the Weibull distribution, are approximated parallel. Therefore, under the assumption that the fatigue life data follow the Weibull distribution,the DFR can be calculated with a group of fatigue life data obtained from the fatigue test under one specific stress level and the parameter mof the known S-N curve(50%reliability level and 50% confidence level), which can always be obtained from a material manual. However, in Fig. 8(b), the S-N curves at different reliability levels and confidence levels,fitted based on the bimodal Weibull distribution,have no obvious parallel relationship between each other. Thus, the DFR value based on the bimodal Weibull distribution should be calculated according to the DFR definition. Under the assumption that fatigue life data follow the Weibull distribution,multiple groups of fatigue tests at different stress levels should be performed. Then, the S-N curve at a reliability level of 95%and a confidence level of 95% should be fitted to calculate the DFR value.
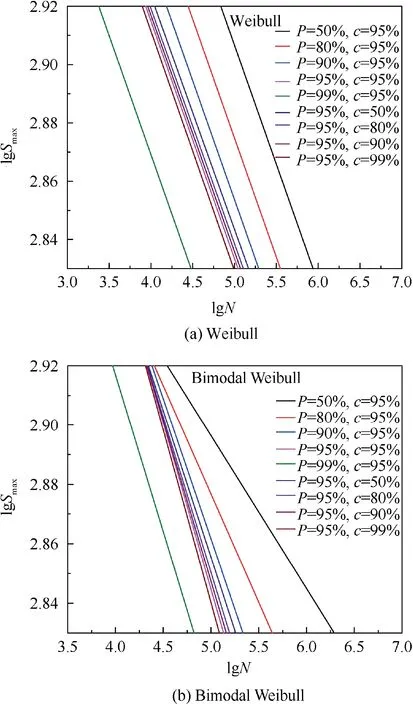
Fig. 8 S-N curve clusters.

Table 10 Parameters of S-N curve and DFR value based on the Weibull distribution.
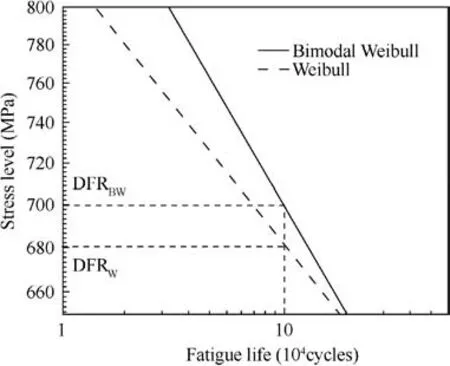
Fig. 9 DFR values and S-N curves (c = 95%, R = 95%).
The DFR value based on the Weibull distribution was calculated and is listed in Table 10. To illustrate the influence of different distribution models on the DFR value, the DFR value based on the Weibull distribution was calculated according to the DFR definition,the same as that based on the bimodal Weibull distribution. The S-N curve parameters based on the Weibull distribution, at the reliability level of 95% and the confidence level of 95%,were also calculated and are listed in Table 8.As shown in Fig.9,two S-N curves,based on both Weibull and bimodal Weibull distributions at the reliability level of 95% and the confidence level of 95%, were plotted according to Table 4 and Table 10.It can be seen in Fig.9 that the slope of the S-N curve based on the Weibull distribution is smaller than that based on the bimodal Weibull distribution.This conclusion implies that the rate of decrease of the fatigue life based on the bimodal Weibull is less than that based on the Weibull distribution as the stress level increases.
Within the stress range shown in Fig.9 the values of Ncalculated based on the bimodal Weibull distribution are greater than those based on the Weibull distribution. The DFR value calculated based on the bimodal Weibull distribution increased by approximately 20 MPa compared with that based on the Weibull distribution.Thus,it can be inferred that using the bimodal Weibull distribution to describe the distribution of fatigue life data more accurately can reduce the excessive restriction on the allowable stress due to an inaccurate distribution model and effectively improve the engineering application potential of materials or structures.
7. Conclusion
Previous studies have shown that the fatigue life distribution of DED Ti-6.5Al-2Zr-1Mo-1V alloys had two peaks. To address this phenomenon, a bimodal Weibull distribution model was established from a two-parameter Weibull distribution, and a novel DFR method was developed based on a bimodal Weibull distribution. The conclusions can be summarized as follows:
(1) A bimodal Weibull distribution model was established based on a two-parameter Weibull distribution. The parameter estimation method was given according to the ECM method. The statistical analysis of the fatigue life data of the DED titanium alloy showed that, compared with that for the Weibull distribution,the bimodal Weibull distribution can describe the fatigue life data with two peaks more accurately.
(2) Under the assumption that the fatigue life follows a bimodal Weibull distribution, the fatigue life under a specific reliability level and confidence level was calculated by using the bootstrap method. The calculation results showed that fatigue life estimated by using the bimodal Weibull distribution at the high reliability level and high confidence level is higher than that estimated by using the two-parameter Weibull distribution.
(3) The DFR value calculation method was established based on the DFR definition. The DFR value calculation based on the bimodal Weibull distribution increased by approximately 20 MPa compared with that based on the Weibull distribution.By using the bimodal Weibull distribution, the excessive restriction on the allowable stress due to the inaccurate distribution model can be reduced, and the engineering application potential can be improved.
The authors declare that they have no known competing financial interests or personal relationships that could have appeared to influence the work reported in this paper.
s
The authors gratefully acknowledge the support from the National Key Research and Development Program of China(No.2017YFB1104003),National Natural Science Foundation of China (No.11772027), and Aeronautical Science Foundation of China (No.201909051002).
