A serialized civil aircraft R&D cost estimation model considering commonality based on BP algorithm
Yongjie ZHANG,Kng CAO,Ke LIANG,*,Yongqi ZENG,,Wenjun DONG
a School of Aviation, Northwestern Polytechnical University, Xi’an 710072, China
b Shanghai Aircraft Design and Research Institute, Shanghai 201210, China
KEYWORDS BP algorithm;Civil aircraft R&D cost;Common indicators;Fuzzy set;Serialized civil aircraft
Abstract The common design of serial civil aircraft,an important strategy of modern civil aircraft research and develop-ment, minimizes the whole life cycle cost of civil aircraft through asset reuse and resource sharing. However, the existing estimating model for the R&D cost of civil aircraft ignores the effects of common design,so the value estimated by estimating derivative models is significantly inconsistent with the actual one. To solve this problem, a novel assessment method for civil aircraft commonality indicators is developed based on fuzzy set in the present study,exploiting the attributes and structural parameters of the aircraft to be assessed as input to determine the degree of membership that pertains to the commonality sub-interval as the commonality indicator.Then the BP(Back Propagation)neural network algorithm is adopted to establish the relationship between the common index and the decrease rate of the R&D cost of derivative models.The model employs over a dozen typical civil aircraft models (e.g., Boeing, Airbus, and Bombardier) as the sample data for network learning training to build a mature neural network model for estimating the R&D cost of novel derivative models. As revealed from the comparative analysis on the calculated results of the samples, the estimated results of the model given the effects of commonality in the present study exhibit higher estimation accuracy and value for future work.
1. Introduction
Under increasingly fierce competition in the global market,product series (product family) development strategies have been rolled out in a growing number of manufacturing companies.Through carrying out mass production of products that satisfy the diverse and individual needs of customers, several economic benefits (e.g., increasing production efficiency,enhancing product quality, lowering product costs, saving delivery times, and improving market response capabilities)can be achieved.Series products refer to a series of products that are associated with or similar to each other in features,components, modules, or subsystems. Serialization indicates a standardized form that optimizes the structure and functions of a certain type of product systems. Product series development strategies have been effectively introduced in several industries (e.g., the electronics, software, automobiles and home appliances), and in-depth research and application in the design and development of complex products(e.g.,aircraft,ships and satellites).In the aviation field, the aircraft series overall consists of a basic aircraft and its derivative or variant aircraft. In addition, it covers multiple aircraft with different tasks, whereas it still shares a few key parts or systems.
The core concept of commonality is indispensable in the research strategy of a series of products; its basic concept was not proposed recently.As early as 1914, an automotive engineer proposed the need for standardization of automotive sub-components (e.g., axles, tires, and fuel supply mechanisms) to mix and match components and down-regulate costs.Subsequently, this concept has gradually led to a common design concept based on continuous evolution and development. The so-called commonality, in a narrow sense,indicates the similarity between the two assessment objects;from a broad perspective, it refers to the potential strategy to improve the profitability of the company based on assets reuse and sharing (e.g., components, processes, technologies,interfaces and infrastructure) in the product family.Product serialization is a business strategy developed by an enterprise for multiple products, while commonality is a design concept for a certain product. Overall, the common design of the product series is capable of significantly elevating the degree of customer dependence and lowering costs at all phases of the product’s life cycle.The common design of civil aircraft also has the same effect.For instance,in the late 1970s,Boeing employed the term‘‘Commonality”initially in its product promotion activities, primarily referring to the system and structural component identity among the various models of the 737 series. The Boeing’s strategy will bring many benefits to customers’ service and equipment guarantee.After experiencing the setbacks of A300, especially A310, serialized products (e.g., Airbus A320/330/A340) came out successively since the 1990s. The ‘‘commonality” appears in Airbus publicity to stress the important attribute of the mentioned series of products, i.e., the high similarity in cockpit layout and operation rules of various aircrafts,to ensure that pilots can easily switch between different aircraft models.Obviously,the commonality design of serial civil aircraft has many advantages,such as reducing the life cycle cost,shortening the R&D cycle,etc.,and has become an important means of global optimization design of modern civil aircraft.
Moreover, international scholars have begun to focus on the research of common design and profit model of civil aircraft. Nuffortreported that applying commonality wisely can lower the cost of ownership by down-regulating procurement, operational and support costs. He considers that the reduction in procurement costs is because commonality lowers the design, manufacturing, and subcontracting costs of major suppliers. The operation and support costs are reduced since commonality is capable of narrowing the maintenance cycle,reducing the training cost of operators,and improving the reliability and availability of aircraft. In addition, he found that using a common organization to manage all aircraft with common subsystems will noticeably help reduce the complexity of common management at the enterprise level. Ulrich and Eppingerdiscussed the benefits and penalties of commonality.The authors recognized the popularity of reuse and the fact that most industries should make a decision between reuse and emerging components.They highlighted that the potential benefit of commonality is to down-regulate R&D costs and fixed costs of production (e.g., manufacturing tools and simulating machine costs) by narrowing the total R&D scope. Simpson and Fujita et al.concluded that due to the trade-off between the scale of the sharing economy and the potential cost of overperformance,commonality may lead to an increase in some costs,or a decrease in some costs.Moreover,they built a model with three organizational structures,i.e.,collaborative projects, independent projects, as well as partial collaborative projects. Furthermore, the model provides insights into common benefits and penalties,where the benefits of collaborative projects increase with the elevation of design costs(fixed costs),complexity costs and mortgage costs.As Jacob Markishanalyzed,the demand market of civil aircraft is significantly uncertain for numerous factors. Accordingly, the value of civil aircraft project is directly proportional to its flexibility, and the civil aircraft project with commonality is the embodiment of flexibility. In this regard, the author discusses the impact of commonality on the cost of various stages of aircraft life cycle. Through the case calculation of BWB (Blended-Wing-Body) series aircraft, the value of civil aircraft project with commonality is proved to be higher than that of civil aircraft project without commonality.
Through the analysis on the existing research, it is suggested that many scholars have concluded that the commonality of series products has potential benefits. In the aviation field, only some qualitative analyses have been conducted on the revenue model of commonality for civil aircraft projects.In accordance with the fuzzy set theory of fuzzy mathematics,the present study developed the calculation method of common index between aircraft types. After analyzing and optimizing the existing cost model of civil aircraft development,this study indicates that it is necessary to consider commonality in the research and R&D cost estimation of civil aircraft.Lastly, BP algorithm is adopted to develop the relationship between the commonality index and the R&D cost of civil aircraft.This model intuitively quantifies the impact of commonality of civil aircraft design on R&D cost, and it can to some extent guide civil aircraft manufacturers in the early stage of civil aircraft project.
2. Civil aircraft commonality assessment index
Generally, there are similarities and differences between any two products. Likewise, for two civil aircraft models, whether the two models are common cannot be directly determined.Instead, we should give a scientific and reasonable calculation method to determine the degree of commonality between the two models, which is the significance of the existence of civil aircraft commonality index model.
2.1. Civil aircraft commonality assessment index system
The commonality among civil aircraft models is a gradual interval(Fig.1).We divide it into six subintervals,which make us more accurately describe the commonality of the evaluation objects. As shown in Fig. 2, the six sub-intervals are ‘‘L1-extremely common”, ‘‘L2-highly common”, ‘‘L3-moderate to high common”, ‘‘L4-moderate to low common”, ‘‘L5-low common”, ‘‘L6-extremely non-common”.
Commonality is a transitional concept. Even if we put the evaluation object into one of the six common subintervals, it is not enough to accurately describe its common degree,because the subinterval also has a transition interval. Fuzzy mathematics is good at solving such transitional problems with unclear boundaries.So,we use fuzzy set theory to establish the evaluation method of civil aircraft commonality index. The solution of fuzzy theory is to set a membership function for each set, which is used to express the degree that the elements in the universe belong to the set.In this way,we can quantify the characteristic attribute of the evaluation object as a numerical value, and substitute it into the membership function of each common sub interval.Then the membership value of each common sub interval can be used as the final evaluation result of the evaluation object.
As revealed from the definition of commonality,the degree of commonality of two civil aircraft indicates the degree of similarity in parts, process, technology, interface, infrastructure, and other aspects of the two aircraft. Accordingly, we take the absolute value of the difference of some characteristic parameters of the two aircraft as the explicit expression of commonality. In order to deeply evaluate the commonness of the model, we refer to the division method of aircraft ATA (Air Transport Association) chapters to establish the commonality index evaluation system. Considering that it is difficult to obtain and quantify some characteristics of civil aircraft, we selected some parameters that describe aircraft performance, appearance characteristics, takeoff and landing quality to establish a multi-layer common index evaluation model.
In this system, the commonality index of aircraft is composed of attribute commonality (A) and structure commonality(B).We select the following parameters to describe attribute commonality: maximum speed (A1), cruise speed (A2), empty weight (A3), maximum take-off weight (A4), maximum landing weight (A5), maximum commercial load (A6), take-off field length (A7), landing field length (A8), maximum range(A9), maximum flying altitude (A10), takeoff noise (A11). In the section of aircraft ATA, we select the subsystems to describe the structural commonality of civil aircraft: power system(B1),fuselage system(B2),wing system(B3)and undercarriage system(B4).The commonality of subsystems is determined by the performance parameters of each subsystem. The performance parameters of the power subsystem are: maximum thrust of single engine (B1-1), the number of engines(B1-2), the engine model (B1-3), and fuel capacity (B1-4).The performance parameters of the fuselage subsystem are:fuselage length (B2-1), fuselage height (B2-2), maximum passenger capacity (B2-3), and crew number (B2-4). The performance parameters of the wing subsystem are: wingspan (B3-1), wing area (B3-2), aspect ratio (B3-3). The performance parameters of the wing subsystem are: layout style (B4-1),main wheel spacing (B4-2), front and rear track (B4-3), and number of main wheels (B4-4). The common index parameter diagram is shown in Fig. 3.
The parameters in Fig. 3 are quantifiable except for engine type and undercarriage layout. After the parameter values of the two civil aircraft models are obtained, they are standardized according to Eq. (1). Lastly, the absolute value of the standardized parameter value difference between the two civil aircraft models is used as the model enter.

Where, brepresents the original parameter value, and srepresents the dimensionless number after standardization, n represents the number of civil aircraft for the collected parameters
The engine model of aircraft is not expressed in digital form,so we adopt the parameter definition formula as follows:

Where, srepresents the quantitative value of engine model.When two engines are manufactured by the same company, define E= 0, otherwise E= 1; when two engines are of the same series,define E=0,otherwise E=1;When two engines are exactly the same,E= 0, otherwise E= 1;αrepresents the similarity quantization coefficient,and the values of this paper are 0.5, 0.3, 0.2.
At present, there are three forms of aircraft landing gear layout,and they are not expressed in digital form,so we adopt the parameter definition formula as follows:

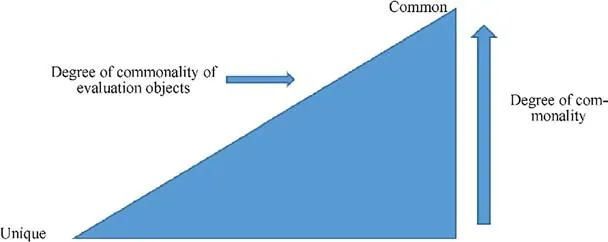
Fig. 1 Commonality gradient graph.
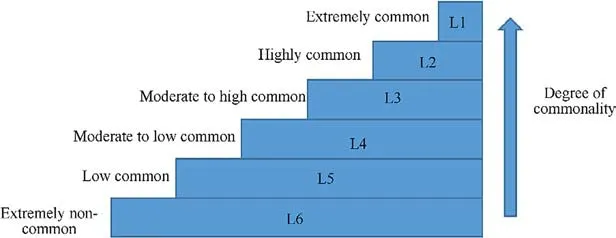
Fig. 2 Commonality subinterval partition graph.
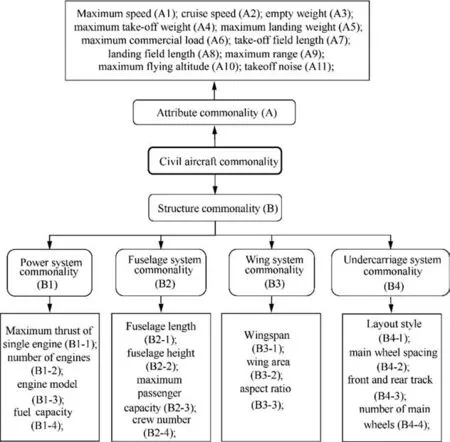
Fig. 3 Common index parameter diagram of civil aircraft.
Where, srepresents the dimensionless data after quantification. When the layout of two undercarriages are multi support point type and rear three-point type respectively,define U= 1, otherwise U= 0; when the layout of two undercarriages are front three-point type and rear three-point type respectively, define U= 1, otherwise U= 0; when the layout of two undercarriages are multi support point type and front three-point type respectively, define U= 1, otherwise U= 0;αrepresents the similarity quantization coefficient,and the values of this paper are 0.6, 0.6, 0.3.
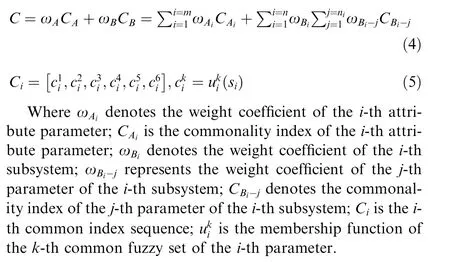
The commonality of the whole assessment object involves the degree of commonality of the characteristic attributes of the whole system and that of the system structure, while the latter is composed of the degree of the commonality of the characteristic attribute parameters of the corresponding system. By conducting the Analytic Hierarchy Process (AHP),the weight coefficient of the respective factor is determined,thus forming the whole common assessment index system.The weight coefficient of each factor is shown in Table 1.The whole aircraft is assumed to have m attribute parameters and n subsystems.Subsystem i has nattribute parameters,and the commonality index of the whole aircraft is as follows:
2.2. Determination method of membership function based on fuzzy set
Next, we extend the three-division method,a method of obtaining membership function of fuzzy sets, to the sixdivision method to obtain the membership function uof six common subintervals (L1-L6) of each characteristic parameter.
According to the idea of three-division method, the membership function is transformed from the probability distribution function of the boundary number between fuzzy sets, so we first design the fuzzy experiment to obtain the probability distribution of the 5 boundary numbers (β,β,β,β,β)between the 6 common fuzzy sets of each parameter.
In the single fuzzy experiment,there are 6 civil aircraft samples chosen randomly from the database and 15 groups of estimated objects by pairing. The absolute value of parameter difference of each civil aircrafts Δs is the dominant expression of the parameter commonality. The closer the difference is to zero, the more common the two aircraft models are in this parameter; the farther away the difference is from zero, the more common the two aircraft models are in this parameter.Thus,the absolute values of 15 groups of characteristic parameter differences are arranged as Δs≤Δs≤···≤Δs≤Δs.The boundary numbers defined by this fuzzy experiment are expressed as:

different boundary numbers obeying normal distribution will be established form every experiment. After many experiments, the normal distribution parameters of every boundary number can be expressed as:
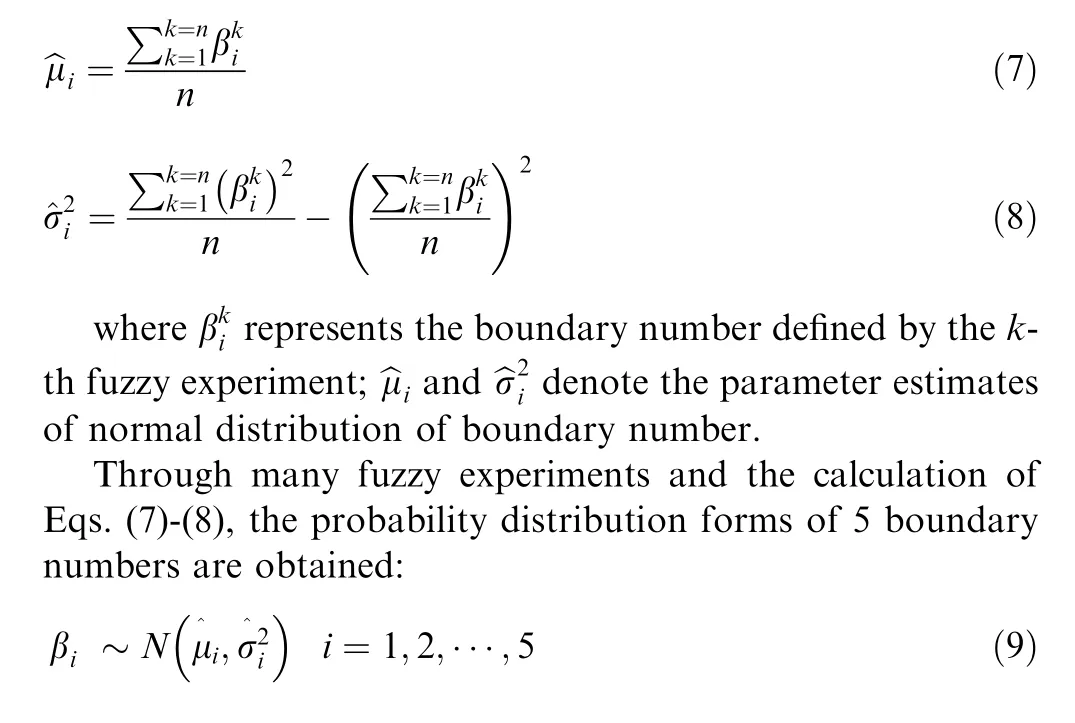
According to the relationship between boundary number and fuzzy set, the mapping relationship between element and set is as follows:

where, N is the number of fuzzy sets, and the value of this paper is 6.
According to the mapping relationship and the distribution of boundary numbers, the membership functions of 6 fuzzy sets can be deduced as:
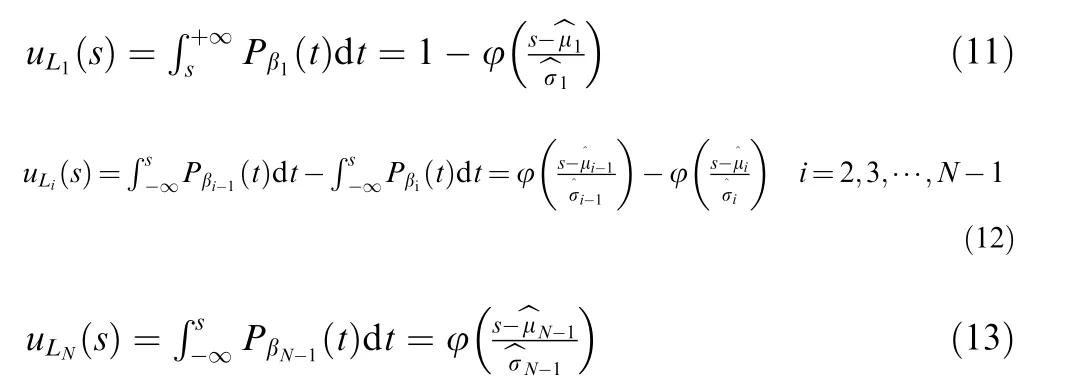
where, φ(x ) represents the standard normal distribution.
The following Table 2 shows the membership functions of 6 standard fuzzy sets of all levels of attribute parameters using the above method. In this way, the parameters of the evaluation object can be substituted into the membership function of each attribute parameter in each index system to obtain the results of the commonality assessment.
After collecting the attribute parameters of some civil aircraft models, we calculate the commonality index among civil aircraft models according to Eqs. (4) and (5). The method is:substituting the parameter differences of the aircraft type attributes into their respective membership functions to obtain commonality index at the component, system, and aircraft level, and use the weighted sum form to aggregate the component level and system level commonality index to the aircraft level to obtain the final general index. Table 3 shows the evaluation results of several sample models according to this index model.
3. Research on cost estimation model of civil aircraft R&D cost
The most intuitive benefit of commonality of civil aircraft series refers to the impact on life cycle cost, among which the impact on R&D cost is recognized to be the largest. The high commonality among the series of civil aircraft indicates that there is a high level of technology inheritance and resourcesharing among the aircraft types,which significantly lowers the R&D cost of the later developed models.To analyze the relationship between the degree of commonality and R&D cost reduction,the present study first studies the R&D cost estimation model of civil aircraft and subsequently introduces the theory and comprehensive application of MIT(Massachusetts Institute of Technology) model and RAND (RAND Company) model.

Table 1 Weight coefficient table in three level common index system of civil aircraft.
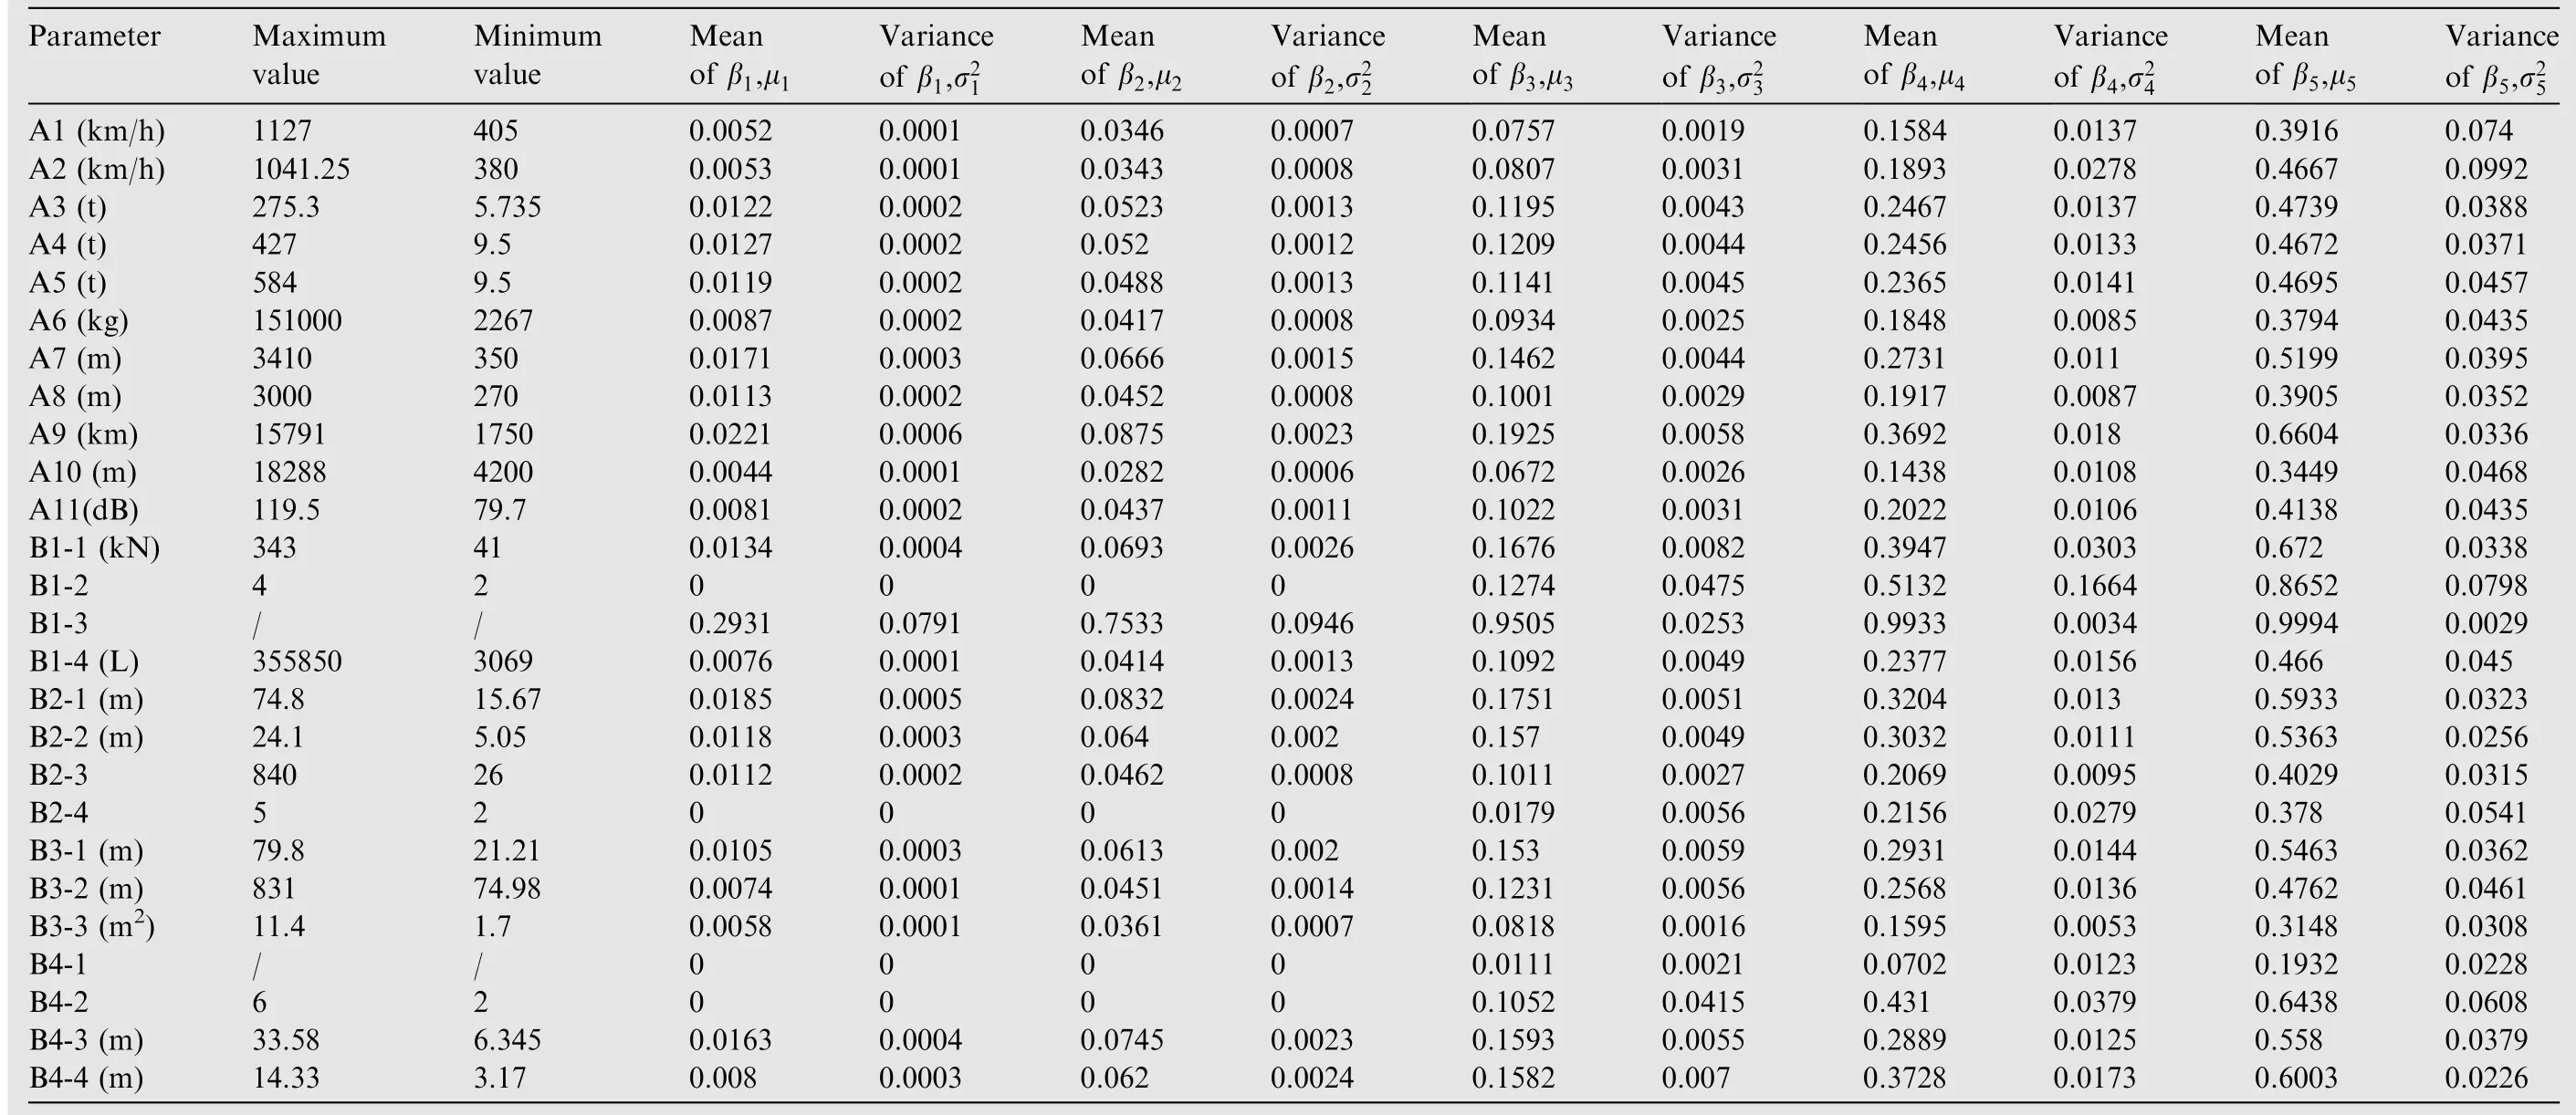
Table 2 Parameter table on normal distribution of each boundary number obtained by fuzzy experiment.
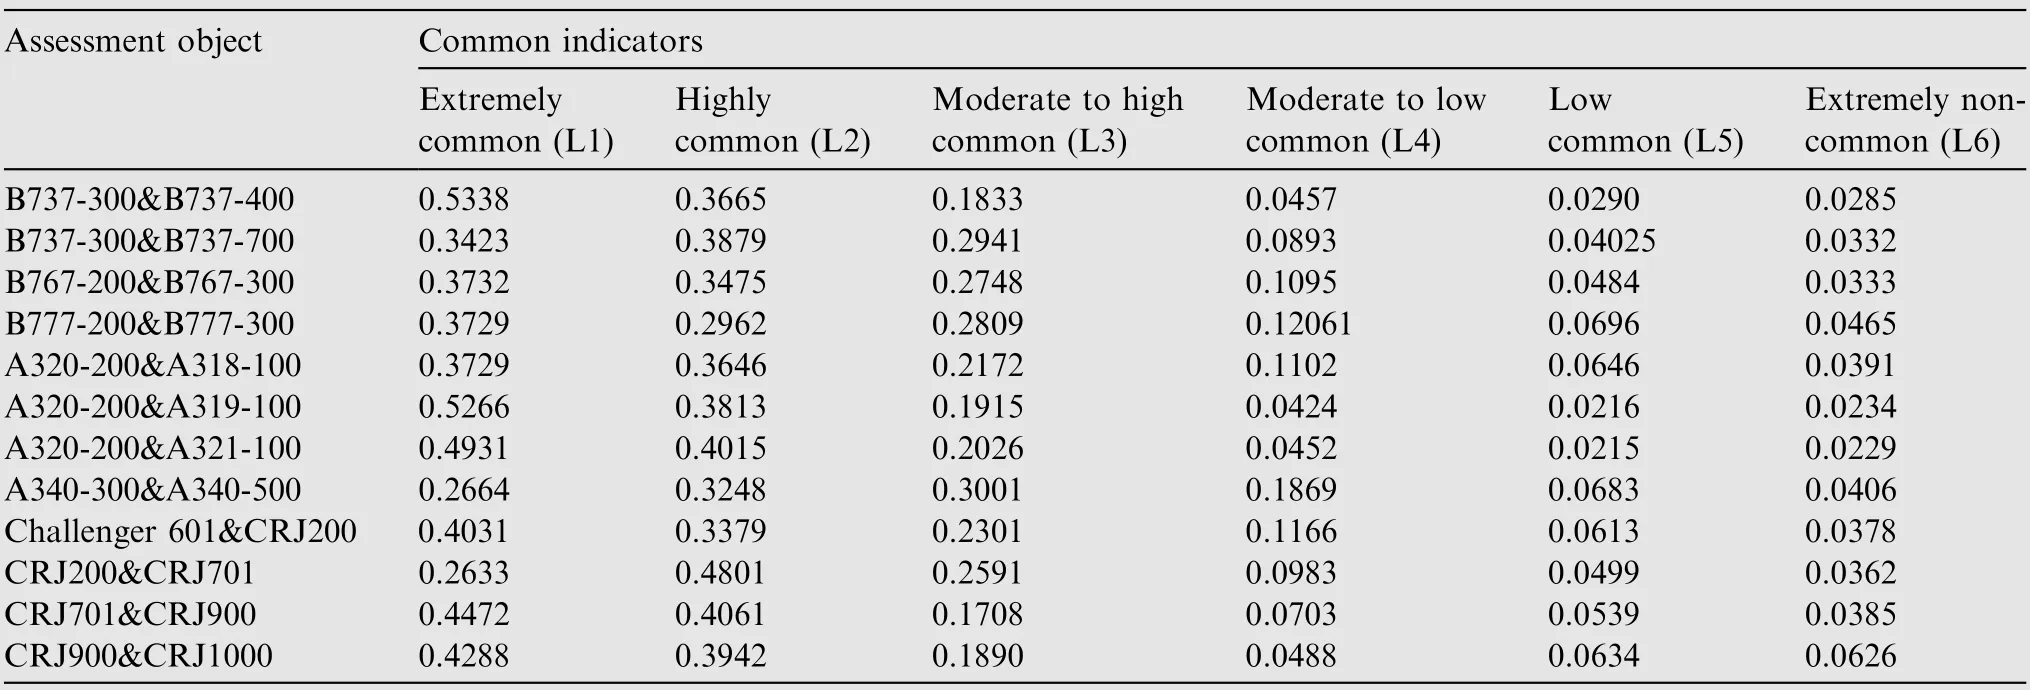
Table 3 Assessment results of commonality among typical civil aircraft types.
3.1. MIT model
Karen Willcox and Jacob Markish of the aerospace computing and Design Laboratory at MIT proposed a cost analysis method for aircraft development,termed as the ‘‘MIT model”. By conducting the statistical analysis on the actual R&D cost of some commercial jet aircraft in service, the R&D cost of the whole aircraft falls into various structural components and cost units,and the non-repetitive cost per unit weight of each module is determined to calculate the R&D cost of the whole aircraft.
The MIT model assumes that the R&D cost of an aircraft is directly proportional to the basic air weight of the aircraft(the‘‘basic empty weight” defined as the weight of the aircraft’s used empty weight minus the weight of the used project). This is because the design weight of the aircraft acts as an important technical parameter associated with the basic performance of the aircraft (e.g., commercial load, range, speed, take-off, as well as landing capacity),which is the only technical parameter associated with all aircraft components as well.
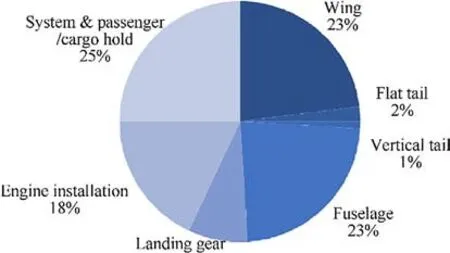
Fig. 4 Commercial aircraft weight decomposition.22,28
Next, the aircraft falls to several cost modules by group /component. The present study decomposes the weight and R&D cost of the aircraft by complying with the first level,i.e.,the aircraft weight and R&D cost are split into seven modules, i.e., wing, tail, fuselage, landing gear, engine installation,system, as well as passenger / cargo hold. By referencing the data of MD-80, DC-10-30, B737-200, B747-100, A300-b2 and other aircraft data, the weight and R&D cost percentage of each component are determined (Figs. 4and 5).
Subsequently,the R&D costs are allocated to different specialties according to different parts. In addition, the major of design is split into the following five categories:
(1) Engineering design which consists of overall definition and configuration control, body design and analysis and system integration;
(2) Manufacturing Engineering (e.g., manufacturing process, procedure, and measurement method);
(3) Tooling design: tool and frame design;
(4) Tooling manufacturing: tool and frame manufacturing;
(5) Support: R&D support and flight test verification.
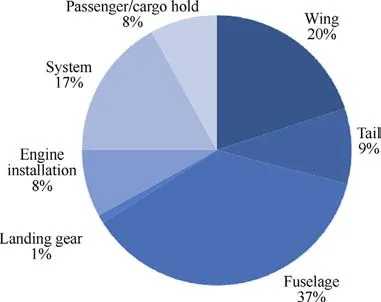
Fig. 5 Commercial aircraft R&D costs broken down by component.22,28
The data listed in Table 4are acquired after the R&D cost is distributed proportionally. The unit is $/lb; the time is 2002.
With reference to the mentioned decomposition method,the equation to calculate the total R&D cost of the aircraft is set as:

where Cis the total aircraft R&D cost;I is the total number of professional decompositions,being 5 here;J is the total number of parts, being 7 here; mis weight of the j-th component;Cis the R&D cost per unit weight of the j-th component in the i-th specialty.
3.2. RAND model
RAND model was published by famous RAND Company in 1987, as established for aircraft R&D cost estimation model(DAPCA Ⅳ).The model develops the relationship between the R&D cost and the main design parameters of the aircraft. The model covers various aircraft types including fighter, bomber and transport aircraft, which applies to the calculation of R&D cost at the initial phase of project development.
The input parameters of RAND model involve the aircraft air load W(lb), maximum speed V (knots), number of test flight aircraft Q (usually 2-6), number of engines N, maximum thrust of engine T(lb), maximum Mach number m of engine Ma, as well as inlet temperature of turbine T(°R).The equation for calculating the cost of development is presented below:
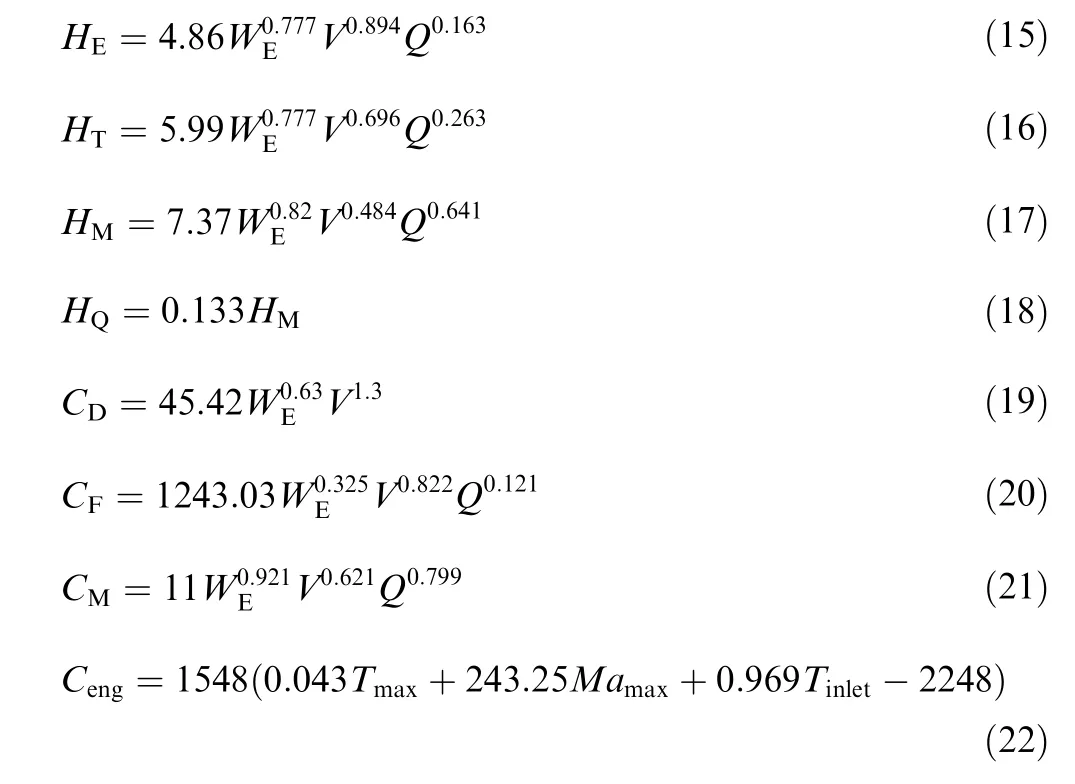

The symbols in the equation have the following meanings:
H: Man hours of engineering R&D, which involves the time consumed in the research, analysis, design, assessment and optimization of the fuselage, system integration and project management.H: Man hours of assembly, consisting of the man hours spent in planning, designing, manufacturing,assembling, installing, modifying, repairing, reworking, NC(Numerical Control) programming of assembly jig, tools, fixtures,molds,profiling tools,measuring tools,operating equipment, testing and calibration equipment, as well as tooling support at the production phase. H: Man hours of aircraft manufacturing, including the time consumed by the molding,machining, assembly and purchasing of the main structure of the aircraft. H: Man hours of quality control, which refers to the time consumed to ensure that the required standards are met. C: R&D support costs, which involves the labor and material costs of prototype, model, iron bird and structural test piece. C: Demonstrate the cost of flight test, which consists of the cost of engineering plan, flight test equipment,flight test execution, fuel and lubricating oil, data processing,equipment leasing and pilot salary. C: The cost of manufacturing materials and purchasing equipment.C: Cost of engine production. C: Procurement cost of avionics equipment. R: The hourly rate of engineering design. R:The hourly rate of tooling design and manufacturing. R:The hourly rate of manufacturing aircraft.R:The hourly rate of quality control. The hourly rate in RAND model refers to the total hourly rate (e.g., wages, employee benefits, indirect costs, and administrative costs). Here the hourly rate value in 1986 is set: R=59.1$/h, R=60.7$/h, R=50.1$/h,R=55.4$/h. When the model is applied, the effect of inflation should be considered,and the hourly rate and related purchase cost should be regulated to the corresponding year. On the whole, the change of consumer price index is considered the correction factor of hourly rate and purchase cost.
3.3. Adjustment and analysis on R&D cost estimation model
In the present study,the MIT model and the RAND model are used to estimate the R&D cost of the models involved in Table 3. Based on the revision of changes in the consumer index,the estimated and true values of the two models are regulated to compare values in 1986. In addition, the aircraft types are split into basic and derivative models. The basic model refers to the final aircraft model developed by the designer and manufacturer without the foundation and tech-nology accumulation of similar models before the development of the model; the derivative model refers to the novel model built by the similar R&D foundation and technology accumulation before the development of the model, or even by the identical R&D team on the basis of the original model. The calculated results of the basic model are listed in Table 5 and those of the derivative model are presented in Table 6 (Unit:$100 million). The actual R&D cost value of civil aircraft comes from the ‘‘World Civil Aircraft Manual” edited by Zhang and Lin.The combined estimates in the table are a combination of coefficients based on the estimating errors of the MIT model and the RAND model.The combination coefficient is calculated by the least square method based on the prediction errors of the two models for the civil aircraft in the case.

Table 4 Detailed breakdown of commercial aircraft R&D costs.22,28

Where Cdenotes the combined estimate; Crepresents the MIT model estimate; Cis the RAND estimate.
As revealed from the estimates shown in Figs. 6 and 7,specific to basic models, the estimates of the MIT model are overall larger than the actual values,exhibiting an average relative error of 18%.On the whole,the estimates of the RAND model are smaller than the actual values with an average relative error of 25%.The combined estimates neutralize the deviation directions of the two models, reducing the average relative error to 12%. For the derivative models, however,regardless of whether the MIT model or the RAND model is applied, the estimated values are noticeably greater than the actual values, and the average relative error of the combination estimated results reaches 360%.Thus,it can be considered that the two estimation models apply to the basic models and are not suitable for the derivative models.
As indicated from the mentioned results, the assumptions of the MIT model and the RAND model are that the model is developed and manufactured entirely by the designer and manufacturer independently, ignoring whether the model has technology inheritance at the R&D phase. It is therefore suggested that the two models ignore the degree of commonality between the estimated model and the company’s existing models, making the model unsuitable for derivative models. Notably, the actual R&D cost of the derivative model is significantly lower than that estimated by the model. This study considers the reason is that the derivative model has a high degree of commonality with the corresponding basic model, the designer and manufacturer can adopt considerable experience and methods in the development of the basic model when developing the derivative model, avoiding many unnecessary costs and time consumption. The existence of basic model test data can significantly down-regulate the number of test validations during the development of derivatives. Furthermore, the design of systems and components between derivatives and basic models is highly consistent, so the material resources of basic models can be reused to down-regulate R&D costs.
4. R&D cost estimation model considering commonality based on BP network algorithm
Given the discussion and analysis in the third section,when the estimated aircraft model exhibits commonality with the manufacturer’s existing basic model, the MIT and RAND estimation model is no longer applicable, since the existence of commonality significantly lowers the development cost.In this part, the impact of commonality on aircraft R&D cost will be discussed and quantified. The method adopted is to establish the relationship between commonality index and R&D cost reduction. For this kind of uncertain mapping relationship,the traditional calculation method cannot solve it. However,BP neural network algorithm has the function of realizing any complex nonlinear mapping, which makes it particularly suitable for solving problems with complex internal mechanism. Therefore, this section will establish the model based on BP neural network algorithm.
4.1. Research on the quantitative method of the impact of commonality on civil aircraft R&D cost
In the second section,a common assessment index is proposed based on similarity of machine attribute parameters.The membership of six common sub intervals acts as the quantitative value of the commonality degree of the model to be assessed.This study suggests that the method of coefficient combination estimation of MIT model and RAND model does not apply to derivative aircraft. However, it can effectively estimate the R&D cost of basic aircraft, and the average error of sample estimation is less than 10%. Accordingly, the R&D cost of the derivative model is assumed to be close to the result of the combined estimation model without the effect of commonality. Subsequently, the quantitative value of the impact of commonality on the development cost refers to the difference between the estimated value of the combined model and the actual value.


Table 5 Comparison of R&D cost estimates for basic models.

Table 6 Comparison of R&D cost estimates for derivative models.
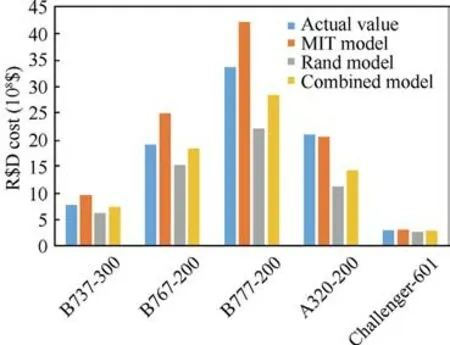
Fig.6 Comparison chart of basic commercial aircraft R&D cost estimation.
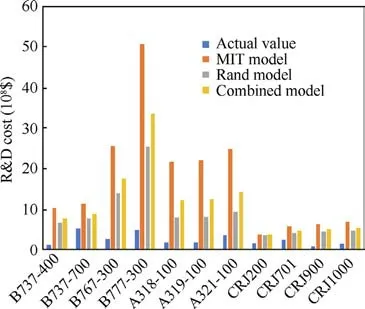
Fig.7 Comparison chart of derivative commercial aircraft R&D cost estimation.

Where Cdenotes the combined estimated result; Crepresents the actual R&D cost; R is the proportion of R&D cost reduction due to commonality.
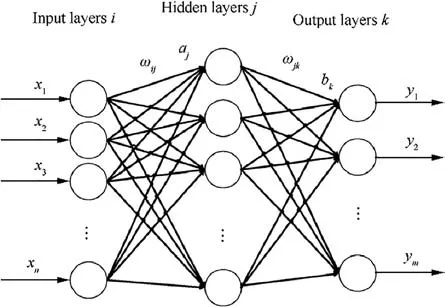
Fig. 8 Structure diagram of BP neural network.
The next step is to construct the relationship between the commonality index and the R&D cost reduction proportion.Obviously, no direct relationship is identified between the two. However, through the analysis on the development, this study suggests that the higher the degree of commonality,the more significantly the development cost will be reduced.When the derivative model and the basic model are overall common, the R&D cost is only the manufacturing cost of test flight aircraft. Thus, it is certain that there is a positive correlation between the common degree and the R&D cost reduction proportion, whereas there is no theory and data to support their relationship can be expressed by a specific function. In this scenario, neural network algorithm is adopted here to obtain the relationship between them.
4.2. BP network algorithm
Back propagation neural network (BP neural network) refers to a multilayer forward neural network based on error backpropagation algorithm. It was proposed by Rumelhart et al.in 1986.It essentially implements a mapping function from input to output. The three-layer neural network (shown in Fig.8) is capable of approaching any nonlinear continuous function with arbitrary precision and solving some complex nonlinear problems, as proved according to mathematical theory.For the mentioned reason,BP neural network involves broad applications.
The basic principle of BP network can fall to signal forward propagation and error reverse propagation. The former is the process of information feedback and update layer by layer.As shown in Fig.8,after the neural units in the input layer acquire the information transmitted from outside, they transmit it to the network layer responsible for the internal information processing and conversion, i.e., the hidden layer. Then, the information converted from hidden layer is transmitted to output layer, and the output result is lastly formed by the neural unit of output layer. The latter refers to the process of modifying the weights and thresholds of each layer. If the error between the actual and expected results of the output layer does not reach the set allowable range, the absolute error will be transmitted in a specific mode according to the output layer hidden layer input layer. During the reverse transmission, the error information of the neural unit is acquired, which acts as the basis to adjust and modify the connection weights of each layer. When the two stages complete each learning iteration,whether the absolute error meets the set allowable range is determined; otherwise, the two processes are fed back repeatedly.
The specific process of BP network algorithm is presented below:
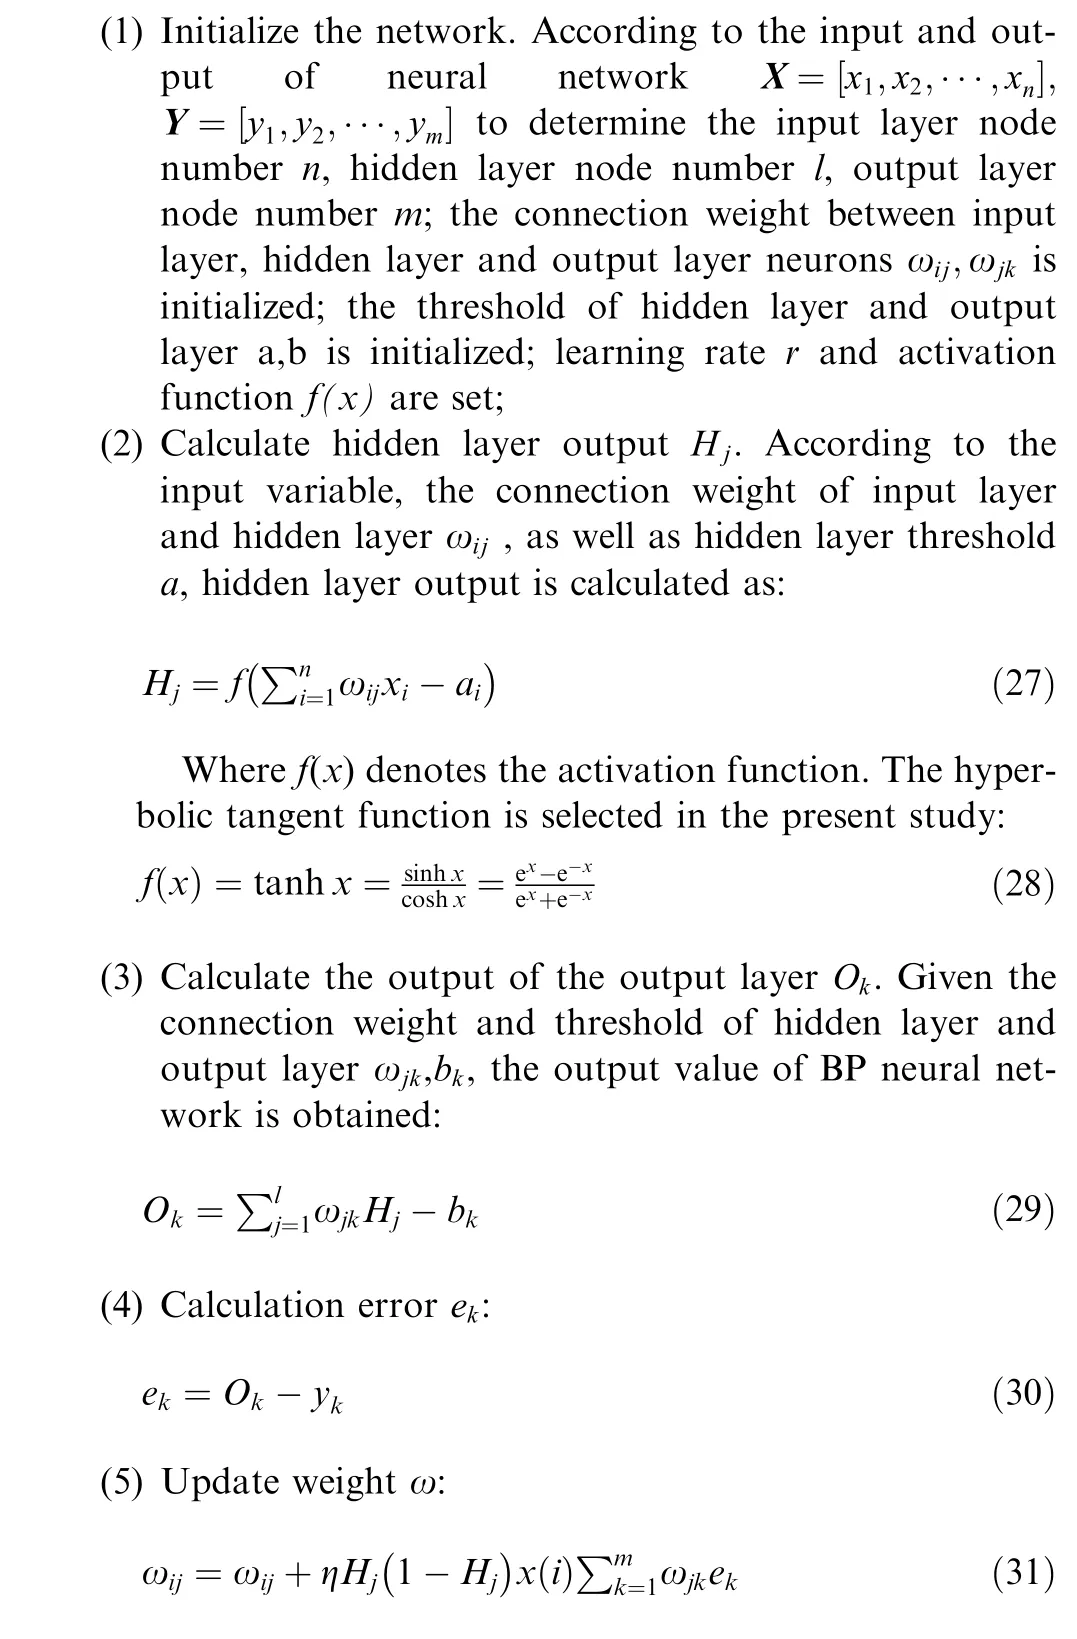

Where η denotes the learning rate.
(6) Update threshold a,b:

(7) Determine whether the error satisfies the requirements;if so, stop the iteration; otherwise, return to step (2).
4.3. Establishment of R&D cost estimation model and analysis on calculated results
With the modeling method of BP neural network model, the input layer of the network is set up with 6 neurons;the output layer covers 1 neuron;the hidden layer has 5 neurons;the activation function is hyperbolic tangent function. The common index of 10 samples in Table 3 acts as the input and their R&D cost reduction proportion as the output value to train the network, and 2 samples is adopted to test the network.The well-trained grid parameters are listed in Table 7.
Among the sample models presented in Table 8,the former refers to the basic model, and the latter represents its corresponding derivative model. The commonality index indicates the quantitative value of commonality between the two models calculated by the method in the second subsection. Cost 1 refers to the actual R&D cost (1986 value) of the derivative model, and cost 2 is the R&D cost (1986 value) estimated by the combination of MIT model and RAND model. Rrepresents the actual R&D cost reduction proportion, and Ris the reduction proportion calculated by BP neural network.The first 10 samples are training samples, and the last 2 samples represent prediction samples.
As revealed from Eqs. (25) and (26), the estimated R&D cost of the derivatives is presented as:

Where Cdenotes the estimated cost of the derivative;Crepresents the calculated results of the combination estimation model of the derivative aircraft;R represents the R&D cost reduction proportion caused by commonality, as calculated by using well-trained BP neural network.
The estimated R&D cost of the derivative aircraft model in Fig. 9 is calculated by the method presented in the present study. First, the commonality index between the derivative model and its corresponding basic model is calculated. Next,it is inputted into the well-trained neural network to calculate the decrease rate of the R&D cost of the derivative model.Lastly, the R&D cost of the derivative model is estimated by Eq.(35).The R&D cost estimates for the derivatives presented in Fig. 10 originate from a combination of the coefficients of the Massachusetts model and the RAND model. The average relative error of the derivative R&D cost estimation model considering commonality reaches 10%,while the average relative error of the derivative model coefficient combination estimation model without commonality is up to 304%. Notably,the estimation accuracy of the built estimation model considering commonality is ten times higher than that of the existingestimation model for derivatives,thereby strongly demonstrating the superiority of this model to estimate the R&D cost of derivatives.

Table 7 Parameter table of neural network model.

Table 8 Sample R&D cost estimated results display table.
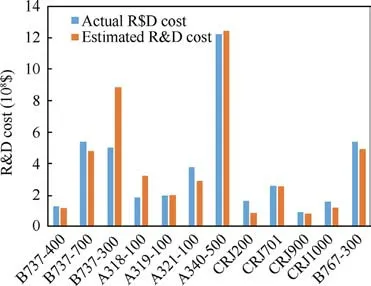
Fig.9 Comparison of actual value and estimated value of R&D cost of derivative models considering commonality.
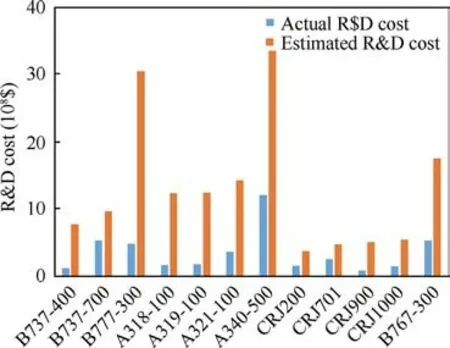
Fig. 10 Comparison of actual value and estimated value of R&D cost of derivative models without considering commonality.
5. Conclusions
After considering the impact of the commonality of the serialized civil aircraft,this paper uses the BP algorithm to establish a civil aircraft R&D cost estimation model, which improves the accuracy of the R&D cost estimation of derivative models.In the above research, we come to the following conclusions:
(1) Compared with the basic civil aircraft model, the R&D cost of the derivative civil aircraft model is significantly reduced under the existence of commonality,inheritance of data and technology and reuse of several resources.
(2) The MIT model and RAND model,estimating the R&D cost of civil aircraft,exhibit certain precision in estimating the basic model, whereas they are overall unsuitable for estimating the R&D cost of derivatives model, since they ignore the impact of commonality.
(3) The model proposed in the present study for estimating the R&D cost of derivatives model based on a new commonality index has high precision and can be used as a reference for initial decision-making of derivative aircraft model project.
(4) Through the analysis on this research, the commonality among civil aircraft series is found to significantly impact the life cycle cost of derivatives. Thus, scholars should stress the effect of commonality when conducting economic research on derivatives aircraft model.
The authors declare that they have no known competing financial interests or personal relationships that could have appeared to influence the work reported in this paper.
