Electrochemical behavior of Ti-6.5Al-2Zr-1Mo-1V alloy under rotating condition with periodically fluctuating current density
Zhiyuan REN, Dengyong WANG,*, Juhen ZHANG, Huayong LE,Di ZHU
a College of Mechanical and Electrical Engineering, Nanjing University of Aeronautics and Astronautics, Nanjing 210016, China
b Jiangsu Key Laboratory of Precision and Micro-Manufacturing Technology, Nanjing 210016, China
c School of Mechanical Engineering, Hefei University of Technology, Hefei 230009, China
KEYWORDS Dissolution;Electrochemical behavior;Passivation;Rotating condition;Ti-6.5Al-2Zr-1Mo-1V alloy
Abstract Titanium alloy plays a crucial role in the electrochemical field due to its excellent corrosion resistance.The passivation and dissolution behaviors of Ti-6.5Al-2Zr-1Mo-1V(TA15)alloy in NaCl solution were studied by simulating the electrochemical machining process in a rotating condition, which made the anode in a state with alternating high and low current density. Electron probe micro analysis,ultra-depth microscope, scanning electron microscope,and X-ray photoelectron spectrometer were used to reveal the evolution of TA15 under fluctuating current density.The existence state of the passivation film on TA15 surface was closely related to the pulse frequency of the periodically fluctuating current density.At higher pulse frequency of 0.20 Hz,the material was hardly dissolved because passivation dominated the electrolysis behavior, while at lower pulse frequency of 0.01 Hz,the passivation and dissolution behaviors occurred alternately with the variation of the current density.Herein,the thickness of the passivation film was inversely proportional to the applied current density.Due to the different electrochemical characteristics of α phase and β phase,the surface of the TA15 changed from being smooth to porous after a period. In addition, the change of microstructure affected the content of O2- and exposed the suboxides of titanium. In a word, the change of pulse frequency and current density affected the electrochemical behavior of TA15, which was different from the conventional steady condition.
1. Introduction
Titanium and its alloys are very important structural metals with excellent corrosion resistance,high temperature resistance and high specific strength.They undergo oxidation reactions in neutral or acidic electrolytes to form a stable,hard,corrosionresistant and permanent passivation film.Therefore,titanium and its alloys have been widely used in the aerospace and medical fields.
Many scholars have studied the passivation mechanism and electrochemical characteristics of titanium and its alloys.Birch and Burleighobtained different types of titanium oxide on the surface of metal titanium by thermal oxidizing,polishing,acidetching,and anodizing.Cui et al.prepared a titanium dioxide coating on biomedical β titanium alloy, and studied the influence of pre-anodization on the composition, morphology and electrochemical corrosion behavior of the passivation film.Klocke et al.conducted a basic study on the unpulsed electrochemical machinability of four typical γ-TiAl-based alloys and compared them with theoretical dissolution behavior according to Faraday’s law. Xu and Wang YDinvestigated the dissolution behavior and oxide passive layer formation of various titanium alloys in aqueous electrolytes.Dai et al.prepared Ti-6Al-4V alloy using Selective Laser Melting(SLM)technology,and found that the alloy exhibits different corrosion resistance due to different microstructures. Marino et al.studied the passivation film produced on titanium in acid phosphoric media solution independent of the electrolyte pH. Baehre et al.studied the dissolution behavior of titanium alloys in different electrolytes and concluded that titanium alloys generally obtain high corrosion efficiency in NaCl electrolyte because of the activity of chloride ions. The above researches showed that titanium alloys exhibited various electrochemical characteristics in different electrochemical situations. However,most of these studies were carried out under the condition that the workpiece is at rest.
Generating electrochemical machining is a unique electrochemical machining technology, which has been widely used to machine complex surfaces.Wang DY et al.processed thin-wall rotating parts with surface roughness Rbeing 0.2 μm by analyzing the balance gap in counter-rotating electrochemical machining. Kozak et al.achieved surface quality and production efficiency superior to profile grinding by analyzing electrolyte temperature, gas concentration and pressure distribution along inter-electrode gap and optimizing electrode and experimental parameters. Martin et al.studied the effect of current density on the width and depth of the grooves with continuous electrolytic free jet and obtained higher surface quality at high current density. Ge et al.proposed a general cylindrical electrode for electrochemical turning, and three differently shaped revolving structures were machined with a radial removal allowance of 10 mm.Miyoshi and Kuniedainvestigated the effect of pulse conditions on current efficiency and machining accuracy, and produced a micro rob of 36 μm in diameter and aspect ratio of 20. In the above studies, the anode workpiece is usually in a state of rotation, which causes the current density on the anode surface to change constantly. According to Liu et al.,this rotational state may make titanium alloys exhibit special electrochemical characteristics from the conventional stationary conditions. However, the passivation and dissolution behaviors of titanium alloys in the rotating conditions have been reported rarely.
In this paper,the electrochemical behavior of Ti-6.5Al-2Zr-1Mo-1V alloy (TA15) under rotating condition was focused on. TA15 is a near-α alloy with good high-temperature strength, thermal stability and welding performance.The equiaxed structure of TA15 is usually essential in those important part of complex structures, such as aircraft bulkhead and engine casing.The condition of cylindrical workpiece in rotation was also simulated, and a periodically fluctuating current density on the surface with alternating high and low pulse could be obtained.All experiments were carried out on the flat electrode electrolysis system. The elemental distributions of TA15 in different phases were determined by Electron Probe Micro Analysis (EPMA). The surface morphology evolution process of TA15 during electrochemical machining was analyzed by Scanning Electron Microscope (SEM) observation.X-ray Photoelectron Spectroscopy (XPS) was used to characterize the composition changes of the passivation film on TA15 at different moments in a cycle.
The purpose is to study the special electrochemical behavior of TA15 with alternating high and low current density. The obtained results are expected to gain a better understanding of the anodic dissolution mechanism of TA15 and to have significance for the improvement of the surface quality and machining accuracy during electrochemical machining of titanium alloys under the rotating conditions.
2. Experimental
2.1. Samples preparation
The material used in the test was TA15 with dimension of∅4×10 mm.SiC papers of 400,800,and 1000 grit were used to grind and polish the surface of each cylindrical sample.Distilled water was used for ultrasonic cleaning.The samples were stored in sealed vacuum package before the following electrochemical experiment.
During the preparation of the experiment,the TA15 sample was exposed to the air, which caused the sample to oxidize instantly in the air and produced a passivation film.Therefore,in order to simulate the situation of multiple processing cycles in actual industrial processing and eliminate the initial passivation film to avoid its impact on the subsequent experimental results, each sample was applied with a high current density of 80 A/cmfor 2 s. There is no time interval between each removal of the initial passivation film and the experiment.
2.2. Flat electrode electrolysis experiment system
Fig. 1 is the theoretical model of the cylindrical cathode tool and the anode workpiece, where the anode is in a rotating state. In this condition, the constant speed rotation of the cylindrical anode could make every point of the surface go through the same cycle in the process of approaching and being away from the minimum gap, and a set of alternating high and low current density parameters could be obtained.When the anode rotated, the current density at Point P was affected by the distribution of the current lines. The Point P rose from low current density state to high current density state, reached the peak value when rotating to the minimum gap, and then gradually decreased to low current state again.
Fig.2 shows the current density distribution on the cylindrical anode surface, where the current density of Point P corresponds to the position of Point P in Fig. 1. The parameters for the simulation of this current density waveform are given in Table 1. Afterwards, by setting current density parameters,the periodically fluctuating current density of different pulse frequencies and periods could be obtained.
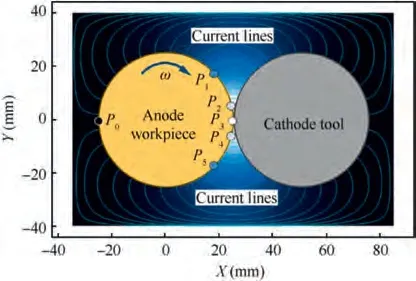
Fig. 1 Theoretical model of cylindrical cathode tool and anode workpiece.
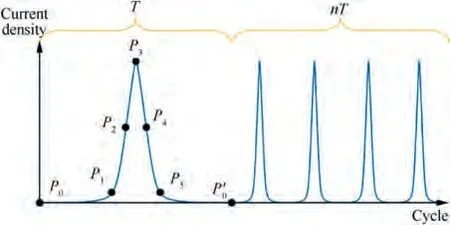
Fig. 2 Current density waveform at Point P on cylindrical anode.

Table 1 Simulation parameters of periodically fluctuating current density.
In order to study the electrochemical behavior of TA15 under the periodically fluctuating current density, a flat electrode electrolysis experiment system was built as shown in Fig. 3. The system included an electrolysis fixture, computer,programmable power supply, electrolyte filtration circulation system, and data logger. As shown in Fig. 4, the electrolysis fixture used in this system had a flat and narrow flow channel,and the cylindrical sample was embedded in the device,leaving one end surface exposed to the flow channel for the electrolytic reaction. Opposite the sample’s processing end face was the cathode. In electrochemical machining, the anode underwent an oxidation reaction to dissolve the material, while the cathode reacted with reduction and hydrogen evolution. Apart from this,the electrolyte filtration and circulation system could provide circulating electrolyte with a certain pressure for electrolytic processing. The data logger could display and record the current waveforms of electrolytic processing in real time.
2.3. Microstructure characterization
EPMA (JAX-8230) was used to study the elemental segregation of TA15 samples. Optical microscope with ultra-depth of field was used to observe the microscopic morphology and changing trends of the TA15 samples. Cold field emission SEM (Hitachi SU8020) was used to observe the microstructures and the contents of TA15 samples.
2.4. X-ray photoelectron spectroscopy
XPS spectra were collected by an electron spectrometer(ESCALAB250Xi).All spectra were excited by the monochromatic Al Kα line (1486.6 eV), and then scanned with 500 μm spot. All binding energies were referred to the Fermi level.The spectrometer was calibrated by C1s standard electron peak (284.8 eV).
To further estimate the peak intensity, Thermo Avantage V5.9918 software was employed to deconvolve the photoelectron peaks,which processed the signals by a least-squares trial and error procedure with mixed Gaussian/Lorentzian peaks.The background was subtracted using the Tougaard and Shirley method. Evaluation and analysis of different species were based on the standard peaks of the NIST standard reference database.
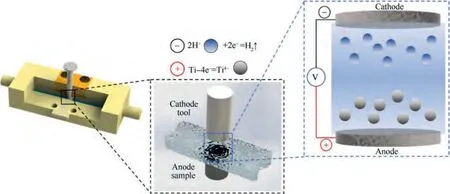
Fig. 4 Schematic diagram of flow field and electrolysis reaction in electrolysis fixture.
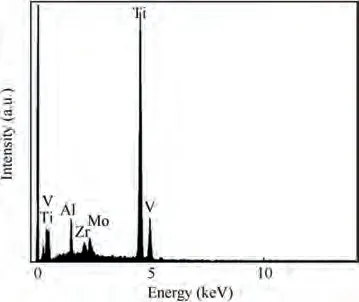
Fig.5 Elemental composition of initial surface of TA15 sample.
3. Results and discussion
3.1. Elements and characteristics of TA15
Fig.5 shows the elemental composition of the initial surface of TA15 sample, and the Ti, Mo, V, Al and Zr peaks can be clearly distinguished. Combined with the microstructure of the initial surface of the TA15 sample (Fig. 6(a)) and its XRay Diffraction(XRD)analysis pattern(Fig.7),it can be seen that the bimodal microstructure consists of primary α phase and the transformed β phase. Fig. 6(b)-(f) show the results of analyzing the elemental distribution of TA15 using EPMA mapping. The stable element Al is mainly distributed in the α phase, while the stable element Mo is mainly distributed in the β phase, and the element Zr and V are evenly distributed in both phases, as summarized in Table 2. It can be observed from the results that TA15 has micro-segregation which may cause special dissolution behavior.In Electrochemical Machining (ECM), the workpiece is usually applied with a high electrode potential, so the processing follows Faraday’s law,which makes the reaction process of different elements mainly affected by the current density. Therefore, according to Zhang,Guoand Chenet al.,the relationship between the electrochemical dissolution rate of different phases and the current density is
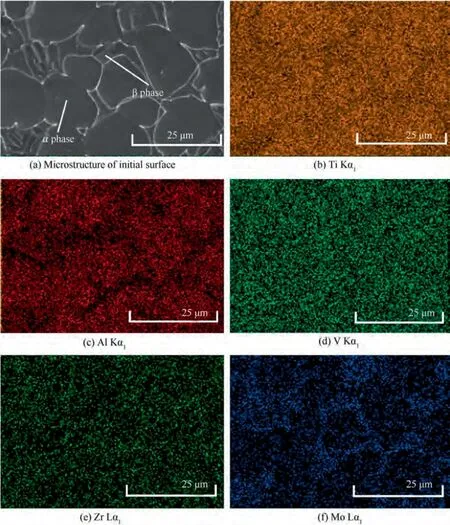
Fig. 6 Results of EPMA mapping analysis of TA15.
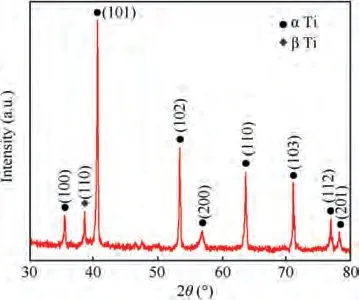
Fig. 7 XRD pattern of TA15.

Table 2 Main elements in α phase and β phase of TA15.

where V is the electrochemical dissolution rate;j is the current density; M is the molar mass of the anode material; n is the number of electrons involved in the electrochemical reaction;F is the Faraday constant;k is a constant related to the current density.Based on the study of elemental distribution of TA15,the electrochemical dissolution rates of α phase and β phase are calculated respectively. Before that, it is assumed that the metal on the anode surface is only dissolved with determined valence of electrons. As Ti, V and Zr are evenly distributed in the two phases, their effects on the electrochemical dissolution rates of the two phases are ignored. The stable element Al(3+) is mainly distributed in the α phase, and it is considered that V(α phase) ≈V(Al) = 3.330 k. The stable element Mo(6+) is distributed in the β phase, and the electrochemical dissolution rate of the β phase is V(β phase) ≈ V(Al) = 1.567 k. Therefore, it can be concluded that when TA15 is electrolytically processed at the same current density,the dissolution rate of α phase is higher than that of β phase.
3.2. Surface topography at different frequencies
The pulse frequency of the fluctuating current was defined as the reciprocal of the time for the Point P to rotate one turn on the anode(Fig.1).The current densities with different pulse frequencies were obtained by changing the single cycle time,and the effect of pulse frequency on the passivation and dissolution behaviors of TA15 was studied. The surface morphologies of samples after electrochemical machining for the same time (100 s) at frequencies of 0.50 Hz, 0.20 Hz, and 0.01 Hz are shown in Fig. 8. And the line roughness at the red line(see Fig. 8) of the sample surfaces was also measured. The measured length of 0.50 Hz and 0.01 Hz is 300 μm, and the measured length of 0.20 Hz is 600 μm due to its uneven distribution of the surface structure.
Fig. 8(a) shows the surface topography after electrolysis at 0.50 Hz frequency for 100 s.It can be observed that the surface of the sample is basically consistent with the initial surface,and there is almost no trace of corrosion. Its roughness Ris 0.69 μm (Fig. 9(a)). In particular, it is worth noting that the color of the whole sample surface has changed to blue. The color change can be attributed to the formation of a passivation film on the surface.
Fig. 8(b) shows the surface topography after electrolysis at 0.20 Hz frequency for 100 s.Selective dissolution occurs,many pits of different sizes appear, and some regions of the initial surface still remain. This selective dissolution is the main reason for the rough surface of the workpiece under macroscopic observation.Its roughness Ris as high as 22.53 μm(Fig.9(b)).
Fig. 8(c) shows the surface topography after electrolysis at 0.01 Hz frequency for 100 s. Uniform electrolytic corrosion trace can be observed on the surface. The roughness is 5.49 μm (Fig. 9(c)). The surface of the sample is no longer bright blue, but has metallic luster.
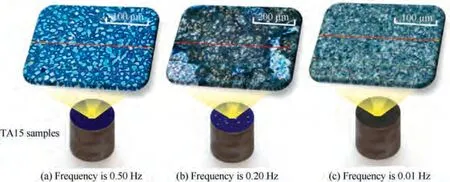
Fig. 8 Surface morphology of TA15 samples after electrochemical machining for 100 s at different frequencies.
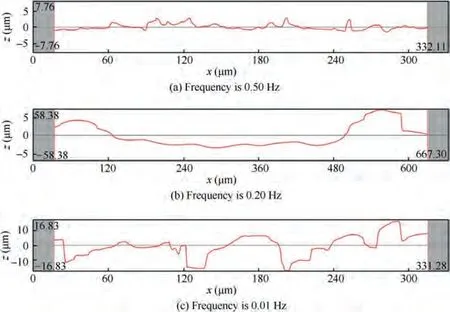
Fig. 9 Surface roughness of TA15 samples after electrochemical machining for 100 s at different frequencies.
According to Figs. 8 and 9, it can be conducted that the passivation and dissolution behaviors of TA15 are closely related to the pulse frequency of the periodically fluctuating current density.Under higher pulse frequency of 0.50 Hz,passivation dominates the electrochemical behavior, and the electrochemical dissolution of TA15 hardly occurs owing to the formation of passivation film. With the decrease of pulse frequency, dissolution occurs on the surface of TA15. When the frequency is 0.20 Hz,a poor surface morphology with selective dissolution is obtained. However, when the pulse frequency is further decreased to 0.01 Hz,the sample is uniformly dissolved and surface is smooth. In a word, current density with lower pulse frequency is more conducive to the dissolution of TA15 in a certain range.
3.3. Microstructure of passivation and dissolution process
In order to clearly characterize the morphology of TA15 and study its evolution regular pattern under different pulse frequencies, two different frequencies of 0.20 Hz and 0.01 Hz were selected for further study. According to the waveform characteristics of the current density signal, the small current density slowly rising node (Pof 2.0 A/cm), the current density rapid rising node (Pof 34.0 A/cm), the current density peak node(Pof 65.8 A/cm),the current density rapid falling node (Pof 34.0 A/cm) and the small current density slowly falling node (Pof 2.0 A/cm) were selected respectively(Fig. 10) to realize the evolution process.
Fig. 11 shows Leica images of TA15 electrolysis at a frequency of 0.20 Hz at different moments. It can be observed that the surfaces of TA15 from 1.90 s to 2.75 s (Fig. 11(a)-(d)) are almost the same with the initial surface shown in Fig. 6(a) except for the change of color. In 3.10-5.00 s(Fig. 11(e) and (f)), a small number of aggregated pits appear on the surface,but most areas on the surface still have no corrosion marks. If we continue to perform multi-cycle electrochemical machining at a frequency of 0.20 Hz, the sample will have a surface structure corresponding to that in Fig. 8(b)based on the cumulative effect.The passivation rate of titanium alloy is very fast,which often occurs in an instant,and it usually takes a certain time to break down the passivation film at high current density.The proportion of high current density in the waveforms at different frequencies is constant.Due to the short time of high current density in the waveform with higher pulse frequency, the passivation film formed instantly does not have enough time to break,and the material enters the passivation state again.Therefore,TA15 is always in the passivation stage when the pulse frequency is 0.20 Hz.Consequently, it is necessary to study the evolution process with a lower pulse frequency. The experiments are repeated 3 times to improve accuracy and reliability.
Figs.12 and 13 are Leica and SEM photographs of samples processed for one cycle(100 s)at a frequency of 0.01 Hz.It can be seen that the morphologies and microstructures of TA15 at different moments in a single cycle are significantly diverse with lower frequency of 0.01 Hz, which is considerably different from that in Fig.11.The surface of samples in Fig.12 dissolve uniformly rather than selectively,so there are no obvious local features, such as pitting corrosion. In addition, the surface colors of the samples have also changed dramatically.
Fig.13(a)shows the microstructure of the initial surface of TA15. Before processing, it can be observed that the α phase and the β phase have clear boundaries. Fig. 13(b) shows the microstructure of TA15 after electrochemical machining at frequency of 0.01 Hz for 38 s.The α phase corrodes and dissolves downward, so the clearer profiles of β phase can be observed.Fig. 13(c) and (d) show the microstructures at 45 s and 50 s respectively. The dissolution rate of TA15 increases with the increase of current density,and the corrosion degree of α phase and β phase of TA15 is obviously different. Under the same current density, the dissolution rate of α phase is higher than that of β phase, and the difference in dissolution rate may cause the part of β phase that dissolves slowly to detach from the surface of the material in the form of exfoliation. At 55 s and 62 s (Fig. 13(e) and (f)), the boundaries between α phase and β phase become blurred, and α phase dissolves and forms many holes, while β phase is protruding and dendritic, which makes the surface of TA15 become porous structure. Therefore,it can be concluded that under the lower pulse frequency of 0.01 Hz, between 0 s and 45 s, that is, the current density gradually increases from 0 to 34.0 A/cm,TA15 is mainly passivated with a small amount of dissolution, and there is no obvious difference in electrochemical characteristics between α phase and β phase. When the current density exceeds 34.0 A/cmbetween 45 s and 55 s, TA15 dissolves rapidly because the dissolution rate is higher than the passivation rate.At the same time, as the dissolution rate of α phase is higher than that of β phase,porous structure is formed.Finally,when the current density falls below 34.0 A/cmagain, the microstructure of TA15 no longer changes significantly, and passivation seems to occur again. In particular, the color of the surface of the samples changes from white to yellow, blue,etc., which is more noticeable in α phase (Fig. 12). The light path through the passivation film of different thickness will reflect different colors,so it is deduced that the change of the surface color of the material may be related to the thickness change of the generated passivation film.
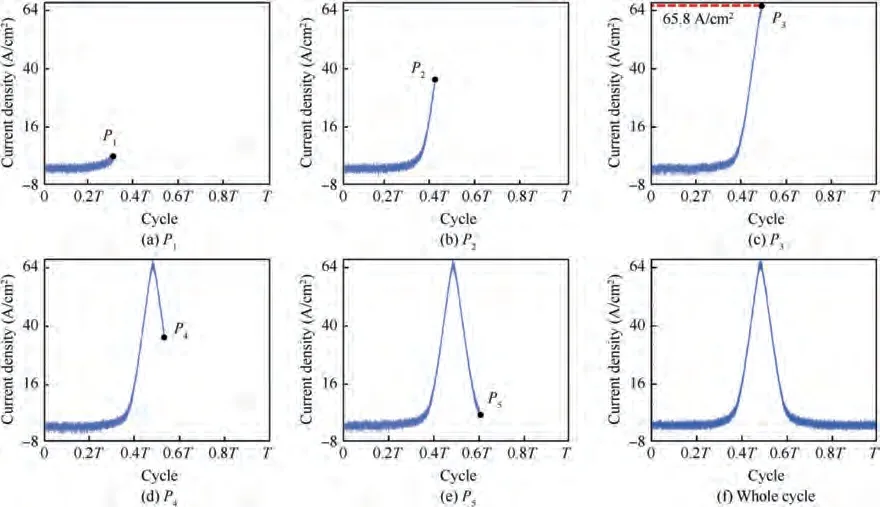
Fig. 10 Waveforms of pulse current density used in passivation and dissolution process of TA15 at different moments in a cycle.
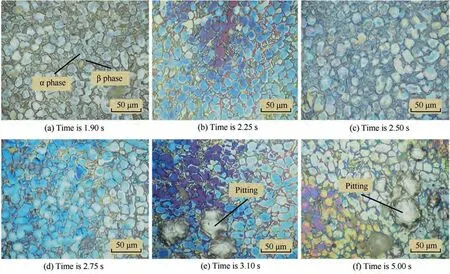
Fig. 11 Surface morphologies of TA15 at different moments in a cycle electrolyzed at 0.20 Hz.
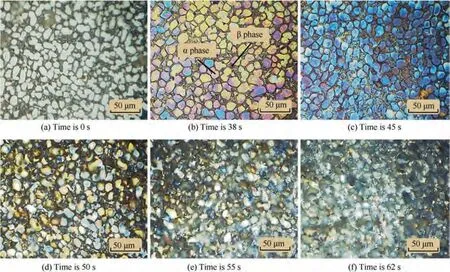
Fig. 12 Surface morphologies of TA15 at different moments in a cycle electrolyzed at 0.01 Hz.
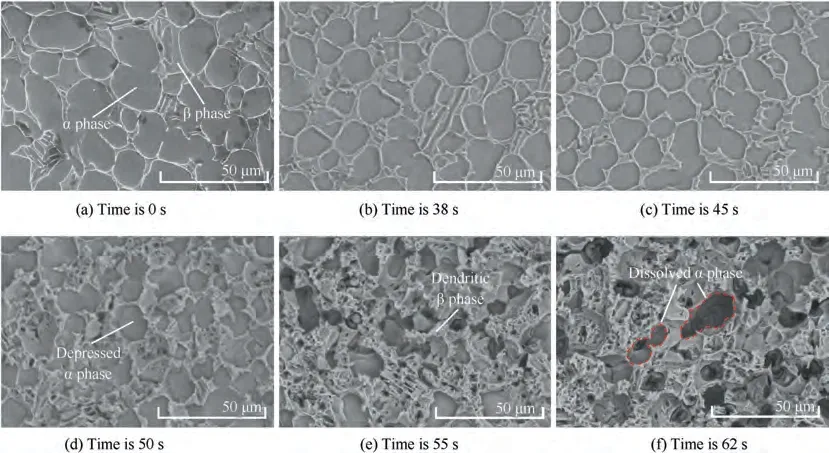
Fig. 13 SEM photographs of TA15 at different moments in a cycle electrolyzed at 0.01 Hz.
According to Figs.12 and 13,TA15 shows different behaviors of passivation, dissolution and re-passivation in one cycle at a lower pulse frequency of 0.01 Hz owing to the variation of the current density.In order to further characterize the formation and dissolution of passivation film, the elemental compositions of TA15 in different dissolution states (see Fig. 13(b)-(f)) were detected. Table 3 summarizes the semi-quantitative analysis of surface atomic percentages of TA15 samples using Energy Dispersive Spectrometer (EDS). As the electrolysis time progresses, the atomic percentage of Ti element on the surface of TA15 increases from 40.4 at%, reaches the highest value of 87.8 at% at 50 s, and then decreases to 66.0 at%.On the other hand,the atomic percentage change of O element is opposite to that of Ti atom,which decreases from 52.7 at%to less than 1.0 at%, then gradually increases and reaches 25.9 at%at 62 s.According to the change trends,it can be seen that the atomic percentage changes of Ti element and O element are closely related. During 0-38 s, the current density is low, and a passivation film dominated by TiOis rapidly formed on the surface of the samples.Therefore, the atomic percentage of O reaches the highest value, while the atomic percentage of Ti is at the lowest value. During 38-50 s, the current density increases sharply, and the formation rate of the passivation film is gradually lower than the dissolu-tion rate. Then, the ratio of the formation rate to the dissolution rate keeps decreasing, and reaches the peak at 50 s which is also the highest value of the current density.At this time,the peak corresponding to the O atom is almost non-existent, so the semi-quantity is less than 1.0at%. This indicates that the passivation film is almost removed and TA15 is in the state of high-speed dissolution at this time.During 50-62 s,the current density decreases sharply again, the formation rate of the passivation film gradually exceeds the dissolution rate,and the O atom percentage increases again. The percentage change trend of Ti atoms and O atoms during 62-100 s is consistent with that during 50-62 s.

Table 3 Compositions of surface layer of TA15 after electrochemical machining in NaCl solution at different moments at frequency of 0.01 Hz.
3.4. Chemical states of oxides in passivation film
To elucidate the surface chemical characteristics and further reveal the evolution process of TA15 under alternating high and low current density, XPS measurements were conducted on the samples. The survey spectra obtained from TA15 samples with XPS are shown in Fig. 14. For all 5 samples, Al, Zr,Mo,Ti,O and C peaks can be found.According to Fig.15,C peak is not detected in the 289-290 eV energy region, and it can be determined that there is no carbonate sample. Therefore,the C detected by XPS can be attributed to foreign pollution carbon.
Fig. 16 shows the XPS spectra of five samples of O1s.Table 4 summarizes the means ± standard deviation of the proportions for each component.Three peaks can be obtained from the XPS spectrum of O1s, which correspond to O,hydroxide or hydroxyl groups OH, and hydrate or bound water in this passive films. Among them, the presence of HO means that there is a certain percentage of bound water HO in the passivation film of TA15, while OHrepresents Ti(OH)and other electrolytic products, and Ois mainly TiOand other oxides, which indicates that the passivation film of TA15 is composed of many compounds,and these compounds coexist stably. With the increase of electrolysis time,the trend in proportion of HO decreases slightly, OHdecreases from 0.54 to 0.28, and Oincreases from 0.21 to 0.59.When a lower pulse frequency of 0.01 Hz is used for electrolysis for 38 s,the microstructure at this moment is shown in Fig.12(b),and the sample surface contains TiO,Ti(OH)and bound water at the same time, and the proportion of Ti(OH)and other hydroxides accounts for 54%. As the material continues to dissolve,part of the Ti(OH)leaves the surface of the material,and the content of Ti(OH)decreases.Then,the surface of samples become irregular and porous (Fig. 12(e), (f)),the area that can be covered by passivation film increases with the increase of specific surface area. As a result, the change in microstructure increases the proportion of TiOas the main component of the passivation film and reduces the proportion of Ti(OH).
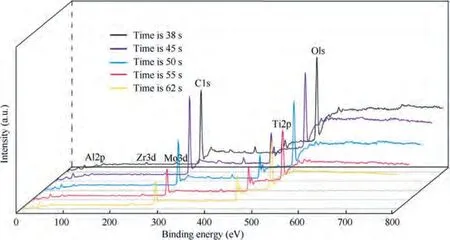
Fig. 14 XPS spectra of surface of TA15 at different moments at frequency of 0.01 Hz.
Fig. 17 shows the XPS spectrum of Ti2p. A set of double peaks of Tiions and double peaks of Tiions can be obtained by peak fitting, corresponding to TiOand TiOrespectively. Moreover, no metallic Ti is detected in the spectrum,indicating that the passivation film produced at this time has a certain thickness.According to the proportion of Ti ions summarized in Table 5, the proportion of Tidrops from almost 1.00 to 0.76, while the proportion of Tiincreases from 0 to 0.24. At 38 s, the surface of the sample is entirely TiOoxide, which indicates that TA15 is fully oxidized at a small current density,and a stable passivation film is obtained.As the electrolysis time progressed,a small amount of titanium suboxide TiObegan to appear, and its content continued to increase.The reason is that the dissolution behavior of TA15 is dominant at high current density.At this time,the dissolution rate of α phase is higher than that of β phase,and many small pits are generated,so that β phase forms the sidewall of the pit which makes the TiOon the sidewall exposed. From the change trends of TiOand TiOof TA15 samples, it can be concluded that the proportion of sub-oxides gradually increases with the increase of the dissolution depth, until all components become Ti metal matrix.
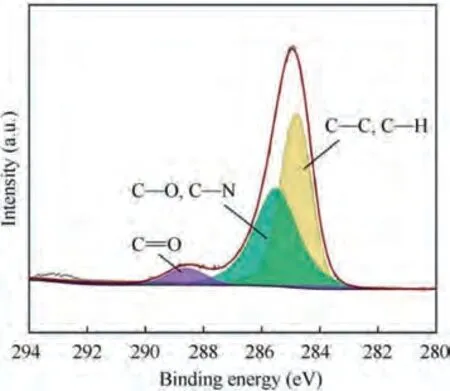
Fig.15 XPS spectrum of binding energy region of C1s electrons obtained from TA15 and their component peaks by deconvolution of peaks.
3.5. Qualitative passivation and dissolution model
Based on the Sections 3.3 and 3.4, a qualitative evolution model of TA15 under rotating condition with alternating high and low pulse was established.The surface compositions of the sample are mainly Ti,Al,V,Mo,and Zr.Under continuous low current density, a stable passivation film with a certain thickness is quickly formed on the surface of the sample,as shown in the blue part in Fig. 18(b). At this time, the main component of the passivation film is TiO.The reaction equation is given as

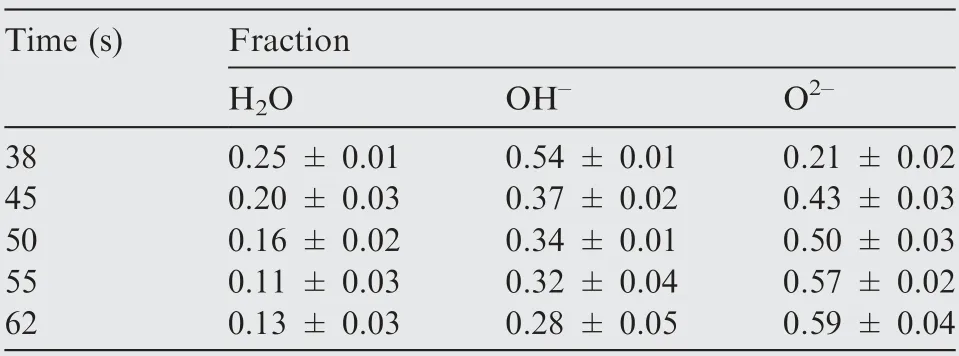
Table 4 Fractional parts of H2O, OH-, and O2- in surface oxide in TA15 alloy at different moments.
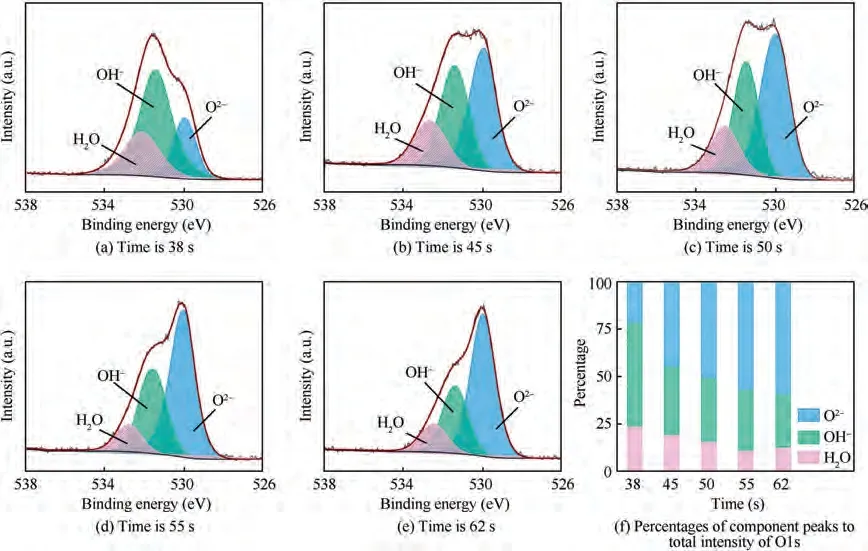
Fig. 16 Deconvoluted O1s XPS spectra at different moments of passivation film formed on titanium at 0.01 Hz and percentages of component peaks to total intensity of O1s.
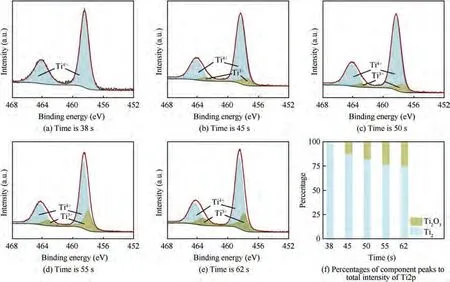
Fig. 17 Deconvoluted Ti2p XPS spectra at different moments of passivation film formed on titanium at 0.01 Hz and percentages of component peaks to total intensity of Ti2p.
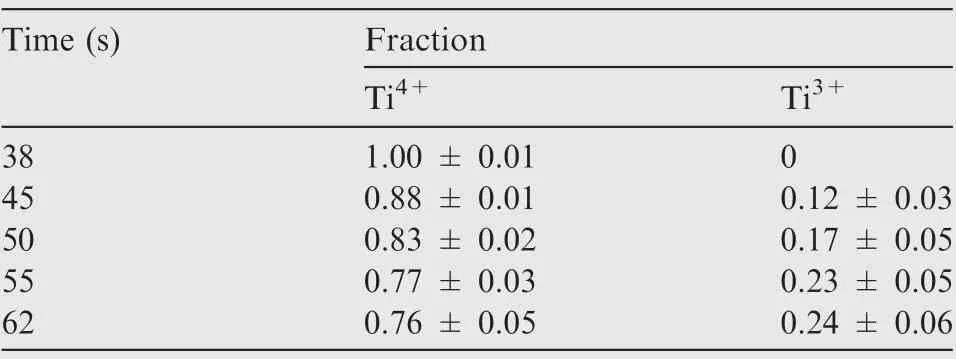
Table 5 Fractional parts of Ti4+and Ti3+in surface oxide in TA15 alloy at different moments.
The Ti element is completely oxidized to Ti,and the stepwise ion reactions are shown as

In Fig. 18(c), as the current density increases rapidly, the dissolution rate of the passivation film is higher than the generation rate, the thickness of the passivation film begins to decrease, and the surface oxygen content also begins to decrease. In Fig. 18(d), when the passivation film is broken,the material begins to dissolve quickly. The reaction equation is shown as

In Fig. 18(e), due to the difference in dissolution rates of α phase and β phase,α phase is recessed and the surface of TA15 becomes porous. It should be pointed out that Fig. 18(d) and(e)show a short process without passivation film,and at most of the time, the surface is covered by the passivation film. In Fig.18(f),when the current density drops sharply,the passivation film forms again. At the same time, part of the β phase with a higher degree of protrusion will fall off the surface of the material.
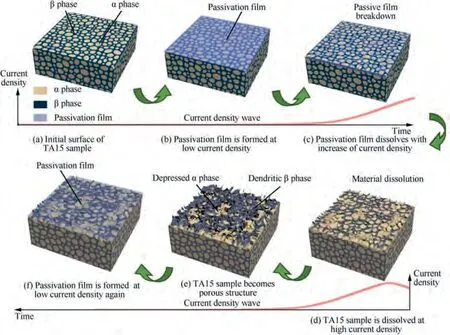
Fig. 18 Schematic diagram of passivation and dissolution behavior of TA15 electrolysis at 0.01 Hz under rotating condition in NaCl solution.
4. Conclusions
By studying the passivation and dissolution behaviors of TA15 under rotating condition with alternating high and low current density, the main conclusions are drawn as follows:
(1) The electrochemical behavior of TA15 is closely related to the pulse frequency. At higher pulse frequency of 0.20 Hz, the passivation film formed by TA15 does not have the condition to break, and the material is difficult to dissolve due to continuous passivation.At lower pulse frequency of 0.01 Hz, TA15 undergoes three stages: passivation, dissolution and re-passivation.Finally, the material dissolves uniformly.
(2) At lower pulse frequency of 0.01 Hz,the oxygen content in the surface layer of TA15 is inversely proportional to the current density, and the passivation film increases first, then decreases and finally increases again. In this process, when the current density is low, passivation dominates the electrochemical behavior, whereas dissolution dominates at high current density.
(3) The α phase and β phase of TA15 have different electrochemical characteristics because of the different elemental compositions. Especially at high current density, the dissolution rate of α phase is higher than that of β phase,which leads to the depression of α phase and the protrusion of β phase, resulting in the formation of porous structure.
(4) With the change of surface microstructure from smooth to porous, the specific surface area of the sample increases,which makes the main component Oof passivation film continue to increase. Under the surface layer, the suboxides of titanium begin to be exposed,and the proportion of Tigradually increases.
The authors declare that they have no known competing financial interests or personal relationships that could have appeared to influence the work reported in this paper.
This research was funded by the National Natural Science Foundation of China (No. 51805259), the National Natural Science Foundation of China for Creative Research Groups(No. 51921003), the Natural Science Foundation of Jiangsu Province, China (Nos. BK20180431 and BK20190419),ChinaPostdoctoralScienceFoundation(Nos.2019M661833 and 2018M642246), Jiangsu Key Laboratory of Precision and Micro-Manufacturing Technology, China,and the Young Elite Scientists Sponsorship Program by CAST, China.
