Unsteady analysis of jet impingement under vibration conditions
Yue YANG, Junkui MAO, Feilong WANG, Xingsi HAN
Jiangsu Province Key Laboratory of Aerospace Power System, Nanjing University of Aeronautics and Astronautics,Nanjing 210016, China
KEYWORDS Impinging jet;Proper orthogonal decomposition;Self-Adaptive Turbulence Eddy Simulation (SATES);Unsteady turbulent convection;Vibration
Abstract The vibration of thermodynamic machinery will affect its cooling system. In this research, a high-resolution simulation of jet impingement was performed to quantify the unsteady turbulent convection under vibration conditions. A newly developed Self-Adaptive Turbulence Eddy Simulation (SATES) method was used. The Reynolds number was Re = 23000, the jet-towall distance was fixed at H/D=2,and the vibrating frequency of the impinging wall f varied from 0 to 200 Hz. Compared with the static wall case, the maximum enhancement of the stagnation point and area averaged Nusselt number within r/D = 1 could reach up to 5% due to the larger primary vortices,whereas it could reduce the heat transfer by 10%beyond r/D=3 due to the suppression of the wall vortices development. Based on the unsteady analysis and Proper Orthogonal Decomposition(POD)pattern,the modes controlled by vibration were recognized and their contributions to the heat transfer performance were also evaluated.The introduction of the vibration promoted the development of the primary vortices and changed the radial alternating motion to a vertical alternating motion at the wall jet region. The former was beneficial for the heat transfer,while the latter was unfavorable.
1. Introduction
With the development of the high-performance aero-engines,the temperature of the turbine inlet gas has been kept increasing. To avoid the overheating of the turbine components (e.g.combustor chamber, casing, and turbine blades), jet impingement cooling method and film cooling method are the most important cooling methods in the aero-engines. Similar structures are shown in Fig. 1.The cooling fluid impinges on these structures mainly through the impingement holes on the impinging pipe or impinging chamber. Then, the cooling fluid goes through the holes on the target wall and is covered on the outer surface of the turbine components.
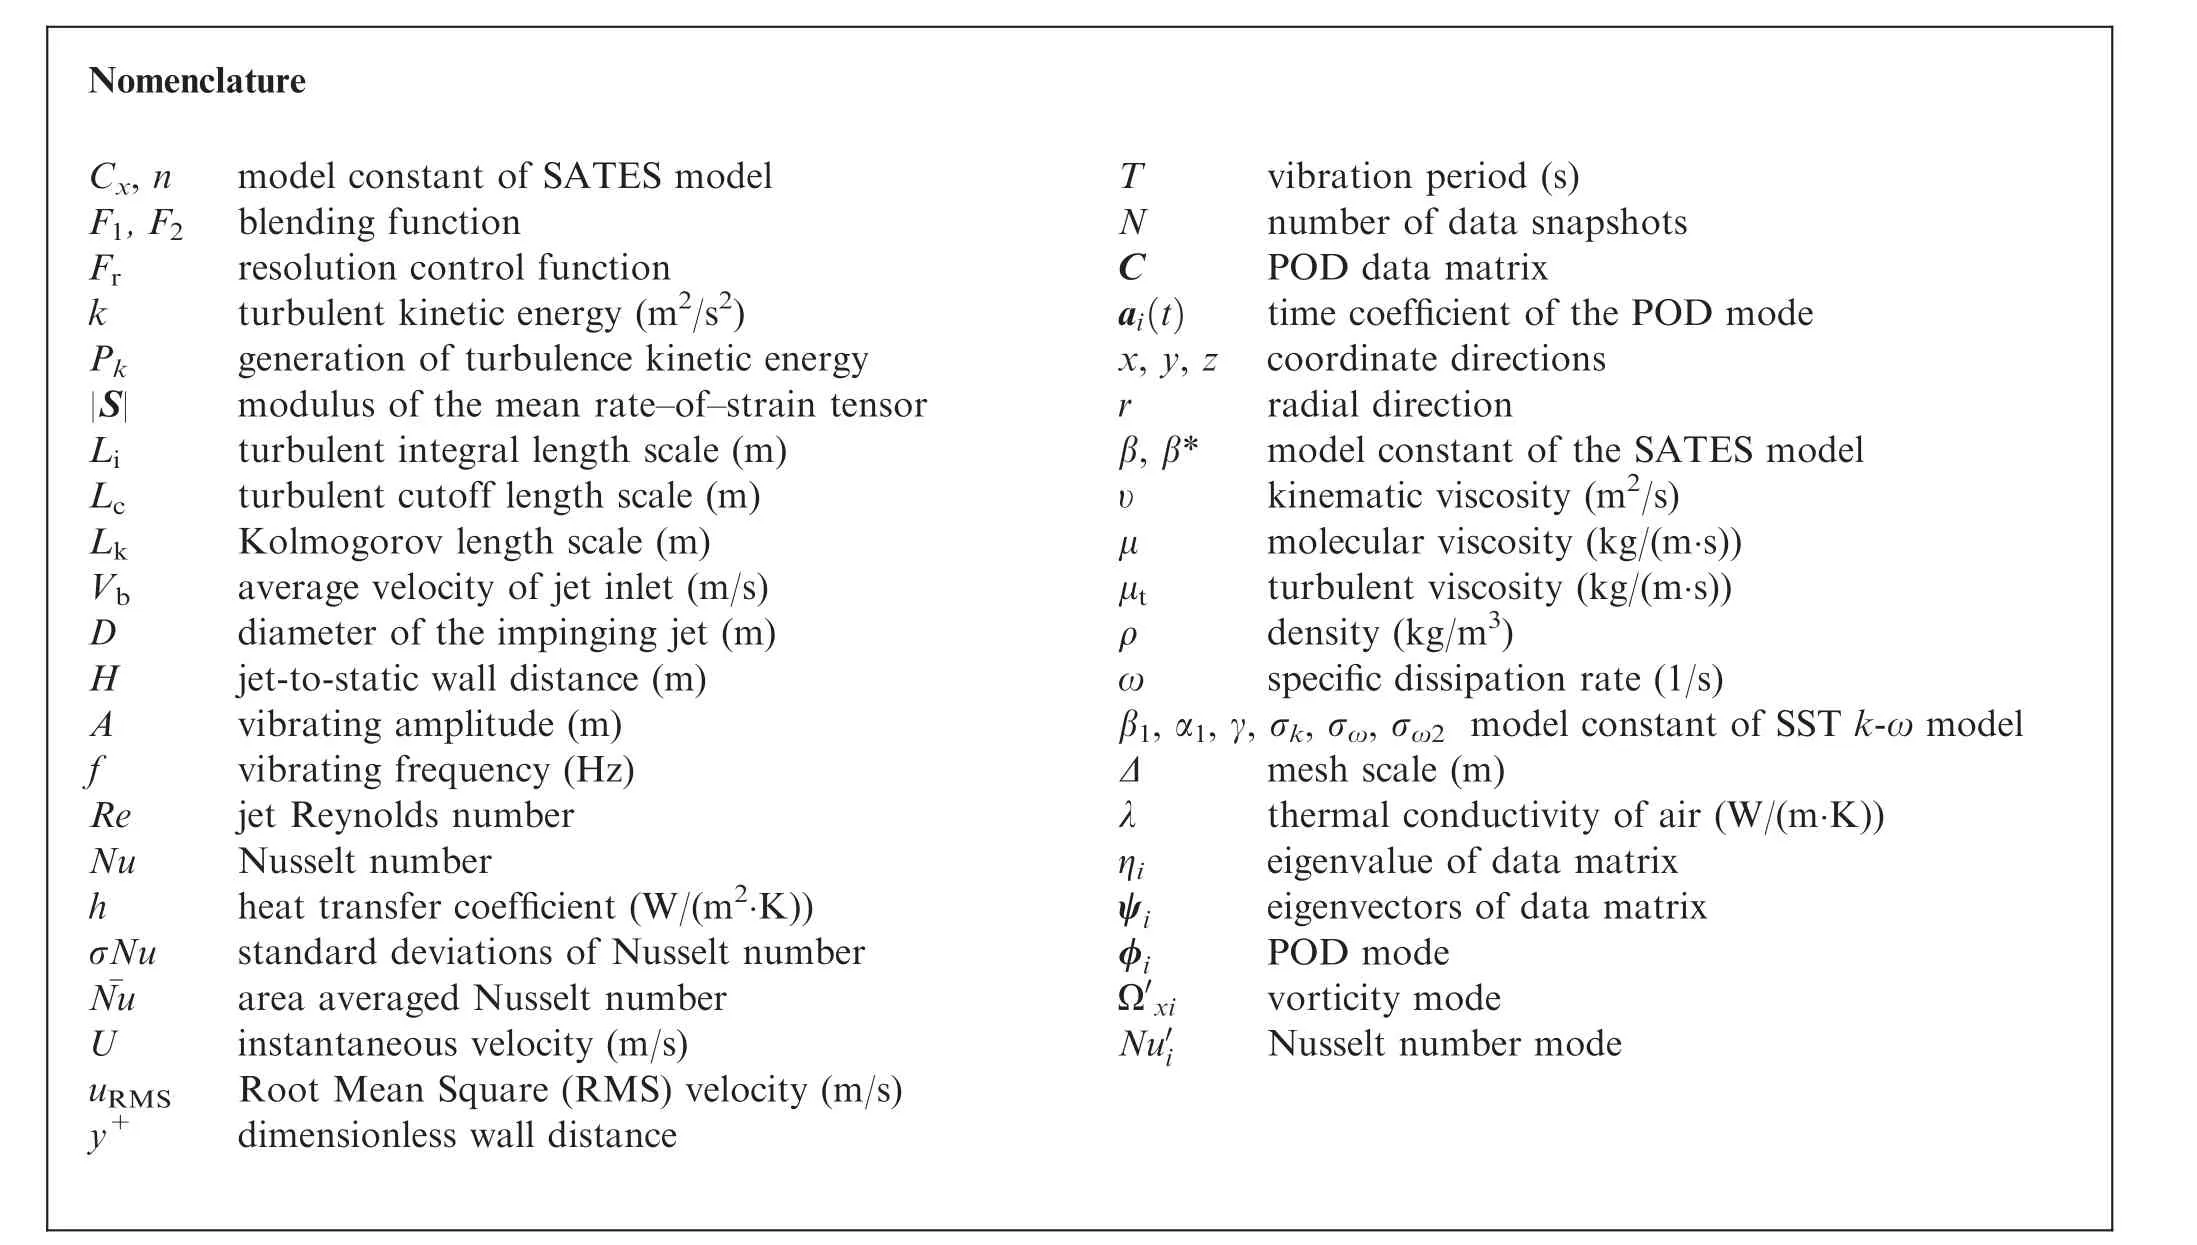
Nomenclature Cx, nmodel constant of SATES model F1, F2 blending function Frresolution control function kturbulent kinetic energy (m2/s2)Pkgeneration of turbulence kinetic energy|S|modulus of the mean rate-of-strain tensor Liturbulent integral length scale (m)Lcturbulent cutoff length scale (m)LkKolmogorov length scale (m)Vbaverage velocity of jet inlet (m/s)Ddiameter of the impinging jet (m)Hjet-to-static wall distance (m)Avibrating amplitude (m)fvibrating frequency (Hz)Rejet Reynolds number NuNusselt number hheat transfer coefficient (W/(m2·K))σNustandard deviations of Nusselt number¯Nuarea averaged Nusselt number Uinstantaneous velocity (m/s)uRMSRoot Mean Square (RMS) velocity (m/s)y+dimensionless wall distance Tvibration period (s)Nnumber of data snapshots CPOD data matrix ai(t)time coefficient of the POD mode x, y, z coordinate directions rradial direction β, β*model constant of the SATES model υkinematic viscosity (m2/s)μmolecular viscosity (kg/(m·s))μtturbulent viscosity (kg/(m·s))ρdensity (kg/m3)ωspecific dissipation rate (1/s)β1, α1, γ, σk, σω, σω2 model constant of SST k-ω model Δmesh scale (m)λthermal conductivity of air (W/(m·K))ηieigenvalue of data matrix ψieigenvectors of data matrix φiPOD mode Ω′xivorticity mode Nu′iNusselt number mode
For film cooling, some reviewshave been done to reveal the parameter effects on the heat transfer performance, and some scholars also made much progress in the modification of the film cooling holes, such as combined hole,anti-vortex hole,elliptical hole,imperfect holeand so on. For jet impingement with a stationary target wall,considerable investigations have been carried out from many aspects, including different jet-nozzle geometries,different target surface geometries,and pulsating jets.Much progress has been made in providing valuable information about the complex thermo-fluid phenomena and heat transfer data.
However, the jet impingement cooling system often operates in vibrating conditions due to the periodic tubbing excitationand the fluid vortex excitation.According to relevant researchon near-wall flows, with the introduction of vibration, the flow and the heat transfer characteristics are determined not only by the intrinsic characteristics, but also by the vibration. A vibration presented as an extrinsic unsteady excitation will have non-negligible effects on the flow field and the heat transfer.The role that vibration plays in the thermo-fluid dynamics of impingement flow must be taken into serious consideration.
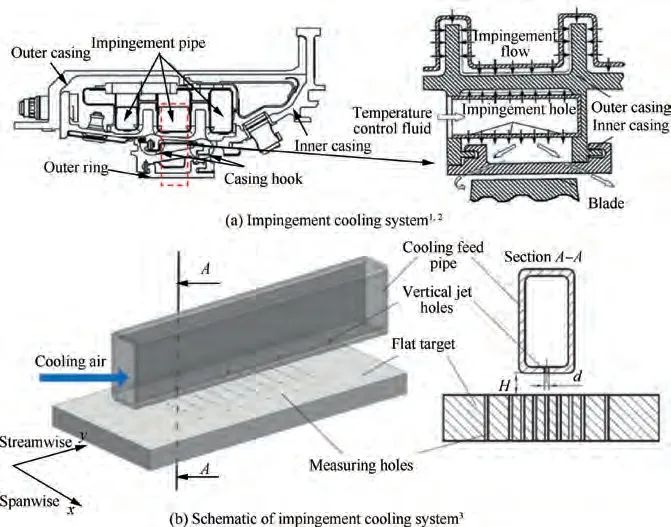
Fig. 1 Impingement cooling system in gas turbine casing.
In recent years,few studies of jet impingement on a vibrating surface have been reported in the literature.One of the earliest studies was conducted by Wen,who experimentally studied the physical phenomena of the vibration condition with the vibrating frequency ranging from 0.3 Hz to 10.19 Hz.The results showed that the vortices in the shear layers were modified by the vibrating plate and a forced convective region was formed, resulting in an increase of the Nusselt number. A similar experimental study was conducted by Chaugule et al.with the vibration frequency varying from 20 Hz to 50 Hz. However, the opposite conclusions were drawn; it was concluded that the surface vibration in the jet impingement reduced the transport capabilities compared with those for the case of a static wall. The vibration resulted in lower turbulence intensities and the decrease of the Nusselt number for a vibrating wall was 15%. Additionally, a highresolution large-eddy simulation was also performed for a jet impinging on a vibrating wall by Natarajan et al..The vibrating frequency was fixed at 100 Hz. The results indicated that the attenuation of the heat transfer could only be found in the region of r/D > 1.5. Whether the heat transfer was enhanced depended on the Reynolds number, geometric parameters, vibration frequency and amplitude, which was confirmed by Ichimiya et al.. Their experiments showed that the Nusselt number was enhanced for a low Reynolds number and low frequency, while it was suppressed at a high frequency in their research range.
In the above studies, the vibration frequency was lower than that of the heat engine (50 - 180 Hz). In addition, only the time average flow and heat transfer characteristics with qualitative data were analyzed. The unsteady features were crucially essential for the research of the thermal stress performance and the industrial machinery’s structural integrity, but these features were still not well understood.
In general,the unsteadiness also exists in a jet impingement flow on a stationary wall. For a jet impingement on a stationary wall, Chung et al.pointed out that primary vortices with the Kelvin-Helmholtz (K-H) instability could cause the fluctuations of the stagnation Nusselt number,and as the Reynolds number increased, more nonlinear fluctuations could be observed. Due to the separation of the secondary vortices, the fluctuations of the secondary Nusselt number were also reported in many researches.With the introduction of vibration, the inherent unsteady behavior consisting of the jet impingement will be changed, including the vortices evolution and heat transfer. Therefore, the interaction between vibration and the unsteady behavior contained in the inherent properties of jet impingement should be well studied.
To quantify the unsteady behavior, a snapshot Proper Orthogonal Decomposition (POD)provides an alternate way to extract the important unsteady features and it is a pivotal way to discover the mechanism between the flow field and heat transfer.Schulz et al.successfully made a decomposition and reconstruction of the complex impinging jet flow in a trapezoidal cross-section with the POD method. The results provided evidences that the jet flow unsteady motions could be expressed in POD modes. Fan et al.identified a Rankine vortex in recirculation regions. Meslem et al.distinguished the Kelvin-Helmholtz(K-H)vortices in the free jet region with different nozzle geometries and they explained how the performance of vortices correlated with the trends of the Nusselt number. Furthermore, Mallorand Zhouet al. employed the POD method to identify the unsteady heat transfer mode of wall-proximity square ribs and film cooling, respectively,and pointed out the effect of the flow unsteadiness on the heat transfer. Their work showed that the unsteady heat transfer is crucially essential for the integrity performance. In addition,their work also gave evidences that the POD method can be successfully applied to the decomposition of heat transfer as well as flow field. Thus, a jet impinging on the vibrating wall,which has hardly been studied before,deserves to be well investigated. And POD method is helpful to further analyze the unsteady behavior imposed by vibration and inherent properties of jet impingement and discover the relationship between the flow field and the heat transfer.
In summary, this work mainly investigated the unsteady behavior of the jet impingement flow field and the heat transfer with consideration of the effect of high frequency vibration,which are still not well understood in the impingement system under vibration. During the simulations, the impinging wall moved in a sinusoidal manner with the amplitude A of 0.05D and the frequencies f from 0 Hz to 200 Hz.The jet-to-static wall distance was 2D and the jet Reynolds number Re was fixed at 23000. To capture the unsteady quantities, a new Self-Adaptive Turbulence Eddy Simulation(SATES)was proposed.Meanwhile,the POD method was used to extract the dominant modes and to identify the relationship between the flow field and the heat transfer.The outcomes of this study could be beneficial for revealing the influence of vibration on the flow field and the heat transfer,which could be helpful for the optimization of a jet impingement cooling system.
2. Numerical method
2.1. Physical model and computational domain
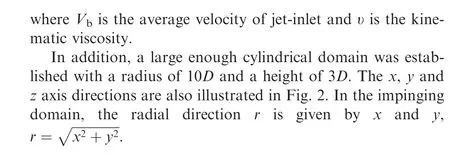
In this research, to simulate the vibration of jet impingement cooling system in gas turbine, a turbulent round jet impingement on a vibrating wall with different frequencies was abstracted. Fig. 2 and Table 1 show the schematic diagram and the geometric parameters of the jet impingement configuration, where D is the diameter of the impinging jet and H is the jet-to-static wall distance. According to the previous work in the jet impingement cooling system without vibration,the small H/D had exhibited better heat transfer ability and H/D = 2 was a typical value widely adopted in previous research.In addition,H/D in the jet impingement system of gas turbine varied from 2 to 8.Thus,H was set to a typical value of 2D in this research.The impinging wall moved in a sinusoidal manner,with the amplitude A of 0.05D and the frequencies f of 0 Hz (i.e. the static wall case), 50 Hz, 100 Hz and 200 Hz. The mean jet-to-wall distance was the position where the case with a static wall was placed. Meanwhile, the jet Reynolds number Re was fixed at 23000 for all cases. The Reynolds number was defined based on the jet diameter D,given as
Re=VD/υ(1)
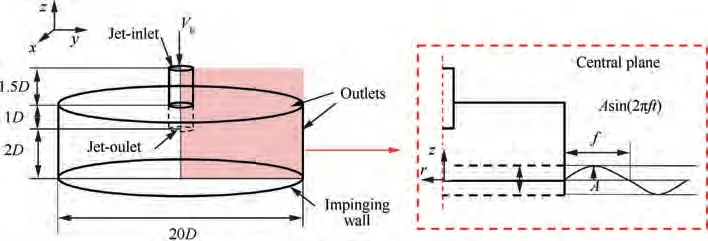
Fig. 2 Schematic diagram of jet impingement configuration.

Table 1 Geometric parameters of jet impingement configuration.
2.2. SATES turbulence model
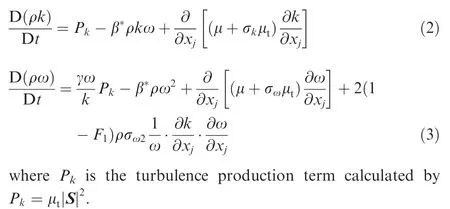
In this study, the Self-Adaptive Turbulence Eddy Simulation(SATES) modeling was developed with the conceptual framework proposed by Han et al.. Due to the advantages in predicting jet impingement flow,the Shear Stress Transport(SST) k-ω turbulence was selected as the underlying Reynolds-Averaged Navier-Srokes(RANS)turbulence model.Therefore,the governing equations for the SATES model were the same as those in the RANS SST k-ω model,which are given by
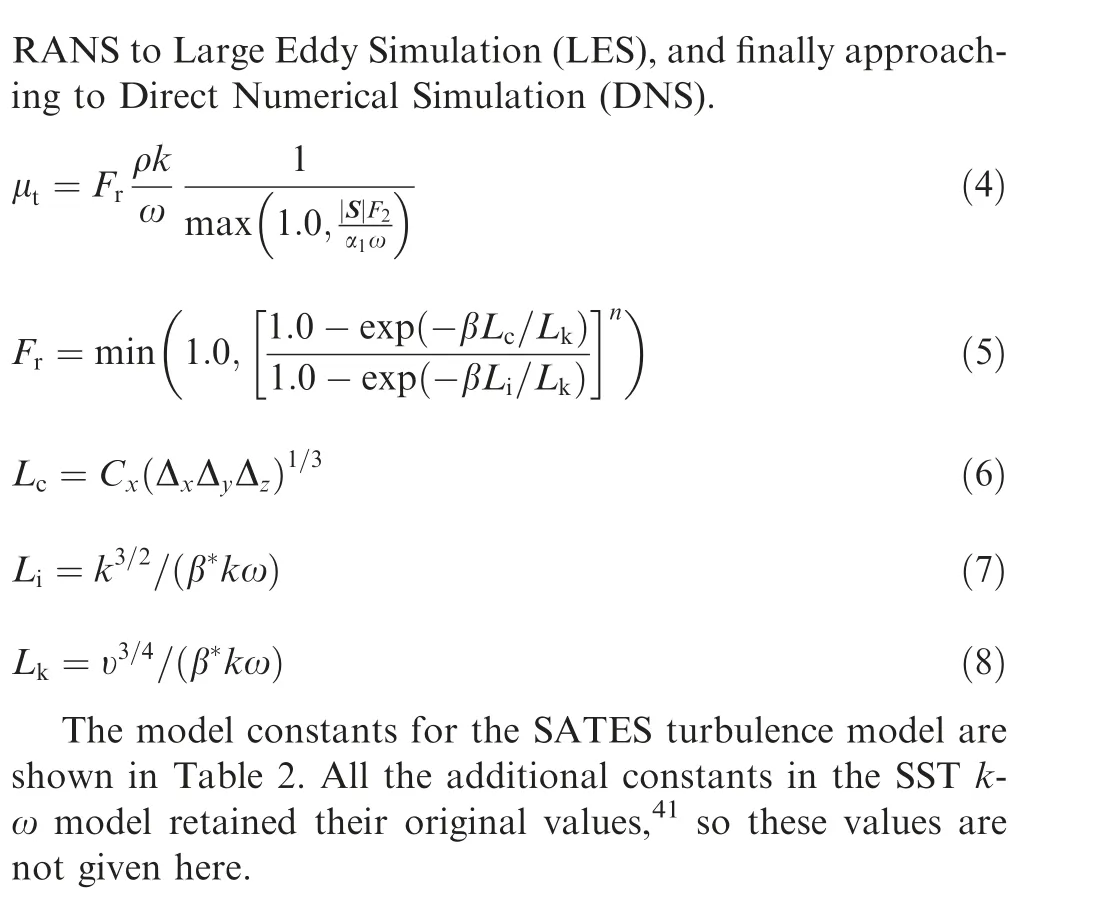
Compared with the SST k-ω model, μfor the SATES method was modified by the resolution control function, F,which could be referred to in our previous work.For different local mesh sizes, Fvaried from 0 to 1.0, which represented different turbulence models working from unsteady
2.3. Computational grid details
Fig. 3 shows the details of the computational grids within r/D <3.The structured grids were applied in the computational domain.The grid density grew gradually in the z direction and the r direction to achieve the resolution requirements. The maximum wall distance ywas less than 1.0. Three sets of structured grids were considered for the SATES simulations,and the grid parameters are given in Table 3. The increase of the grid was mainly concentrated in the impinging domain(0 <z/D <3, 0 <r/D <10). From Gird-I to Grid-III, the number of grids in the z axis (N), radial (N), and azimuthal(N) direction increase from 130 to 160, 235 to 350, and 126 to 204, respectively. Correspondingly, the total number of computational grids increases from 4.02 million to 11.61 million.

Table 2 SATES model constants.
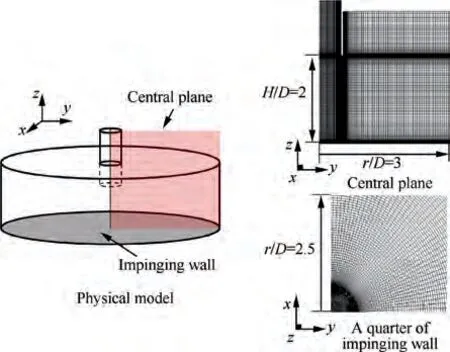
Fig. 3 Details of grids.
2.4. Boundary conditions and numerical setup
For all cases, the fluid was set to incompressible ideal gas. At the jet-inlet,the velocity distribution,turbulent kinetic energy,and specific distribution rate were generated by a single RANS numerical simulation of a periodic circular pipe. The vortex method was adopted as the method for synthetic turbulence generation at the jet-inlet. The temperature of the jet-inlet was 300 K. All walls were no-slip wall, and the impinging target wall was set with constant heat flux of 2000 W/m.
For the case of vibrating wall,the boundary conditions and the grids were the same as those for the case of the static wall.However, the wall was set to rigid body motion at vibrating,and the sinusoidal motion of the wall was achieved using UDF (User-Defined Function). The boundary layer maintained the same sinusoidal motion during wall vibration to ensure that ywas always less than 1.0. Since the vibration amplitude was small in this study, only the spring method was used to optimize the grid during vibration.Thus,the number of grids remained the same for all vibrations.
The SATES model was realized in ANSYS Fluent software using UDF. The SIMPLE scheme was used for the pressurevelocity coupling. The bounded central differencing and the second-order upwind were used for the discretization of momentum and the turbulence model equations, respectively.The second-order implicit scheme was adopted for the transient formulation.
2.5. Numerical validation
2.5.1. Grid sensitivity study
For turbulent flow,the quality and proper number of grids are very important for the accuracy and validity of the numerical results. Thus, the sensitivity of the grid was examined first for the SATES method. As shown in Fig. 4, fewer significant differences of the Nusselt number along the radial direction could be observed for the three grids.Thus,considering the time consumption,Grid-II was used in the subsequent calculations and the grid number was about 6.98 million.
2.5.2. Turbulence model validation
To verify the turbulence model and provide an accurate baseline for subsequent calculations, the numerical simulations of the static impinging wall were carried out with Grid-II. The numerical method validation with H/D = 2 and Re = 23000 is presented in Fig. 5, as well as the comparison with the experimental data of Baughn and Shimizu,those of Gao et al.and the LES results of Taghinia and Rahman.Besides, the same grid was applied for the Unsteady RANS(URANS) simulation in this work based on the SST k-ω model. It could be found that the SATES results agreed well with those of the previous experimental data. The deviation of the local Nusselt number between the SATES method and experiments was barely 5%. In addition, the SATES method had better performance than the RANS method for jet impingement heat transfer prediction, and the accuracy of the SATES method was comparable to that of the LES method in Ref. 44.
Except for the comparison of the heat transfer performance, the differences of the flow field between the SATES simulation and the experimental data of Cooper et al.were analyzed. The results of the mean velocity magnitude and the radial Root Mean Square (RMS) velocity normalized by the jet-inlet velocity are shown in Fig.6.The results of the present SATES method were in good agreement with the experimental results, especially the normalized mean velocity.
3. Results and discussion
In this section, the instantaneous and time-averaged data of the flow field and the heat transfer are discussed. The POD was used to explore the relations between the coherent vortex structures near the wall and the heat transfer distributions.

Table 3 Grid parameter details.
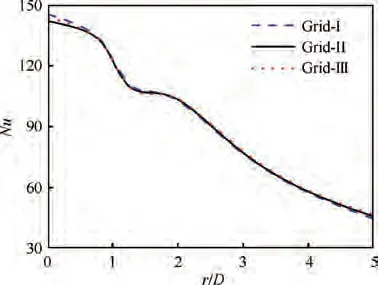
Fig. 4 Grid sensitivity analysis.
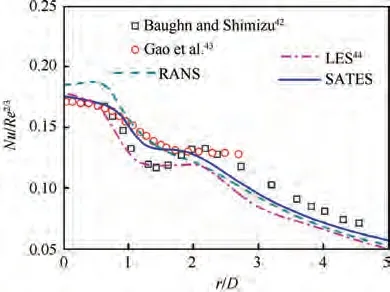
Fig. 5 Comparison of Nusselt number.
3.1. Heat transfer comparison
The heat transfer performance of the impingement on the vibrating wall was investigated first. The time-averaged local Nusselt numbers were evaluated at four vibrating frequencies(f = 0, 50, 100, 200 Hz), as shown in Fig. 7(a). Furthermore,the ratios between the Nusselt number with different vibrating frequencies and the static wall, Nu, were also investigated, as shown in Fig. 7(b). The local Nusselt number was defined based on the jet diameter D, which is expressed as

As shown in Fig. 7(a), in all cases considered in this study,the maximum local Nusselt number was located at the stagnation region(r/D <1),and a secondary peak could be found in the region varying from r/D=1.5 to r/D=2.3.However,the distribution of the Nusselt number was changed by the introduction of the vibration. The vibration enhanced the Nusselt number in the stagnation region (r/D <1), but it reduced the heat transfer in the wall jet region (r/D > 1). The magnitude of the enhancement and the suppression became larger as f increased from 0 Hz to 200 Hz. As shown in Fig. 7(b),the Nusselt number of the vibrating wall at f = 50 Hz was almost comparable to that of the static wall. However, when f increased to 200 Hz,the maximum enhancement of the Nusselt number could reach up to 5%in the stagnation region but it decreased by about 10% in the wall jet region. In addition,with the increase of the vibrating frequency, the probability of the secondary peak (1.5 <r/D <2.3) became smaller.For f = 0 Hz, the secondary peak was located at approximately r/D = 2, while for f = 200 Hz, this area could hardly be observed.
Due to the turbulent jet inlet and the vibrating condition,the instantaneous flow resulted in the unsteady heat transfer behavior. Thus, except for the time-averaged Nusselt number,it was also useful to have an insight into the fluctuation of the Nusselt number. The standard deviations of the Nusselt number were analyzed to quantitatively evaluate the unsteady phenomena, as shown in Fig. 8. In this figure, the solid line represents the outline of the jet impingement, and the two dashed lines are located at r/D = 1 and r/D = 2, which were used to identify the stagnation region (r/D <1) and the secondary peak region (1.5 <r/D <2.3).
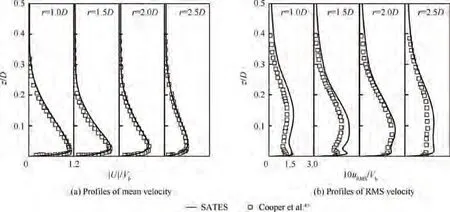
Fig. 6 Comparison of velocity profiles.
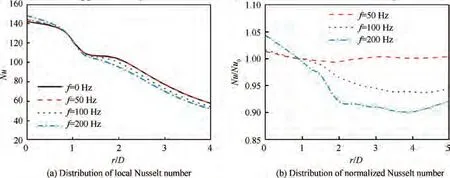
Fig. 7 Local Nusselt number comparison.

Fig. 8 Standard deviations of Nusselt number.
As shown in Fig. 8, a similar distribution with two high standard deviations could be found. The stagnation region(r/D <1) and the secondary peak region (1.5 <r/D <2.3)not only had a large Nusselt number but also a strong fluctuation, which was detrimental to the thermal stress performance. With the introduction of the vibration, the fluctuation of the secondary peak was suppressed. When the frequency increased to 100 Hz and 200 Hz, the fluctuation in the secondary peak region (1.5 <r/D <2.3) became weak.In addition, the high standard deviations in the stagnation region for f=200 Hz could only be found in the region varying from 0.5D to 1D,which could not be observed for the other vibrating frequency. These results indicate that the unsteady flow features responsible for the heat transfer have obviously been changed.
3.2. Unsteadiness properties
To couple the heat transfer performance with the flow dynamics and to understand the physical mechanisms contained in these phenomena, a series of images of instantaneous flow fields and the heat transfer distributions were analyzed, as described in this section.
Typical sequences of the velocity fields and the Nusselt number distributions for f = 0 Hz and 200 Hz are presented in Fig. 9 and Fig. 10. The streamlines represent the velocity in radial and z axis direction, which are mainly used to show the direction of the flow movement.Meanwhile,to better indicate the value of the velocity,the contour image of the normalized velocity magnitude is superimposed on the streamlines map. The darker red represents the larger velocity, and the darker blue represents the smaller velocity. To contrast with the results of f = 200 Hz, the time interval of f = 0 Hz was the same as that of f=200 Hz,whose interval between images was a quarter of a period.Tin the images represents the period of f = 200 Hz.
When the shepherd was dead, the brother asked his sister which she would like best, the sheep or the little house; and when she had chosen the house he said, Then I ll take the sheep and go out to seek my fortune in the wide world
As shown in Fig.9,for the static wall case,a series of vortex structures were visible in the shear layer of the free jet region and the wall jet region. The primary vortices (i.e. ‘‘P” vortices in the images)emanated from the entrainment effect of the free jet shear layer, and the secondary vortices (i.e. ‘‘S” vortices in the images) were formed due to the separation of the primary vortices. Furthermore, the Nusselt number distributions agreed with the flow patterns. As shown in the T/4, and T/2 moments, the primary vortices that were located close to the wall resulted in the effective heat transfer enhancement at the stagnation region(r/D <1).A larger area of high Nusselt number in r/D <1 could be found in these sequences.The secondary vortices were responsible for the secondary peak of the Nusselt number, and some high Nusselt number areas could be found in 1 <r/D <2. In addition, the evolution of the vortices was closely related to the unsteadiness of the heat transfer. The development of the primary vortices led to the fluctuation of the stagnation Nusselt number,and the periodic motion of the secondary vortices caused the unsteadiness of the secondary peak of the Nusselt number.Thus,these two regions had large standard deviations, as illustrated in Fig. 8.However, it could also be found that the unsteadiness of the fluid structure and heat transfer was highly turbulent and chaotic, and the fluctuation has no obvious pattern.
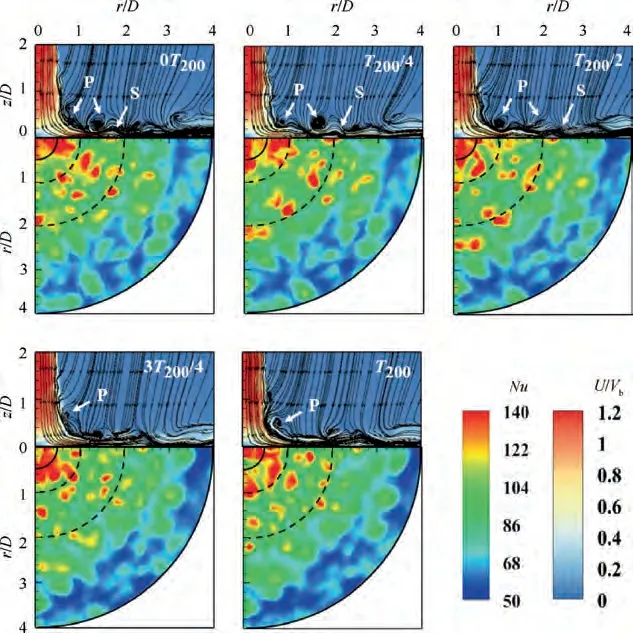
Fig. 9 Instantaneous results for static wall.
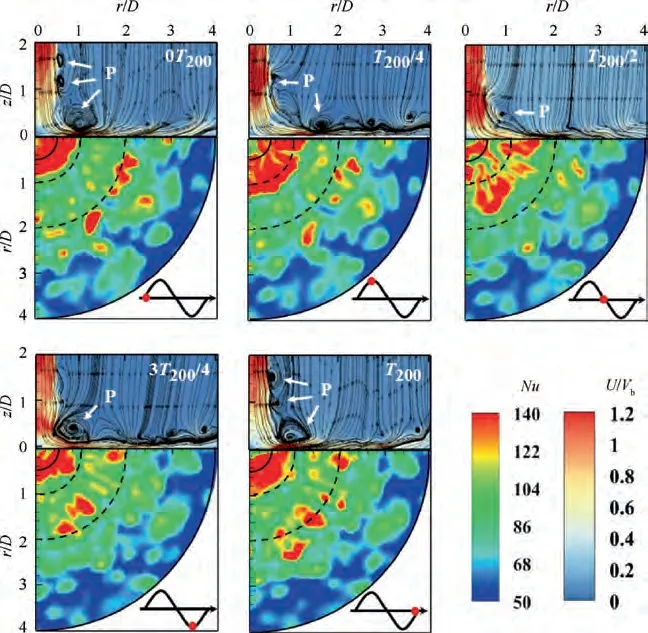
Fig. 10 Instantaneous results for vibrating wall at f = 200 Hz.
Compared with the static wall case,some different phenomena could be found with the introduction of the vibration.Taking the case of f = 200 Hz as an example, as shown in Fig. 10, a succession of larger primary vortices in the free jet region could be clearly observed in the 0Tand Tmoments.In contrast,for the wall jet region,the vortex system was suppressed, and the secondary vortices could hardly be observed.The velocity direction of the free jet region was parallel to the vibration direction,both along the z-axis direction.When the wall moved along the z-axis,the shear effect between the free jet flow and ambient static flow could be enhanced,thus promoting the generation of the primary vortex. However,the velocity direction of the wall jet region was perpendicular to the vibration direction. The impinging wall moved along the z-axis direction, while the flow moved along the radial direction. The motion along the z-axis direction restrained the evolution of the vortex system in the wall jet region. For the heat transfer characteristics, due to the larger primary vortices, the Nusselt number in r/D <1 was significantly higher than that of the static wall, while due to the reduction of the wall vortex system, the secondary peak of the Nusselt number in 1.5 <r/D <2.3 became less obvious.
More specifically, with the introduction of the vibration,the unsteadiness was associated with the vibration phase. In the phase of the upward motion, the formation and development of primary vortices could be found in the process from the 3T/4 moment to the Tmoment, and the merging of the primary vortices could be recognized in the process from the 0Tmoment to the T/4 moment. The Nusselt number in the stagnation region also had a positive correlation with the direction of the wall motions. Increasingly high Nusselt number regions in r/D <1 could be found in the upward motion.In the phase of the downward motion (i.e. from the T/4 moment to the 3T/4 moment), the primary vortices were deflected, and they developed to the wall jet region. Correspondingly, the unsteady phenomena of the flow field and the heat transfer mainly occurred in the wall jet region during this time period. In addition, compared with the static wall case,the velocity of the generation and development of the primary vortices was also fast,and it appeared to exist in the form of a stationary vortex causing a large standard deviation in only 0.5 <r/D <1, as presented in Fig. 8.
In addition,a brief comparison was carried out among different frequencies. The results of the 0T moment at f = 50-2 00 Hz are presented in Fig. 11. As the vibrating frequency increased, in the free jet region, the primary vortices became larger and the vortices in the wall jet region were more and more suppressed.It was also consistent with the above results.The higher the frequency was, the stronger the shear effect in the free jet region was and the more suppressed the evolution of vortices in the wall jet region was.Thus,the Nusselt number in the stagnation region increased with the increase of the frequency, but the Nusselt number of the wall jet region decreased as the frequency increased.
In fact,no matter what the fluctuation of the velocity fields was or what the fluctuation of Nusselt number maps was, the unsteady behavior was transformed from a highly turbulent and chaotic state to an orderly and organized state under the vibration condition. To explore this organized unsteadiness,a fast Fourier transform was performed on four points in the fluid domain and the impinging wall, as shown in Fig. 12.To obtain the instantaneous pressure signals in the fluid domain at every time step, the first probe (P) was located at r/D = 0.5 and z/D = 0.5, and the secondary probe (P) was located at r/D = 1.5 and z/D = 0.15. The Pand Ppoints were close to the free jet shear layer and the wall jet shear layer,respectively. To acquire instantaneous Nusselt number signals in the impingement wall at every time step,the third probe(P)was located at r/D = 0.5, and the fourth probe (P) was located at r/D = 1.5. The Pand Ppoints represented the heat transfer in the stagnation region and the wall jet region,respectively.
The results of the dominant frequency in the fluid domain and the heat transfer of the impinging wall are shown in Fig.13 and Fig.14,respectively.As expected,the unsteadiness was closely related to the vibration frequency. As shown in Fig. 13, in the fluid domain, no dominant frequency could be identified from the static wall case, but the vibrating cases exhibited the same dominant frequency as that of the vibrating frequency. It was believed that the fluctuation caused by the vibration was greater than that in its inherent characteristic,and the strong fluctuation behavior was driven by the vibration.However,as shown in Fig.14,the unsteady heat transfer results exhibited a less evident effect on the vibration, and the dominant frequencies were not as easily discernible as those of the fluids. As the vibration frequency increased, the dominant frequencies of heat transfer became easier to identify, and the frequency domain narrowed and contracted to the vibration frequency region. The unsteadiness of the heat transfer was determined by the flow structures induced by the impingement flow and the vibration. From the fast Fourier results, it could be inferred that the flow structures induced by the impingement flow or vibration would have different contributions to the heat transfer, and the contribution of the flow structures induced by vibration would increase with the increase of the vibrating frequency.The more detailed analysis of the dynamic features from the unsteady motions using the POD method will be analyzed in Section 3.3.
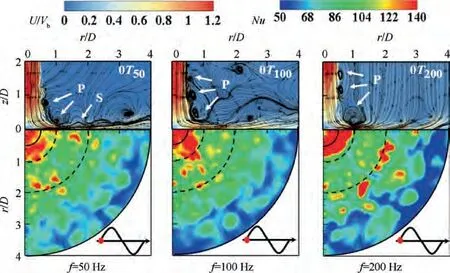
Fig. 11 Comparison among different frequencies.
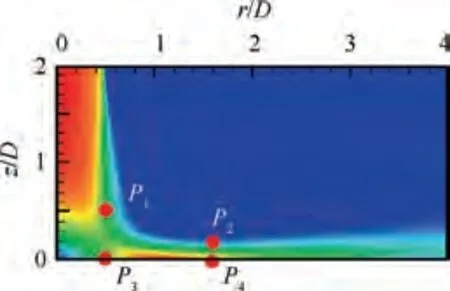
Fig. 12 Diagnostic probes.
3.3. Large-scale coherent structures from POD analysis
To identify the flow structures induced by the impingement flow or vibration and further explore their contribution to the heat transfer, the snapshot PODwas applied to extract the coherent motion modes from an ensemble of 3000 snapshots. The instantaneous data could be collected into the matrix U and decomposed into the mean component (U) and the fluctuation components (U), and thus, the fluctuation components could be further decomposed to some POD modes,
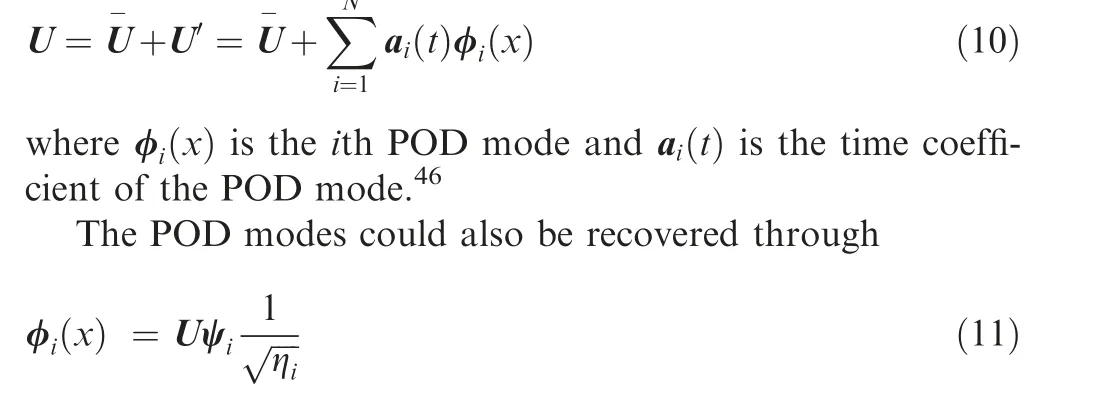
where ψand ηare the eigenvectors and the eigenvalue of the matrix C,C=UU,and the value of ηrepresents the contribution of the total mode energy.
In this research, the snapshots of the instantaneous vorticity were analyzed over the region of interest 1 ≤r/D ≤4,0 ≤ z/D ≤ 0.5 for static wall case, and 1 ≤ r/D ≤ 4,0.05 ≤z/D ≤0.5 for the vibrating wall case,to avoid the area of wall motion being selected. The snapshots of the Nusselt number of the impinging wall were also analyzed over the region of 0 ≤r/D ≤4 to obtain the heat transfer modes and to reveal the relationship between the flow field and the heat transfer.
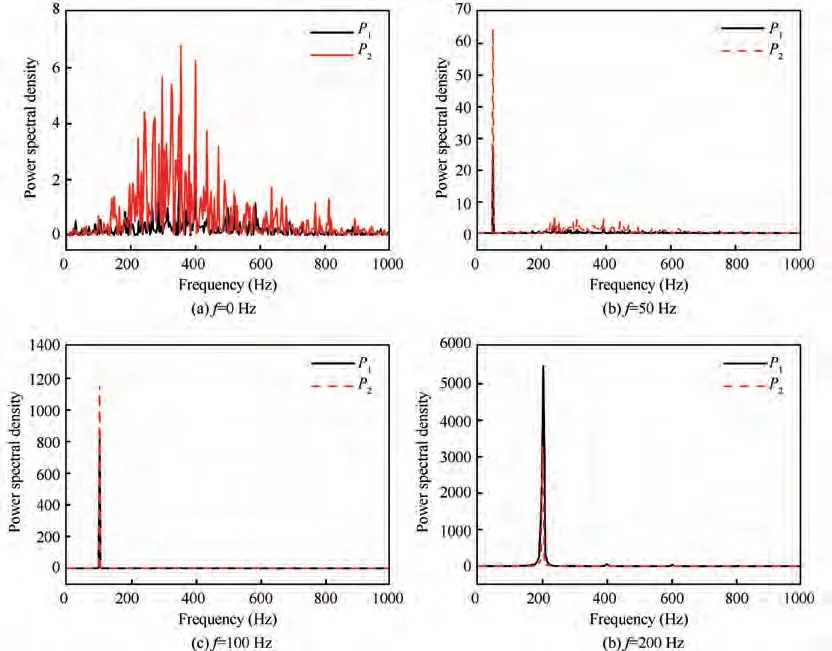
Fig. 13 Fast Fourier transform results for flow field.
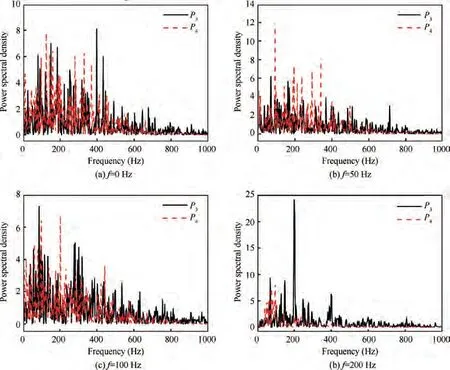
Fig. 14 Fast Fourier transform results for heat transfer.
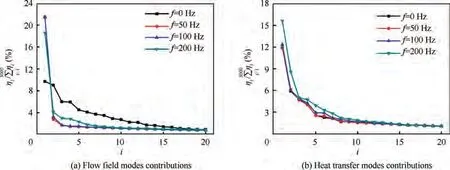
Fig. 15 Contributions of POD modes.
Fig. 15 presents the normalized eigenvalue distribution of the first 20 modes for the fluid field and the heat transfer. As shown in Fig. 15(a), when f = 0 Hz, the difference between fluid mode contributions was relatively small, below 10% for all modes. However, with the introduction of the vibration,the contribution of the Mode 1 increased to above 20%, and the contribution of the other modes was reduced to a relatively low level, less than 4%. The contributions of different fluid modes were modified by vibration, and some motions were even changed due to the introduction of vibration.In addition,compared with the results of the flow field modes,some different phenomena could be found in the distribution of the heat transfer mode contributions,as shown in Fig.15(b).No mode with a particularly large proportion, such as Mode 1 in the flow field, could be found. The introduction of the vibration only changed the contribution proportion of different modes in the heat transfer.This implied that the contribution of each fluid mode to the heat transfer was different. The detailed mode pattern and the relationship between the flow field and the heat transfer were analyzed as described below.
For the flow field modes contributions shown in Fig.15(a),the first 10 modes occupied 49% in total of energy contribution, where the first 5 modes occupied more than 35% and were more than 71%of the first 10 modes energy.Meanwhile,according to Refs. 31,33, the modes that occupied more than 30% in total of the energy contribution are usually investigated. In this research, the total contribution of the first 5 modes is more than 35%,which are related to the most important structures of the flow field and heat transfer,and thus,the first 5 modes are discussed in this research. Similarly, for the heat transfer modes contributions shown in Fig. 15(b), first 10 modes occupied 38%in total of energy contribution,where the first 5 modes occupied more than 30%and were more than 78% of the first 10 modes energy. Thus, the first 5 modes for heat transfer are also discussed in this research.
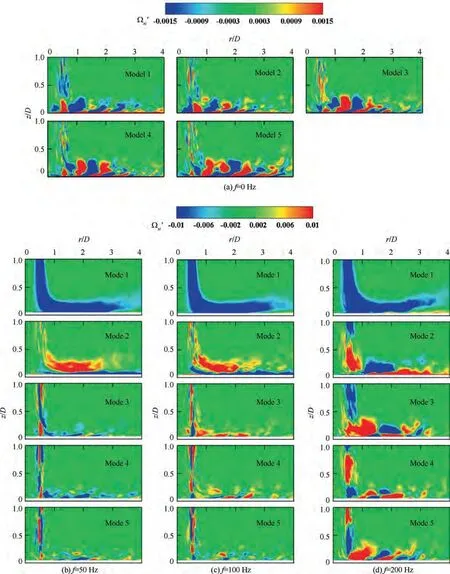
Fig. 16 The first five modes for flow field.
Fig. 16 shows the patterns of the first five POD modes at different frequencies. When f = 0 Hz, as shown in Fig. 16(a), the first five modes were characterized by an alternating fluctuation, and the positive and negative vortices moved along the radial direction. These coherent vortices originated from the wall jet shear layer oscillations,which were identified based on similar motions presented in previous work.The difference among these modes was the location of the vortices.The vortices in Modes 1 and 2 mainly locate in r/D <1,which matched with the fluctuation caused by the primary vortices in the free jet shear layer and stagnation region. As r/D>1,the coherent vortices broke down and generated some small vortices. The vortices in Modes 3-5 were mainly located in r/D > 1, representing the fluctuation in the wall jet region.
When the impinging wall vibrated, as shown in Fig. 16(b)-(c), some differences were observed at the flow field modes.Large vortices in the shear layer were captured in Mode 1 and Mode 2,and these vortices were not discovered in the static wall case. These motions were the manifestation of the larger fluctuation caused by the upward and downward movements during vibration. Because the fluctuation caused by the vibration was greater than that in its inherent characteristic, the strong unsteady motions could be found in Modes 1 and 2, which had the largest contribution of the fluctuation.Similar alternating fluctuation present in the static wall case only could be identified in Modes 3-5 under vibration conditions. However, with the introduction of the vibration, the direction of the alternating motion changed from the radial to the vertical, such as Mode 5 for f = 100 Hz, and Mode 3 and Mode 4 for f = 200 Hz. These vertical alternating fluctuations caused the energy dissipation in the vertical direction,which consequently caused the suppression of the vortex development in the wall jet region.
In addition, with the increase of the vibrating frequency,there were some differences in the pattern of mode motions.When the vibrating frequency increased from 50 Hz to 200 Hz, the large vortex in the free jet region representing the primary vortex became increasingly obvious, as presented in Mode 2. This phenomenon corresponded to the instantaneous flow field. The higher the frequency was, the larger the primary vortex could be. Furthermore, the contribution level of the vertical alternating fluctuation mode varied with different frequencies. When at f = 100 Hz, the vertical alternating fluctuation mode was only present in Mode 5 with a low contribution level. However, at f = 200 Hz, the vertical alternating fluctuation modes were in Mode 2 and Mode 3 with a high contribution level.
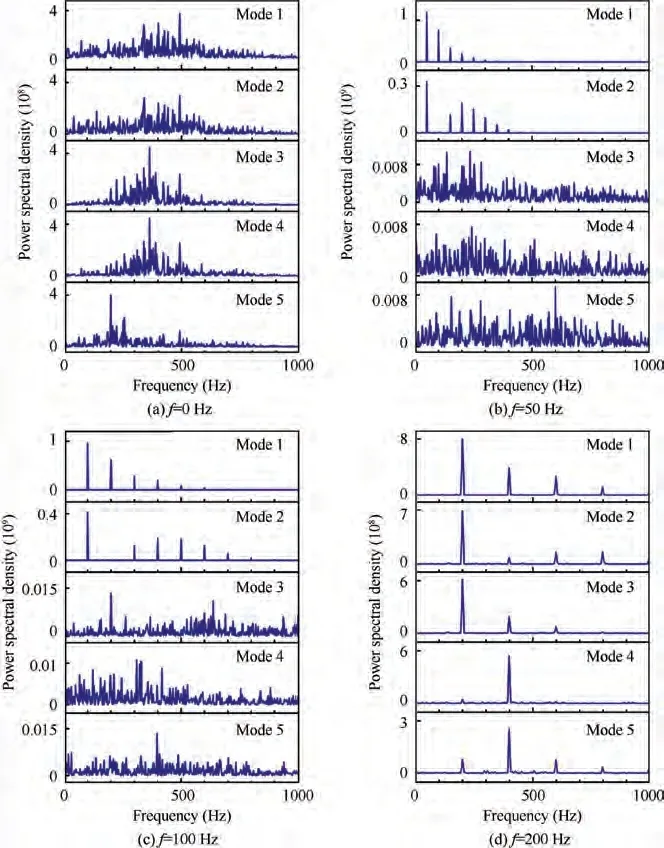
Fig. 17 Time coefficient spectra of the first five flow field modes.
To understand the meaning of each mode, the time coefficients for the first five POD modes were also analyzed, as shown in Fig. 17. Due to the nonlinear and chaotic vortex structures caused by the wall shear layer oscillations, no dominant frequency could be identified from the static wall modes.However, this phenomenon changed with the introduction of the vibration. Both Mode 1 and Mode 2 exhibited the dominant frequency, which was the same as the vibration frequency. This also confirmed that the two modes were induced by the vibration. The dominant frequencies in Modes 3-5 were relatively complex. In the vertical alternating fluctuation modes (i.e. Mode 5 in f = 100 Hz and Modes 3-4 in f = 200 Hz), the dominant frequencies were either the same or they had the same harmonic as the vibrating frequency,which means that these modes were also controlled by vibration. For the other modes, the modes represented the characteristics of the impingement flow. Thus, no dominant frequency could be found in the time coefficient spectra.
In summary,Modes 1 and 2 with large vortices,which were related to vibration,could be introduced to the flow fluid.The two modes accounted for the large contribution of the fluctuation,resulting in a fast response to the vibration.In these two modes, the large vortex, corresponding to the primary vortex,became increasingly obvious as the frequency increased. In addition, with the introduction of the vibration, the direction of the alternating motion changed from the radial to the vertical, which resulted in the suppression of the vortex development in the wall jet region. With the increase of the frequency, the contribution of the vertical alternating fluctuation became larger, and the suppression effect also became increasingly obvious,which had been observed in the instantaneous flow field.
The mode patterns contained in the wall heat transfer are presented in Fig. 18, which represent the information about the fluctuation of heat transfer. The plus value means higher than the mean Nusselt number, that is, the unsteady feature causes the enhancement of heat transfer. Conversely, the minus value means lower than the mean Nusselt number, that is,the unsteady feature causes the suppression of heat transfer.When f = 0 Hz, as presented in Fig. 18(a), the large fluctuation regions in Modes 1-4 were mainly located in the stagnation region (r/D < 1), which could be considered the footprints left by the primary vortex (i.e. Modes 1 and 2 in Fig. 16(a)). Modes 1 and 2 of the heat transfer represented the different phase motions of the primary vortex,and Modes 3 and 4 were the footprints left by the fragmentation of the primary vortex into a smaller vortex.Mode 5 represented the fluctuations in the wall jet region. According to Modes 3-5 in the fluid mode,the shear layer oscillation was nonlinear and chaotic. Thus, Mode 5 did not have a distinctive pattern. There were only some sporadic clusters of heat transfer fluctuation on the wall jet region.
The heat transfer modes for f=50,100,200 Hz are shown in Fig. 18(b)-(d). With the introduction of the vibration, an organized pattern with a ring streak in the wall jet region could be found in the modes, such as Mode 5 at f = 100 Hz and all modes at f=200 Hz.The ring streak patterns were believed to be the contribution of the vertical alternating fluctuation mode in the fluid modes. These vertical alternating fluctuations suppressed the vortex development in the wall jet region, which caused the decrease of the heat transfer.
The contribution proportion of the vertical alternating fluctuation mode in the flow field varies from the frequency.Thus,the heat transfer modes also changed with the vibrating frequency. When f = 50 Hz, due to the small influence of the vibration on the flow filed,the mode of heat transfer was close to that of f = 0 Hz. When f = 100 Hz, the organized ring streak pattern could be discovered in Mode 5. The fluctuation caused by vibration was gradually identified from these modes.When the vibrating frequency increased to 200 Hz, an organized ring streak pattern distribution was presented in each mode. In that case, the fluctuations of the heat transfer were mainly dominated by the vibration. However, the fluctuations of the impingement flow could also be found in the stagnation region (r/D <1) of Modes 3-5. In Modes 3-5, a similar pattern to those of other vibrating frequencies could be found in the stagnation region, while the positive and negative ring streak only existed for f = 200 Hz beyond the region of r/D = 1.
The profiles of the time coefficient for the first five POD modes are plotted in Fig. 19. For f = 0, 50 Hz, the wall heat transfer dominated by the unsteady structure is still contained in the intrinsic impingement flow,hardly affected by vibration.According to the flow field modes, as shown in Fig. 16, the modes at f = 0 Hz and 50 Hz mainly represent the wall shear layer oscillations. The nonlinear and chaotic vortex structures in shear layer usually have no dominant frequency.Thus,there was no dominant frequency in the first five modes for the two cases.When f=100 Hz,the jet flow properties appeared in the frequency spectra of the first four modes.In Mode 5,the dominant frequency was the same as the vibrating frequency,which confirmed that this mode was dominated by the structure induced by vibration. When the frequency increased to 200 Hz, due to the same frequency being recognized from the spectrum as the vibration, each mode was believed to represent the vibration contribution to the wall heat transfer.
Compared with the flow field modes, the contribution corresponding to Modes 1 and 2 induced by vibration could not be found in the heat transfer modes. The flow structures in Modes 1 and 2 were mainly located in the outer layer of the shear layer boundary, and they had little contribution to the heat transfer.The heat transfer performance was mainly characteristic for the flow structure near the wall. Due to the absence of Modes 1 and 2 for the heat transfer, the unsteady heat transfer results exhibited a less evident effect on the vibration. For other modes, the contribution proportion of the structure induced by vibration increased with the increase of the frequency. Thus, as the vibration frequency increased,the dominant frequencies of the heat transfer became more obvious, and the frequency domain narrowed and contracted to the vibration frequency region.
3.4. Overall evaluation of vibration
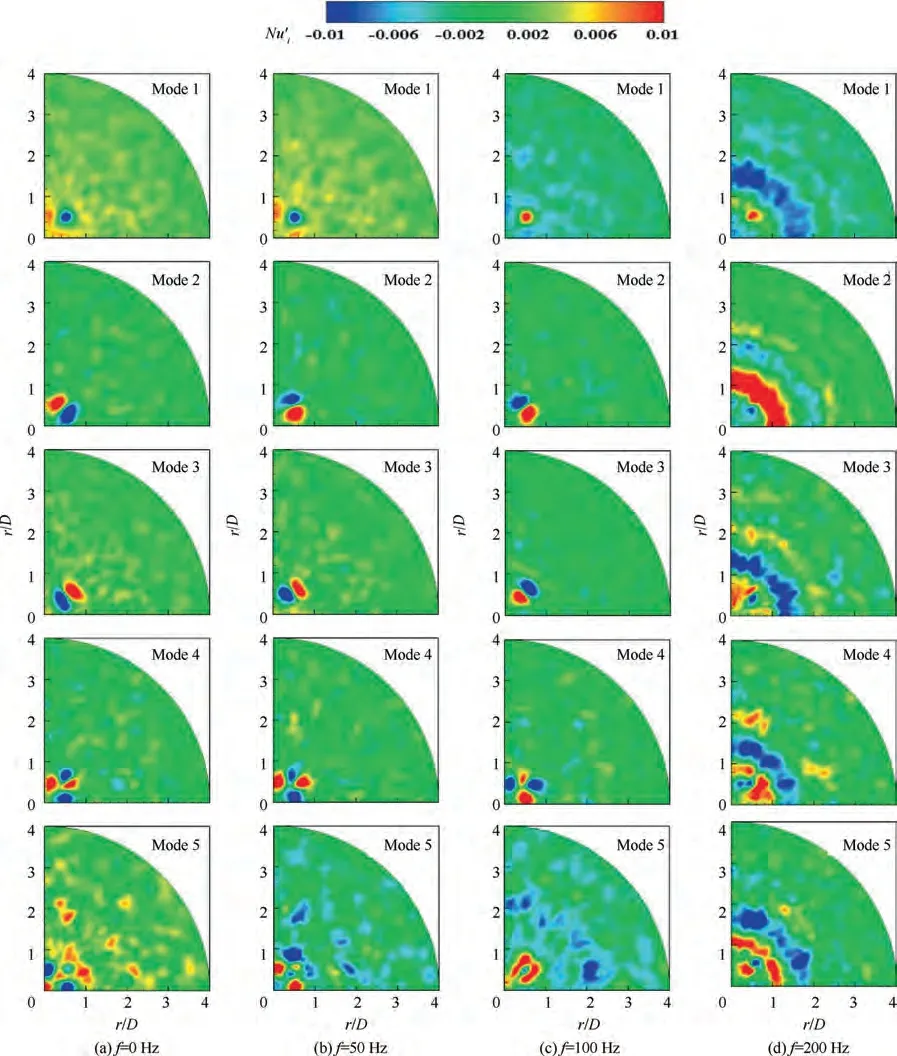
Fig. 18 The first five modes for heat transfer.
The overall evaluation of area averaged Nusselt number for different vibration frequencies are presented in Fig. 20. Compared with the results of static wall and empirical correlations,the area averaged Nusselt number could be enhanced within r/D = 1 by vibration and the magnitude of the enhancement became larger as f increased from 0 Hz to 200 Hz.The maximum enhancement of the area averaged Nusselt number could reach up to 5% at f = 200 Hz. The area averaged Nusselt number within r/D = 2 was equal to each other under different frequencies. However, for the area averaged Nusselt number beyond r/D=3,the vibration played an unfavorable role in heat transfer. The maximum suppression of the area averaged Nusselt number could reach up to 9.21%at f=200 Hz.Meanwhile,it also implied that the suppression of heat transfer in the wall jet region was greater than the enhancement of heat transfer in the stagnation region.
These changes could be attributed to the modification of vortices by vibration and the contribution of these vortices to the heat transfer. Through the unsteadiness properties and POD analysis, the parallel velocity direction between the free jet and the vibration promoted the generation of the primary vortices, which was beneficial to the heat transfer in the stagnation region. However, the perpendicular velocity direction between the wall jet and the vibration restrained the evolution of the vortex system along the wall, thus suppressing the heat transfer in the wall jet region.In addition,the contributions of the modes standing for different vortices to heat transfer were different when the vibration frequencies increased from 0 Hz to 200 Hz. The contribution proportion of the modes controlled by the vibration was directly proportional to the vibrating frequency. Thus, the magnitude of heat transfer enhancement or suppression was increased with the increase of the vibration frequency.
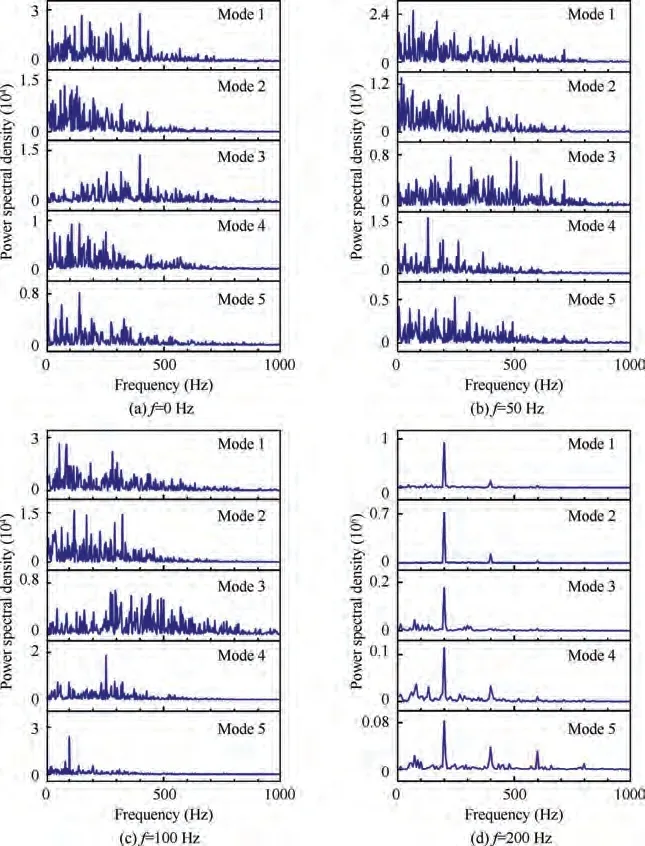
Fig. 19 Time coefficient spectra of the first five heat transfer modes.
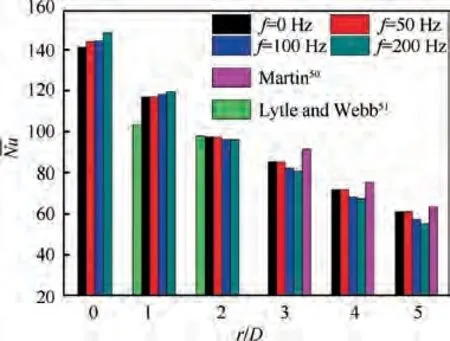
Fig. 20 Evaluation of area averaged Nusselt number.
4. Conclusions
A high-resolution simulation of jet impingement was performed to quantify the unsteady behavior of the flow field and heat transfer under vibration conditions. The mean and unsteady results were analyzed in this research, and the main conclusions are drawn as follows:
(1) Compared with the static wall case, the maximum enhancement of the stagnation point and area averaged Nusselt number within r/D = 1 could reach up to 5%due to the larger primary vortices, whereas it could reduce the heat transfer by 10% beyond r/D = 3 due to the suppression of the wall vortices development.
(2) Large fluctuations of the heat transfer could be found in the stagnation region(r/D <1)and the secondary peak region (1.5 <r/D <2.3). Based on the instantaneous results and the fast Fourier transform analysis, with the introduction of the vibration,the unsteady turbulent convection transformed from a highly turbulent and chaotic state to an orderly and organized state.
(3) The primary vortices and the alternating motion caused by the wall shear layer oscillation were identified through the POD decomposition. The introduction of the vibration promoted the development of the primary vortices and changed the radial alternating motion to a vertical alternating motion at the wall jet region. The former was beneficial for the heat transfer,while the latter was unfavorable.
(4) The ring streak fluctuation mode of heat transfer could be identified due to the unsteady structure dominated by the vibration.Through the time coefficients analysis,the modes controlled by the vibration were recognized, and their contributions to the heat transfer performance were also evaluated. The contribution proportion of the modes controlled by the vibration was directly proportional to the vibrating frequency.
The authors declare that they have no known competing financial interests or personal relationships that could have appeared to influence the work reported in this paper.
The authors gratefully acknowledge the financial supports for the project from the National Major Science and Technology Projects of China (2017-III-0010-0036). In addition, Xingsi Han acknowledges the support of the Jiangsu Specially Appointed Professor Program of China.
