Cooperative fault detection and recovery in the GNSS positioning of mobile agent swarms based on relative distance measurements
Qifeng CHEN, Yunhe MENG, Song LI, Yuxin LIAO,*
a School of Aeronautics and Astronautics, Central South University, Changsha 410083, China
b School of Physics and Astronomy, Sun Yat-sen University, Zhuhai 519082, China
KEYWORDS Fault detection and recovery;Global Navigation Satellite System;Mobile agents;Network topology;Positioning
Abstract Relative measurements are exploited to cooperatively detect and recover faults in the positioning of Mobile Agent(MA)Swarms(MASs).First,a network vertex fault detection method based on edge testing is proposed.For each edge,a property that has a functional relationship with the properties of its two vertices is measured and tested.Based on the edge testing results of the network,the maximum likelihood principle is used to identify the vertex fault sources.Second,an edge distance testing method based on the noncentral chi-square distribution is developed for detecting faults in the Global Navigation Satellite System (GNSS) positioning of MASs. Third, a recovery strategy for faults in the positioning of MASs based on distance measurement is provided. The effectiveness of the proposed methods is validated by a simulation case in which an MAS passes through a GNSS spoofing zone.The proposed methods are conducive to increasing the robustness of the positioning of MASs in complex environments.The main novelties include the following:(A)network vertex fault detection is based on concrete probability analysis rather than simple majority voting, and (B) the relation of detectability and recoverability of MAS positioning faults with the structure of the relative measurement network is first disclosed.
1. Introduction
With the rapid development of artificial intelligence, sensor,network communication and device miniaturization technologies, cooperative operations using microminiature Mobile Agent (MA) Swarms (MASs) have become a trend and are advantageous for improving performance, reliability and adaptability and reducing costs. MASs, including Unmanned Aerial Vehicle (UAV) swarms, spacecraft swarms and robot swarms, are being increasingly studied and applied.
MASs achieve cooperation in performing tasks through movement coordination, where the real-time positioning of swarming MAs is the basis. Global Navigation Satellite System (GNSS) positioning is a low-cost, generally applicable method for positioning microminiature MAs and has thus been extensively employed. However, MASs are often operated in complex or hostile environments, where GNSS measurement frequently faces uncertainties such as disturbances,signal loss or even spoofing. Under these circumstances, it is imperative to effectively detect GNSS positioning faults and recover positioning data. Unlike with other sensors, GNSS positioning faults are, in most cases, not hardware malfunctions but instead involve performance degradation and abnormal positioning errors. The current research on GNSS positioning faults focuses mostly on the detection of GNSS positioning anomalies (e.g., carrier phase anomalies, antenna obstruction and signal attenuation and multipath effects)based on signal analysis. The Receiver Autonomous Integrity Monitoring (RAIM) method utilizes the device redundancy of Inertial Navigation Systems (INS) and the comparison of multiple filters to forecast the positioning faults and usability of GNSS.However, sophisticated methods for detecting and recovering from GNSS positioning faults, such as RAIMs,face difficulty when used on small-sized MAs due to their cost and complexity.
Cooperative measurements by inexpensive onboard sensors, such as cameras and laser rangefinders, can be used together with the positioning information of each agent to detect and recover the positioning faults of an MAS.This topic has not yet received much attention,although it shows promise for improving the robustness of MASs in complex environments. Bento et al. investigated the use of vehicle-borne cameras to measure road boundaries and the use of cooperative measurements from multiple vehicles to improve Global Positioning System (GPS) accuracy.Heredia et al. detected positioning faults that could not be discovered by the fault detection system of a single UAV (e.g., slowly growing positioning errors) from images of the same planar scene taken by multiple UAVs.Liu et al. investigated a method for estimating the positioning error of the INS of each aircraft in an aircraft swarm based on interaircraft distance measurements as well as the translation and rotation of geometric patterns.Qu and Zhang studied the recovery of the positioning data of a UAV that lost the GPS positioning signal by using the normal GPS positioning of three nearby UAVs and relative distance measurements.Based on distance measurements taken by UAVs in a swarm, Wan et al. calculated the a posteriori distribution of UAV positions using a dynamic nonparametric belief propagation algorithm, thereby realizing the cooperative positioning of faulty UAVs.In contrast to the method in Ref.10,the method in Ref.11 can recover the positioning of UAVs when there are fewer than three nearby UAVs with normal GPS positioning capacity. However, the cooperative positioning study described in Refs. 10,11 neither involved GNSS fault detection/identification nor took into account the relationship between swarm fault recoverability and topology. Suarez et al. identified the faults in the position and attitude measurements of multiple UAVs in a fleet based on each UAV’s visual measurements of the other UAVs and determined the fault sources based on the numbers of faults reported by the observer UAVs.However, the impacts of the measurement topology, the probability of false reports,and inconsistencies in the reports of multiple UAVs were not discussed.
For Wireless Sensor Networks(WSNs),the rapid detection and isolation of faulty sensors are important to service quality and have thus been extensively studied.Single-sensor detection methods and multisensor cooperative detection methods have both been developed.The detection of faults in single-sensor measurement relies on current detection data (e.g., a modified three-sigma detection method proposed by Panda and Khilar.) or the temporal correlation in historical sensor data.Multisensor cooperative fault detection is performed between neighboring sensors. Whether a fault occurs is determined by examining whether the difference in sensor readings exceeds the preset threshold based on the spatial correlation among sensor measurements.Generally,the neighbor majority voting method is used to determine the fault sources in a network.However, these direct majority voting or weighting methods fail to take into consideration the error probability of the threshold determination and the effects of the network structure on fault detectability.
To determine sensor positions, cooperative localization in WSNs has been extensively studied.A few sensors with known positions are referred to as anchors, and the unknown positions of a large number of sensors in the network can be determined using intersensor distance measurements and anchor positions. In the cooperative localization of WSNs,anchor positions need to be intentionally selected, the sensors are stationary, and not all the sensors need to be correctively localized. However,the recovery of fault positioning in MASs differs from the localization of WSNs in three aspects: (A)MAs move continuously; (B) the distribution of the positions of normal vertices used for fault recovery and positioning is uncontrollable; (C) each MA needs to be correctly localized,or otherwise,there may be catastrophic consequences.Therefore, the localization methods for WSNs cannot be directly used for the positioning recovery of MASs.
The present study exploits relative distance measurements to detect and recover GNSS positioning faults of MASs and offers three main contributions. First, a network vertex fault detection method based on edge testing is proposed.The maximum likelihood principle that the probability of network edge testing results should be maximized is used to identify the fault vertices. Second, noncentral chi-square distribution-based hypothesis testing is performed for edge distance testing in the detection of faults in GNSS positioning of multiple MAs in a range-finding network. Third, a strategy for recovering the faulty GNSS positioning data using measurements of relative distance between MAs is presented. In contrast to related research, the proposed network vertex fault detection method is based on concrete probability analysis rather than simple majority voting. The relation of the detectability and recoverability of MAS positioning faults to the structure of the relative measurement network is revealed, which has not been previously reported.
The remainder of this article is organized as follows. Section 2 presents a network vertex fault detection method based on edge testing. Section 3 provides an edge distance hypothesis-testing method for the GNSS positioning fault detection in MAs.Section 4 examines the recovery of the positioning data for faulty vertices in a range-finding network.Section 5 examines the correctness and effectiveness of the proposed fault detection and recovery methods through a simulation case study in which an MAS passes through a GNSS signal spoofing zone.
2. Network vertex fault detection based on edge testing
2.1. Problem description
The problem is detecting faults in the measurement of the dynamic properties of multiple agents.A fault may occur when measuring a certain dynamic property of each agent in real time. Because the properties of agents undergo constant changes, it is difficult to determine online if there is a fault in the measurement of one of the properties of a single agent based solely on their measured values. For any two agents, if there is a measurable variable that is in a functional relationship with their dynamic properties, this variable can be used to crossvalidate whether or not the measurements of the properties of the two agents are normal. For example, the relative distance measurement can be used to check if the position measurements of the two agents are normal.
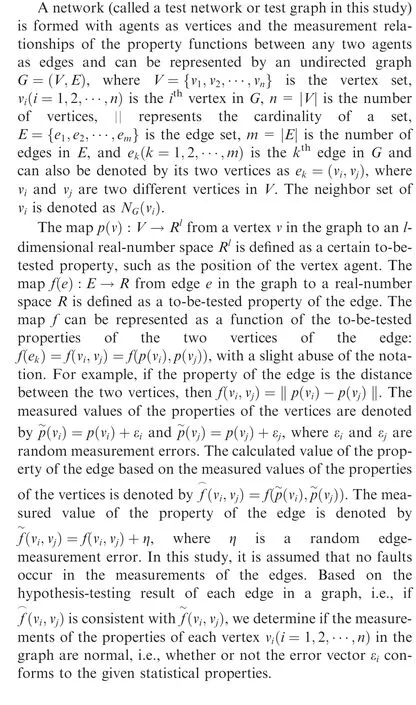
The fault detection process involves two stages,namely,the edge testing stage and the synthetic detection stage. The hypothesis-testing method is used to determine if single edges are normal in the edge testing stage. False and missed alarms may occur. A false alarm refers to the situation in which an edge (v,v) is determined to be abnormal when the measurements of the vertices vand vare normal. The probability of the occurrence of a false alarm is denoted by P. A missed alarm refers to the situation in which an edge (v,v) is determined to be normal when a fault occurs in the measurement of vertex vor v.The probability of the occurrence of a missed alarm is denoted by P. The false and missed alarm rates for single-edge testing can be obtained through probability analysis or Monte Carlo simulation.The method of single-edge testing and the false and missed alarm rates depend on the application and are not discussed in this section. The results of single-edge testing can show whether a fault occurred in the measurement of its two vertices but cannot determine which vertex has the faulty measurement. A maximum likelihood synthetic determination of the vertex state using the edge testing results is presented in this section.
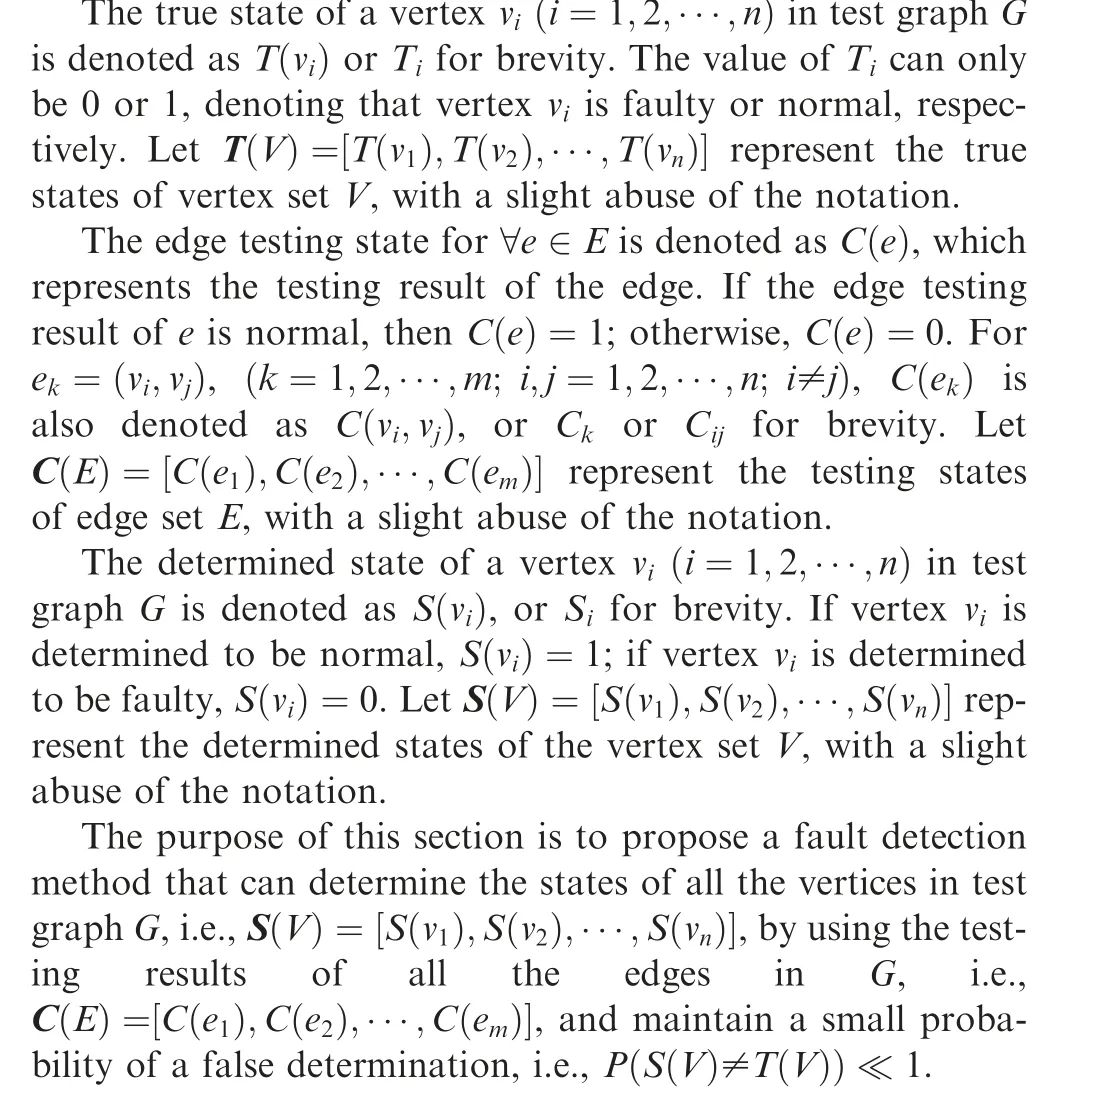
2.2. The maximum likelihood detection method
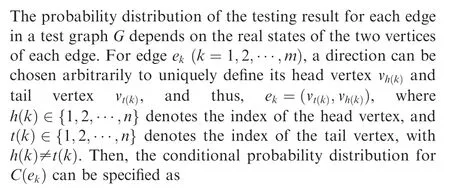
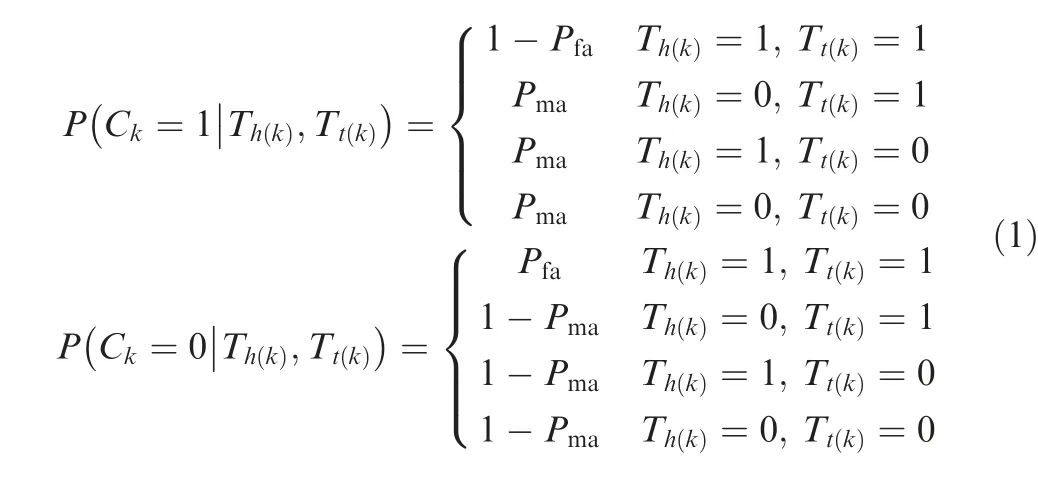
In Eq. (1), the difference between the missed alarm rates under simultaneous faults of the two vertices and under single vertex fault is neglected.Although no rigorous analysis can be provided here, there are several reasons and assumptions to support this simplification.First,for a reliable single-edge testing method,the missed alarm rate should be small.Otherwise,the edge testing results cannot be adopted. Second, the faults of two vertices that are incident with an edge are assumed to be independent.For correlated vertex faults,additional analysis is provided in Section 2.4.Third,the conclusions in this section rely only on the relative dominance of the values of P,P, 1-P, and 1-P. Small variations in the value of Pdo not matter.
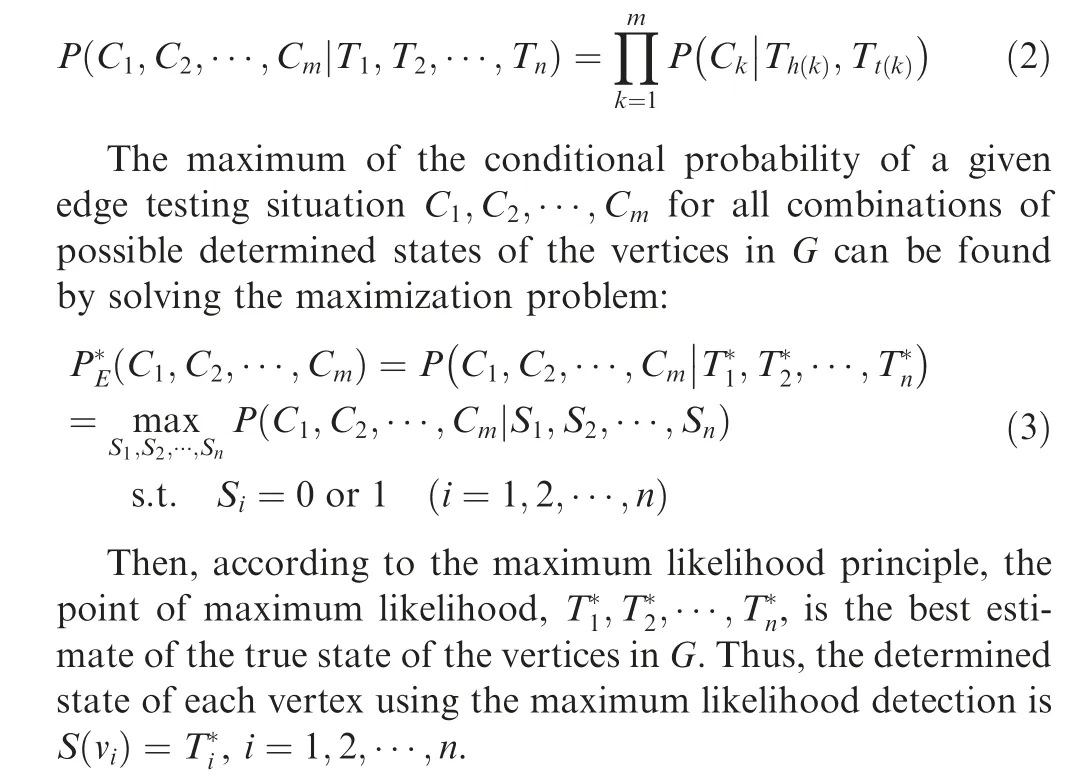
Given vertex states T,T,···,Tin test graph G, the conditional probability of the occurrence of an edge testing situation C,C,···,Cis denoted as
2.3. Detectability of network vertex faults
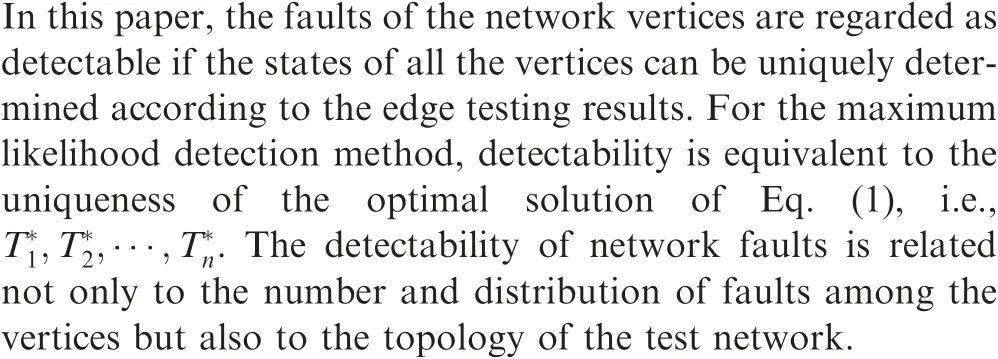

Lemma 1 is an obvious conclusion of Eq.(1).It shows that the state of one vertex of an edge does not impact the conditional probability of an edge testing result when the other vertex of the edge is faulty.
Theorem 1. The necessary condition for vertex set V in test graph G=(V,E) to be detectable under arbitrary fault modes using the maximum likelihood detection method is that each vertex in V must have at least one normal neighboring vertex.
Proof. Suppose that ∃v ∈V, for ∀u ∈N(v), T(u)=0 holds true. As seen in Eq. (2), the state of vertex v can only influence the testing result for the edges that are incident with v, i.e., the edges between v and all its neighbors. From Lemma 1, for∀u ∈N(v), the value of T(v) does not influence the conditional probability of the testing result of edge (u,v).Thus,the value of T(v)is not unique at the maximum conditional probability Pof the testing result of edge set E. Thus, the network fault is not detectable.
□
Theorem 2. If all vertices in V have at least one normal neighboring vertex, then the maximum probability for the occurrence of an incorrect determination of the state of any vertex in V will not exceed max{P, P} when using the maximum likelihood method to detect the faults in test graph G=(V,E) under arbitrary fault modes.
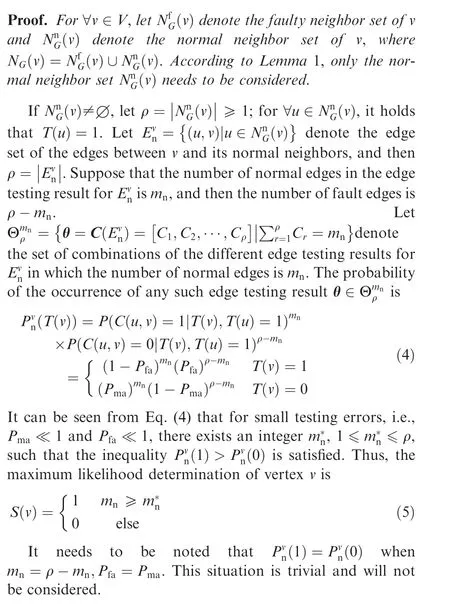
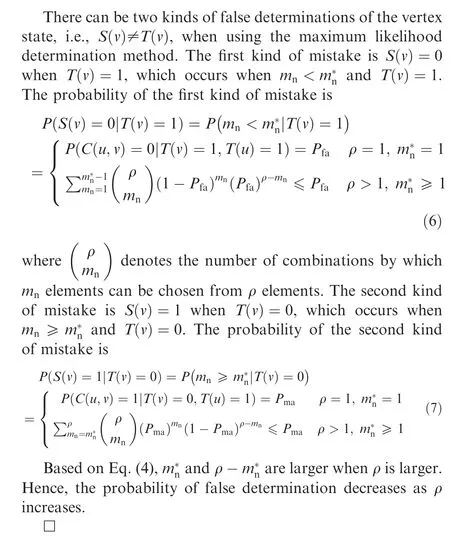
The condition in Theorem 1 and Theorem 2 that each vertex in V must have at least one normal neighboring vertex is not practical to check, because the states of the vertices are not known beforehand. An obvious situation that satisfies the necessary condition of Theorem 1 is presented in Proposition 1.
Proposition 1. Any vertex in a network must have at least one normal neighboring vertex if the number of faulty vertices is smaller than the minimum number of neighbors of the vertices in the network.
Proposition 1 and Theorem 2 can be used to design a network topology to ensure the detection of any vertex fault when the total number of faulty vertices does not exceed a given number.For an edge testing network with n vertices,each vertex has at most n-1 neighbors.Thus,the detection of at most n-2 vertex faults can be ensured.
2.4. A detectability analysis for correlated vertex faults

2.4.1. Correlated faults with the same mean value
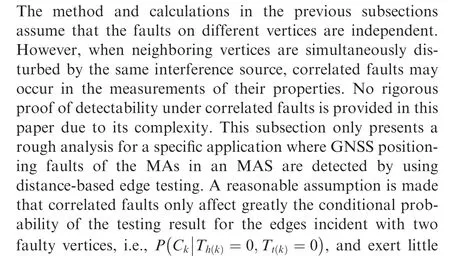
This kind of fault occurs when a single source of signal dominates the measurements of more than one vertex in such a way that their measurements have the same mean value. For example, a spoofing source of a GNSS signal broadcasts constant false positioning information,and any MA influenced by the spoofing signal will resolve a position measurement with a mean value of the same false spoofing position plus a random error. Under this condition, the measured edge property will not be in agreement with the measurements of the two correlated faulty vertices incident with the edge with a high probability close to 1. Thus, the probability distribution of the edge testing results for correlated vertex faults is very close to that for the independent vertex faults, as shown in Eq. (1). Hence,the detectability conditions given in Theorem 2 and Proposition 1 are still applicable.
2.4.2. Correlated faults with a common deviation of mean value
This kind of fault occurs when a single source of signal influences the measurements of more than one vertex in such a way that their measurements deviate by a common value.For example, a spoofing source of a GNSS signal broadcasts constant false deviation information, and any MA influenced by the spoofing signal will resolve a position equal to its normal measurement value plus the common spoofing deviation value. Due to the functional structure of the relation between the edge distance property and the vertex position property,the common deviation of the measurement values of the two correlated faulty vertices is cancelled in estimating the distance of the edge incident with them.Thus,the conditional probability of the testing result for an edge incident with two correlated faulty vertices equals that of an edge incident with two normal vertices.Let the set of edges incident with two normal vertices be denoted as E,the set of edges incident with two correlated faulty vertices be denoted as E, and the set of edges incident with a faulty vertex and a normal vertex be denoted as E,with E∪E∪E=E.According to the conditional probability distribution under correlated faults, the probability of the occurrence of the edge testing result that C(E)=1,C(E)=1, and C(E)=0 is much higher than other possibilities,where 1 is a row vector for which each element is 1,and 0 is a row vector for which each element is 0. The conditional probability of the occurrence of this dominated edge testing result can be computed as

where V, V, and Vare the sets of vertices that are incident with the edges in E, E, and E, respectively.
Here, in a simplified analysis, it is assumed that vertices with the same true state have the same determined state.Then,there are four possible determination results.They are given in the following. The conditional probability value of Eq. (8) is calculated for each result using the probability distribution of Eq. (1) in the same way as if all faults are independent:
(1) All the faulty vertices are determined to be faulty, and all the normal vertices normal:
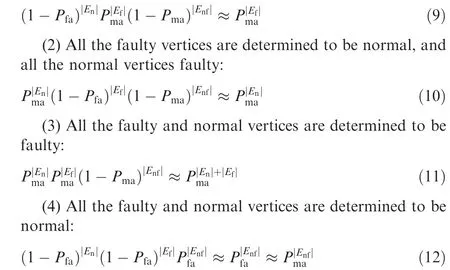
The approximations in Eqs. (9)-(12) are made under the reasonable assumption that the false and missed alarm rates for single-edge testing are relatively low and are close to each other.To obtain the correct determination result,according to the maximum likelihood principle,it is necessary to ensure that the conditional probability for case (1) is the highest. The required conditions are as follows:

i.e.,the number of edges between the faulty vertices in the testing graph is smaller than the number of edges between the normal vertices and is smaller than the number of edges between the normal and faulty vertices. Although |E|, |E|, and |E|cannot be known in fault detection,it can be roughly assumed that the number of edges between the faulty vertices is proportional to the number of faulty vertices, and the number of edges between the normal vertices is proportional to the number of normal vertices. Then, to meet the conditions of Eq.(13), the number of faulty vertices in the network should be smaller than that of normal vertices,or more reliably,the proportion of faulty vertices in the network should be sufficiently low.
3. Distance-based edge testing for detecting GNSS positioning faults
In this section, noncentral chi-square distribution-based hypothesis testing is applied for edge testing of the detection of faults in GNSS positioning of MASs using distance measurements.
3.1. Distance-testing problem
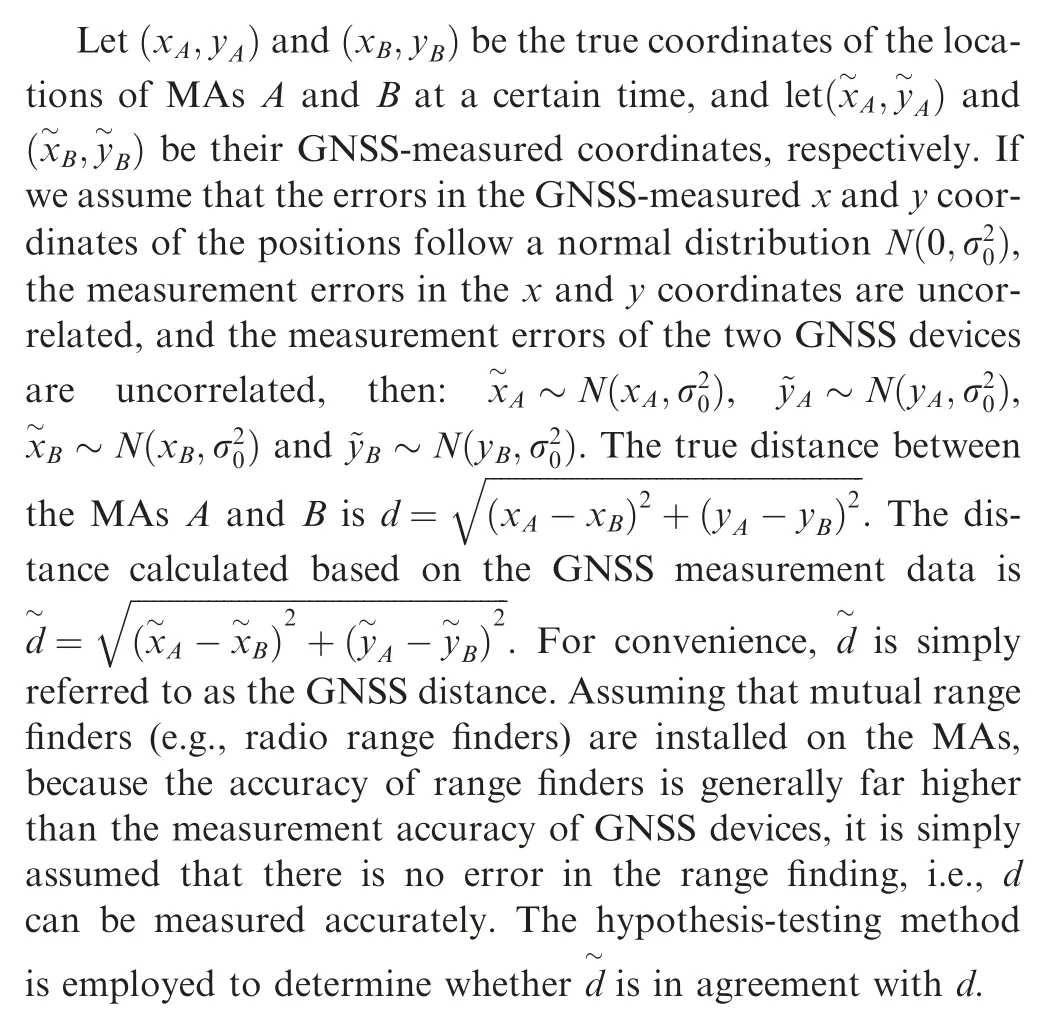
To simplify the problem description and highlight its key points, a Two-Dimensional (2D) positioning problem is considered. However, the fault detection algorithm based on single-edge distance testing given in this section and the positioning fault recovery method provided subsequently can both be extended to Three-Dimensional (3D) space problems. The algorithm given in Section 2 is also unrestricted by space dimensionality.
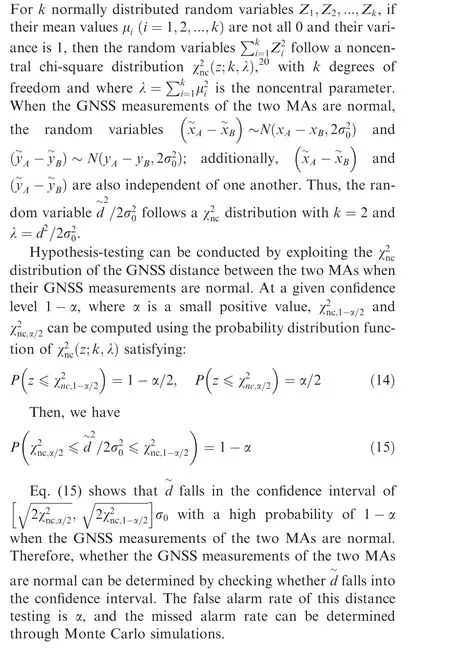
3.2. Noncentral chi-square distribution-based distance testing
3.3. Simulations of single-edge distance testing
For each type of fault,two fault modes are taken into consideration. In the first mode, only one of the two MAs is abnormal in GNSS positioning, while in the second mode,both MAs are abnormal. Tables 2-5 summarize the statistical results for missed alarm rates obtained from Monte Carlo simulations performed under various d, δ, σ, fault type, and fault mode conditions after 100,000 sampling iterations.
Some trends are indicated by the simulation results.For the same distance between the MAs, the statistical missed alarm rate decreases significantly with increasing fault magnitude.For the same fault magnitude, the missed alarm rate changes nonsignificantly with increasing distance between the MAs.The greater the fault magnitude, the smaller the difference between the missed alarm rate under a fault at one vertex and the missed alarm rate under faults at both vertices. The missed alarm rates for mean faults and variance faults can be reduced to the level of the false alarm rate only when the fault magnitude of the GNSS measurement exceeds approximately 50 times the normal standard deviation.Therefore,this distance-testing method is applicable to situations where there are relatively large fault magnitudes, e.g., active interference and signal spoofing of the GNSS signal, because the goal of this type of interference and spoofing is to significantly deviate the MA from its target.
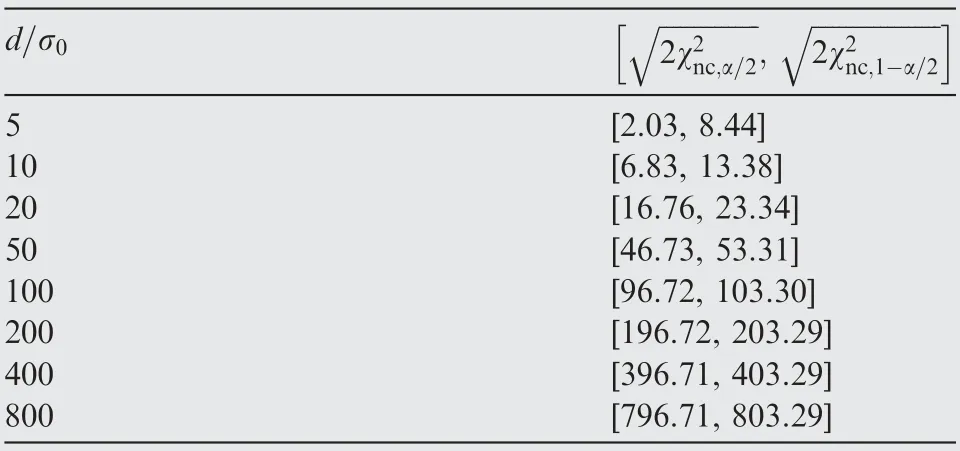
Table 1 Confidence intervals (multiples of σ0) for distance testing.
3.4. Simulation of detection of faults in network vertex positioning based on edge distance testing
Here,a network with six stationary agents distributed in a regular hexagonal pattern with a side length of 1 km,as shown in Fig. 1, is used as an example. The method of network vertex fault detection based on edge testing is validated through Monte Carlo simulation. The Correct Detection Rate (CDR)for faults is used to evaluate the performance of the algorithm.CDR=N/N, where Nis the number of simulations in which the fault states of all the vertices are correctly determined and Nis the total number of Monte Carlo simulations.All the faults considered are mean faults. The remaining settings are the same as those for the simulations in Section 3.3.For single-edge testing, the missed alarm rate varies with the fault magnitude. The difference between the GNSS distance dand the measured distance d is used as an approximation of the fault magnitude. For simplicity, the missed alarm rates for all the edges are considered to be equal. Additionally, the small difference in the missed alarm rate between a fault at one vertex of an edge and faults at both vertices is not taken into consideration. The missed alarm rate Pfor single-edge testing is calculated by interpolation of the data from Table 3 at the largest distance deviation among all the edges.
Three fault types are taken into account. The first type comprises uncorrelated faults.The second type constitutes correlated faults with the same mean value, and the third type includes only correlated faults with a common deviation of the mean value (see the analysis in Section 2.4).
Three fault scenarios are established for the first type of fault: a fault occurs at agent No. 6; faults occur at agentsNo. 4 and 6 at the same time; faults occur at agents No. 2, 4 and 6 at the same time. Table 6 summarizes the Monte Carlo simulation results for the scenarios designed for the first type of fault.The following scenarios are set for each of the second and third types of faults: correlated faults occurring at agents No.5 and 6 at the same time and correlated faults occurring at agents No.4,5 and 6 at the same time.Tables 7 and 8 summarize the Monte Carlo simulation results for the scenarios designed for the second and third types of faults, respectively.For each scenario, 10,000 Monte Carlo simulations were performed.

Table 2 Statistics of missed alarm rates for mean faults at one vertex.

Table 3 Statistics of missed alarm rates for mean faults at both vertices.

Table 4 Statistics of missed alarm rates for variance faults at one vertex.
The following conclusions can be drawn from the simulation results:
(1) The greater the fault magnitude is, the higher the CDR is,because a greater distance deviation makes the abnormality more significant in edge testing.
(2) For the same type of fault,the fewer faulty vertices there are, the higher the CDR is.
(3) According to the detectability conditions given in Section 2.3, uncorrelated faults that occur at no more than three arbitrary vertices in this range-finding network can all be detected with high probability. The simulation results are in agreement with this analytical conclusion.
(4) The simulation results for correlated faults with the same mean value are consistent with the analysis in Section 2.4.1,that is,the CDR for correlated faults with the same mean value is close to the CDR for uncorrelated faults.
(5) The simulation results for correlated faults with a common deviation of mean value are consistent with the analysis in Section 2.4.2, that is, such correlated faults can be detected with a high probability only when there are more normal vertices than faulty vertices in the network.
4. Data recovery for faults in positioning of range-finding network vertices
Networked range-finding can be used not only to detect faults in the positioning of network vertices but also to recover the information on the positions of the faulty vertices. In this section, the recoverability of the MAS positioning fault data based on relative distance is analyzed. Then, a strategy for recovering the positioning data for faulty (including undetermined) vertices is provided.
4.1. Analysis of positioning fault recoverability
The positioning fault recoverability for range-finding network vertices refers to whether the positions of the faulty or undetermined vertices in a network can be uniquely determined based on the positioning data of the normal vertices and the measured distances between the vertices.Here,‘‘unique determination” is achieved under ideal conditions of no measurement errors. However, the presence of errors only affects the positioning accuracy but does not affect its uniqueness.For example, on a plane, the position of a point can be uniquelydetermined only by measuring the distances to three or more noncollinear points.

Table 5 Statistics of missed alarm rates for variance faults at both vertices.
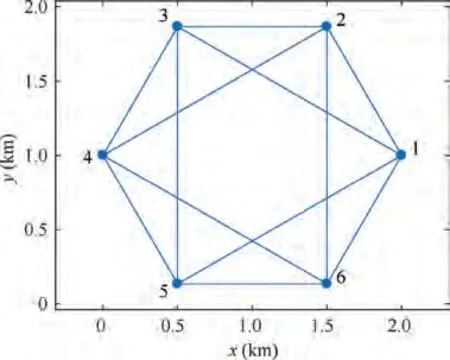
Fig. 1 A range-finding network and the distribution of its six agents.
4.1.1. Fault recoverability and unique graph realization
The positioning fault recoverability for range-finding network vertices can be regarded as a unique graph realization problem.The graph realization problem is to determine the relative positions of the vertices in a graph based solely on the distances between the vertices incident with each edge in the graph by mapping the vertices in the graph to an ldimensional Euclidean space.The uniqueness of a graph realization ensures that the relative position of each vertex obtained by mapping is unique.
The unique graph realization problem involves concepts such as the rigidity and global rigidity of graphs.The realization of a globally rigid graph in an l-dimensional space is unique, because any two realizations must be congruent, i.e.,they can completely coincide with one another through, at most,translations and rotations.For a rigid graph,its realization is not globally unique but is locally unique, i.e., two realizations must be congruent only when all the vertices in one realization are located near the corresponding vertices in the other realization. The existence of incongruent graph realizations demonstrates that the positions of unknown vertices cannot be uniquely determined based on the distances between the vertices and the position coordinates of some vertices.
A rigid graph can be validated using the rank of the rigidity matrix. The definition and representation of rigidity matrices can be found elsewhere.Additional rigid graph testing algorithms can be found in the literature(e.g.,Ref.21).Global rigidity criteria have also been extensively studied and are not discussed in detail due to the limited length of this article (see Refs. 21,22,26 for more information).
4.1.2. Conditions for recoverability of positioning faults
In the vertex positioning fault recovery of a range-finding network, two conditions need to be met to ensure the correct determination of the absolute positions of the faulty vertices.One is that the relative positions of the vertices can be uniquely determined based on the measured distances between the vertices,i.e.,there is a unique realization of the range-finding network graph.The other condition is that the information on the absolute positions of the normal vertices in the range-finding network graph can ensure that each vertex in the rangefinding network has a fixed absolute position in the Euclidean space where the network graph is realized.Static recovery and dynamic recovery are considered separately, and relevant recoverability conditions are provided.
Static recovery refers to the recovery of the positioning data for faulty MAs at a single moment based on the instantaneous positioning of all the MAs and their mutual range-finding information. In static recovery, the range-finding graph must be globally rigid to ensure the uniqueness of the relative positions. The uniqueness of the absolute position is ensured by sufficient normal positioning vertices. Thus, sufficient conditions for static recovery are provided.Proposition 2. The positioning of any faulty vertex in a rangefinding network is statically recoverable if the following two conditions are both met:(A)The range-finding graph is globally rigid. (B) For a 2D positioning problem, there are at least three normal vertices in the range-finding network with noncollinear coordinate positions; for a 3D positioning problem, there are at least four normal vertices in the range-finding network with noncoplanar coordinate positions.

Table 6 CDRs for uncorrelated positioning faults.

Table 7 CDRs for correlated positioning faults with the same mean value.

Table 8 CDRs for correlated positioning faults with a common deviation from mean value.
Dynamic recovery is a positioning recovery method that determines the positions of the faulty vertices at the current moment based on information on the positions of the normal vertices and the measured distances between the vertices at the current moment as well as the recovered positioning data for the faulty vertices at preceding moments. The recovered positioning data for the faulty vertices at preceding moments are used to predict the positions of the MAs at the current moment.The predicted positions are close to the true positions within a small time step. Because a rigid graph is locally unique, the unique relative positions of the faulty vertices can be determined by only ensuring that the range-finding graph is rigid on the basis of position predictions with small errors. Together with the requirement for unique absolute positions, sufficient conditions for dynamic recovery are complete.Proposition 3. The positioning of any faulty vertex in a rangefinding network is dynamically recoverable if the following two conditions are both met:(A)The range-finding graph is rigid.(B)For a 2D positioning problem, there are at least three normal vertices in the range-finding network with noncollinear coordinate positions; for a 3D positioning problem, there are at least four normal vertices in the range-finding network with noncoplanar coordinate positions.
Static recovery has a greater requirement for the topology of the range-finding network but requires no information other than the measurements at the current moment.Static recovery can still be reliably used when there are faults at the initial moment or when the positioning faults for the preceding moment were not correctly recovered. In contrast, dynamic recovery can be used to reduce the requirements for the topology of the range-finding network but requires correct or recovered positioning data of historical moments.
4.2. Positioning data recovery strategy
The fault recovery of MAS positioning requires a solution to be found in real time. A strategy that combines the independent and joint recovery of faulty vertices is adopted to speed up the computation for recovery. When there are no fewer than three normal vertices in a range-finding relationship with a faulty vertex (in a planar problem), the positioning data for the faulty vertex can be independently and rapidly recovered.In the swarm positioning fault recovery process, the positioning of each faulty vertex that can be independently recovered at each moment is first recovered, and then the recovered faulty vertices are treated as normal vertices.As a result,some other unrecovered faulty vertices may become independently recoverable. Independent recovery is continuously performed until all the faulty vertices have been recovered or there are no longer any faulty vertices that can be independently recovered.There are two possible scenarios for the remaining faulty vertices. One is that these faulty vertices are unrecoverable,which can be avoided by the use of a recoverable rangefinding network topology. Another possible scenario is that the faulty vertices are not isolated, i.e., some faulty vertices are adjacent to one another and form a faulty vertex group,in which any faulty vertex has no sufficient normal neighboring vertices for it to be independently recovered.Consequently,a joint recovery computation must be performed for such a faulty vertex group.
4.2.1. Independent recovery for the positioning data of faulty vertices
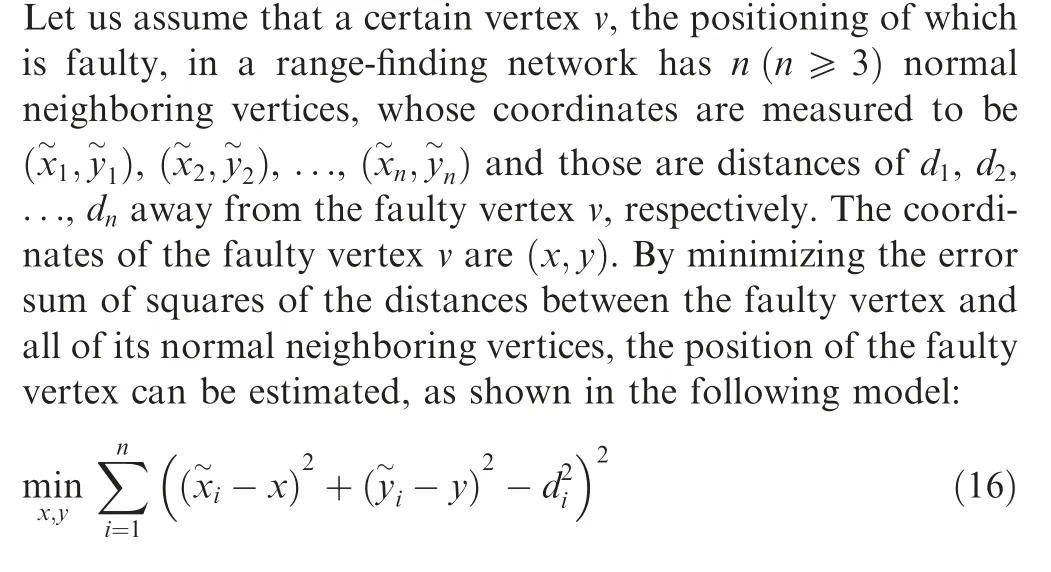
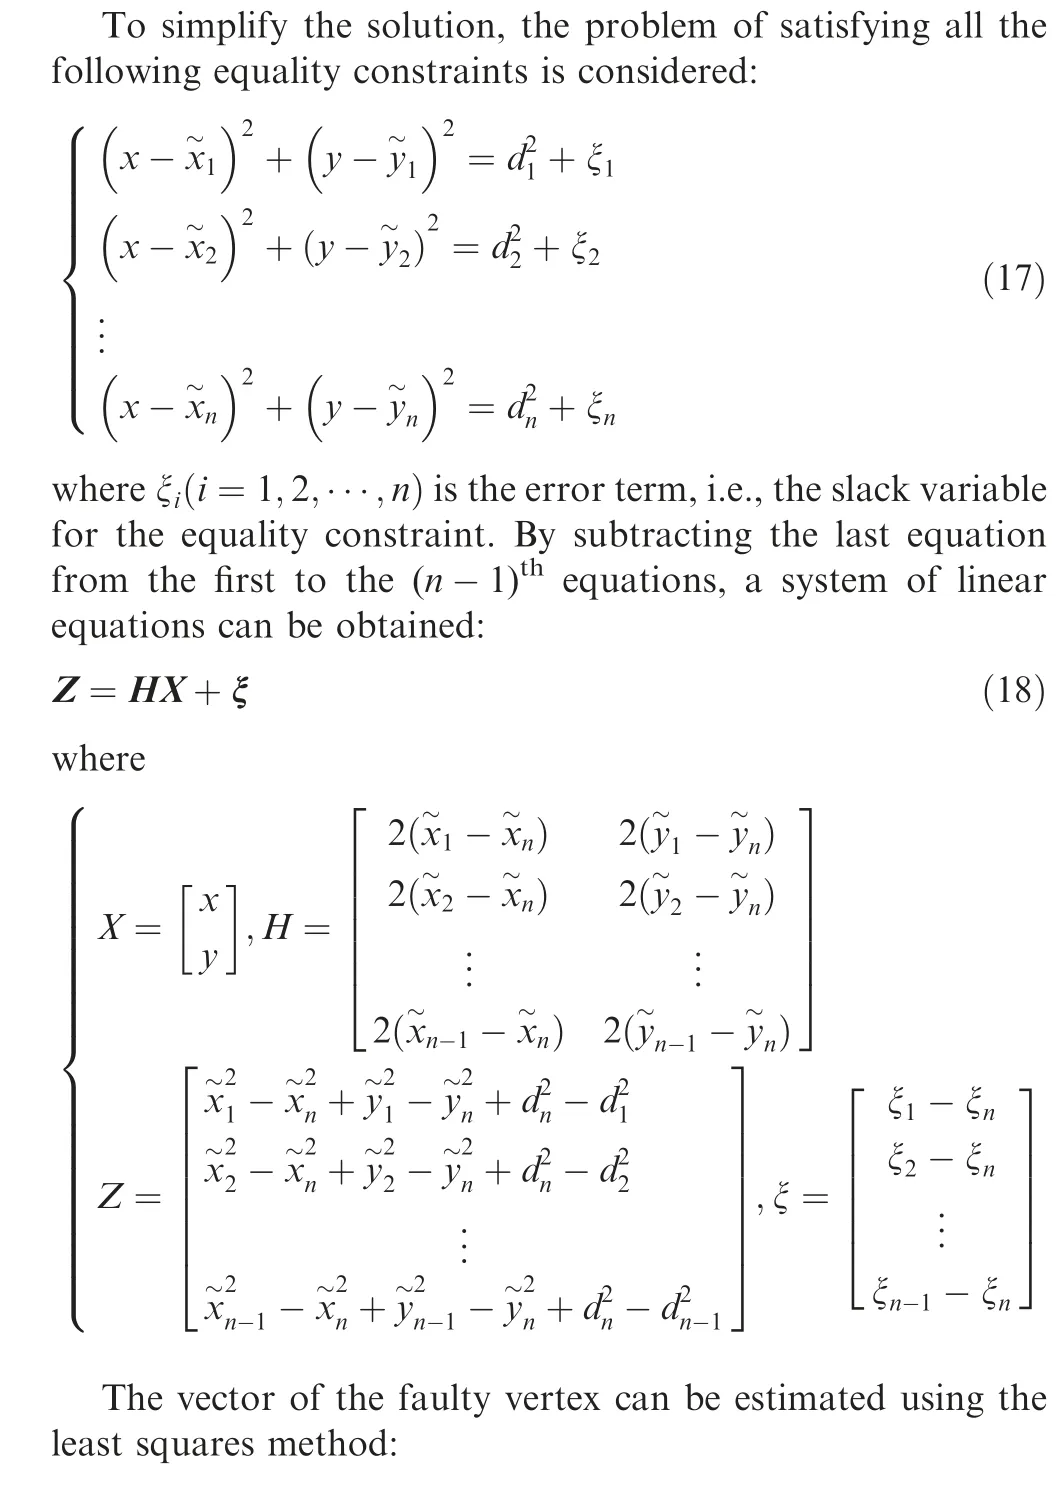
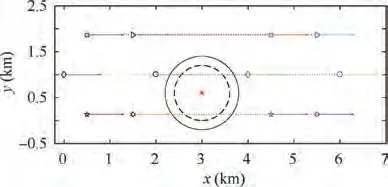
Fig. 2 Configuration and movement process of an MA formation.

Because the error vector ξ has relatively complex statistical properties, this estimate of the position is not optimal.Nonetheless, it is much easier to find a linear solution to Eq.(19) than to directly find an optimal solution to Eq. (16).
4.2.2.Joint recovery for positioning data of faulty vertex groups
The recovery of the positioning of the faulty vertices in the faulty vertex group is coupled, and it is necessary to use the normal vertices surrounding the faulty vertex group to jointly recover the positioning of its member faulty vertices. The information needed includes the positioning data for the surrounding normal vertices and the measured distances between the normal and faulty vertices and between the faulty vertices.
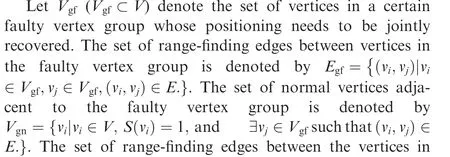
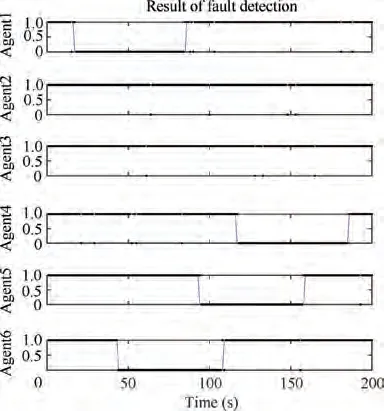
Fig. 4 Fault detection results for MAs under topology A.

Fig. 3 Relative range-finding topologies of MA formation.

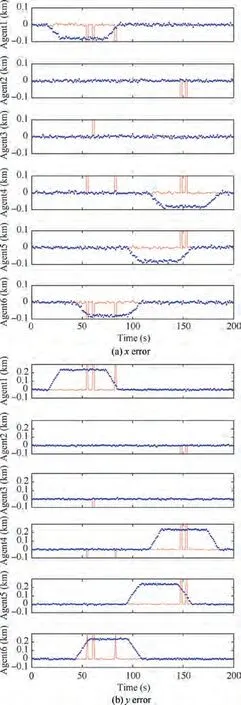
Fig.5 Errors of the statically recovered positions of MAs under topology A.

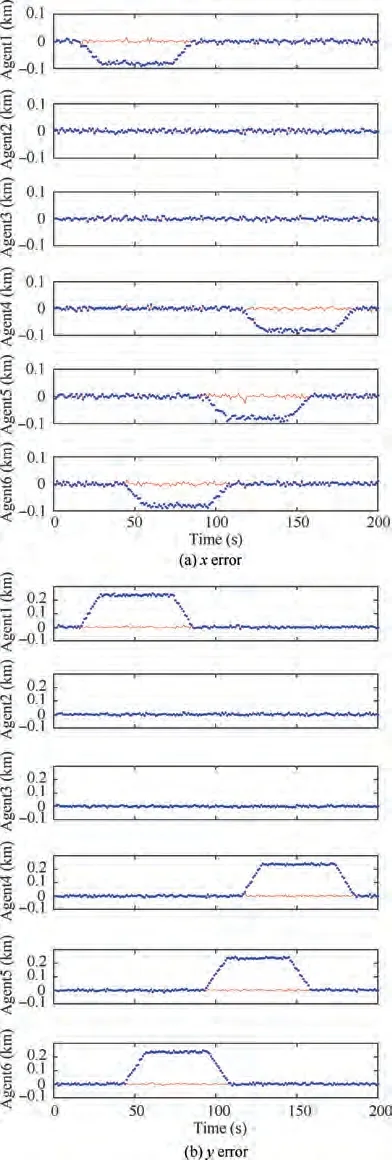
Fig. 6 Errors of the dynamically recovered positions of MAs under topology A.
5. Simulation of fault detection and recovery in the GNSS positioning of an MAS
A demonstration problem involving six mobile agents that pass through a GNSS signal spoofing zone is illustrated in Fig.2.The MAs maintain a regular hexagonal formation with a side length of 1 km. The initial center of the formation is located at [1,1]km. All the MAs move at a constant velocity of [20, 0]m/s and pass through a circular spoofing zone,whose origin is located at [3, 0.6]km and radius is 0.8 km,from its left side to its right side within [0, 200] s. In Fig. 2,the symbols on the left and right side of the circular spoofing zone represent the initial and final positions of the six MAs,respectively; each arrowed solid line indicates the velocity direction of the MA; * represents a GNSS spoofing source;the solid circle indicates the spoofing zone; the dotted circle indicates the zone of maximum spoofing magnitude.
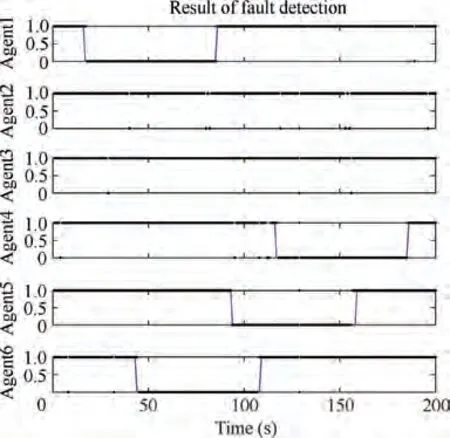
Fig. 7 Fault detection results for MAs under topology B.
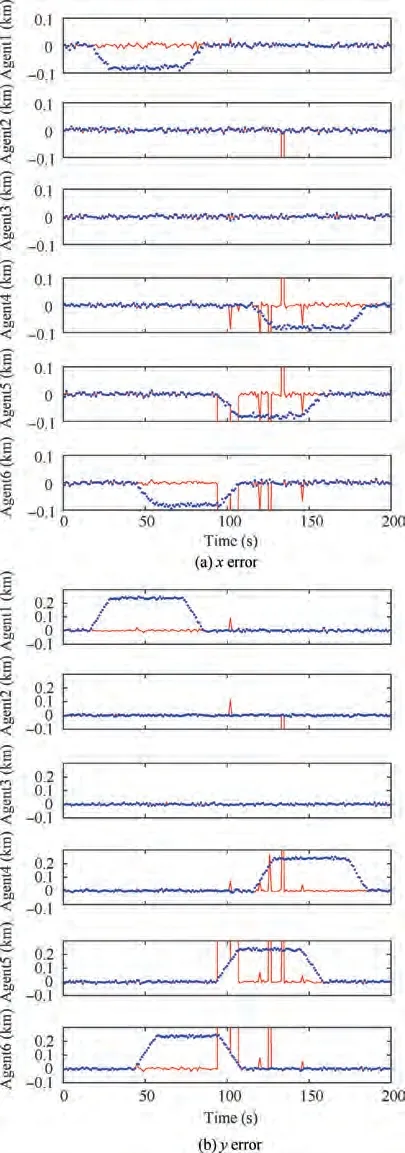
Fig.8 Errors of the statically recovered positions of MAs under topology B.
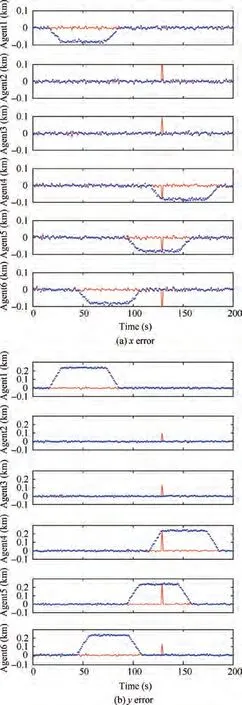
Fig. 9 Errors of the dynamically recovered positions of MAs under topology B.
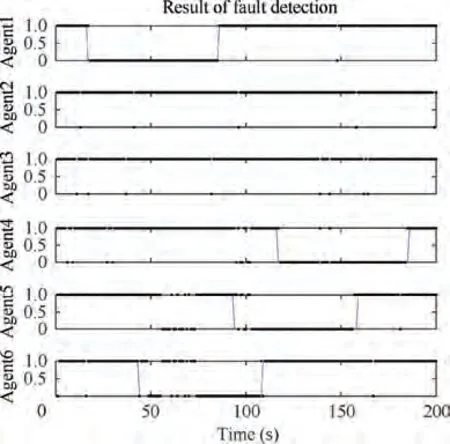
Fig. 10 Fault detection results for MAs under topology C.
It is assumed that spoofing signals transmitted from the spoofing source can cause correlated faults with deviated mean values. For all GNSS devices within the spoofing zone, the positioning measurements have the same deviation vector direction, and the deviation magnitude depends on the distance from the spoofing source.As an MA enters the spoofing zone and gradually approaches the spoofing source,the deviation magnitude of the GNSS measurement increases linearly.When the distance between each MA and the spoofing source becomes smaller than 3/4 of the radius of the spoofing zone,the deviation magnitude reaches its maximum value. When multiple GNSS devices are at the same distance from the spoofing source or are within the maximum spoofing zone at the same time,their faults are correlated faults with a common deviation of mean value as discussed in Section 2.4.2. As the formation moves, the No. 1, 6, 5 and 4 MAs pass through the spoofing zone successively. Additionally, the No. 1 and 6 MAs, the No. 5 and 6 MAs, and the No. 4 and 5 MAs are simultaneously located within the spoofing zone within different periods of time.As a result,correlated faults with deviated mean values occur at these MAs within these periods of time.
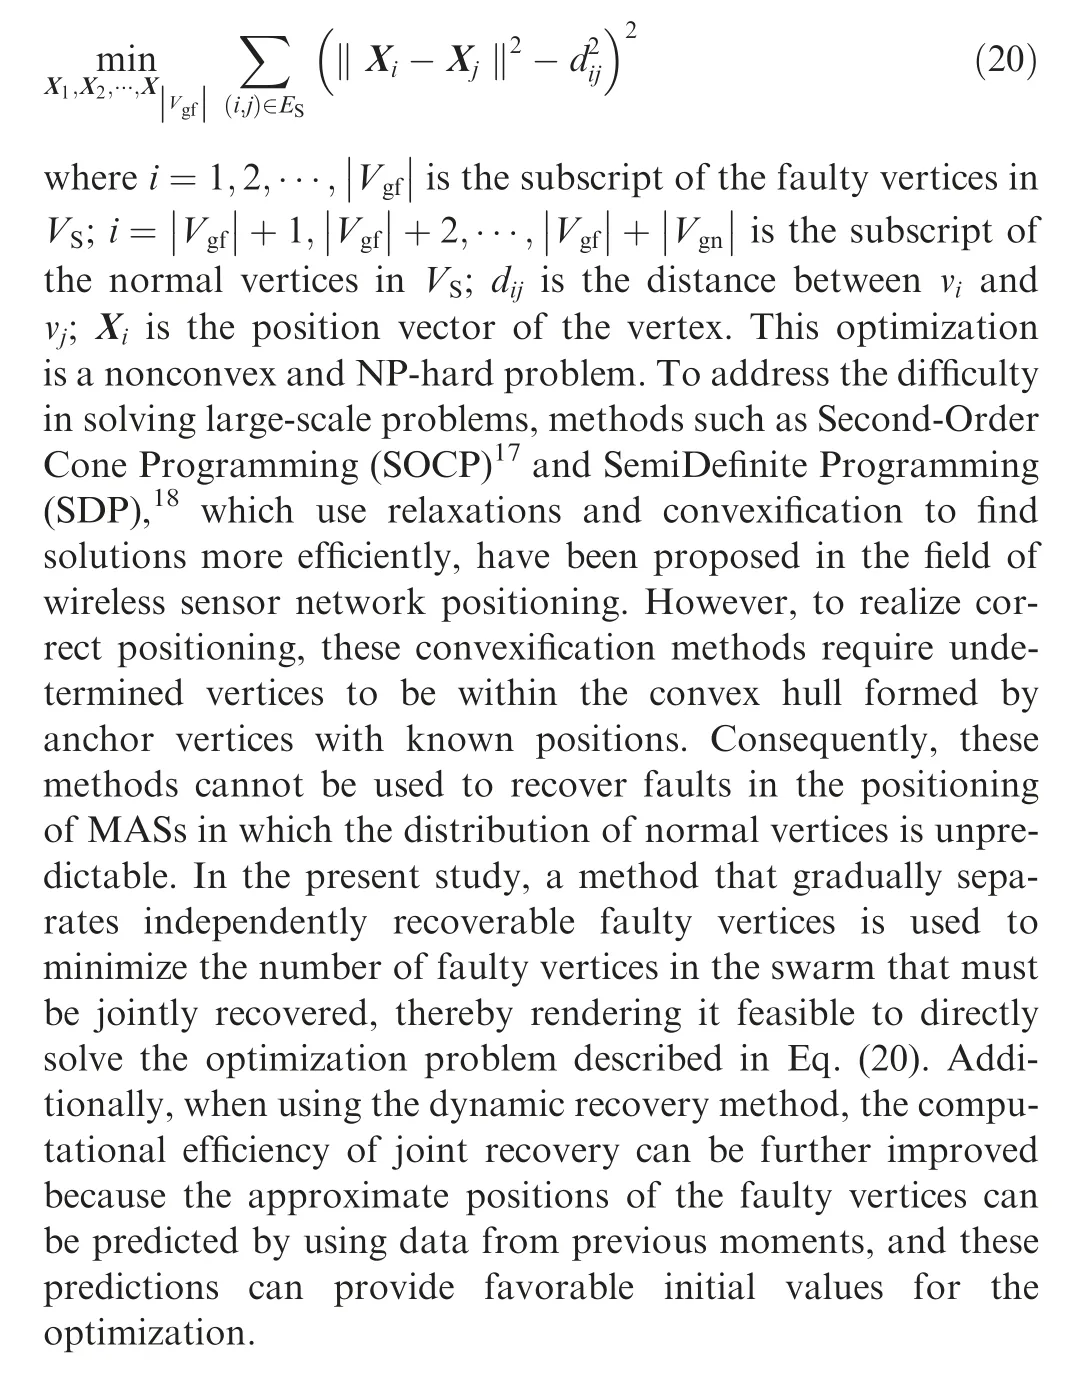
The positioning fault detection and recovery during the movement of the MA formation were validated through simulations.It was assumed that each MA moves exactly at the preset speed,and the motion is unaffected by GNSS measurement errors.The time step of the dynamic simulation was set to 1 s.At each time step,fault detection and recovery were performed using the proposed method based on sampled GNSS measurements with errors and faults and the precise distances determined by the MA positions at the moment. The maximum deviation magnitude of the spoofing source was set to 50σ,and the deviation vector direction was set randomly.The other relevant parameters and algorithm settings were the same as those used in Section 3.4. The ‘‘fminsearch” function in MATLAB was used to directly solve the optimization problem of the positioning recovery process as described in Eq. (20).The average GNSS measurement values for the surrounding vertices were used as the initial values for optimal searching in the static recovery process. The predicted values extrapolated from the recovered or normal GNSS positioning of the two preceding moments were used as the initial values for the solution optimization in the dynamic recovery process.
Three range-finding topologies shown in Fig.3(a),(b),and(c) were used in the fault detection and recovery simulations.In topology A, the minimum number of neighbors of the vertices is 3. As a result, faults that occur at any two vertices at most are detectable. In addition, this topology is rigid and globally rigid, and consequently, the faults are both dynamically and statically recoverable. In topology B, the minimum number of neighbors of the vertices is 3.As a result,faults that occur at any two vertices at most are detectable. In addition,this topology is rigid but not globally rigid, and consequently,faults are dynamically recoverable but not statically recoverable. In topology C, the minimum number of neighbors of the vertices is 2.As a result,not all faults that occur at two vertices are detectable.
Fig. 4 shows the fault detection results using topology A.The solid lines indicate the actual fault states of the MAs.The dots indicate the determined states of the GNSS positioning faults of the MAs at each moment.A value of 0 indicates a GNSS fault, whereas a value of 1 indicates that the GNSS is normal. Evidently, the fault state was correctly determined most of the time, except that some false and missed alarms appeared at very few individual moments. Clearly, within 1-2 s after the MAs entered the spoofing zone and before the MAs left the spoofing zone, the fault detection algorithm determined that the GNSS was normal. This error occurred because the GNSS spoofing deviation magnitude was small in these short periods of time.Fig.5(a)and(b)show the errors of the statically recovered faulty positions in the x and y coordinates, respectively. Fig. 6 (a) and (b) show the errors of the dynamically recovered faulty positions in the x and y coordinates, respectively. In these figures, the blue dots indicate the error of the simulated GNSS measurement from the true position at each moment, and the red lines indicate the errors of the recovered positions from the true positions. Manifestly,when topology A is used,both the static and dynamic recovery methods can eliminate the impact of the spoofing source and recover the positioning with the errors reduced to the normal measurement level.Very large positioning deviations can occur at some individual moments when using the static recovery method. These large deviations may have resulted from an unfavorable choice of initial values for the solution optimization in the static recovery process. However,it is easy to eliminate the adverse impact of these large positioning errors that occur at a low probability and at individual isolated moments by filtering. There are no anomalous points in the results obtained when using the dynamic recovery method, because correct position predictions provide favorable initial values for optimal searching,and consequently,the dynamic recovery method performs better in positioning recovery.
Fig. 7 shows the fault detection results using topology B.Clearly, under this topology, the fault state was correctly determined most of the time,which is consistent with the conclusion derived from the analysis of detectability.Fig.8(a)and(b) show the errors of the statically recovered faulty positions in the x and y coordinates,respectively.Fig.9(a)and(b)show the errors of the dynamically recovered faulty positions in the x and y coordinates, respectively. Evidently, very large errors occurred for a relatively long period of time when using the static recovery method. This result is in agreement with the conclusion that this topology is unable to meet the conditions for static recovery. In contrast, the dynamic recovery method can satisfactorily recover positioning data with errors close to normal measurement because this topology meets the conditions for dynamic recovery.
Fig. 10 shows the fault detection results obtained when topology C was used. Clearly, under this topology, the fault state was erroneously determined for a large proportion of the time. This finding is in agreement with the analytical conclusion that faults occurring at two vertices at the same time cannot be effectively detected under this topology.
Overall, the aforementioned simulation results show that the proposed methods in this paper can effectively detect faults in the GNSS positioning of MASs and correctly recover positioning faults. The conditions of fault detectability and recoverability presented were verified. Compared to the static recovery method, the dynamic recovery method can not only reduce the requirements for the range-finding topology but also achieve better positioning fault recovery performance.
6. Conclusions
(1) A network vertex fault detection method based on edge testing is proposed. The vertex fault states are determined according to the maximum likelihood principle using the edge testing results.
(2) Noncentral chi-square distribution-based hypothesistesting is used for edge distance testing in a rangefinding network of MAs to detect positioning faults of MAs.
(3) A strategy that combines the independent and joint recovery of the positioning data of faulty MAs is provided to reduce the complexity of recovery computations.
(4) Conditions of detectability and recoverability of positioning faults of MAs in a range-finding network are related to the characteristics of the network structure,which are of guiding significance to the design of relative measurement topologies for MASs.
(5) This research allows the detection and recovery of the positioning faults of MASs by exploiting low-cost cooperative measurements and is conducive to increasing the robustness of the positioning of MASs, especially in complex and hostile environments.
The authors declare that they have no known competing financial interests or personal relationships that could have appeared to influence the work reported in this paper.
Acknowledgement
This study was supported by the National Natural Science Foundation of China (Nos. 62073343 and 62003372).
