Analysis of crack initiation location and its influencing factors of fretting fatigue in aluminum alloy components
Jian WANG, Caizhi ZHOU
a School of Civil Engineering and Architecture, Southwest University of Science and Technology, Mianyang 621010, China
b Shock and Vibration of Engineering Materials and Structures Key Laboratory of Sichuan Province, Southwest University of Science and Technology, Mianyang 621010, China
c Department of Mechanical Engineering, University of South Carolina, Columbia 29208, United States
KEYWORDS Crack nucleation;Crystal plasticity;Equivalent plastic strain;Fretting fatigue;Hotspot
Abstract To promote the development of fretting fatigue assessment and control technology for aircraft components, this paper uses the Crystal Plasticity Finite Element (CPFE) method and sub-modeling technology to study the Crack Initiation Location (CIL) of fretting fatigue in Aluminum Alloy (AA) specimens. The effects of external excitations such as normal load, tangential load, and axial stress on the CIL are investigated. It is found that the Most Likely Cracked(MLC) site revealed in a specimen and the CIL may always be consistent after a limited number of cyclic loadings,and they are both located at the hotspot on the contact surface or in the subsurface.The MLC site may also migrate from the hotspot on the contact surface to the hotspot in the subsurface with an increase of the cyclic number,and finally transform into a CIL.The relationship between the MLC site and the CIL of fretting fatigue and its influencing factors have also been described,as well as the identification method of the CIL of fretting fatigue,which provide theoretical and technical supports for anti-fretting fatigue design of AA components in service.
1. Introduction
Fretting fatigue refers to the phenomenon that the fatigue strength of a component decreases or early fracture occurs due to small-amplitude relative sliding between one part of the surface and other contact surfaces under cyclic load.During an aviation flight, Aluminum Alloy (AA) plates and components of an aircraft fuselage and wings are in a complex and changeable stress environment for a long time. The joints of rivets and bolts are subjected to an alternating shear action of axial cyclic stress,vertical contact force,and tangential friction force, which inevitably leads to fretting fatigue. Fretting fatigue can accelerate the initiation and propagation of surface and subsurface cracks of structure components under a fretting action, thus greatly reducing the fatigue life of components, and even causing catastrophic accidents such as skin falling off and fuselage fracture.As the flight speed is increasing and the safety service standard is also gradually improving, how to predict and control the fretting fatigue of AA structure components to ensure long-term service safety of aircraft has always been a hot and difficult problem in the aviation field.
Fretting fatigue research of AA can be divided into two aspects: identifying the Crack Initiation Location (CIL) and predicting the fatigue life (including the crack initiation life and the crack propagation life). Determination of the CIL is the basis for predicting the crack initiation life.Determination of the crack initiation position is related to not only the accuracy and reliability of an initial cracking life prediction, but also the rationality and pertinence of fretting fatigue control.As a fretting fatigue test is difficult to detect the crack initiation part and microscale changes of stress and strain during the crack initiation stage, it is necessary to use numerical simulation technology to study fretting fatigue crack initiation and propagation behaviors.
Numerical simulation methods for predicting the CIL mainly include two types: equivalent plastic strain-based prediction methods and energy criterion-based prediction methods. A prediction method based on plastic strain is simple and clear,and can also be verified by test results,so it has been widely used within its scope of application.For example,Manonukul and Dunneused the Crystal Plasticity Finite Element(CPFE) method to study the low-cycle and high-cycle fatigue cracking characteristics of nickel-based alloy samples,and proposed a fatigue crack initiation criterion based simply on a critical accumulated slip.Dunne et al.McDowell and Dunnefound through finite element simulation of crystal plasticity that the maximum value of accumulated plastic slip/strain of Face-Centered Cubic(FCC)polycrystal specimens was consistent with the initial cracking position observed in an indoor fatigue test. Therefore, equivalent plastic strain (PEEQ) can be used as a possible Fatigue Indicator Parameter(FIP).Sweeney et al.compared the position of PEEQ,cumulative plastic strain,cyclic plastic strain,and the CIL by the CPFE method,and found that for an anisotropic elastic model,the position of the maximum PEEQ was in good agreement with the CIL revealed by an experiment.Shiraiwa et al.used the maximum cumulative plastic strain to determine the CIL when studying the fretting fatigue failure of welded structures by the CPFE method. When Han et al.studied the fretting fatigue behavior of nickel-based single crystal superalloys, they found that the position of the maximum PEEQ revealed by the CPFE method was consistent with the crack nucleation site observed by in-situ scanning electron microscopy.
The prediction method of the CIL based on an energy criterion takes into account the characteristics of plastic strain and stress. It is suitable not only for anisotropic models, but also for isotropic elastic models, so it is widely used by researchers in the fretting fatigue field. For example, Hojjati-Talemi and Wahabconducted a finite element simulation on the evolution of fretting fatigue damage,and used the Elastic Energy Density Release Rate(EEDRR)criterion to predict the location of the fretting fatigue initial crack.Lu et al.proposed a framework to study the low-cycle fatigue behavior of 304 stainless steel using the CPFE method,and predicted crack initiation sites based on local cumulative plastic deformation and local plastic dissipation energy criteria.
Reasonable prediction of the CIL of fretting fatigue needs to clarify or solve the following key issues: (A) The relationship between a crack initiation hotspot and the CIL; (B) The identification standard of a crack initiation hotspot; (C) Migration and change of crack initiation hotspots. As far as Issue (A) is concerned, high-cycle fatigue crack initiation hotspots of metallic materials are multiple extreme points where crack initiation may occur.It is generally believed that the site corresponding to the maximum value of the extrema points is most likely to crack. As for Issue (B), in addition to the above-mentioned identification standards based on strain and energy, there are also identification criteria based on stress increment.At present,identification of crack initiation hotspots is based on the numerical simulation results of limited loading cycles,and there are few relevant research reports on migration and change of crack initiation hotspots.
It is generally believed that fretting fatigue cracks originate in defects (e.g., voids), non-metallic inclusions, or hard particles in a specimen,which are also stress concentration areas. According to different CILs, fretting fatigue can be divided into two types:surface crack formation and subsurface crack formation. During a test, since surface crack formation is relatively easy to observe and detect, it has been extensively studied at present.Before subsurface cracks propagate to the contact surface,it is easy to be ignored,resulting in missed judgments and misjudgments of CILs. If not treated in time,subsurface crack formation is likely to cause catastrophic failure to structural components, which will endanger the service safety of machinery, equipment, and facilities,causing structural damages, such as spalling, flaking, peeling, etc.
Studies have found that changing the microstructure of a material or processing its surface will affect the CIL of fretting fatigue.For example,the use of functionally gradient materials for coating,the use of shot peening to strengthen the surface of a specimen,ultrasonic nanocrystal surface modification,as well as carburizing and hardening treatment on the surface of steelwill change the CIL and crack propagation mode.
In most of the current fretting fatigue tests where subsurface crack formation is found,the strength of the surface layer of the specimen is greater than the subsurface and internal ones, and it performs as high-cycle or ultra-high-cycle fatigue.However,in the fretting fatigue test of a specimen without surface processing treatment,a phenomenon of surface crack formation generally appears. Without considering the influences of external forces, it is easy to mistakenly believe that surface crack formation is a normal or default form of fretting fatigue,while subsurface crack formation is a special form of fretting fatigue.
It should be noted that the external force loading method and the resulting stress environment play a controlling role in structural components fatigue, and are the main factors causing different types of fatigue such as plain fatigue,fretting fatigue,rolling contact fatigue,and sliding contact fatigue.At present,there are few researches on the effect of external force on the CIL of fretting fatigue.
In summary,it is of great significance to study the influence of external force on the CIL of fretting fatigue. Based on this,this paper intends to use the CPFE method to simulate the fretting fatigue process of AA specimens, explore the migration and change laws of crack initiation hot spots, and reveal the influences of external loads such as normal load,tangential load, and axial stress on the CIL. Fretting fatigue model design,the CPFE method along with material parameter selection, and the loading method along with loads selection are presented firstly. Then verification of the contact model and validation of CILs are demonstrated. Finally, analysis of the relationship between crack initiation hot spots and the CIL,and analysis of the influences of normal load, tangential load,and axial stress on the CIL are shown.
2. Methodology
2.1. Model setup for fretting fatigue tests
The single lap joint of the fuselage rivet-plate structure under alternating loads during the service of an aircraft can be simplified into the global model of fretting fatigue shown in Fig. 1(a),which is also a representative of common singleclamp fretting fatigue tests.A horizontal remote vibrating load of the plate is applied to both sides of the specimen by synchronous and in-phase loading of a cyclic axial stress σand an axial reaction stress σ. A normal load P is applied to the upper boundary of the pad model, and a Multi-Point Constraint (MPC) is used to simulate the smooth extrusion of the rivet on the plate. Both the left and right sides of the pad are fixed, i.e. U= 0. Also, the displacement on the bottom of the specimen Uis set to 0 due to symmetry.
In fretting fatigue conditions, the pad-specimen contact remains in a partial slip regime,that is, the tangential load Q on the top of the specimen satisfies the condition Q < μP,where μ is the coefficient of friction. Q can be expressed by σand σas

where Ais the cross-sectional area of the specimen.
In order to carry out macro-micro coupling simulation of fretting fatigue,the sub-modeling technique is used to calculate the elastoplastic response of the internal grains of the sample under the action of alternating loads, as shown in Fig. 1(b).For the submodel of the specimen, all the Boundary Conditions(B.Cs.)of the left,right and bottom sides are set according to the Uand Ufrom global model calculated at each time step. The numerical model size is based on the indoor fretting fatigue test model size used by Va´zquez et al.The length and width of the specimen in the global model are 30 mm and 5 mm, respectively. The radius of the circular pad surface is 100 mm. Invoking the Saint-Venant principle, both the width and height of the cylindrical pad are truncated and set to 20 mm except for the curved part.A 3-node linear plane strain triangle element (CPE3) is selected to mesh the pad and specimen models. Within the region of the submodel, the element size of the global model is 0.1 mm. This size increases from 0.1 mm at the boundary of the submodel to 0.2 mm at the left and right boundaries of the global model. The element size of the pad model gradually transitions from 0.05 mm on the contact surface to 0.50 mm on the top surface. The specimen model and the pad model are divided into 23800 and 39682 CPE3 elements,respectively.For elastic contact,both the specimen and the pad are with elastic modulus E = 71 GPa and Poisson’s ratio ν = 0.33.
The circular surface of the pad is defined as the master surface,and the top surface of the specimen is defined as the slave surface for the contact pair.According to experimental tests,the Lagrange multiplier friction formulation with the friction coefficient μ = 0.72 is included in the contact pair to define the tangential behavior in the contact region. Moreover, a‘‘hard” contact pressure-overclosure relationship is used to define the normal behavior of the surface-based contact. In addition, the out-of-plane surface thickness d is set to 7 mm for geometric properties.
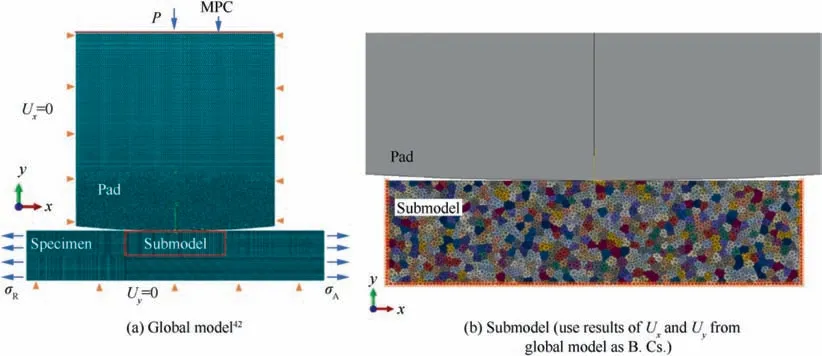
Fig. 1 Global model and submodel for fretting fatigue simulation.
The submodel of the specimen is adjacent to the pad, and its size is 10 mm × 2.5 mm, as shown in Fig. 1(b). The orientations of grains used in the submodel are randomly generated by NEPER software.The submodel contains 741 grains with a grain size equal to 150 μm, which is equivalent to the measured grain size in the experimental specimens used by Li et al.Crystal grains are also divided by CPE3 elements, of which the element size is set to 50 μm,and the total number is 9968.The displacement results of the global model at the interface between the global model and the submodel at each time step,Uand U,are taken as the dynamic boundary conditions of the left and right sides and the bottom of the submodel.The contact characteristics and loading method of the submodel and the upper pad are consistent with those of the global model.
2.2. CPFE formula
The CPFE method can simulate microscopic plastic deformation caused by the internal slip band of a grain under an action of cyclic loading,so it can be used for micro-scale fretting fatigue simulation.A crystal elasto-viscoplastic constitutive model accounting for elastic and plastic deformations developed by Marin and Dawsonis modified with the Armstrong-Frederick kinematic hardening rule incorporated to describe the cyclic backstress. It is assumed that crystallographic slip is the only mechanism of plastic deformation, without considering other mechanisms such as twinning,grain boundary sliding,and diffusion.The elasto-plastic deformation gradient F of single crystals can be multiplicatively decomposited as the elastic component Fand the plastic component F,and the elastic deformation gradient Fcan also be decomposed into the symmetric elastic stretch tensor Vand the orthogonal rotation tensor Ras

Following the hardening-recovery rule proposed by Kocks and Mecking,it is assumed that all slip systems harden at the same rate and equal to the critical resolved shear stress τ,i.e.,τ=τfor all α-slip systems. The rate of the CRSS ˙τis calculated based on

where his the initial hardening rate due to dislocation accumulation; κis the initial hardening strength; κis the saturation hardening strength.
2.3. Crystal material parameters selection
The identification of parameters used in the crystalline constitutive law for AA7075 is based on previous work of Wang et al.Crystal texture was directly measured from experimental results. Parameters of the crystalline constitutive law were identified through an inverse identification.Meanwhile,elastic constants C, C, and Cwere adopted from work of Hosford,as shown in Table 1.
In order to be consistent with the fretting fatigue model, a Two-Dimensional Representative Volume Unit(2D RVE)was used for parameter identification and correction.The two basic assumptions with the 2D RVE are plane strain conditions and the dimensions of the RVE (i.e., 2D). Vuppala et al.found that the assumption of plane strain was valid and had no influence on texture evolution. In addition, some defects of the 2D model can be overcome by increasing the number of grains,and the calculation results of the 2D model can also be mapped to a 3D model.
The CPFE parameters for AA7075 were calibrated through cyclic loading simulations as reported in prior work.Cyclic loading tests were conducted on specimens that were cut along 0° and 90° with respect to the Rolling Direction (RD), and were performed according to the American Society for Testing and Materials standard ASTM E606-04.As a result, using the calibrated crystal plasticity parameters listed in Table 1,the anisotropy of the material and the cyclic response were well captured.
Besides the grain morphology, the other major source of crystalline anisotropy is the texture or crystallographic orientations. The initial texture of the crystal grains was obtained through an Electron Back-Scatter Diffraction (EBSD) test and imported to the CPFE model. Fig. 2 compares the experimental texture obtained from electron backscatter diffractionand the initial texture used in our study. Although there are minor differences, the representation is deemed adequate, and the reversed texture is able to capure the main features of the actual sample. We can see that the orientations of grains used in our model and experimental studies are close toeach other,both of which contain strong 100 and 110 textures.The minor differences between the experimental and our textures are not critical for the results, as the mechanical properties of the samples are the average properties from over several thousand grains and controlled by strong texture orientations.
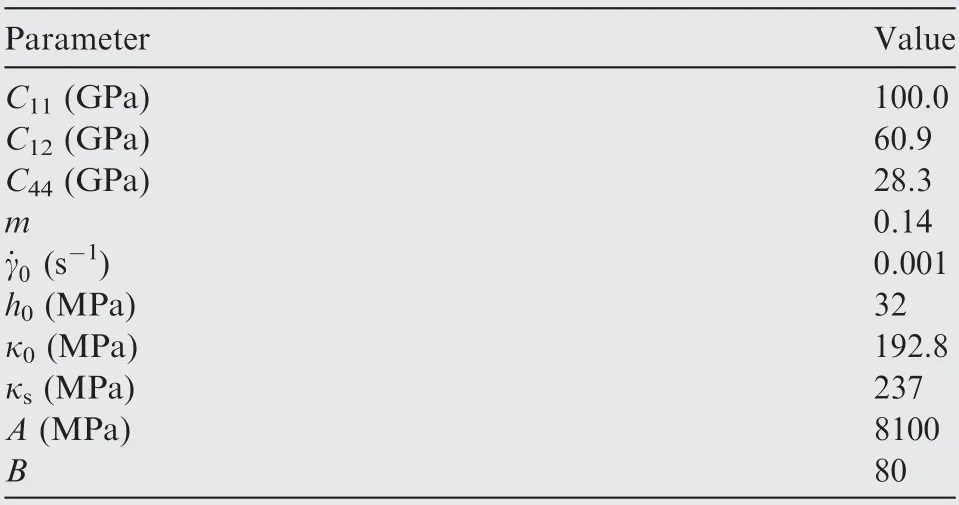
Table 1 Calibrated parameters of crystalline constitutive law for AA7075.53,54.
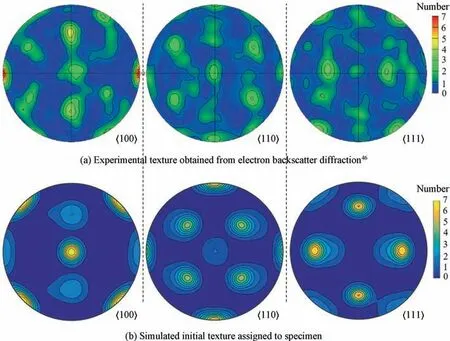
Fig. 2 Pole figures of experimental texture and simulated initial texture assigned to specimen.
2.4. Loading method and loads selection
As reported by Fouvry et al.,fretting fatigue can be decomposed into the effects of fretting contact loading and fatigue bulk loading.External forces or stresses play an important role in affecting fretting fatigue behavior, which have been regarded as one of the three primary influencing variables besides the coefficient of friction and the magnitude of slip.In order to investigate the influences of external loads such as normal load, tangential load, and axial stress on the CIL,three groups of 30 loading conditions are selected for simulation, as shown in Table 2. In Group I, the tangential load Q,the axial stress σ, and the axial reaction stress σremain unchanged, and the influences of the normal load P and the loading factor nL = Q/(μP) on the CIL is studied. P (N) of Load No.1 is selected according to the test conducted by Va´zquez et al.Then load P(N)decreases with an increase of the loading factor nL for other Load numbers in Group I. In Group II, the normal load P and the axial stress σremain unchanged(except Load No.22),and the influences of the tangential load Q and the load factor nL on crack initiation are explored. In Group III, the normal load P and the tangential load Q remain unchanged,and the influence of the axial stress σon crack initiation is investigated. The load sequence of each fretting fatigue simulation follows the procedure described by Va´zquez et al.The number of loading cycles is 300 and above,and the stress ratio for all tests is considered as R= -1.
3. Model verification and validation
3.1. Verification of contact model

Fig. 3 depicts a comparison between analytical and Finite Element Method (FEM) solutions for the normalized contact pressure and the shear traction at the contact interface.According to Nowell and Hills,assumptions of the Hertz solution are considered to be met if one half of the fatigue specimen width,w,is equal to or greater than 10 times the semi contact width a.A significant deviation as much as 20% fromthe analytical solution is foreseeable when the ratio of the fatigue specimen width to the contact width equals to 3.As shown in Fig.3,a good correlation is observed between analytical and FEM solutions of the contact pressure and the shear stress at the contact surface, although the width of the fatigue specimen does not satisfy the fully elastic semi-infinite assumption required.
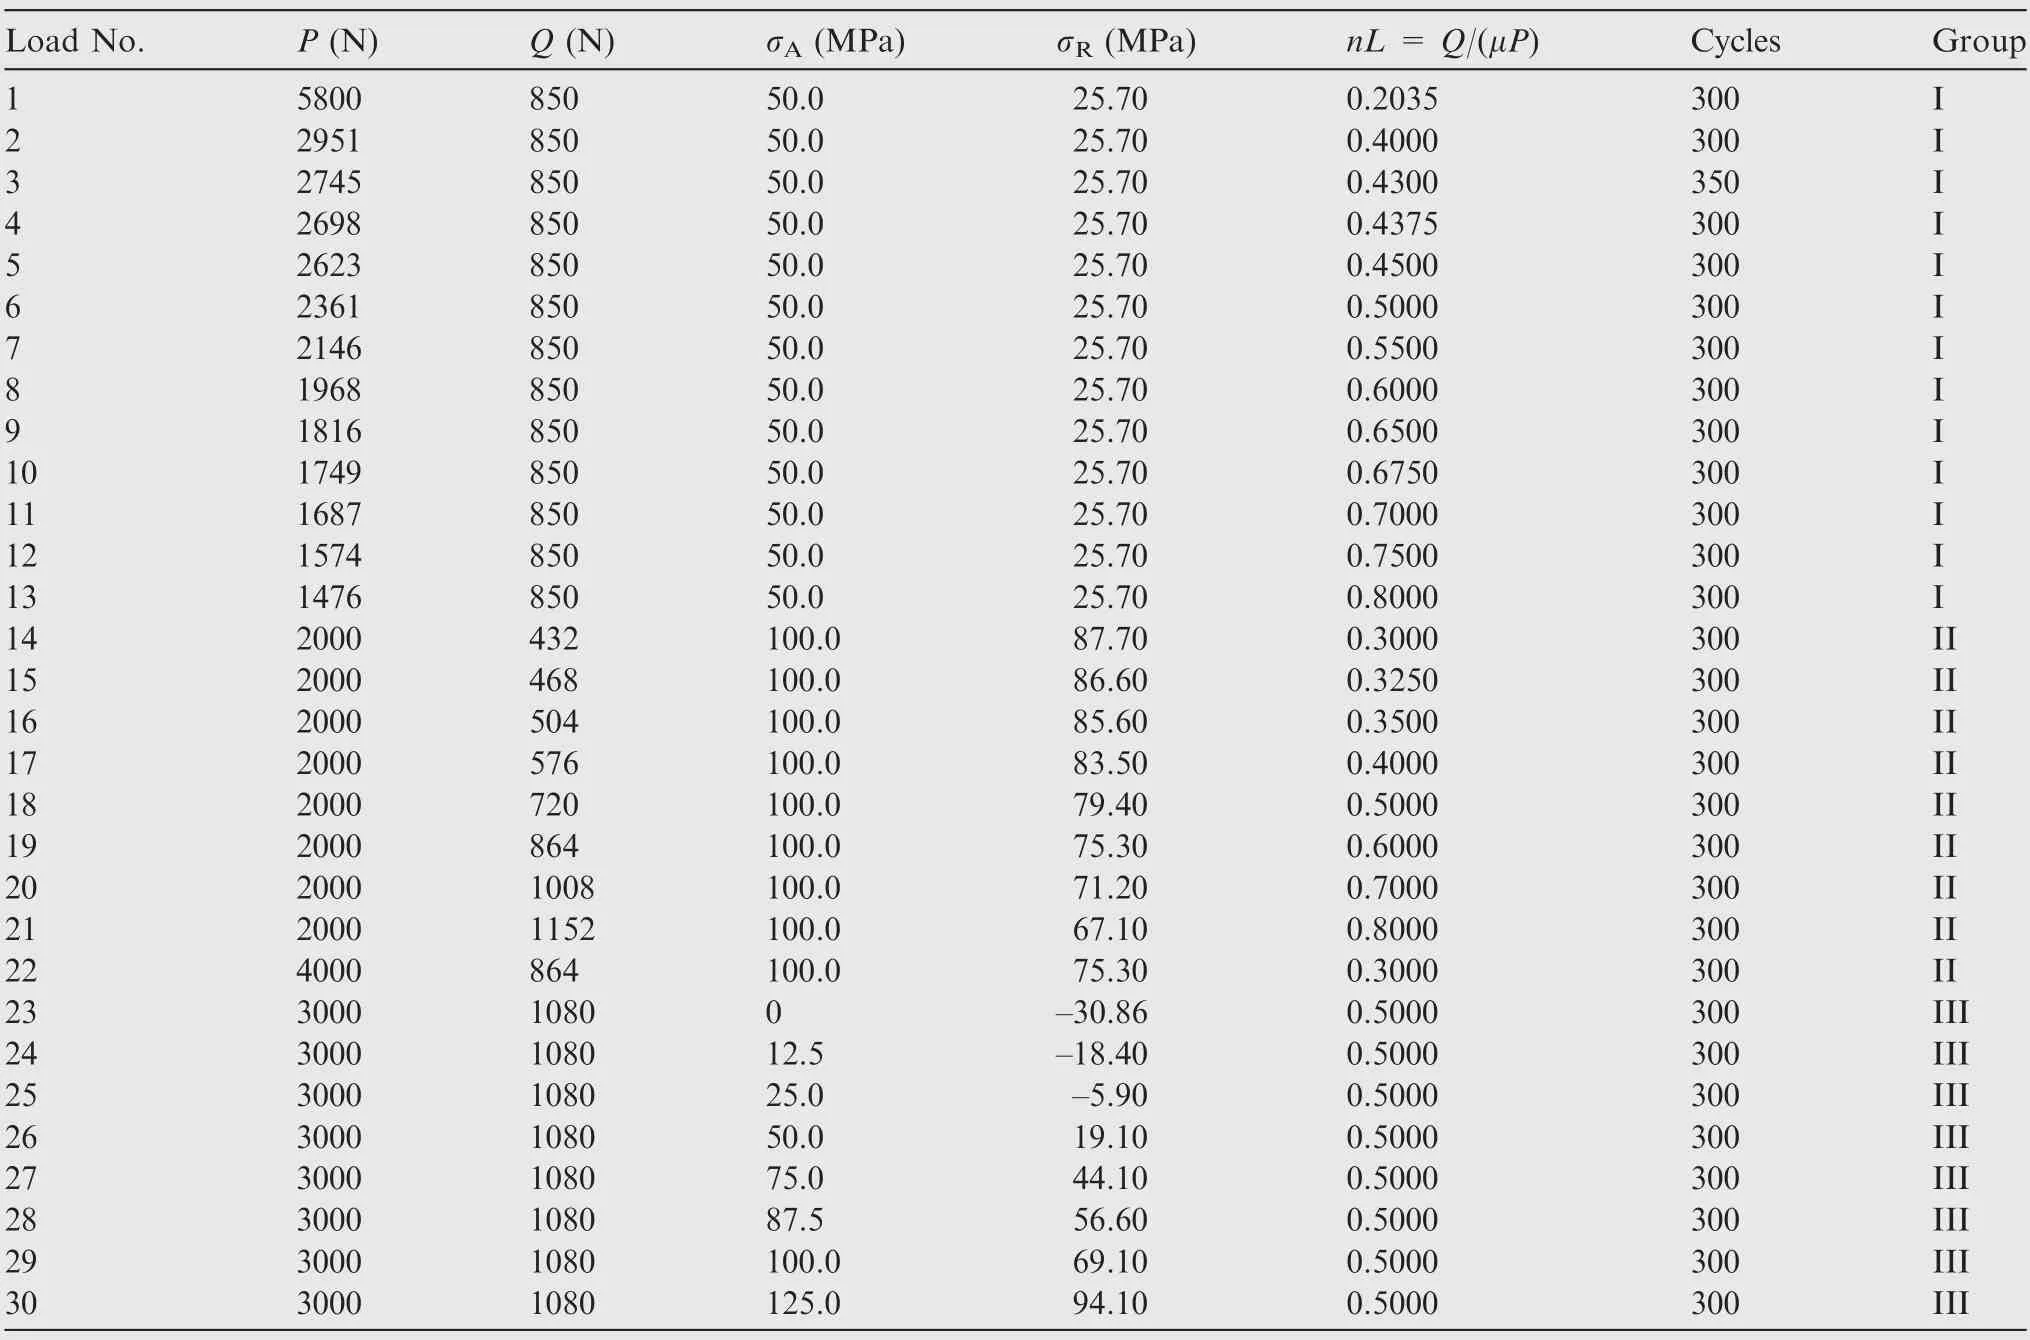
Table 2 Loading conditions selected for fretting fatigue simulation.
3.2. Validation of CILs
In order to validate the accuracy of the CIL predicted by the CPFE method, fretting fatigue test results of another single crystal material, Ni-Based Single Crystal (NBSX) superalloys,which are very similar to the physical and mechanical properties of AA materials, are selected for comparative analysis.
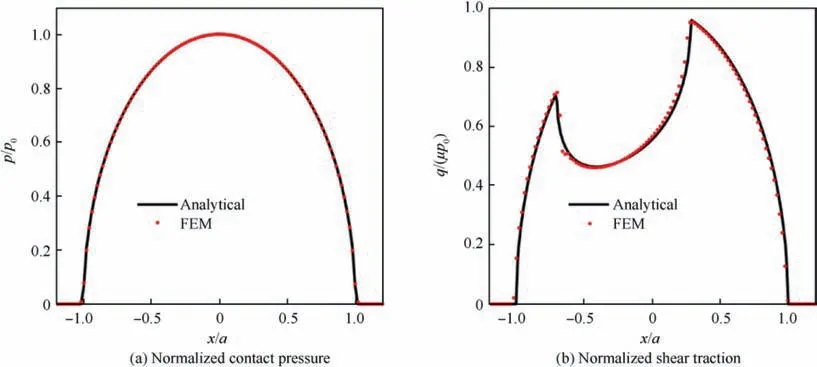
Fig. 3 Comparison between analytical and FEM solutions of normalized contact pressure and normalized shear traction at contact interface for load No. 1 (a = 1.627 mm, P = 5800 N, Q = 850 N, σA=50.0 MPa, Q/μP = 0.2035, and μ = 0.72).
NBSX materials have a higher strength than that of AA,and also a high temperature resistance. They are widely used in gas blades and aircraft engines. For more information on the selection of NBSX material parameters and the setting of the fretting fatigue model, please refer to research by Han et al.In addition, the axial stress is applied to the end of the specimen in the form of a sine wave with a frequency of 10 Hz, and the axial stress ratio is 0.1. The element size at the contact zone is refined to 3 μm. When the normal load is 1 kN,the CIL in the test is consistent with the site of the maximum PEEQ after 100 cycles of repeated loading, both of which are located on the contact trailing edge, as shown in Fig. 4(a)and (b). Excluding the premature rupture of the inclusion inside the sample, when the normal load increases to 2 kN, after 100 cycles of loading, the CIL will start on the subsurface inside the specimen,as shown in Fig.4(c)and(d).
It can be seen that the CPFE method used can accurately predict the CIL of fretting fatigue. Based on the principles of computational solid mechanics,other inferences made in this paper using this validated CPFE simulation will also be reasonable and reliable.
4. Results and discussion
4.1. Relationship between crack initiation hotspots and CIL
Wang et al.have found that under cyclic loading, there are two most important crack initiation hot spots in a sample,one on the contact trailing edge and the other near the center line of the subsurface. Crack initiation of the sample is most likely to occur in a place with a larger PEEQ among the two hotspots, which is the Most Likely Cracked (MLC) site predicted by numerical simulation. Through a large number of numerical simulations of the loading conditions listed in Table 2, we have found that under the action of alternating loads with a limited number of cycles,the following four types of relationships exist between the MLC site and the final CIL in the sample.
Type A: The MLC site revealed in the specimen and the final CIL may always be consistent after a limited number of cyclic loads, and they are both located at the hotspot on the contact surface, as shown in Fig. 5(a), where COORD means coordinate.
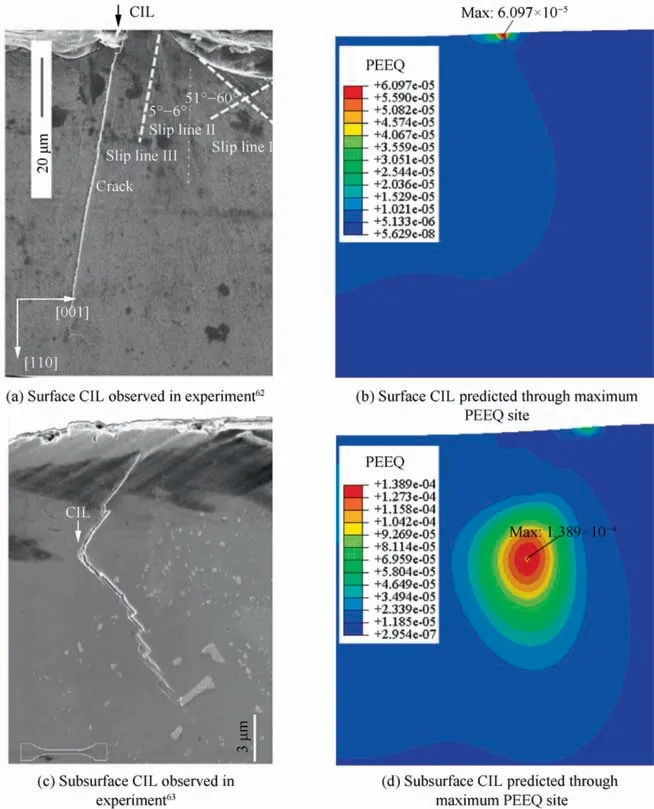
Fig. 4 Surface CIL and subsurface CIL after 100 cycles loading by CPFE modeling.
The sample in Fig. 5(a) is subjected to alternating loads of P=2000 N,Q=1152 N,and σ=100.0 MPa(Load No.21 in Table 2), and the PEEQ at the hotspot on the contact surface is larger than that at the hotspot in the subsurface under the first 300 cyclic loads. In addition, under Load No. 21, the PEEQ at the hotspots on the contact surface and in the subsurface both increase with an increase of the loading cycle,but the PEEQ increment at the hotspot on the contact surface is greater than that at the hotspot in the subsurface, as shown in Fig. 6(a) and (b), where ΔPEEQ is the PEEQ difference between MLC sites on the contact surface and in the subsurface. From this, it can be inferred that under Load No. 21,the PEEQ at the hotspot on the contact surface will always be greater than that at the hotspot in the subsurface. That is,the MLC site is always consistent with the hotspot on the contact surface,and will further develop into a CIL.Type A is the most easily observed relationship in laboratory tests, and it is also the type associated with the most widely studied crack initiation.
Type B: The MLC site revealed in the specimen and the final CIL may always be consistent after a limited number of cyclic loadings, and they are both located in the subsurface,as shown in Fig. 5(b).
The sample in Fig. 5(b) is subjected to alternating loads of P=4000 N,Q=864 N,and σ=100.0 MPa(Load No.22),and the PEEQ at the hotspot on the contact surface is less than that at the hotspot in the subsurface under the first 300 cyclic loads.Moreover,both of the PEEQ at the hotspots on the contact surface and in the subsurface increase with an increase of the loading cycle, but the PEEQ increment at the hotspot on the contact surface is smaller than that at the hotspot in the subsurface, as shown in Fig. 6(c) and (d). Therefore, it can be inferred that under the action of Load No. 22, the PEEQ at the hotspot in the subsurface will always be larger than that at the hotspot on the contact surface,that is,the MLC position will always be consistent with the hotspot in the subsurface,and will be further transformed into a crack initiation site.Crack initiation associated with Type B is similar to the spalling phenomenon found in rolling fatigue,which is more difficult to observe in an experiment, so it is easy to cause misjudgments.
Type C: The MLC site may also migrate from the hotspot on the contact surface to the hotspot in the subsurface with an increase of the cyclic number,and finally transform into a CIL,as shown in Fig. 5(c) and (d).
When under external alternating loads of P = 2745 N,Q=850 N,and σ=50.0 MPa(Load No.3), and the number of cycles is 344 or less,the PEEQ at the hotspot on the contact surface is greater than that at the hotspot in the subsurface, that is, the MLC site is located at the hotspot on the contact surface;when the cyclic number is between 345 and 350, the PEEQ at the hotspot on the contact surface is less than that at the hotspot in the subsurface,that is,the MLC site migrates down to the hotspot in the subsurface, as shown in Fig. 5(c) and (d).
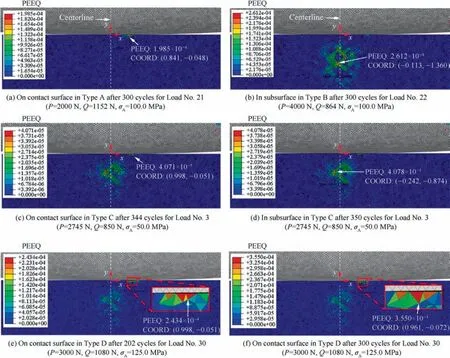
Fig. 5 PEEQ contours at MLC site on contact surface and in subsurface.
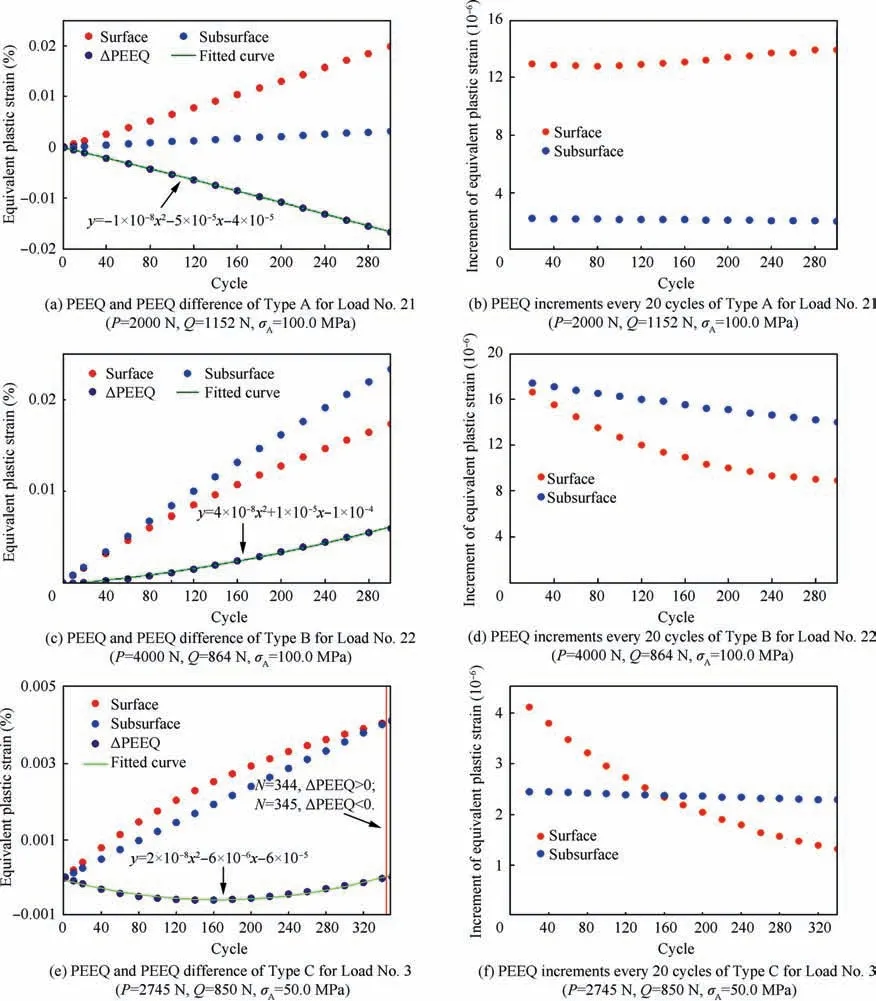
Fig. 6 PEEQ, PEEQ increments every 20 cycles at MLC sites on contact surface and in subsurface, and ΔPEEQ.
Further analysis of the fitting curve of the difference between PEEQ at the hotspot in the subsurface and that on the contact surface in Fig. 6(e) shows that the fitting curve is a parabola with an opening upward,which means that this difference in PEEQ will further increase with the number of cycles more than 350. That is, both the MLC site and the crack initiation position will be located at the hotspot in the subsurface.In Fig.6(f),the PEEQ increment at the hotspot on the contact surface and that at the hotspot in the subsurface also appear to be one and the other, which finally leads to a migration of the MLC site from the hotspot on the contact surface to the hotspot in the subsurface. Type C is the most prone to misjudgment. If the number of cyclic load actions is not enough, or the changing trend of the MLC site cannot be accurately judged, crack initiation in the subsurface is likely to be misjudged as crack initiation on the contact surface.
Type D:The MLC site migrates inside the subsurface or on the surface of the specimen and finally transforms into a CIL,as shown in Fig.5(e)and(f).This migration does not result in a surface-subsurface conversion at the crack initiation site,but causes changes in the site of the hotspot and the CIL.
When under external alternating loads of P = 3000 N,Q = 1080 N, and σ= 125.0 MPa (Load No. 30), the MLC site is always consistent with the hotspot on the contact surface.When the number of cycles is 202 or less, the abscissa of the hotspot is 0.998,as shown in Fig.5(e);when the number of cycles is more than 202, the abscissa of the hotspot on the contact surface moves to the left to 0.961, that is, a distance of unit size moves to the contact center, as shown in Fig. 5(f).Type D reveals the migration of hotspots between adjacent elements, which has a limited effect on fretting fatigue and a low occurrence probability,so it is not the focus of this paper.
In Types A, B, and C, the PEEQ changes at MLC sites on the surface and in the subsurface with the cyclic number of loadings as well as the changing trends of PEEQ increments per 20 cycles at MLC sites on the surface and in the subsurface with the cyclic number of loadings are shown in Fig. 6(a)-(f).
4.2. Influence of normal contact force on CIL
According to the work by Nowell and Hills,the load factor nL can be defined as

It can be seen from Eq. (11)that the vertical load P is negatively correlated with the load factor nL,while the tangential load Q is positively correlated with the load factor nL.
Under the condition that the tangential load (Q = 850 N)and the axial stress(σ=50.0 MPa,σ=25.7 MPa)remain unchanged, the PEEQ at the MLC site in the subsurface, that on the contact surface,their PEEQ difference,and the ratio of the PEEQ increment vs.the cyclic number are shown in Fig.7(a)-(d), respectively. In order to further explore the relationship between the load factor and the MLC position,we added a series of simulation conditions such as nL=0.4375,0.4500,0.4750,0.5500,0.6500,0.6750 on the basis of the load shown in Fig. 7. After 300 times of cyclic loading, the PEEQ of MLC sites in the subsurface and on the contact surface, their ratio and increment ratio are respectively shown in Fig. 8(a)-(d).
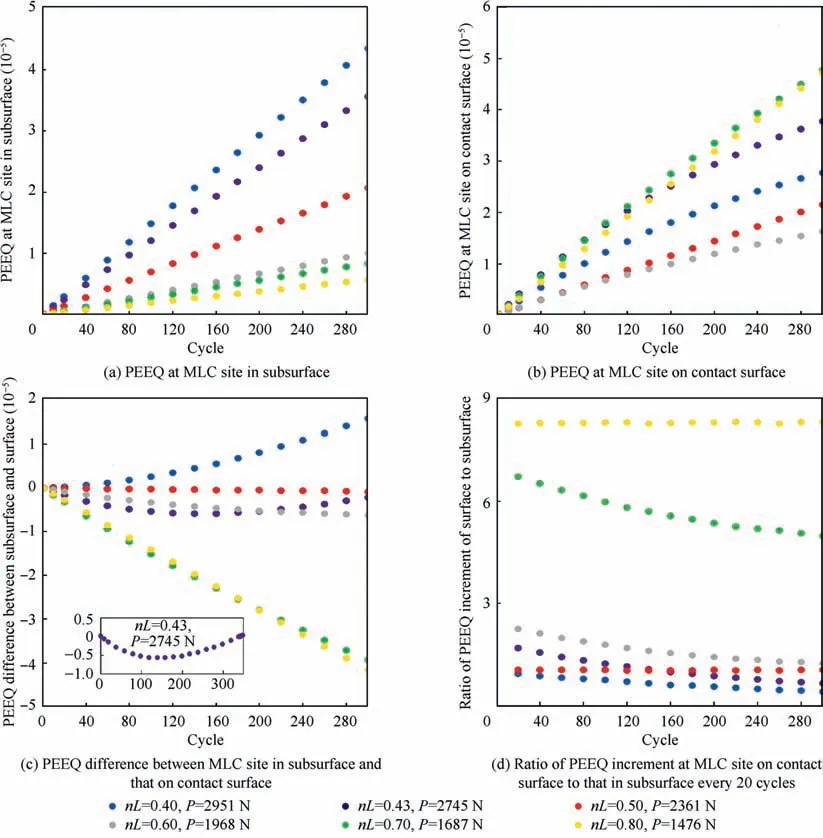
Fig.7 PEEQ,PEEQ difference and ratio of PEEQ increment vs.number of loading cycles when tangential load(Q=850 N)and axial stress (σA = 50.0 MPa, σR = 25.7 MPa) remain unchanged.
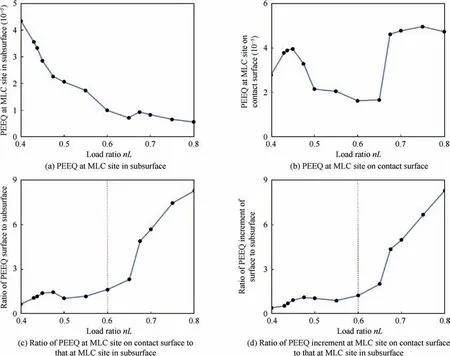
Fig. 8 PEEQ, ratio of PEEQ and ratio of PEEQ increment vs. load ratio nL after 300 cycles of loading.
As shown in Fig. 6(a) and 7(a), except for nL = 0.65, the PEEQ at the MLC site in the subsurface decreases as an increase of the load factor nL.As shown in Fig.7(b)and 8(b),the PEEQ at the MLC site on the contact surface experienced two large fluctuations with an increase of the load factor nL:the first PEEQ fluctuation occurred when nL = 0.45, and the second PEEQ fluctuation occurred when nL = 0.65.
The difference between the PEEQ of the MLC site on the contact surface and that in the subsurface is shown in Fig. 7(c). Also, the ratio of the PEEQ difference at the MLC site on the contact surface to that at the MLC site in the subsurface is shown in Fig. 8(c).
When the loading factor nL is greater than 0.60,the PEEQ at the MLC site on the contact surface is always greater than that at the MLC site in the subsurface, and the ratio of the PEEQ at the MLC site on the contact surface to that at the MLC site in the subsurface increases with an increase of the load factor. In addition, the ratio of the PEEQ increment at the MLC site on the contact surface to that at the MLC site in the subsurface is greater than 1,and the ratio increases with an increase of the load factor (see Fig. 8(d)). This change means that when the load factor nL is above 0.60 (the normal load P < 1968 N), the specimen behaves as Type A fatigue.
When the loading factor is less than 0.40, the PEEQ at the MLC site on the contact surface is always smaller than that at the MLC site in the subsurface. In addition, the ratio of the PEEQ increment at the MLC site on the contact surface to that at the MLC site in the subsurface is less than 1. It means that under the condition of the load factor nL ≤0.40(the normal load P ≥2951 N or more),the specimen behaves as Type B fatigue.
When the load factor is in the range of (0.40, 0.60), the PEEQ difference between the MLC site in the subsurface and that on the contact surface has undergone a change from negative to positive.This change means that the MLC site has migrated from the contact surface to the subsurface, that is,the specimen behaves as Type C fatigue.
It can be seen from Fig.8(c)and(d)that the fluctuations of the PEEQ at the MLC sites in the subsurface and the contact surface near nL=0.65 did not affect the behavior of the specimen belonging to fatigue Type A.Meanwhile,the PEEQ fluctuation at the MLC site on the contact surface near nL=0.45 is related to a Type C fatigue behavior.
Based on the negative correlation between the load factor and the vertical load shown in Eq. (11), it can be seen that when the normal load is P ≤1968 N(nL ≥0.60),the MLC site is consistent with the CIL, and they are both located at the hotspot of the contact surface. When the normal load is P ≥2951 N(nL ≤0.40),both the MLC site and the crack initiation position are located in the subsurface.When the normal load is between 1968 N and 2951 N (0.40 < nL < 0.60), the MLC site will undergo a change in which it migrates from the contact surface to the subsurface and eventually coincides with the crack initiation site in the subsurface.
4.3. Influence of tangential load on CIL
Under the condition that the normal force (P = 2000 N) and the axial stress(σ=100 MPa)remain unchanged,the PEEQ,PEEQ difference between subsurface and surface,and ratio of PEEQ increment with the loading cycles of every 20 cycles are shown in Fig. 9(a)-(d) respectively.
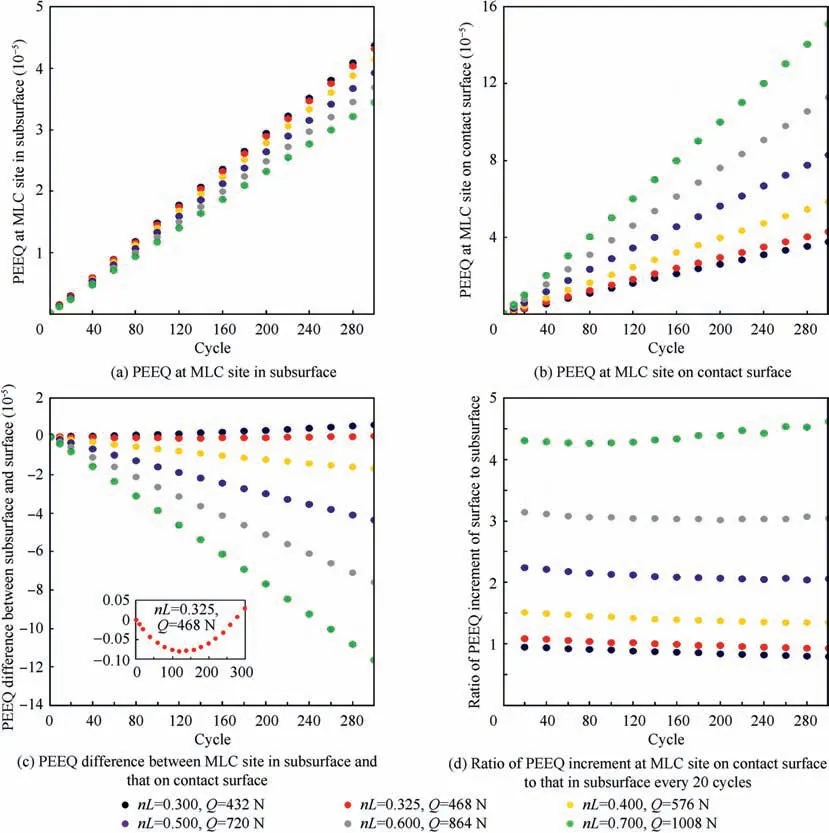
Fig.9 PEEQ,PEEQ difference,and ratio of PEEQ increment vs.number of loading cycles when normal force(P=2000 N)and axial stress (σA = 100.0 MPa) remain unchanged.
As shown in Fig. 10(a), the PEEQ at the MLC site in the subsurface decreases with an increase of the load factor, while the PEEQ at the MLC site on the contact surface increases with an increase of the loading factor, as shown in Fig. 10(b).
When the load factor nL ≤0.30,the PEEQ at the MLC site in the subsurface is greater than that at the MLC site on the contact surface, as shown in Fig. 9(c), and the PEEQ increment at the MLC site in the subsurface is also greater than that at the MLC site on the contact surface, as shown in Fig. 9(d).This means that the MLC site is consistent with the crack initiation position,and both of them are located at the subsurface hot spots,that is,the behavior of the specimen belongs to Type B.
When the loading factor is in the range of (0.30, 0.35), the MLC site will migrate from the hotspot on the contact surface to that in the subsurface with cyclic loading, and will eventually become consistent with the crack initiation position, that is, the behavior of the sample belongs to Type C, as shown in Fig. 10(c).
When the loading factor nL ≥0.35,the PEEQ at the MLC site on the contact surface is always greater than that in the subsurface. In addition, the PEEQ increment at the MLC site on the contact surface is always greater than that at the MLC site in the subsurface.This means that the MLC position of the sample is consistent with the crack initiation position on the contact surface, which is a Type A fatigue, as shown in Fig. 10(c) and (d).
Based on the positive correlation between the loading factor and the tangential load, it can be seen that when the tangential load Q ≤ 432 N (nL ≤ 0.30), the MLC site is consistent with the crack initiation position in the subsurface.When the tangential load Q ≥504 N (nL ≥0.35), the most prone to cracking position is consistent with the initial cracking position,and they are both located at the hot spots on the contact surface. When the tangential load is between 432 N and 504 N (0.30 < nL < 0.35), the MLC site will undergo a change in which it migrates from the contact surface to the subsurface and eventually coincides with the CIL in the subsurface.
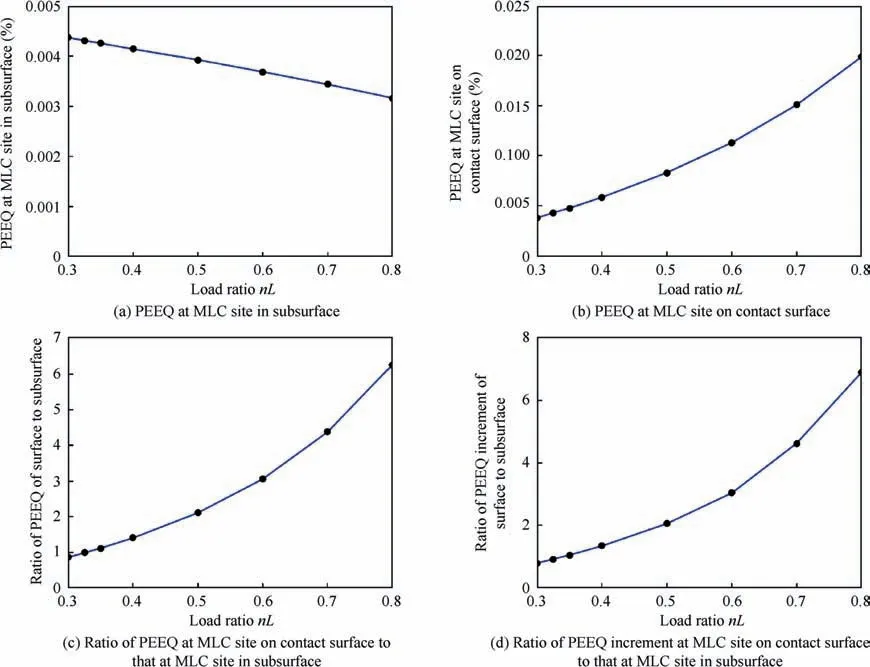
Fig. 10 PEEQ, ratio of PEEQ and ratio of PEEQ increment vs. load ratio nL after 300 cycles of loading.
4.4. Influence of axial stress on CIL
When the normal force (P = 3000 N) and the tangential load(Q=1080 N)remain unchanged,both the PEEQ at the MLC site in the subsurface and that on the contact surface increase with an increase of the axial stress σ, as shown in Fig. 11(a)and (b), respectively.
When the axial stress is σ= 12.5 MPa, the PEEQ at the MLC site in the subsurface is greater than that on the contact surface, and the PEEQ increment at the MLC site in the subsurface is also greater than that on the contact surface, as shown in Fig. 12(c) and (d), respectively. This means that the MLC site is consistent with the CIL at the hotspot in the subsurface, that is, the sample behaves as Type B fatigue.
When the axial stress is 12.5 MPa < σ< 75.0 MPa, the MLC site will migrate from the contact surface to the subsurface with cyclic loading, and will eventually coincide with the crack initiation position, that is, the fatigue of the sample belongs to Type C.
When the axial stress is σ≥75.0 MPa, the PEEQ at the MLC site on the contact surface is always greater than in the subsurface, so does the increment of the PEEQ. This leads to the MLC site of the sample being consistent with the crack initiation position,which are both located on the contact surface.
It should be noted that when the axial stress σ< 12.5 MPa, σwill have a negative value (see Load No. 24 in Table 2), and the MLC site on the contact surface will also migrate from the right side of the midline (0.998, -0.051) to the left side of the midline close to the symmetrical part(-0.985, 0). Therefore, the PEEQ at the MLC site on the contact surface and that in the subsurface increase in the opposite direction within the σ∈(0, 12.5 MPa) range, as shown in Fig. 12. In addition, the limit values of the load factor nL and the axial stress σobtained are based on the results of the given parameters P, Q, and σ. If the value of P, Q, or σis changed, the limit values of nL and σwill also change,but the variation trend of the PEEQ as well as its increment at the MLC site will remain unchanged.
It can be seen that for different types of materials and different geometric contact models, load thresholds between different types of fretting fatigue are different. If we exclude the influence of specific values,we can obtain the following understanding, as shown in Table 3.
(1) When the normal load is small,or the tangential load is large,or the axial stress is large,the initial crack of fretting fatigue is likely to belong to Type A,which has been observed in experiments for nickel-based superalloy and aluminum-based alloy.
(2) When the normal load is large, or the tangential load is small,or the axial stress is small,the initial crack of fretting fatigue is likely to belong to Type B,which has also been found in laboratory tests for FCC metals.
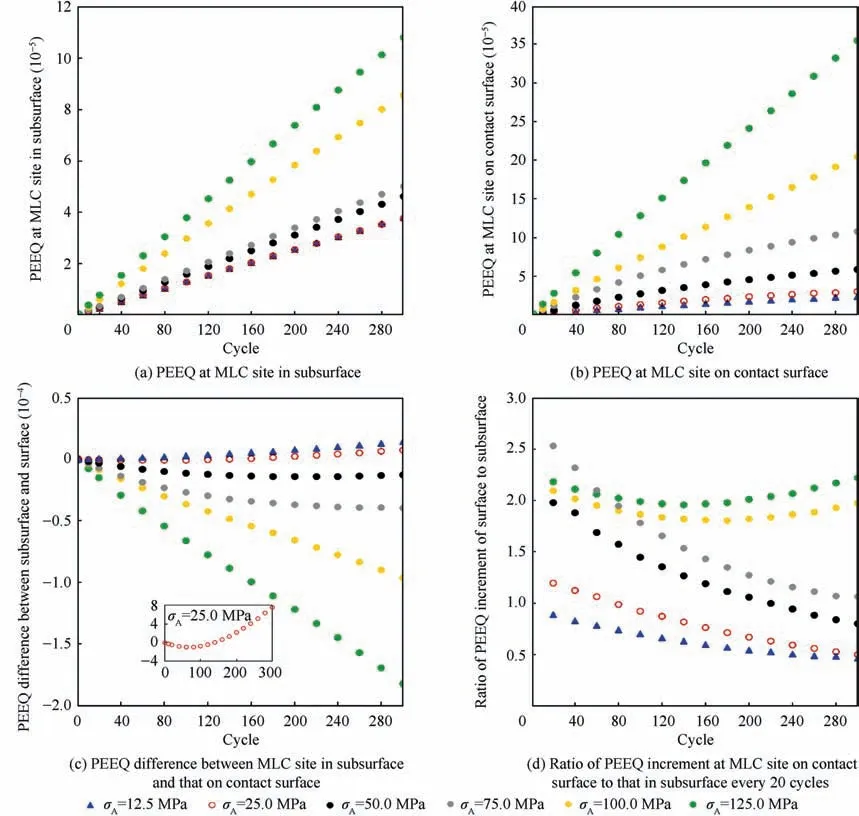
Fig. 11 PEEQ, PEEQ difference and ratio of PEEQ increment vs. number of loading cycles when normal force (P = 3000 N) and tangential load (Q = 1080 N) remain unchanged.
(3) Type C is a transitional type between Type A and Type B. The load value corresponding to Type C is also between the load values corresponding to Type A and Type B. The MLC site of this transitional type will migrate to the surface or the interior as the number of loadings increases. If the change of the MLC site is not considered, it will cause a misjudgment of the CIL.
(4) With a repeated action of cyclic loading, the site of the maximum PEEQ in the specimen may be transformed from a certain element to its adjacent element, but a transformation of the MLC site between the contact surface and the subsurface will not occur. Type D is also relatively rare, like Type C, has not been reported.
The above analysis shows that an anti-fretting fatigue design needs to take targeted measures to its weak parts based on the stress state of structural members during the service period. If the fretting fatigue of a component belongs to Type A,the surface layer needs to be strengthened; if the fretting fatigue of a component belongs to Type B, the subsurface layer needs to be treated; if the fretting fatigue of a component belongs to Type C or D, it needs to be dealt with according to its final cracking state. In addition, the fretting fatigue can also be controlled by optimizing the stress state of structural components in service.
It should be noted that for Type C, theoretically, there is also a situation in which the MLC site migrates from the hot spot in the subsurface to the hot spot on the contact surface.For models with different boundary conditions and simplified methods, calculation results will be different somewhat.In fact, using the stress boundary model,we have found that the MLC site will migrate from the contact surface to the subsurface, while using the fixed displacement boundary model,there will be cases where the MLC site migrates from the subsurface to the contact surface.
5. Conclusions
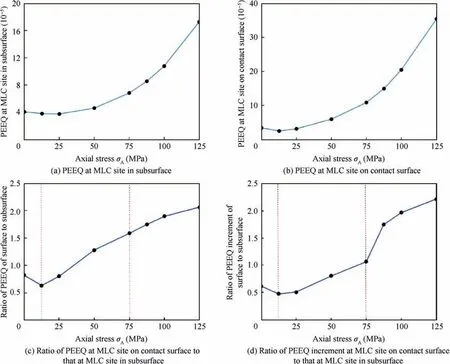
Fig. 12 PEEQ, ratio of PEEQ and ratio of PEEQ increment vs. axial stress σA after 300 cycles of loading.

Table 3 Relationship among types of crack initiation and loading conditions.
(1) Four types of relationships are found between the MLC site and the CIL after a limited number of cyclic loadings: Type A: the MLC site is always the same as the CIL,and both of them are located at the hotspot of the contact surface; Type B: the MLC site is always consistent with the CIL, and they are both located in the subsurface; Type C: the MLC site may also migrate from the hotspot on the contact surface to the hotspot in the subsurface with an increase of the cyclic number,and finally transform into a CIL;Type D:the MLC site migrates inside the subsurface or on the surface of the specimen and finally transforms into a CIL.
(2) For a given tangential load Q and axial stress σ, when the normal load is small,the MLC site and the crack initiation position will be the same, both located on the contact surface, namely Type A. When the normal load is large, both of the MLC site and crack initiation position are located at the same hotspot in the subsurface,namely Type B. Under other working conditions, the MLC site will migrate from the hotspot on the contact surface to that in the subsurface as the number of cyclic loadings increases, and eventually evolve into a CIL,namely Type C.
(3) For a given normal force P and axial stress σ, the PEEQ at the MLC site on the contact surface increases with an increase of the tangential load, while the PEEQ at the MLC site in the subsurface decreases with an increase of the tangential load.When the tangential load is small, the fatigue behavior of the specimen is Type B;when the tangential load is large,the fatigue behavior of the specimen is Type A;in other working conditions,the fatigue behavior of the specimen is Type C.
(4) For a given normal load P and tangential load Q, the PEEQ at the MLC site on the contact surface,the PEEQ at the MLC site in the subsurface, and the ratio of the PEEQ at the MLC site on the contact surface to that in the subsurface all increase with an increase of the axial stress σ.As the axial stress changes from large to small, the specimens appear in the order of Type A,Type C, and Type B.
The research results show that the external load has a significant impact on the CIL of the sample; at the same time,when predicting the initial cracking position, it must be not only based on the results of a limited number of cycles, but also combined with the changing trend of the MLC site to make a comprehensive judgment. In an anti-fretting fatigue design of structural components, it is necessary to identify the fretting fatigue type according to the stress state of its service life,and then put forward the corresponding strengthening measures. The fretting fatigue can also be controlled by optimizing the stress state.
The authors declare that they have no known competing financial interests or personal relationships that could have appeared to influence the work reported in this paper.
This work was co-supported by the Natural Science Foundation of Southwest University of Science and Technology,China (No. 20zx7124) and High-level Foreign Experts Introduction Program from the Ministry of Science and Technology, China (No. G2021036004L).
