An integrated preforming-performance model for high-fidelity performance analysis of cured woven composite part with non-orthogonal yarn angles
Bio LIANG, Ss GAO, Weizho ZHANG
a School of Mechanical Engineering, Northwestern Polytechnical University, Xi’an 710072, China
b College of Mechanical & Electrical Engineering, Shaanxi University of Science & Technology, Xi’an 710021, China
c Department of Mechanical and Automation Engineering, The Chinese University of Hong Kong, Hong Kong, China
KEYWORDS Mechanical properties;Non-orthogonal model;Performance analysis;Woven composites;Yarn angle
Abstract Preforming process would change yarn angle and yarn orientation, its influence on the material properties and material orientations needs to be considered in the performance analysis.However,most current performance models fail to account for the preforming effect.An integrated performance model accounting for the impact of preforming has been developed.In this integrated model, part geometry, yarn angle and orientation after preforming of multiple prepreg layers are predicted by Finite Element Analysis(FEA)using a non-orthogonal constitutive law.Experiments were conducted to validate the preforming simulation for a single dome composites structure made by two prepreg layers with different initial fiber orientations.Performance analysis until failure was then conducted for the single dome structure to validate the integrated performance model. Comparison between simulation and experiment shows that not only the failure mode and failure zone,but also the force-displacement curve during compression process are captured correctly by the performance model,demonstrating the effectiveness of the newly proposed model in accounting for the impact of preforming process.
1. Introduction
Industry sectors, automotive and airspace industries in particular, are pursuing to utilize lightweight materials to improve fuel efficiency and decrease emission.2D woven thermoset prepregs, due to their high performance-to-weight-ratio and superb formability,draw great attentions in these sectors.They can be readily formed into complex shape attributed to their interlacing warp and weft yarns that can rotate easily relatively to each other at the crossover points.
Among the various forming process methods of 2D woven thermoset prepregs, thermoforming process, also called thermo-compression molding process, is extensively utilized due to its high production efficiency, good product quality and relative low facility cost.As illustrated in Fig.1,the first step of thermoforming process is to stack layers of thermoset prepregs in an optimal stacking orientation combination.Then, these prepregs are heated and become soft due to soft or molten resin and subsequently formed to the desired 3D geometry shape in the preforming step. Finally, the parts are cured and trimmed to achieve the designed solid products.
Thermoforming process changes yarn orientations, and most of these yarn re-orientations are introduced in the preforming step.In preforming, 2D woven thermoset prepregs primarily experience in-plane shearing deformation to conform the desired 3D geometry from its original flat shape, resulting in yarn re-orientation and yarn angle change.Fig.2presents an example of distribution of yarn orientation and yarn angle for a double-dome woven prepregs before and after preforming,where white curves mark yarn orientations,and yarn angle is angle between warp and weft yarns. Large yarn angle variations from initial yarn angle of 90°caused by preforming can be observed,particularly in regions with double-curvature features. As for curing step, resin is cured and consolidated,contributing very small to the yarn re-orientation, so it is reasonable to assume that yarn orientation and yarn angle of final cured woven composite part are inherited completely from preforming step.
Since mechanical stiffness and strength of composites are mostly impacted by the orientation and angle of yarns,to have an accurate performance analysis for the cured woven composite part in the design, it is necessary to account for yarn reorientation and yarn angle change caused by the preforming process in the material properties.Mitchell et al.proposed a model called double-orthotropic shell model to research the variation of mechanical properties with respect to yarn angle change.They assumed deformations along the two yarn directions were independent, and there was no tension-shear coupling. This postulation leads to their model that are not suitable for the non-orthogonal woven composites as the existence of tension-shear coupling has already been recorded in many literatures.
Currently the state-of-the-art industry practice to address the influence of manufacturing process in the design uses conservative safety factor which can be as large as 50%,leading to composite part oversizing and weight increasing.Consequently, composite materials can’t be fully exploited to meet the desired benefits.To address the overdesign issue mentioned above, integrated numerical modeling approaches that can consider the manufacturing effect in constitutive law and failure criteria of thermoformed composites for final part performance analysis should be developed.However, only a few research works have been conducted in this areaand performance prediction of the resulted modeling approaches all stops at elastic deformation. Moreover, these existing approaches only simulated single layer of prepreg or multiple layers of prepreg with the same initial fiber orientation, while in industrial application,thermoformed parts are usually made with multiple prepregs layers stacking with various initial fiber orientations for optimal part performance under complex loading. This various orientation configuration will result in large sliding among prepregs,which surely will influence material deformation and yarn re-orientation.
As an advancement,an integrated preforming-performance model accounting for the influence of manufacturing process on both the elastic properties and failure strength of the woven textile composites has been developed and is reported in this paper. In this integrated model, an innovative nonorthogonal material model and accurately characterized prepreg friction behaviors are first adopted in simulation to determine part geometry, and yarn orientation and angle after multiple layer preforming.The non-orthogonal model was previously developed by the authors to fully decouple tension and shear of prepregs so as to eliminate artificially large tensile stress under large shear. The friction behaviors are measured using a novel testing machine so large sliding between prepreg layers with different initial fiber orientations can be captured.Then, the predicted yarn orientation and angle are mapped to the performance analysis, and the preformed part mesh is trimmed and modified to the target final part one. Finally,stiffness and failure simulation are conducted for the thermoformed part,of which properties of cured composites with various non-orthogonal yarn angles are innovatively characterized by physical experiments in combination with numerical modeling of mesoscopic Representative Volume Element(RVE)for effective and complete measurement.After development,this new performance model was utilized to simulate compression of a single dome part made by thermoforming of two prepreg layers with different initial fiber orientations and the result is compared with experiments for validation.
2. Framework of integrated preforming-performance analysis model
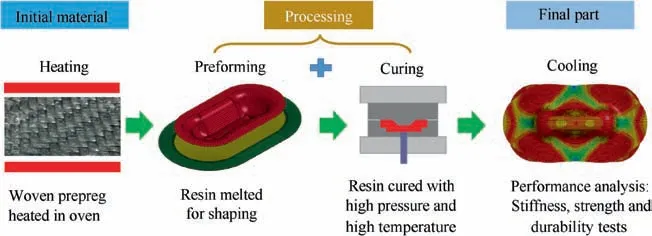
Fig. 1 Schematic of thermoforming process of thermoset woven prepregs.

Fig. 2 Distribution of yarn orientation and angle of 2D woven prepregs before and after preforming.10
The preforming-performance integrated modeling method established in the previous researchis adopted as a starting point. This previous modeling method captures elastic behaviors of parts made by single prepreg layer and the elastic performance analysis was conducted. In practice, however,Carbon Fiber Reinforced Polymer (CFRP) parts are usually manufactured from multiple prepreg layers with various fiber orientations. Therefore, the thermoformed part made by two prepreg layers with initial fiber orientations of [0/45] is analyzed. Single-dome part geometry is selected due to its tool manufacturing convenience and its double curvature that can introduce large yarn orientation variation. Moreover, failure of CFRPs is modeled so part performance under extreme working conditions or long service life can be evaluated. It should be noted here that asymmetric prepreg stacking configurations generally will cause distortion due to the anisotropic thermal expansion and chemical shrinkage during resin curing.However, because the single-dome structure can provide high stiffness, curing-induced distortion is negligible in the presented work based on experimental observation.
The specific flowchart for the proposed integrated preforming-performance modeling is plotted in Fig. 3. In preforming, both prepreg layers are deformed by a set of aluminum single-dome tools. After preforming, yarn orientations and preformed part shape are transferred to the trimming algorithm to cut away the excessive material in the binder region based on element deletion. The trimmed preforming result will then be mapped to the performance analysis with compression loading applied.
3. Prediction of yarn orientation and angle after preforming
3.1.Non-orthogonal constitutive model of woven textile prepregs during preforming
2D woven textile prepregs are highly anisotropic, and their tensile modulus along the two yarn directions, at about 10 GPa level, are much larger than the in-plane shear modulus,at about 0.1 MPa level. As a result, dominant deformation of prepregs during preforming is in-plane shear with large yarn rotation and yarn angle change,as illustrated by Fig.4,where fand fare the initial orthogonal warp and weft yarn directions,eand eare the initial local coordinate x axis and y axis directions, fand fare the current warp and weft yarn directions, eand eare the current coordinate x axis and y axis directions,mis the bisector of eand e,and mis the orthogonal coordinate axis of m.Several modeling methods,such as the Pin-Joint Net (PJN) or fishnet algorithm,hybrid meshand internal virtual work ones,have been developed to capture this specific deformation mechanism. However,application of these methods is constrained due to their unsatisfactory accuracy of prediction or ease of utilization. As an alternative, non-orthogonal modeling methods based on macroscopic continuum have been developed and employed to simulate preforming.As further advancement, a nonorthogonal model that fully decouples tension deformation along yarn directions and in-plane shear between two yarn directions prepregs has been developed.
To assist understanding of the fully decoupling nonorthogonal preforming model,its working principle and stress formulas are demonstrated utilizing three sets of coordinate frames defined on the middle surface of woven prepregs, as shown in Fig. 4. The first one is the local material frame f-f. The deformation gradient tensor is used to correlate the current and initial yarn directions by
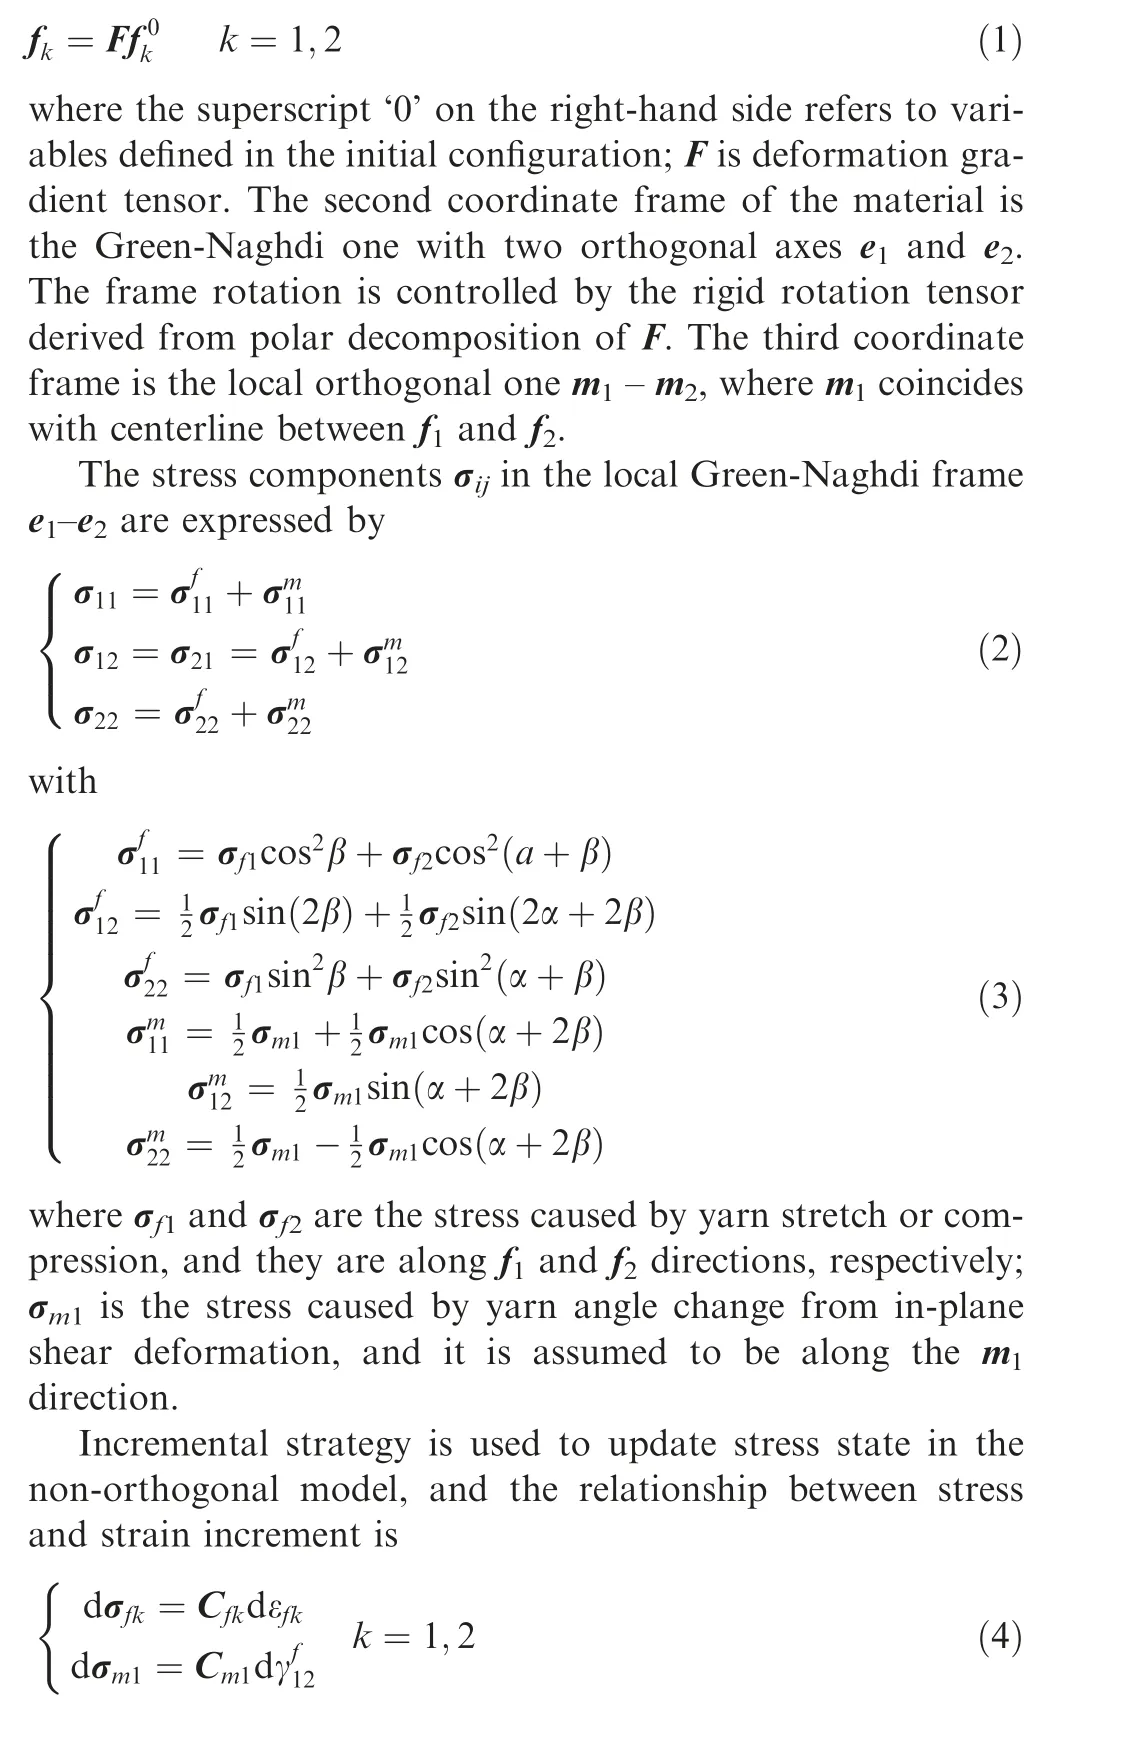
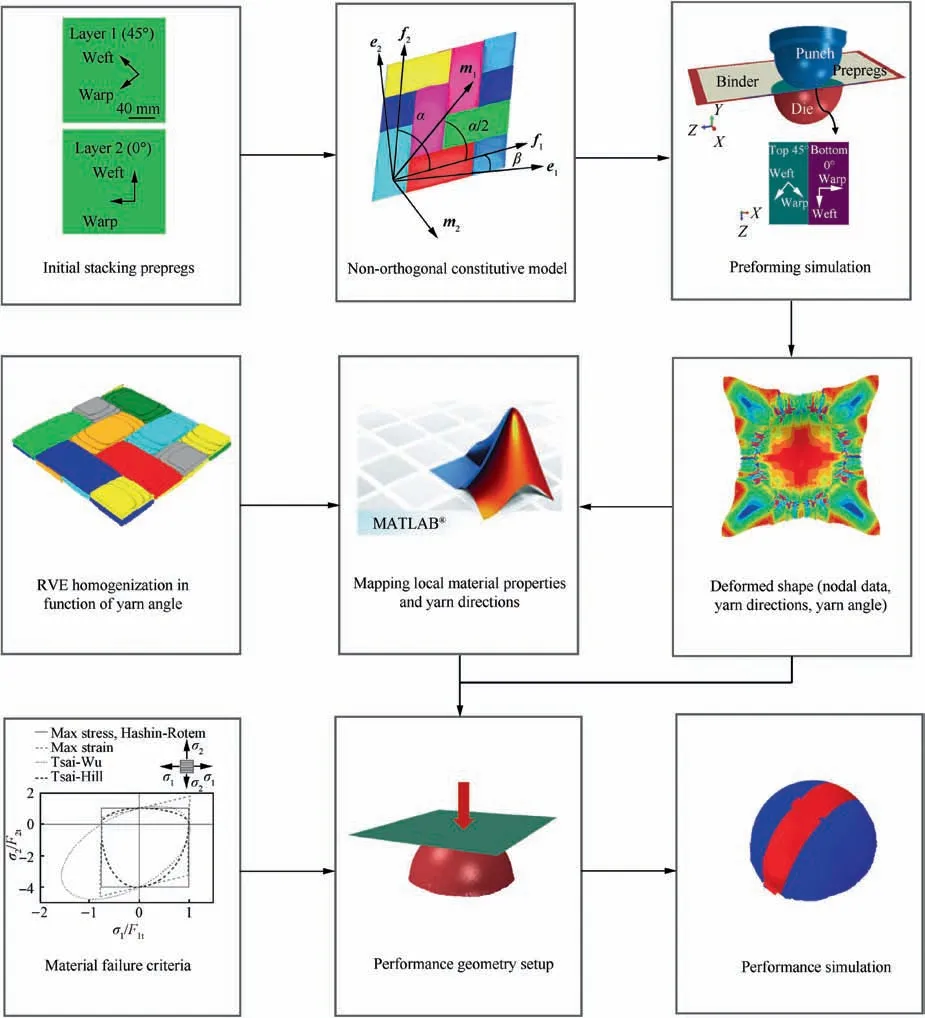
Fig. 3 Flowchart of proposed integrated preforming-performance analysis model accounting for impact of preforming process.

The non-orthogonal model expressed by Eqs. (1)-(4) is implemented into Abaqus Explicit using user-defined material subroutine VUMAT. Mechanical properties of prepregs are characterized by experiments elaborated in Sections 3.2 and 3.3. The obtained properties will then be input into the preforming model to simulate the process and predict part deformation represented by nodal coordinates and yarn orientation and angle stored as state variables, all of which will be extracted and trimmed by a MATLAB code package and mapped to performance model for analysis of final cured woven composite part.
3.2. Characterization of material constants input to nonorthogonal model
Due to the existence of uncured resin transiting from solid to highly viscous fluid at elevated temperature,properties of prepregs are highly dependent on temperature and it is important to ensure constant and uniform temperature field throughout characterization experiments for reliable results. Preforming temperature is fixed at 60 °C because under this condition,resin in the supplied 2×2 twill prepregs melts completely and prepreg formability increases significantly. To correctly model this preforming process, prepreg characterization experiments are also conducted at 60 °C.
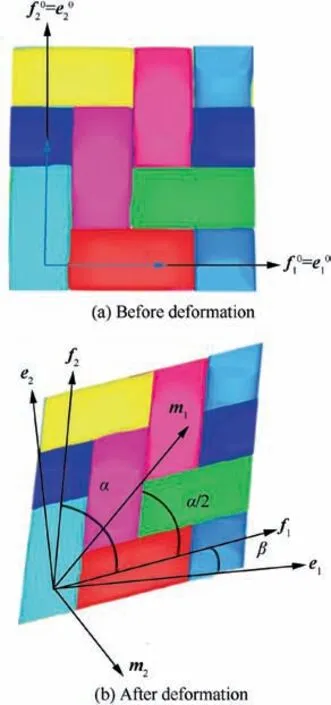
Fig.4 Large in-plane shear of 2D woven prepregs and definition of different coordinate frames before and after prepreg deformation.
Eq. (4) show that input to the non-orthogonal model include elastic tensile moduli along warp and weft yarn directions C(k=1,2)and shear modulus C.Prepregs used have symmetric structures,so C=Cand they are obtained using the uniaxial tension test that apply loading along yarn directions, as shown in Fig. 5(a). On the other hand, Cis measured using the bias-extension test that can introduce pure shear deformation by employing loading along diagonals of the symmetric woven structure, as shown in Fig. 5(b). Both uniaxial tension and bias-extension tests are performed in an environmental chamber for temperature control, as shown in Fig. 5(c), and each test is repeated three times to eliminate experimental error. Before each test, the whole setup in the chamber will be heated up and kept at 60 °C for 5 min to ensure uniform temperature field in the prepregs, surrounding air and clamping tools.
Average results of the uniaxial tension and bias-extension tests at 60°C are plotted in Fig.6.There exists large nonlinearity in both tension and shear behaviors of prepregs because of the woven structure and viscous resin. Therefore, the moduli Cand Cin the non-orthogonal model are treated as functions of deformation.Specifically,Cof the supplied prepregs is set to be dependent on engineering strain along the corresponding yarn direction.At the initial undulation stage of tension,curved yarns in the woven structure are straightened(red circle zone in Fig.6(a)).Then the straight yarns provide almost constant C,which are 8.10 GPa.Value of Cunder compression cannot be determined directly by the uniaxial tension test.Instead, it is determined by the cantilever beam bending. The obtained compressive Cis 10.96 MPa. As for shear, Chas higher nonlinearity than Cbecause it involves more complicate deformation of yarn in the transverse direction. For convenience of data interpretation and implementation, Cis described phenomenologically and regressed by a sixth order polynomial function of yarn angle change,as demonstrated in Fig. 6(b). Parameters of the regression function are input directly to the non-orthogonal model.
3.3. Characterization of prepreg surface friction
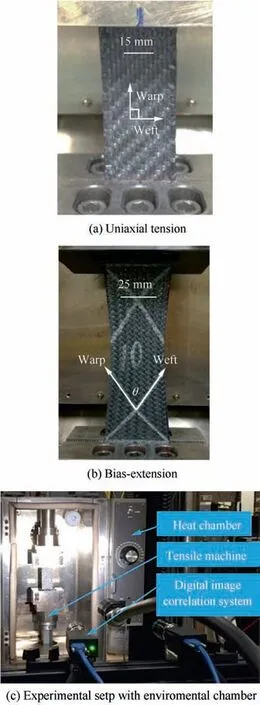
Fig. 5 Tests needed for material parameters identification in non-orthogonal model.
Woven prepregs have anisotropic mechanical properties because of existence of fibrous reinforcements along specific directions.As a result,when prepregs stacked with various initial fiber orientations are preformed,there will be large relative sliding. The sliding will cause dynamic friction and constrain prepreg deformation, affecting re-orientation of fiber yarns after preforming. So it is essential to accurately measure prepreg surface friction under the preforming condition and input the results to the process simulation.
Various tests have been conducted previously using different lab-scale setup to measure prepreg friction.A testing setup shown in Fig. 7 is adopted to measure the friction. Relative movement of prepregs can be constrained strictly to transitional movement, and normal and friction forces can be continuously recorded during the test for calculation of Coefficient of Friction(CoF).The prepreg sample on the top covers all the way to the sides of the motion stage so the edge effect can be eliminated.
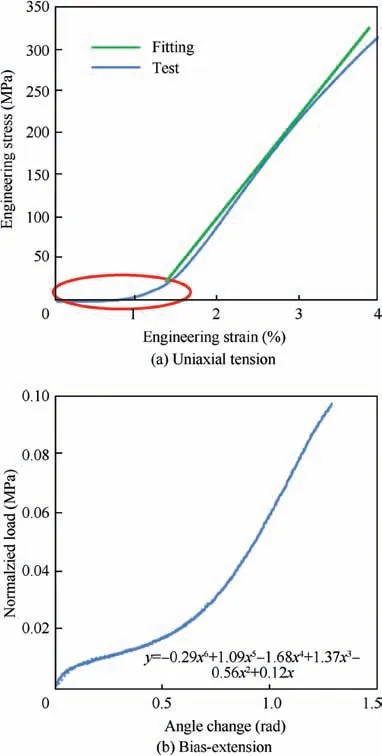
Fig. 6 Average results of uniaxial tension and bias-extension tests at 60 °C.
Prepregs under preforming conditions include woven fabrics and viscous resin, so prepreg friction involves a complex mixed lubrication mechanism, which should be affected by normal pressure, relative motion speed and fiber orientations that determines surface textures. Normal pressure in the single-dome preforming experiment studied is estimated to be 10 kPa by using average forming force divided by prepreg surface area. During preforming, 2D sheets are deformed into complex 3D parts, so relative motion speed varies throughout the forming region, and speed for friction characterization is selected to be 5, 10 and 15 mm/s. For the fiber orientations,it is set as [0/45] initially in the single-dome preforming, but as the process continues, relative rotation between prepregs happens due to material anisotropy. Therefore [0/0] and[0/45]fiber orientations are used in this friction test to characterize modeling input and analyze the orientation effect on the friction coefficient.
Results of the prepreg surface friction characterization with previously designed parameters are plotted in Fig. 8, where[0/0] and [0/45] mean fiber stacking orientations, respectively.It can be seen that for the supplied prepregs at 60 °C, CoFs at different conditions are all larger than 1.5 due to existence of the tacky resin.Sliding rate effect to CoF is negligible,while there is around 15% decrease of CoF when fiber orientation changes from [0/0] to [0/45]. In current Abaqus Explicit preforming model, average CoF of both fiber orientations, 1.83,is simulated by the isotropic Coulomb friction law for simplification.
3.4. Preforming simulation and validation
Single-dome part geometry is selected due to its compact sizes that can be fitted inside the environmental chamber for stable temperature control. Setup of the double-layer preforming model with the single dome geometry is shown in Fig. 9.Two square prepreg layers with side length of 130 mm and thickness of 0.8 mm are discretized by Abaqus S4R elements.The top, closer to punch, and bottom layers have initial fiber orientation of 45° and 0° with respect to the global frame XYZ, respectively. These two layers are deformed by a set of single-dome tools, simulated by rigid elements, with diameter of 70 mm. The preforming simulation is executed via Abaqus Explicit. During preforming, the die is fixed, a compressive force of 51 N is applied to the binder, and the punch moves down by 35 mm. Yarn directions of each element are stored in state variables and they are extracted together with mesh node coordinates when preforming simulation completes.
To validate the two-layer preforming model,an experiment is conducted with the configuration shown in Fig. 10. The whole press is built on a universal testing machine with an environmental chamber to control the preforming temperature to be constant at 60 °C, as shown in Fig. 10. The tools are made up with aluminum and attached to the machine using customized adaptors. Displacement-control of the punch is achieved directly by the universal testing machine,while binder force is introduced by 12 springs, for uniform pressure distribution. During experiment, the tools and prepregs are first heated to 60°C and kept for 5 min to ensure uniform temperature field throughout air,prepregs and tools.Then,the punch moves down to deform the prepregs. After preforming, the whole system will be gradually cooled down to room temperature and finally the preformed part can be taken out.
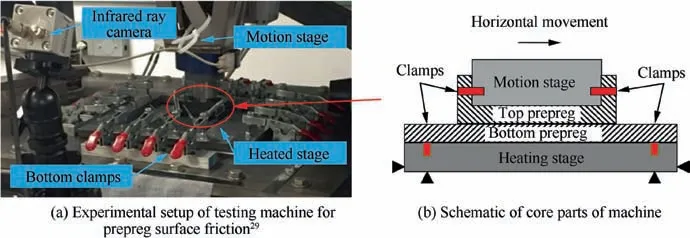
Fig. 7 Experimental setup of testing machine for prepreg surface friction and schematic of core parts of machine.
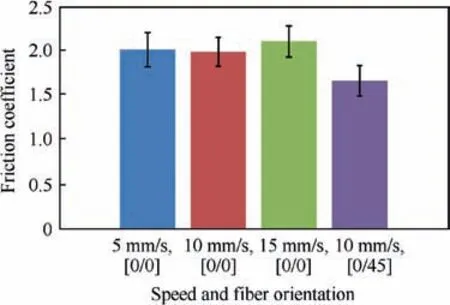
Fig. 8 Woven prepreg surface friction characterization results.
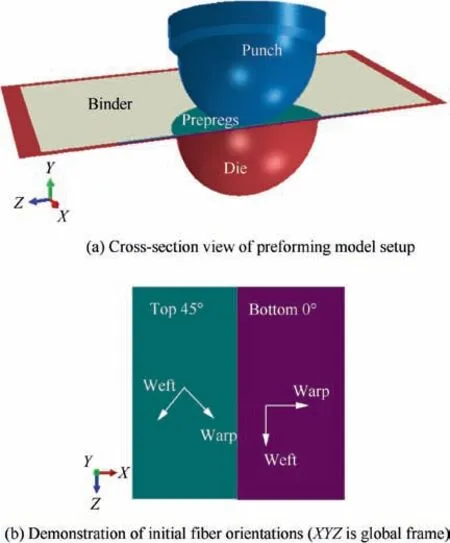
Fig. 9 Cross-section view of preforming model setup and demonstration of initial fiber orientations.
After the preforming simulation and experiment, draw-in distances that represent deformation of the prepregs are calculated and compared first. The measurement directions are shown in Fig. 11 and the results are listed in Table 1. Slight asymmetry in simulation is observed and might be explained by instability from large friction, while asymmetry in experiment is very likely to be induced by non-uniform material properties and preforming boundary conditions. In four measurements from simulation,two have less than 3.6%error,one has less than 18.4% error, and one has around 28.5% error,which may be related to simplified modeling of friction and through-thickness deformation. Although two out of four(50%) measurements on simulation result have over 15% discrepancy compared to the experiment, this discrepancy has negligible effect on performance prediction of the final single-dome part, as material in the binder region will be trimmed away after preforming, and final single-dome parts in both simulation and physical experiments will have similar geometry for performance analysis.
Next, yarn angles, as representation of fiber directions, are measured from both simulation and experiment.The sampling points all locate in the dome region since the binder region will be removed after trimming. The measurement was conducted along coordinate axes and 45° off the axes, as illustrated by the example in Fig. 12.Along each curved measurement path,there are 4 equally spaced sampling points. Due to the single dome geometry and woven prepreg structure, there are 4 symmetric paths for both coordinate axes and 45° off directions.Yarn angles on these symmetric paths are all measured and then averaged to minimize measurement error, and the results are listed in Table 2.It can be seen that the model successfully captures the yarn angle variation. The simulation leads to less than 12.5%error in fifteen out of sixteen(94%)measurements,with only one measurement on the single-dome edge has discrepancy of around 33.2%. Possible reasons of large discrepancy at this single sampling point might be (A) Non-uniform mechanical properties of real prepregs; (B) Localized locking between rough fabric surfaces of two prepreg layers; and (C)Slight difference in boundary conditions between the ideal simulation model and physical experiment. In summary, the nonorthogonal modeling method leads to yarn angle prediction error of less than 12.5% in around 94% sampling points in the two-layer single-dome part, meaning it can provide accurate information about preforming effect on final part performance analysis.
4. Performance analysis and validation
4.1. Performance modeling of thermoformed single-dome part
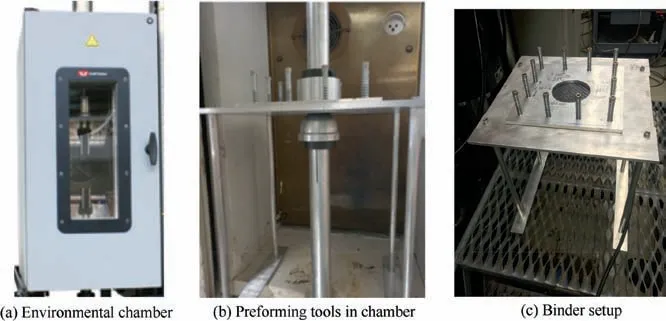
Fig. 10 Setup of single-dome preforming experiment and springs to control binder force.
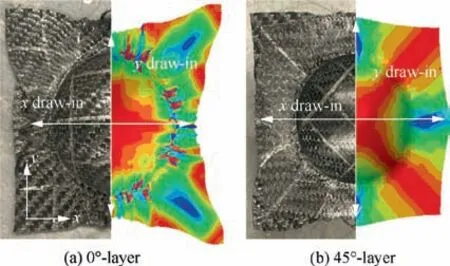
Fig. 11 Draw-in measurement directions in simulation and experiment results.
Setup of the performance model is shown in Fig. 13, in which the mesh of the two prepreg layers after preforming obtained in Section 3.3 is trimmed are then utilized for the part discretization. Yarn orientation and yarn angle from preforming are then exported and mapped to each material integration point in the performance model by an in-house MATLAB code.Thickness of the two-layer part after curing is(1.22±0.05)mm.In the performance model,section thickness of each layer is set to be 0.61 mm and the overall fiber volume fraction is 0.46.During simulation, compressive loading is applied by a displacementcontrolled rigid plate to the dome center,while fixed displacement boundary condition in the loading direction is directly applied to the dome edge, as shown in Fig. 13(a). Resin solidification induced by curing connect two prepreg layers to a single piece,so in the performance model two prepreg layers are bonded together with the Abaqus Tie constraint. Tie constraint cannot capture inter-ply delamination, but experimental validation presented in Section 4.2 shows that under the designed compressive loading condition,the primary damage mode of the single-dome part is caused by the compression along yarn directions instead of the inter-ply delamination. Therefore, selection of Tie constraint is reasonable for the presented performance analysis.
In the performance model, cured non-orthogonal composites are modeled as brittle materials before failure, and the incremental stress and strain in the performance analysis is related by

Table 1 Draw-in values from experiment and simulation.
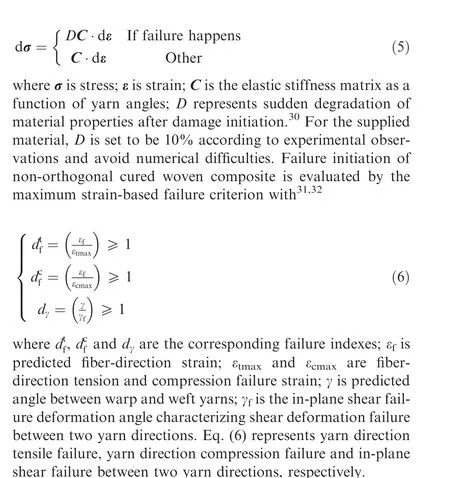
To effectively determine mechanical properties of cured composites with non-orthogonal yarn angle caused by preforming,a virtual and physical combined approach is applied.The numerical RVE simulation is utilized to obtain elastic stiffness matrix C of composites with various yarn angles because it is convenient to change yarn angles and apply target material deformation in virtual models. More details are referred to see our previous paper.Fig.14 shows the stiffness components of C versus different yarn angles,which are in-put in the performance analysis, and overall fiber volume fraction is 0.46.Cand Care the tensile stiffness constants along the local 1 and 2 direction in Fig. 14(a), Cdenotes the stiffness constants related to in-plane shear deformation, Cstands for the stiffness components related to tension-tension coupling, Cand Ccharacterize the tension-shear coupling.
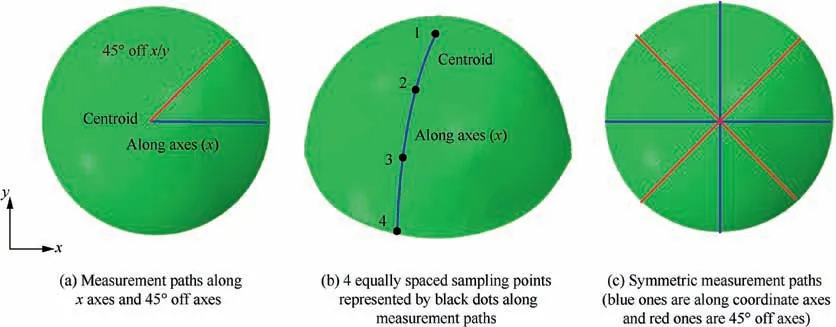
Fig. 12 Measurement paths defined for comparison between simulation and experiment and symmetric measurement paths.

Table 2 Draw-in values from experiment and simulation.
Tension and compression failure strain εand εare characterized by uniaxial tension and compression tests with load applied along yarn directions. Only composite samples with orthogonal yarn angle are tested because εand εand are assumed to be independent of yarn angle. Stressstrain curves of all valid uniaxial tension and compression tests are plotted in Fig.15(a)and(b),respectively.Failure strains of all tests are averaged to obtain input to the performance model as εequals to 1.41% and εequals to 0.71%.
To characterize in-plane shear failure deformation angle γthat is dependent on yarn angle α,non-orthogonal cured composite samples are prepared by an approach similar to the ones recorded in Ref. 12. Table 3 gives a summary of shear failure deformation angles of samples with various yarn angles. It should be noted that discrete γvalues are identified by physical experiments. In part performance simulation, linear interpolation is applied to determine specific γat an arbitrary yarn angle.
4.2. Experimental validation of performance model
For performance model validation, compressive loading is applied to the single dome part and the loading condition is shown in Fig. 16(a). Failure pattern from outside and inside of the dome are shown in Fig.16(b)and(c),respectively,indicating that the major failure format is the in-plane compression failure along yarn directions, supporting the Tie constraint assumption in the performance model mentioned in Section 4.1.

Fig. 13 Setup of performance simulation model and yarn angle mapping of two composite plies from preforming in performance analysis.
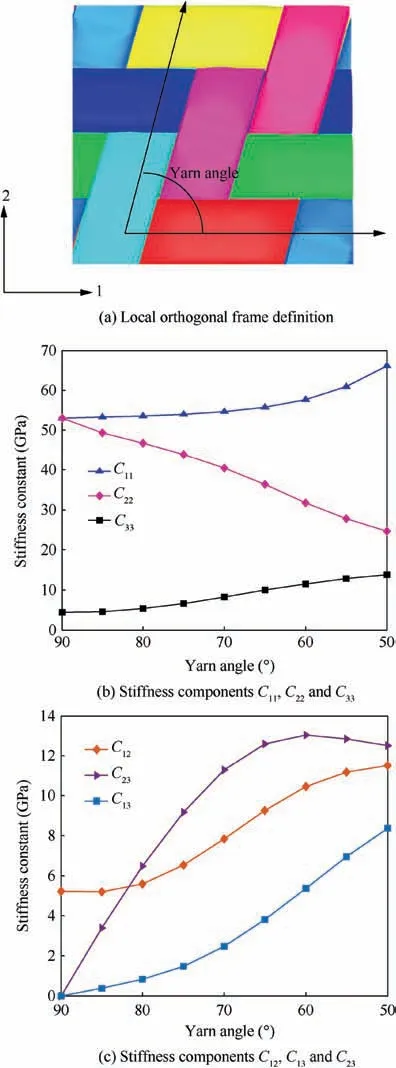
Fig. 14 Homogenized stiffness components of RVEs with various yarn angles.10
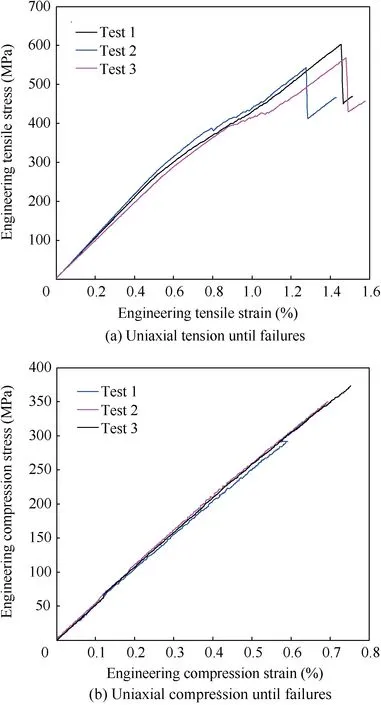
Fig. 15 Experimental identification of tension and compression failure strain along fiber direction.

Table 3 Shear failure deformation angles of samples with various yarn angles.
Fig.16(c)present the failure regions and mode from performance model prediction.The predicted failure regions concentrate on central lines of the dome,similar to the ones observed in the experiment,as shown in Fig.16(b),except that the modeling result has longer failure regions that go all the way to the edge. Compressive force-displacement curves from model prediction and test are also compared,as plotted in Fig.17.In the experiment, compressive displacement goes all the way to 15 mm, while in the simulation, compressive dis-placement is constrained to 2 mm to avoid part buckling. Therefore, the range of x axis in Fig. 17 is from 0 to 2 mm. The comparison result indicates that the performance model, with preforming induced yarn orientation variation considered, successfully captures mechanical behaviors of the [0/45] two-layer singledome part before and after failure initiation, demonstrating the effectiveness of the proposed integrated preformingperformance model.
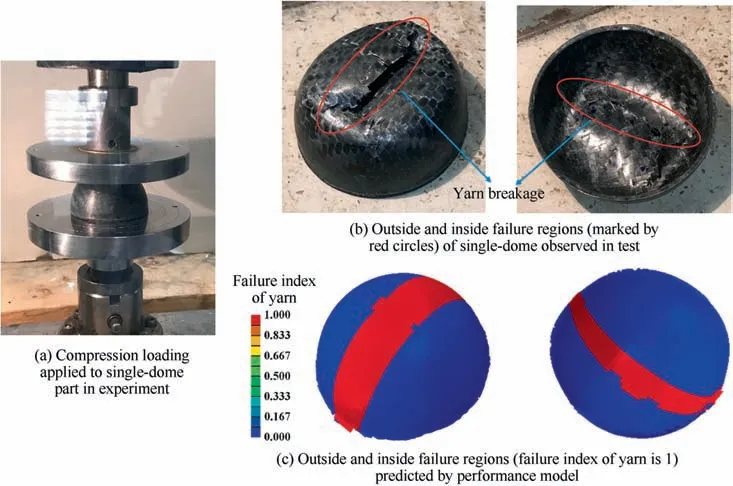
Fig. 16 Experimental setup, failure observed in experiment and predicted by performance model.
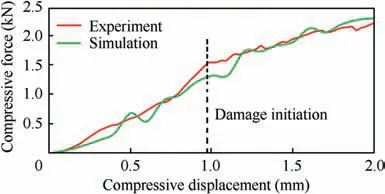
Fig. 17 Comparison of simulated and experimental load-displacement curves from double-layer single-dome part compression.
5. Conclusions
During the preforming process of woven textile composites in thermoforming, large yarn re-orientation and yarn angle change happen, having significant impact on material properties of final cured woven composites. To accurately simulate mechanical behaviors of thermoformed composite parts, an integrated preforming-performance analysis model has been developed. To predict yarn angle and yarn orientation after preforming,properties of prepreg under preforming conditions are characterized by customized experiments,then input to the Abaqus Explicit model utilizing a non-orthogonal constitutive law for preforming simulation.Simulation results are validated in the aspects of draw-in distances and yarn angles by a twolayer single-dome preforming experiment with [0/45] initial fiber orientations. Performance modeling of the double-layer single-dome composite structure made by thermoforming is then conducted, with local yarn orientations and part mesh mapped from preforming simulation, and yarn-angledependent local material properties identified by a numerical and physical combined approach.Maximum strain-based failure criterion and sudden degradation of material properties after failure onsets are adopted in the performance simulation.The predicted failure mode, regions and load-displacement curve are experimentally verified. Despite certain discrepancies, the overall prediction accuracy is satisfactory. In the future, these discrepancies can be further eliminated by improving (A) Modeling of prepreg surface friction and through-thickness deformation during preforming; and (B)Failure criteria and degradation of material properties in performance simulation.This paper works as a useful basis for the integrated designing and modeling of woven composite part with non-orthogonal yarn angles caused by double curvature features.
The authors declare that they have no known competing financial interests or personal relationships that could have appeared to influence the work reported in this paper.
The authors appreciate the financial support from the Young Fund of Natural Science Foundation of Shaanxi Province,China (Nos. 2020JQ-121 and 2020JQ-701), and the Direct Grant for Research, China (No. 4055130) from the Chinese University of Hong Kong, China. The authors also gratefully acknowledge the assistance from Dr. Joel S. Fenner in experiments on cured composites (Northwestern University, U.S.).
