An inverse strategy to determine constitutive parameters of tubular materials for hydroforming processes
Bin ZHANG, Benny ENDELT, Lihui LANG, Yng ZHAO, Shu YAN,Krl Brin NIELSEN
a Department of Materials and Production, Aalborg University, Aalborg 9220, Denmark
b School of Mechanical Engineering and Automation, Beihang University, Beijing 100083, China
c School of Materials Science and Engineering, Northeastern University, Shenyang 110819, China
d Department of Mechanical and Production Engineering, Aarhus University, Aarhus 8000, Denmark
KEYWORDS Aluminum alloy;Constitutive parameter;Hydraulic bulging test;Inverse modelling;Tubular material
Abstract This paper is to determine the flow stress curve of 5049-O aluminium alloy by a tube hydraulic bulging test with fixed end-conditions. During this test, several tubular specimens are bulged under different internal pressures before their bursting, and the corresponding bulging height and wall thickness at the pole are measured. An inverse strategy is developed to determine the constitutive parameters of tubular materials based on experimental data, which combines the finite element method with gradient-based optimization techniques. In this scheme, the objective function is formulated with the sum of least squares of the error between numerical and experimental data,and finite difference approximation is used to calculate the gradient.The tubular material behavior is assumed to meet the von Mises yield criterion and Hollomon exponential hardening law. Then, constitutive parameters identification is performed by minimization of the objective function. In order to validate the performance of this framework, identified parameters are compared with those obtained by two types of theoretical models, and tensile tests are performed on specimens cut from the same tubes. The comparison shows that this inverse framework is robust and can achieve a more accurate parameter identification by eliminating mechanical and geometrical assumptions in classical theoretical analysis.
1. Introduction
Tube hydroforming technology has been proven to be a successful manufacturing process and can form tubular metal blanks into various complex tube components.Such a forming process is widely utilized in the aviation and aerospace industryowing to its advantages such as weight reduction,increase of part complexity,and cost savings.A robust and productive hydroforming process depends heavily on several process parameters like incoming tubular material, preforming operation, fluid pressure loading path, lubrication, equipment, and tools. Among the above factors, materials properties, i.e. the flow stress curve and the tool-workpiece friction, have drastic influences on the quality of final hydroformed parts. Besides,an accurate evaluation of incoming tube material properties is essential for the input data in the Finite Element Method(FEM).
To determine tubular metal properties, a number of industrial tests have been carried out to measure material behaviors.One of the simplest methods is the tensile test which is used to test sheet metal behaviors commonly.When it is applied on a tubular material, specimens can be cut from the tube wall at different locations along the longitudinal and circumferential directions,and then will be flattened and tested under uniaxial tension according to the ASTM standard.However, the flattening process of curved specimens before testing will change their strain-stress behaviors and formability, especially those cut from small-diameter tubes. The ring hoop tensile test can avoid the unnecessary work hardening caused by flattening and measure the hoop flow stress curve of a tubular material accurately. In this test, a ring specimen with a reduced section is taken from a tube along the hoop direction and then pulled by a universal tensile apparatus. A disadvantage of this method is the friction on the interface between the specimen and a pair of blocks, which will lead to some measuring errors.
Another more accurate method to measure tubular material properties is the hydraulic bulge test,because the stress state of specimens under this procedure is close to the realistic hydroforming process. A number of efforts have been made to various types of hydraulic bulge testing methods and postprocessing procedures for experimental data.Fuchizawa et al.ignored the stress through thickness and calculated stress components along circumferential and longitudinal directions based on the recorded internal pressure, wall thickness, and bulge height near the tube center in experiments. The use of three displacement sensors to improve the accuracy of measuring the meridian profile shape increased the complexity and cost of the hydraulic press. Hwang et al.proposed a simple analytical model where the bugle profile shape was assumed as an elliptical curve to avoid measuring the longitudinal curve radius, and the flow stress curve could be obtained when only the tube center diameter and pole thickness were measured.
Other studies on theoretical analysis for the hydro bulge process are similar,in which they followed the same stress formulas as those of Hwang et al.and Fuchizawa et al.and only changed the shape assumption. The meridian profile shape could be assumed as two circular arcs,spline functions.However, to calculate the axial stress component, those researchers adopted an unreasonable hypothesis that tubular specimens and dies were regarded as a whole and isolated the analyses for stress and strain. Bortot et al.introduced a plastic strain-stress relationship, i.e. strain components were proportional to the corresponding deviatoric stress to derive the longitudinal stress component while the tube thickness was ignored in the radical force equilibrium equation for a pole element.In all the above analytical approaches,the tube deformation was treated as a plane stress problem, and the tube bulge profile was assumed as a simple mathematical formula;this simplicity reduced the accuracy of results to some extent.
A substantial progress for the identification material parameters of analytical models is the application of the inverse modelling strategy which combines the optimization technique with the FEM model and obtains the optimum material coefficients by minimizing the difference between numerical simulation results and experimental data.Compared with the classical theoretical equations, it allows a more accurate determination by avoiding mechanical and geometrical assumptions.A large number of publications focused on the inverse identification of sheet metal properties,and limited work was carried out on the application of inverse modelling on the tube hydraulic bulge test.Zribi et al.used this inverse procedure combining the FEM with Nelder Mead simplex algorithm to identify material constitutive parameters of tubular parts made of low carbon steel.The gap of the internal pressure versus the bulge curve between collected from a free hydraulic bulging experiment and FEM responses was set as the cost function. One limitation of this research was that the direct search algorithm in the strategy showed a lower efficiency and a lack of comparison with classical theoretical analysis.
In this paper, a novel and flexible hydraulic setup is designed, and several tube hydraulic tests with fixed endconditions for annealed 5049 aluminium alloy are carried out. The bulge height, wall thickness at the pole, and applied internal pressure are measured during the process. An inverse modelling technique combining the FEM model and an improved Levenberg-Marquardt algorithm is used to determine the tubular materials constitutive parameters of 5049-O aluminium alloy. A general objective function is created to evaluate the difference between computed and experimental data, and material constitutive parameters are identified by minimizing this function. Meanwhile, two theoretical models based on the force equilibrium and total strain theory for this process are given, and tensile tests for specimens cut from the tube along the longitudinal direction are performed. In order to demonstrate the inverse strategy’s feasibility and performance, a comparison of three types of methods is carried out by running FEM simulation of the tube hydraulic bulging process.
2. Hydraulic bulging test analysis
A tube hydraulic bulging test is a material characterization method which expands a tubular material into a suitable shape freely using the internal fluid pressure. In the test, some data such as the bulge height, internal pressure, and pole thickness can be measured online or offline,and then these collected data can be used further to determine tubular material properties.Fig. 1 illustrates a typical tube hydraulic bulging process. In general,this test includes three types of end-conditions at tube ends:A)Free-end,B)Forced-end, and C)Fixed-end;the ends of a tubular workpiece are fixed completely in current study.
2.1. Geometrical analysis

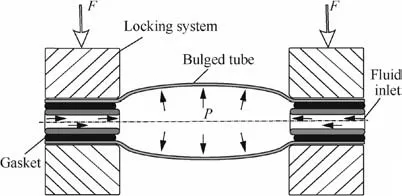
Fig. 1 Schematic for tube hydraulic bulging process.
is the initial tube wall thickness, Lis the length of the bulge zone, h is the bulge height. The elliptical curve can be defined as
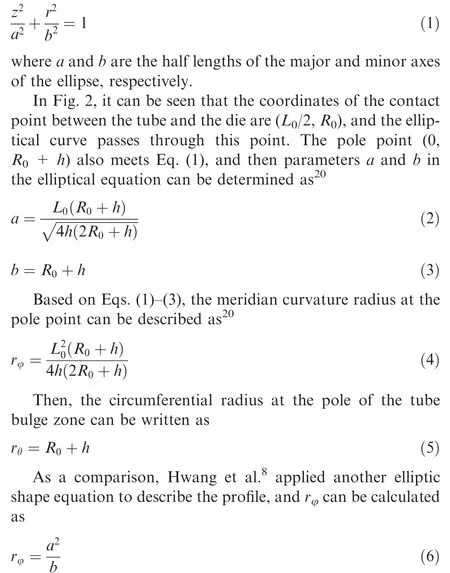
It can be seen from Eq. (1)-(6) that the meridian and circumferential radii depend on the bulge height, tube thickness,and diameter,which can be measured during the hydraulic bulging test.
2.2. Stress analysis
For the thin-walled tube used in this research, the ratio of its thickness to diameter ≪1, so the stress within the workpiece can be referred as the plane stress state according to assumptions in the membrane theory. It means that the stress along the thickness direction is zero, i.e.
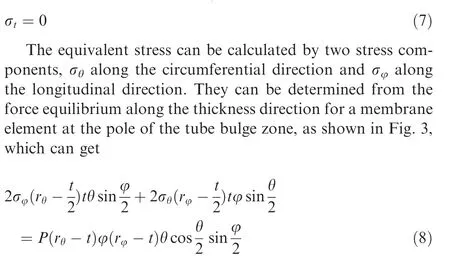
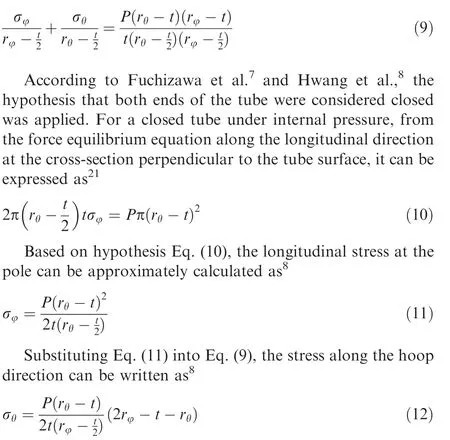

Fig. 2 Tube geometrical parameters before and after bulging test.
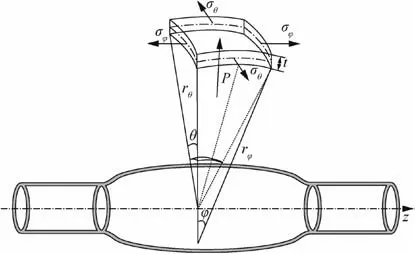
Fig. 3 Stress state of a small element at tube pole.
where rand rare the circumferential and meridian curve radii at a point of the tubular elliptical surface, respectively;P is the internal fluid pressure; θ and φ are the angles on the planes of hoop and meridian, respectively. When these angles are small, Eq. (8) can be rewritten asThe other method to calculate the stress along the longitudinal direction is presented based on the total strain theory proposed by Ilyushin and Lensky.During the test,the internal fluid pressure increases continuously without intermediate unloading. The Ilyushin plastic strain-stress relationship can be expressed by
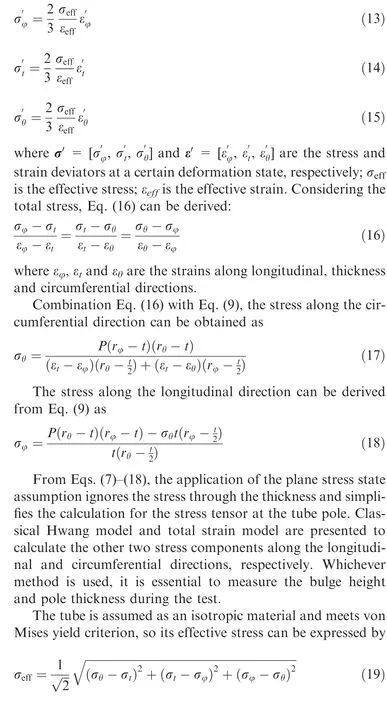
where σ, σand σcan be obtained using Eqs. (7), (17), (18).
2.3. Strain analysis
For a calculation of the strain tensor at the pole point,assume that the strain increment is continuous and the principal strain direction keeps identical during the test. Thus, the strains along the circumferential and thickness directions can be described as
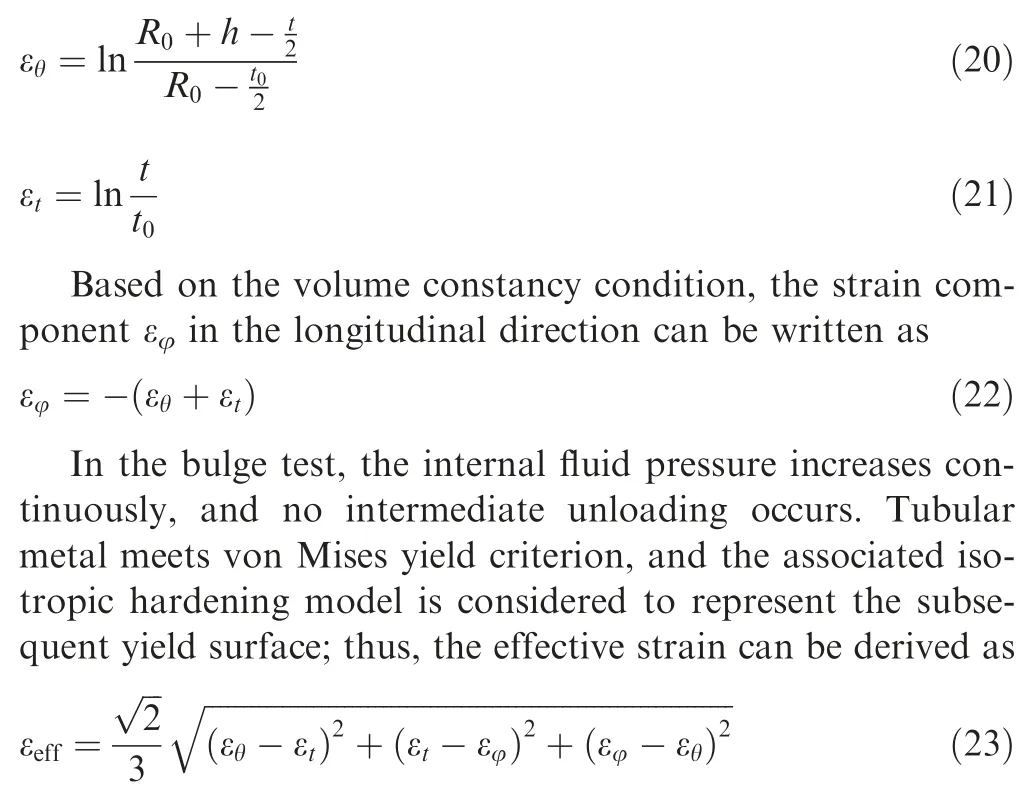
3. Inverse strategy
The inverse modelling technique can be used to explore the optimum process design and identify material constitutive parameters. In general, an establishment process of inverse schemes involves the following steps: (A) Problem statement and FEM modelling;(B)Definition of design variables,objective functions, and constraints; (C) Data collection and solution for the optimization problem; (D) Evaluation of potential optimum parameters.Fig.4 illustrates the flow chart of the inverse framework applied to determine constitutive parameters of tubular materials. The key steps mentioned above will be elaborated separately.
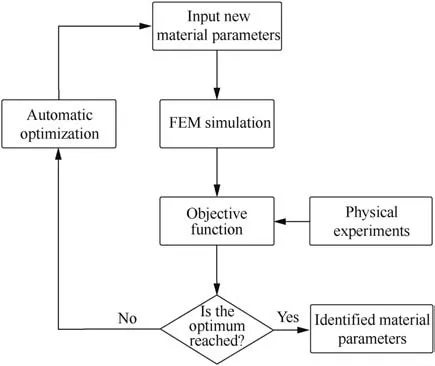
Fig. 4 Flow chart of inverse framework used for parameters identification of tubular materials.
3.1. FEM modelling of tube bulging process
The FEM model for the tube bulge process is created by general-purpose programme LS-DYNA, which is shown in Fig. 5. In this model, the tube is meshed by threedimensional solid elements with eight-node hexahedrons, and three elements are produced through the tube wall thickness for an accurate response. Tubes used in the experiment are annealed,and the holding time lasts for 3 h,which means that the material has a strong isotropy. The von Mises yield criterion and Hollomon isotropic hardening law are used to describe the tubular materials’ mechanical behaviors.
The internal fluid pressure is referred to as the compression stress and applied on the inner wall of the tube along the radial direction, and the pressure curve follows the one collected from the experiment. In order to reduce the calculation time,the mass scaling strategy is used, and a half of the tube is selected as the FEM model. Tube ends are fixed at all translational and rotational directions, because there is no sliding between tubes and the locking system by observation and measurement during the test.
3.2. Objective function and design variables
The nature of an inverse analysis is an optimization problem where design variables, i.e. material mechanical coefficients,are identified by minimizing the objective function under specified constraints.The material response under plastic deformation can be described by variety of constitutive equations with mathematical coefficients which will also be imported into FEM models easily. Therefore, the objective of the inverse analysis is to find the material parameters in the constitutive models, and the design variables can be defined as
x=[x,x,...,x](24)
where n is the number of coefficients in the material model,and xis the j th element in this vector.To characterize tubular material mechanical properties with unknown design variables,a common elastic-plastic model with power law isotropic hardening is used to describe its behavior where the flow stress equation can be expressed as

where K is the strength coefficient;e is the hardening exponent,and these two material parameters can be selected as design variables.
The objective function is a pointer to evaluate the error between experimental and simulated data, which should have the following properties:
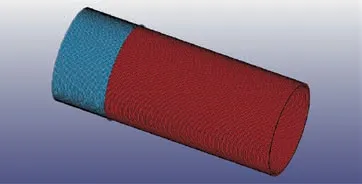
Fig. 5 FEM model for hydraulic bulging process.
(1) All collected experimental data using different methods and equipment should be involved in the iteration process.
(2) The final optimization results should not be sensitive to the unit of the data.
(3) Weighting factors need to be allocated to different experimental points according to their physical characteristics.In the tube hydraulic bulge test, the filling height and pole thickness under different internal pressures are collected, so the cost function should consist of the above two terms.Meanwhile,an error definition with a least square structure is introduced to increase the sensitivity of the cost function to the design variables and reduce the influences of the two measure indicators’magnitudes.Therefore,the objective function can be defined as
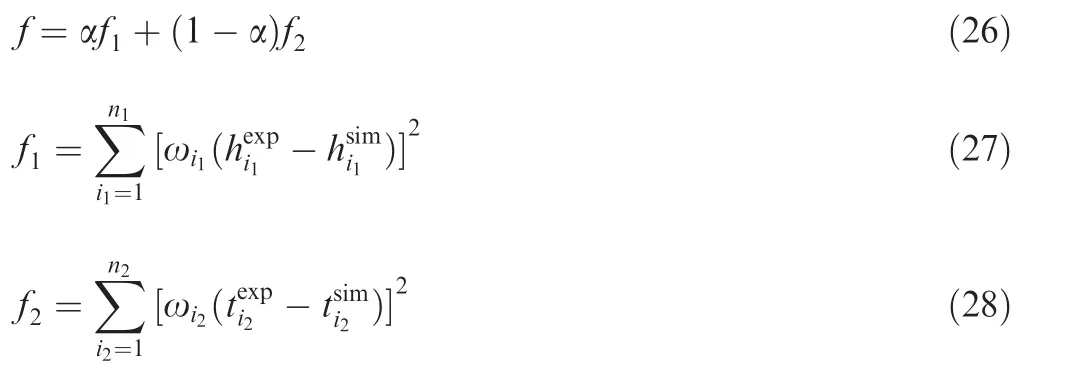
where fis the first part in the cost function for representing the residual of the bulge height h under different pressures;fis the second residual of the pole thickness t obtained by simulations and experiments;α is a weighted factor ranging from 0 to 1 to represent the importance of the two sub-objectives of the cost function;the subscript iand irepresent the ith data point of the bulge height and the ith data point of the pole thickness, respectively; the superscript exp and sim represent the data point of experiment and simulation; nand nare the total experimental point numbers for the pole thickness and bulge height,respectively;ω is an automatic scaling factor to increase the sensitivity of experimental points especially in the area of large plastic deformation for the two subobjective functions, and can be expressed as

The scaling factor ωcalculated by Eq. (29) can be distributed to the corresponding residuals in the first subobjective function. ωcan be obtained by a similar formula to Eq. (29) and is used for the second sub-objective function.
3.3. Optimization algorithm
The inverse parameter identification can be seen as an optimization problem, so an efficient and robust optimization method is necessary to minimize the defined cost function in Eq. (26). A classical and robust gradient-based optimization method, i.e. an improved Levenberg-Marquardt algorithm is used to identify the tubular mechanical parameters.
As can be seen from Eqs. (26)-(29), the objective function consists of the sum of the squares of the true errors between experimental and simulated responses and can be regarded as a nonlinear least square problem. The Gauss-Newton method with line search performs very poorly and leads to numerical convergence difficulties, because the true error, i.e.the residual function r(x) including the FEM model, exhibits severe nonlinearity. In order to overcome these difficulties,an improved Levenberg-Marquardt algorithm with the trust region strategy is considered where the objective function can be approximated as a quadratic model in the neighborhood of a given starting point xas
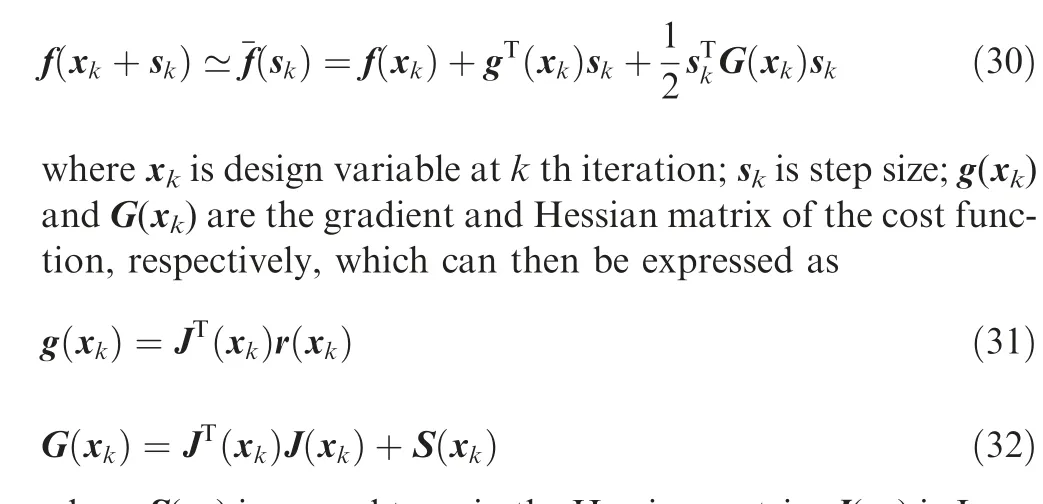
where S(x)is second term in the Hessian matrix;J(x)is Jacobian matrix of the cost function.
The Jacobian matrix J(x) is the first partial derivatives of the residual function r(x).It is impossible to give an analytical formula for Jacobian J(x),because f(x)is a nonlinear implicit function and given in a black box. Therefore, the finite difference strategy is introduced to calculate the (i, j) th element in Jacobian matrix J(x) by
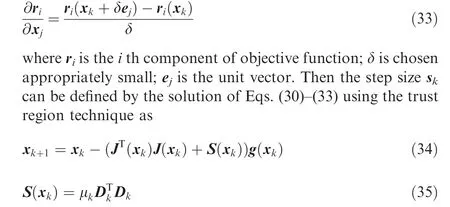
where μis damping factor; Dis the diagonal and positive definite matrix.
The damping factor μcan be used to control the searching direction and step size in the current iteration. A new update strategy for the value of μis recommended and numerical experiments demonstrate its good robustness and smoothness.The change of μdepends on the gain ratio ρ which indicates the agreement of the approximated function to the actual objective function and can be written as
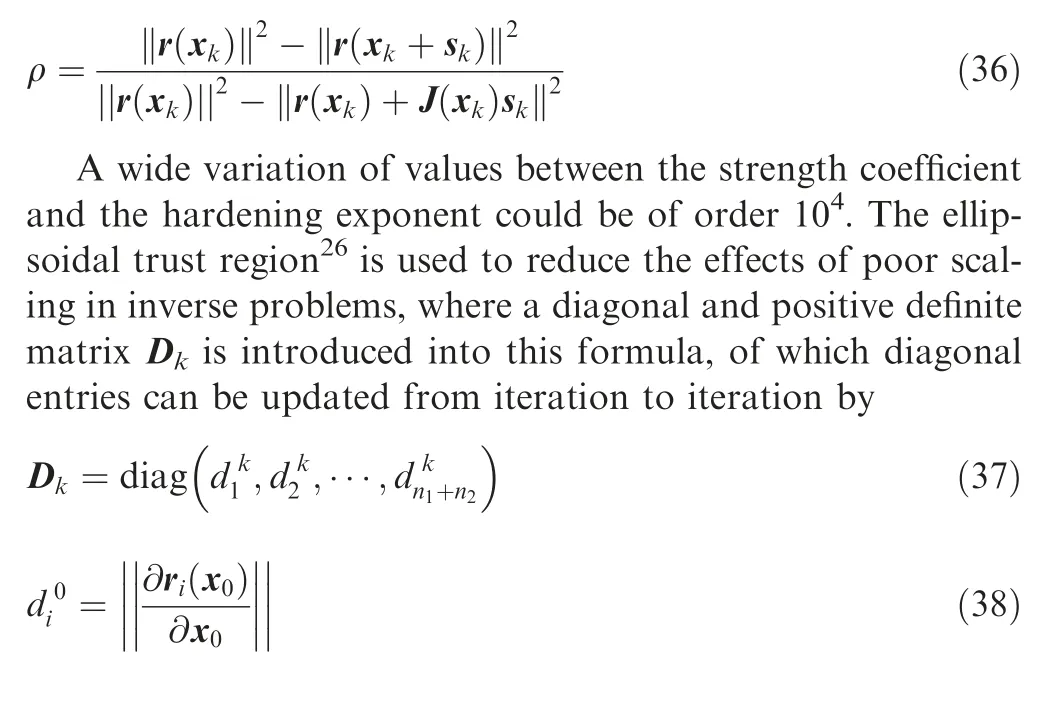
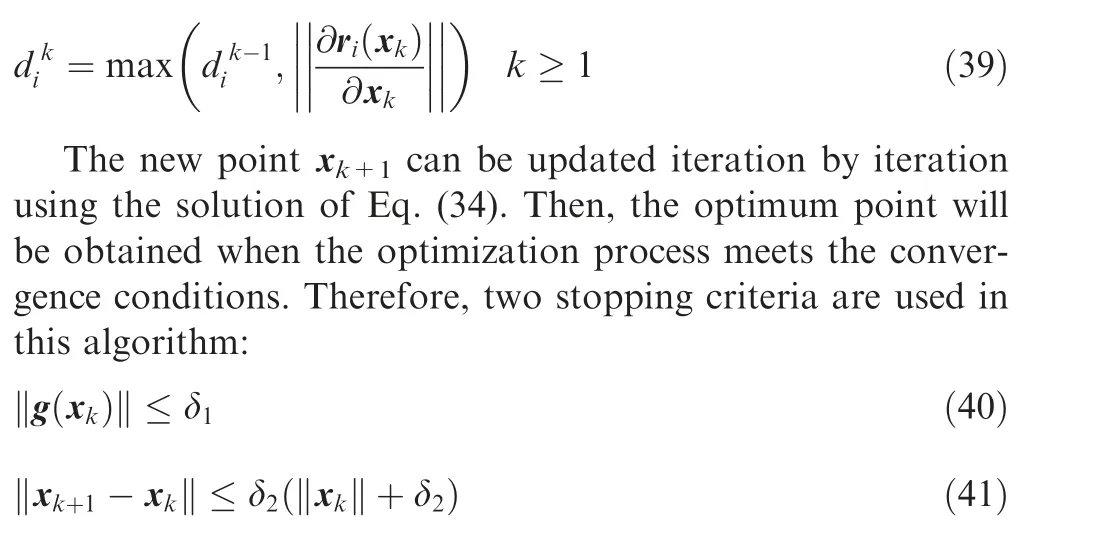
where δand δare two small and positive real numbers given by a user. When these two criteria are satisfied, the iteration process will be terminated.
4. Experimental tooling and method
4.1. Tensile test
A standard uni-axial tensile test has been conducted to characterize the flow stress curve of used tubular aluminium tubes.Tensile specimens are cut directly from the tubes along the longitudinal direction as shown in Fig. 6, and their geometric dimensions follow the ASTM E8/E8M-21 standard.However, the subsize specimen type is used for the tensile test,because the diameter of the tubes is so small that standard tensile specimens are difficult to be machined. The tensile test is performed at room temperature and under a strain rate of 1.4 mm/min using a CMT electrical universal testing machine.
4.2. Hydraulic bulge test
A flexible tube hydraulic bulging device has been designed and manufactured to determine the tubular material flow strainstress behavior under the bi-axial stress state, as shown in Fig. 7. It can be seen that this setup is mainly comprised of a hydraulic power system,a control system,and basic die sets.The two outermost hydraulic cylinders can not only move on the basement horizontally and achieve more flexibility for testing tubes with different lengths,but also apply an axial force or even a stretch force on tube ends and produce different stress states for specimens during a test.
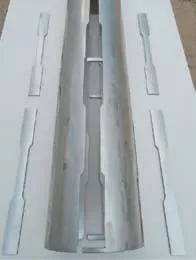
Fig. 6 Specimens for tensile test cut from tube along longitudinal direction.
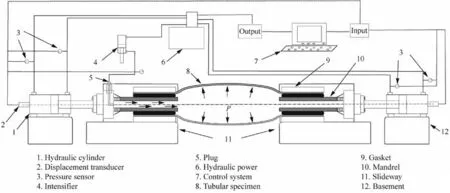
Fig. 7 Schematic diagram for hydraulic bulging setup.
Tube ends could be locked by two hydraulic clamping devices in the middle to guarantee no sliding along the axial direction of specimens and fluid leakage.By changing the mandrels and gaskets in the locking system, tubes with different diameters and wall thicknesses can be tested. Fig. 8 illustrates the schematic diagram of this flexible locking setup.
Bulging tests of annealed aluminium alloy tubes are performed on this hydraulic machine. The maximum bulging pressure is determined firstly by a general tube bulge until its bursting, and this procedure is repeated at least three times to get an accurate average bursting value.Then several tubular specimens are formed under different pressure levels lower than the maximum bursting pressure. After the bulging pressure reaches to a specified value, the tube is taken off from the machine. The bulge height and pole thickness can be measured by a micrometer, and the corresponding internal pressure is recorded by a transducer on the machine.
5. Results and discussion
Fully-annealed 5049 aluminium seamless tubes are used and investigated, of which chemical compositions are displayed in Table 1.The initial diameter and wall thickness of tested samples are 50.00 mm and 1.086 mm,respectively.The total length of every tubular specimen in the hydraulic bulge test is 300.00 mm, and the bulge zone is about 243.00 mm long.
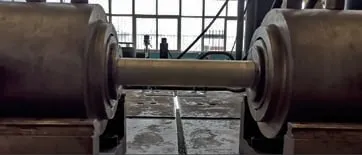
Fig. 8 Locking system for ends of tubular specimens on machine.
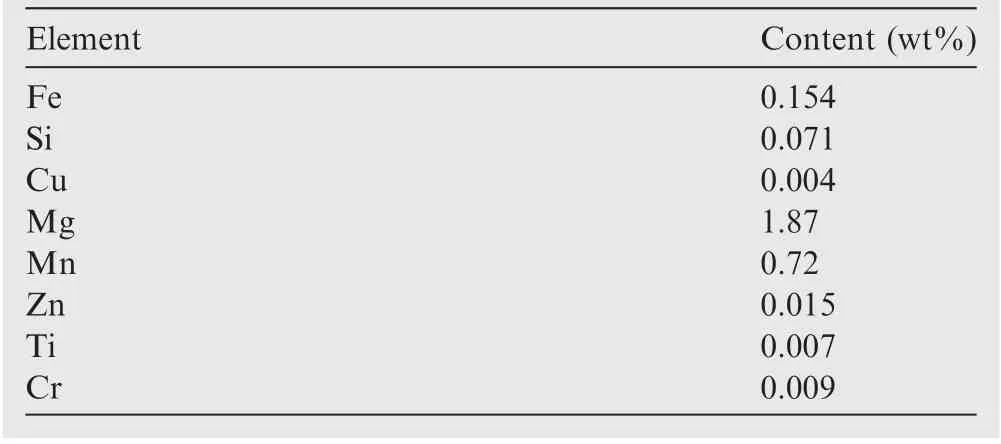
Table 1 Chemical compositions of tested 5049-O aluminum alloy tubes.
The maximum bulging pressure is 7.8 MPa determined by the observation of the first tubular specimen bursting. Below this pressure value, more tube hydraulic bulging tests are performed under different pressure levels. To obtain more equivalent strain-stress points, 16 pressure levels with distinct intervals are inserted into the reasonable range. After the bulging, the corresponding bulge height and wall thickness at the tube pole are measured every 90° along the tube circumferential direction in the middle cross-section of the bulged tube,and several recorded typical values are displayed in Table 2.It is obvious that with an increase of the internal pressure,the diameter of the tube is increased, and the pole thickness becomes thinner.
Fig. 9 shows the profile shape of all tubular specimens at the end of the bulging test. It can be seen that the total length of tubes before and after bulging tests has almost no change by observation. This phenomenon is verified by actual measurements for all tubular specimens after deformation, which means that the tube ends are fixed by the locking system on the machine, so there is no slippage between specimens and die sets during the deformation. Therefore, clear boundary conditions that tubes are bulged under a bi-axial stress state can be achieved, and the interface friction between tools and parts can be neglected in analytical or numerical models.
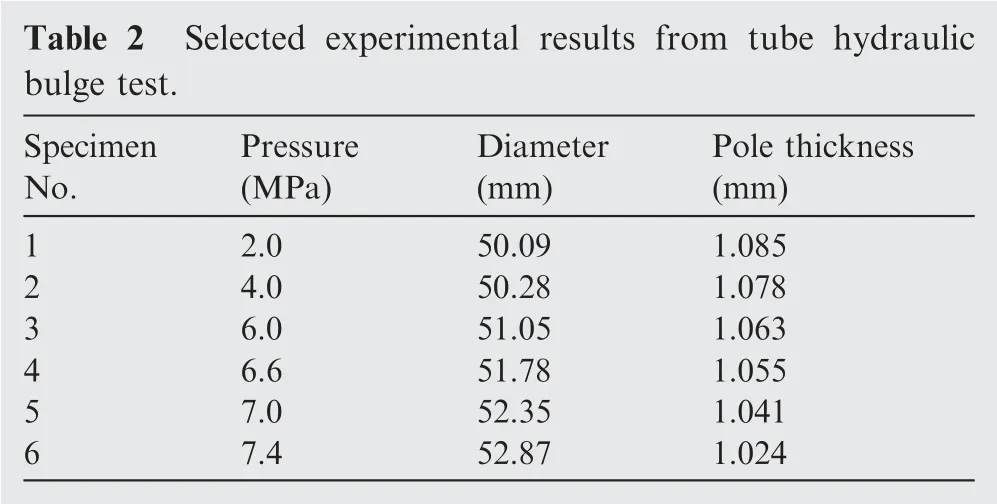
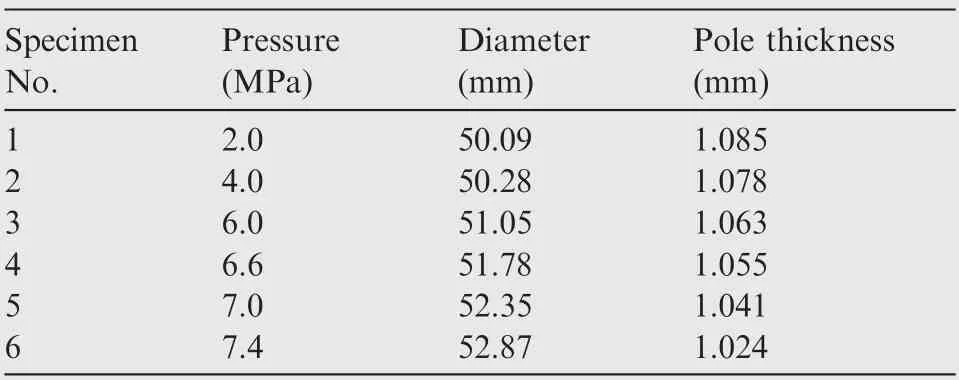
Table 2 Selected experimental results from tube hydraulic bulge test.
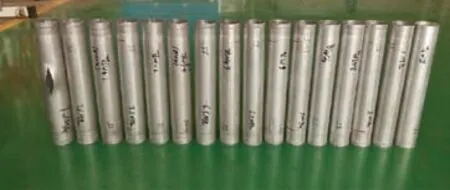
Fig. 9 Tubular specimens before and after hydraulic test.
Based on this bulge test data, the inverse identification of tubular material parameters is performed using the optimization technique developed in Section 3.3. Several different sets of starting points in a feasible region are tested in this inverse analysis. The determined optimum parameters, the corresponding gradient of the cost function to design variables,and the error between experimental and computed data at optimum points are presented in Table 3.As can be seen from Table 3,although the guessed initial values cover a large range sometimes even far from the optimum point where the strength coefficient ranges from 300.00 to 500.00, e-value from 0.20 to 0.40, the final identified material coefficients converge to the same solution. Besides, values of the objective function and their gradients in all cases are reduced to the same level approximately and satisfy the optimality conditions, which illustrates the stability and robustness of the inverse framework.
An iteration process of the objective function and its corresponding gradient for the 5th initial value is plotted and presented in Fig. 10. From Fig. 10, it is possible to conclude that the least square error is reduced to a small value close to zero after 5 iterations,which leads to a satisfied fitting quality between experimental and computed data. At the same time, the gradient of the cost function reaches a lower value than the one defined in the stopping criteria and terminates the optimization process. Fig. 11 illustrates the evolution process of material constitutive parameters during the optimization. For design variables, the hardening exponent sharply increases from the initial 0.200 to 0.302 after 1 iteration while remaining the same value at the 2nd iteration and then increasing and reaching the optimum value in next iterations. The strength coefficient has a gradual rise from the initial 300.00 to 379.01 as the number of iterations increases. Only 5 iterations are needed to perform in this framework, and the small number of iterations shows the efficiency of the developed optimization technique to solve the inverse problem.
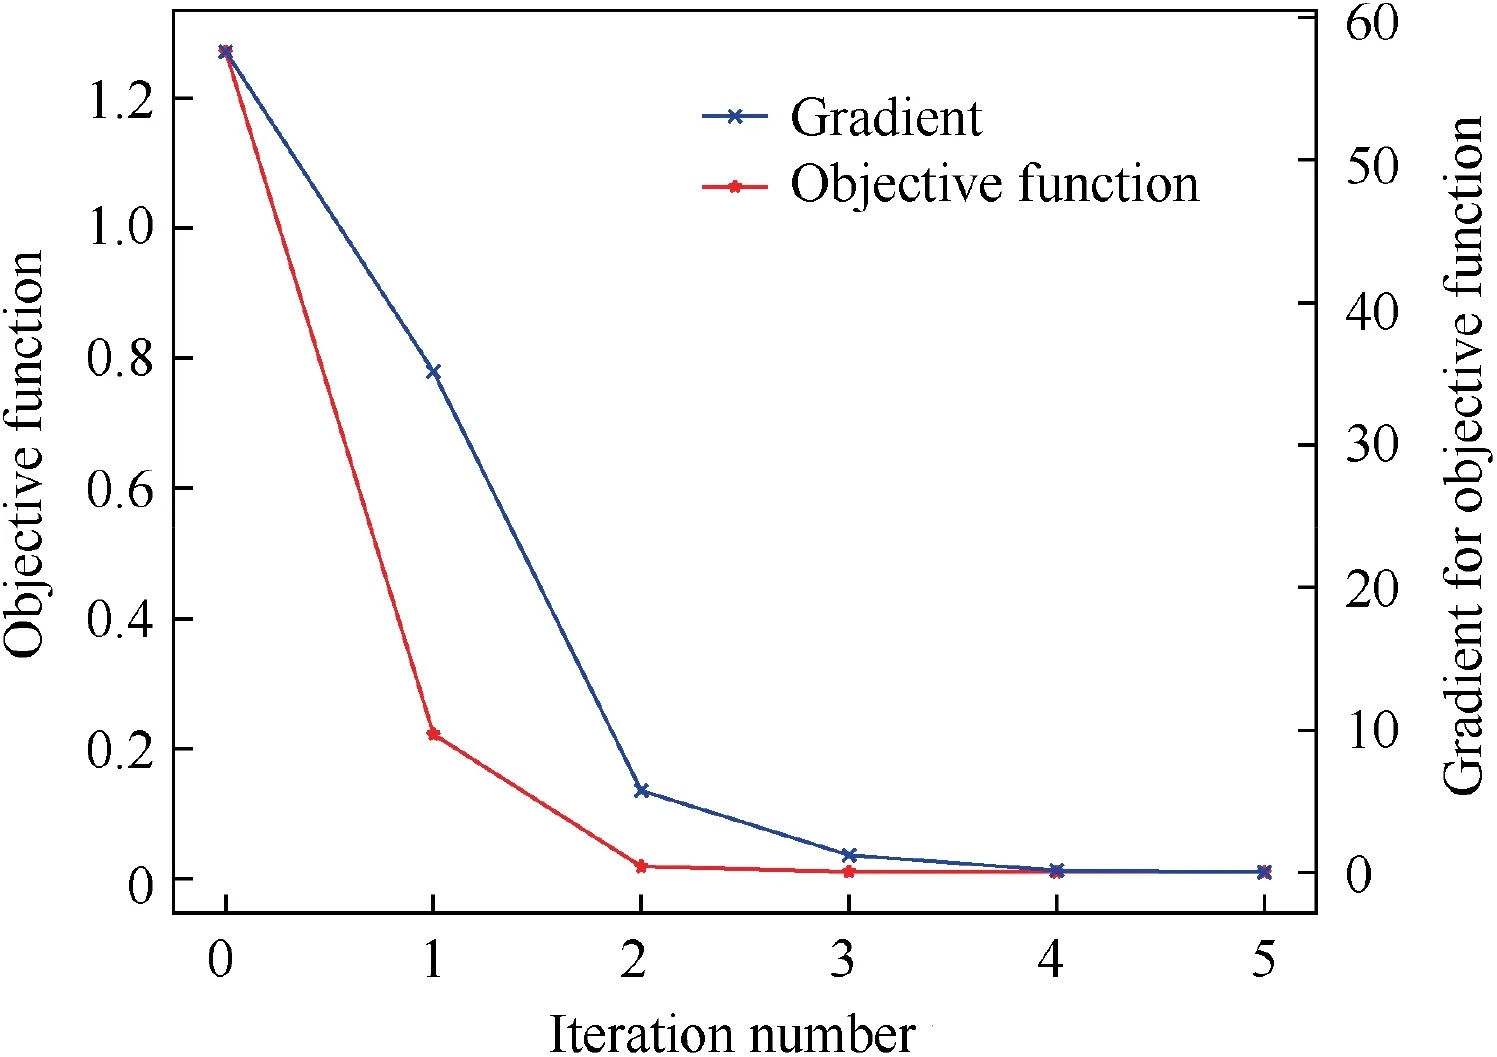
Fig. 10 Iteration process of objective function and its gradient during optimization.
The experimental data obtained from the tube bulge test is imported into the total strain model and Hwang model, and several pairs of points in the strain-stress curve are determined. Fitting these points to the material hardening model defined in Eq. (25) using a least square method, the material strength coefficient and hardening exponent are obtained. As a comparison, material parameters identified by the inverse strategy and two different analytical models are shown in Table 4, and the corresponding flow stress curves can be obtained as shown in Fig. 12.
The strain-stress relationship determined by the universal tensile test is plotted and displayed in Fig. 12. It can be seen from the comparison that there are some differences between the flow stress curve determined by tensile tests and that by hydro bulge tests. The effective stress obtained by bulge tests is lower than that determined by tensile tests,especially at large plastic effective strains. Moreover, a tensile test under a uniaxial stress state overestimates the material deformation limit under a bi-axial tensile stress state when compared with a bulge test. For fitted strain-stress curves based on bulgingtests, three models give identical results of tensile tests in the small strain region, and the stress difference raises with an increase of the strain. The effective stress predicted by Hwang model is always lower than those by the other two models.Then the flow stress curve determined by the inverse model is very close to that by the total strain model in a large strain range, while the difference between the results of the inverse model and the tensile test is smaller compared with those of the other two analytical models.

Table 3 Identified optimal values for several sets of different initial points.
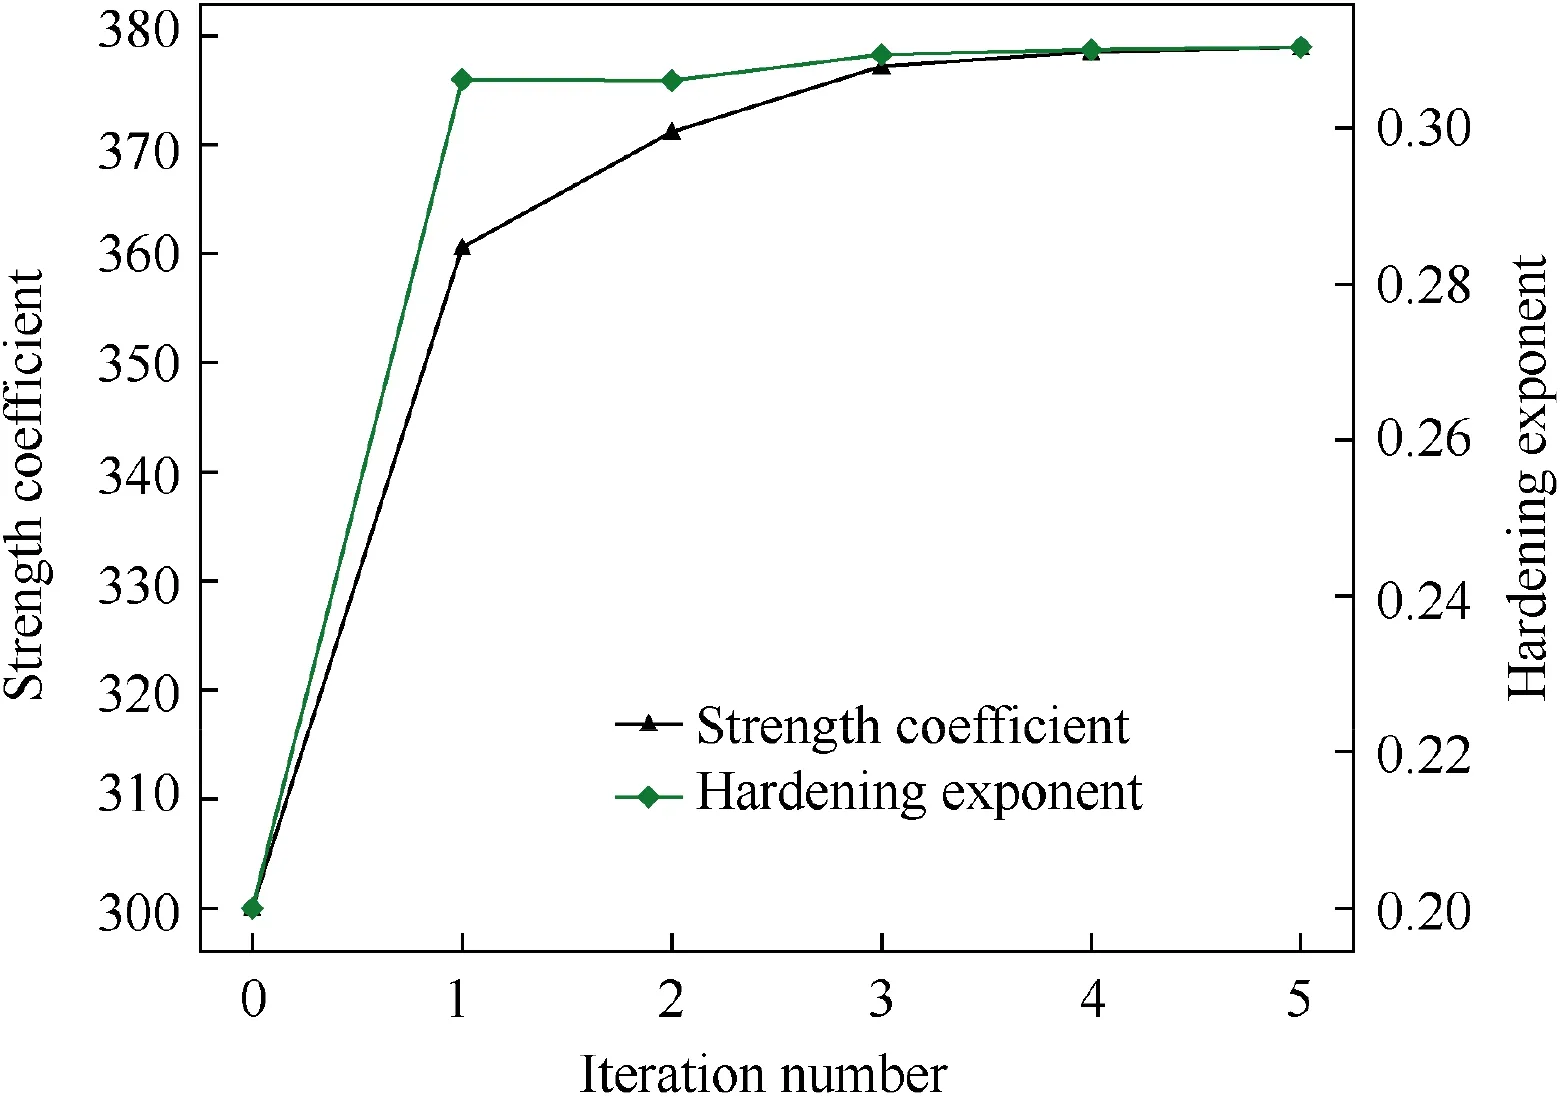
Fig. 11 Iteration process of design variables during optimization.

Table 4 Identified flow stress models using different methods.
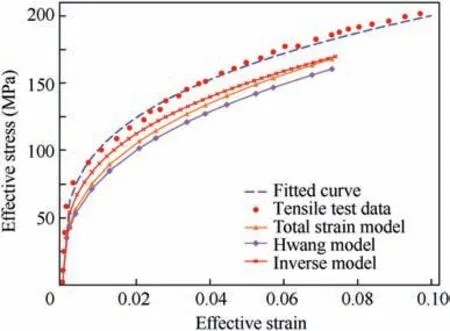
Fig.12 Comparison of effective strain-stress curves obtained by tensile test and bulge test.
In order to evaluate the performance of different tests and models, FEM simulations for the tube hydraulic bulging process are performed by LS-DYNA program with identified flow stress curves. Other input data like the pressure loading curve and simulation speed are identical in numerical models. The calculated pole thickness, bulge height, and profile shape in the deformation zone are analyzed and compared with those from the physical experiment.
Fig. 13 shows the comparison of the internal pressure versus the bulge height curves between experimental data and numerical outputs of FEM models using material parameters given in Table 4.It can be seen that the calculated bulge height with a flow curve identified by the inverse model has a good agreement with the experimental data when compared with the other three methods. Furthermore, a detailed quantitative deviation is displayed in Table 5 and Fig. 14. It is demonstrated that the relative deviations between simulation results of all methods and experimental measurements are higher at lower bulging pressures, while these deviations are reduced as the pressure increases. Furthermore, the smallest mean value of the relative deviation also validates that material parameters obtained by the inverse model are more accurate than those by Hwang and total strain models.
Fig. 15 shows the comparison of the internal pressure versus the pole thickness curve between experimental data and the corresponding FEM results using various flow stress curves.Fig.16 and Table 5 illustrate a quantitative error comparison and analysis. As can be seen from these results, material parameters determined by inverse model lead to satisfactory fitting agreement and the smallest mean deviation between experimental and numerical data. A higher relative deviation is observed at high bulging pressure levels for Hwang model and tensile tests.For the total strain and inverse models,the small deviation is still kept throughout the deformation process,especially for the inverse model which performs better than other models at a large-deformation state.
The calculated bulge profile using constitutive parameters determined by different models can be observed in Fig. 17,in which the measured tube radii along longitudinal positions in experiments are presented. It is obvious that the predicted bulge profile based on the tube bulge test matches better to experimental measures compared with that of the tensile test.The quantitative gap between experimental data and FEM outputs by three models can be observed in Fig.18 and Table 5,and it can be seen that the bulge profile calculated by the inverse model leads to the smallest deviation and is very close to experimental results compared with those of Hwang and total strain models.
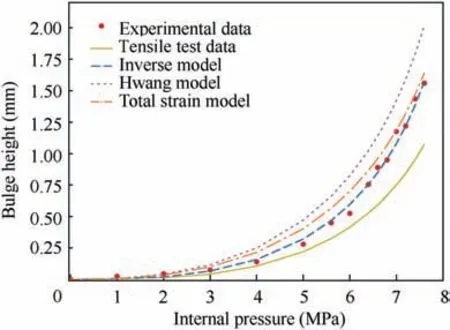
Fig. 13 Comparison of internal pressure versus bulge height curves obtained by different methods.
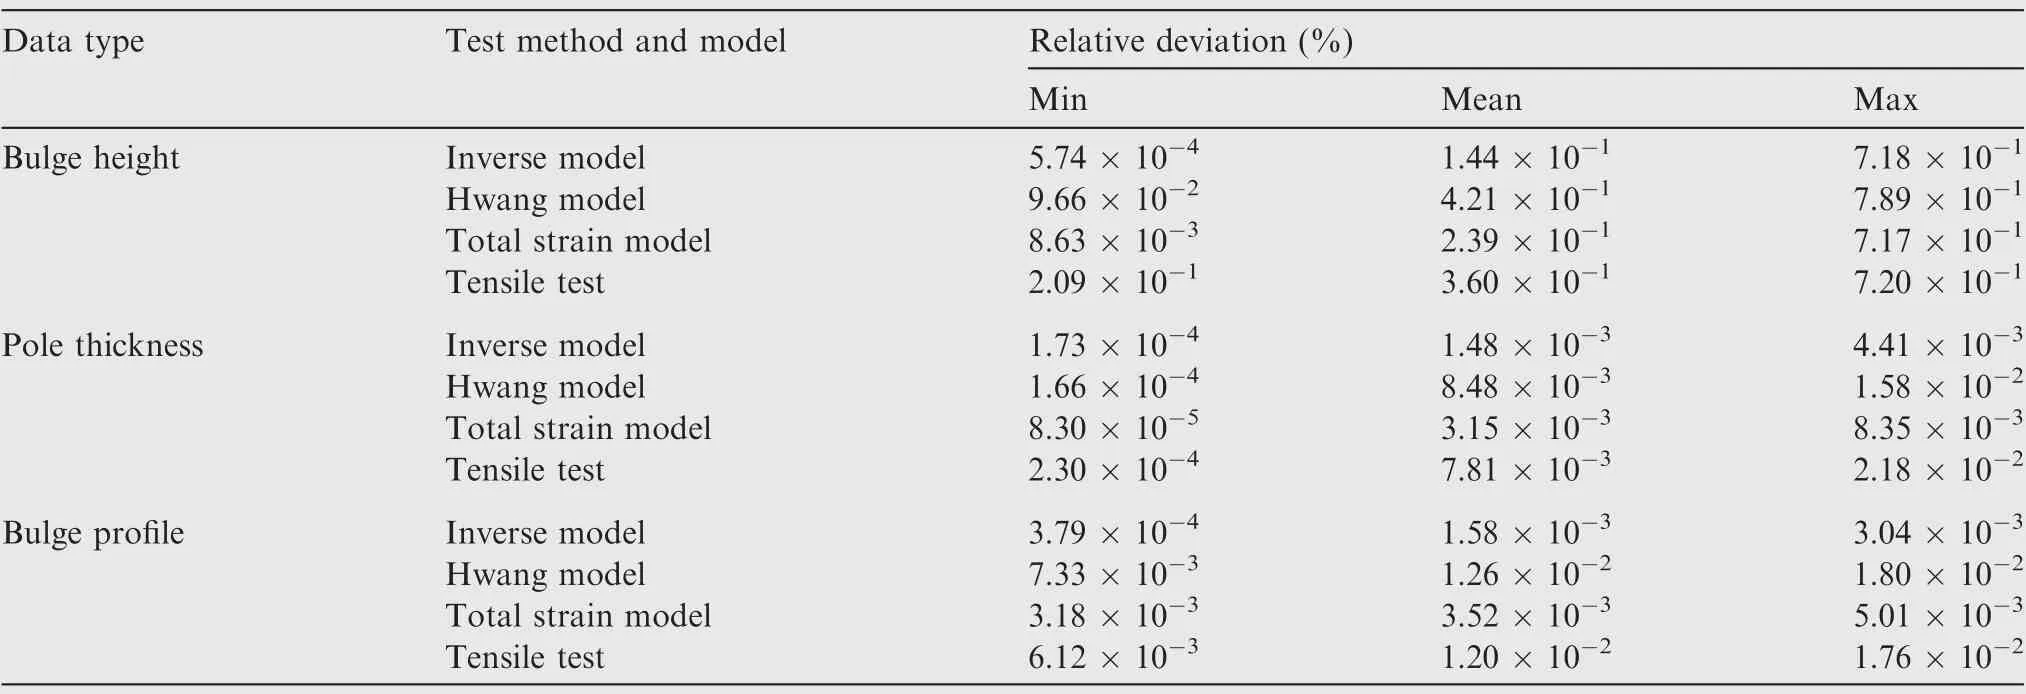
Table 5 Relative deviations between simulation data and experimental measured results.
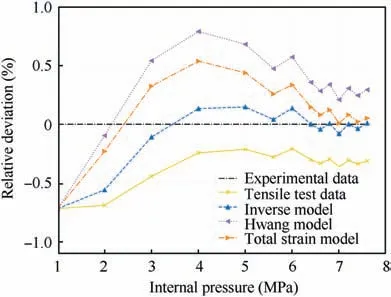
Fig. 14 Deviation analysis of internal pressure versus bulge height curves obtained by different methods.
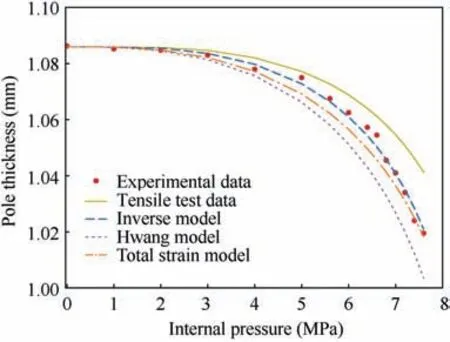
Fig. 15 Comparison of internal pressure versus pole thickness curves obtained by different methods.
From these comparisons,it can be concluded that the three models, i.e. the inverse model, the total strain model, and Hwang model, can be used to translate the collected experimental data into a flow stress curve, while the inverse model presents more satisfying results to experimental measures compared with those of the other two models.One reason for that is the inverse model removes the geometrical and mechanical assumptions in analytical models, and the isolated analysis of the stress and strain in Hwang model and assumptions in the total strain model lead to a big difference between simulated and experimental data.
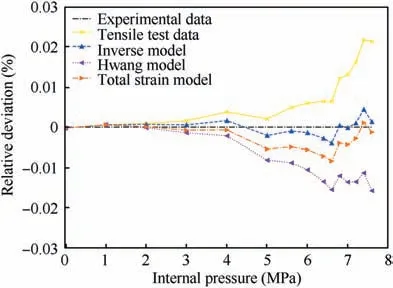
Fig. 16 Deviation analysis of internal pressure versus pole thickness curves obtained by different methods.
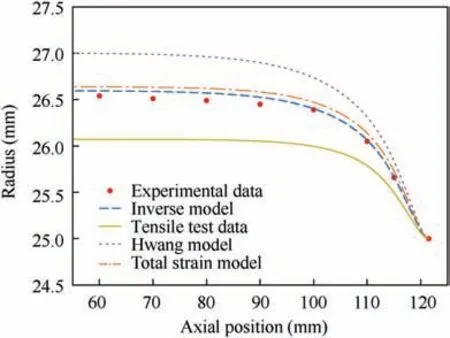
Fig. 17 Comparison of axial position versus bulge profile obtained by different methods.
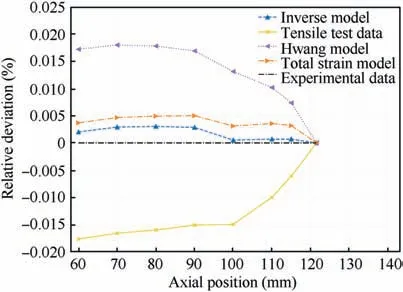
Fig. 18 Deviation analysis of axial position versus bulge profile obtained by different methods.
6. Conclusions
(1) Tube bulging tests with fixed-end conditions for 5049-O aluminium alloy are performed on a flexible hydraulic forming press. The bulge height, pole thickness, and bulge profile under different fluid pressure levels are measured during experiments.
(2) An inverse framework combining the incremental strain theory with an improved Levenberg-Marquardt algorithm is developed to identify tubular metal properties by a minimization of the least square error between calculated and experimental data.Several sets of initial guesses are tested for this inverse strategy,and the convergence to an identical optimum solution shows that this framework is robust and efficient for characterization of tubular materials.
(3) Two analytical models based on membrane mechanics and the total strain theory are proposed to model the hydro bulging process and determine the strain-stress relationship of 5049-0 aluminium alloy. Obtained flow stress curves are compared with that from a tensile test,which demonstrates that a bulge test is more suited to characterize the tubular material behavior because its stress state is closer to the actual hydroforming process.
(4) FEM simulations for a free bulge test are conducted using identified flow stress curves from different tests and models. Predicted bulge height, bulge profile shape,and pole thickness from FEM models are compared with measured values, and results from the inverse model show a good agreement with experimental data.It can be concluded that the inverse model is more accurate than Hwang and total strain models for characterization of tubular material properties.
The authors declare that they have no known competing financial interests or personal relationships that could have appeared to influence the work reported in this paper.
The first author acknowledges the financial support from China Scholarship Council (CSC) (No. 201706080020) for his study at Aalborg University in Denmark.
Data availability statement
The raw data required to reproduce these findings are available from the corresponding author upon reasonable request.
