Study of aerodynamic and inertial forces of a dovelike flapping-wing MAV by combining experimental and numerical methods
Xiowu YANG, Bifeng SONG, Wenqing YANG, Dong XUE,Yng PEI, Xinyu LANG,c
a School of Aeronautics, Northwestern Polytechnical University, Xi’an 710072, China
b National Key Laboratory of Science and Technology on Aerodynamic Design and Research,Northwestern Polytechnical University,Xi’an 710072, China
c Research & Development Institute of Northwestern Polytechnical University in Shenzhen, Shenzhen 518057, China
KEYWORDS Aerodynamic force;CFD;Digital image correlation;Flapping-wing micro air vehicles;Inertial force
Abstract The force-generation mechanism of a dovelike flapping-wing micro air vehicle was studied by numerical simulation and experiment.To obtain the real deformation pattern of the flapping wing,the digital image correlation technology was used to measure the dynamic deformation of the wing. The dynamic deformation data were subsequently interpolated and embedded into the CFD solver to account for the aeroelastic effects. The dynamic deformation data were further used to calculate the inertial forces by regarding the wing as a system of particles to take into account the wing flexibility. The temporal variation of the forces produced by the flapping wing was measured by a miniature load cell.The numerical results provide more flow details of the unsteady aerodynamics of the flapping wing in terms of vortex formation and evolution.The calculated results of the inertial forces are analyzed and compared with the CFD results which represent the aerodynamic forces. In addition, the total forces, i.e., the sum of the CFD result and inertial result, are compared with the experimental results, and an overall good agreement is obtained.
1. Introduction
From conventional military to commercial and civilian fields,the growing interest in Micro Air Vehicles (MAVs) has given a huge boost to the exploration of unconventional and novel technologies to meet increasingly demanding new requirements. As a subset of the MAVs, Flapping-Wing Micro Air Vehicles (FWMAVs) have attracted intense interest due to their potential applications in civilian and military fields.FWMAVs can achieve extraordinary flight performance at the low-Reynolds-number regime and in narrow spaces,showing high maneuverability and agility. The reason that FWMAVs have such high performance is that they can take the advantage of several unsteady aerodynamic effects adopted by natural flyers, such as the clap-and-fling mechanism,wake capture,and delayed stall.
Driven by the desire to replicate the flying creatures’ flight abilities,breakthroughs have been made in the development of FWMAVs. In 2011, the Nano Hummingbird,the first palmsize tailless FWMAV, was unveiled by AeroVironment. In 2013, Ma et al.built an 80 mg, insect-scale, flapping-wing robot that mimicked the morphology of flies by using a modular approach for flight control that relies on limited information about the robot’s dynamics.In 2018,the Delft University of Technology developed an agile FWMAV, namely, the Del-Fly Nimble,which was equipped with two pairs of wings.The wings exhibit a clap-and-fling motion during the flapping motion, which enables the wings to generate more lift than a single pair of wings.In 2020, Dong et al.developed a new type of air vehicle that was different from the conventional flapping-wing air vehicle.The vehicle uses flapping to generate a spin moment, which causes the wing to start spinning, and the spin and flapping together generate the forces required for flight. In 2020, Chen et al.made experimental and computational efforts to gain a reliable topology optimization method for the bottom of the transmission system. They presented a dynamic simulation modeling method based on the constitutive model of ultraviolet curable resin and nonlinear dynamic characteristics of the transmission system.
There are many studies on the aerodynamic characteristics of flapping wings. Yang et al.investigated the aerodynamic performance of a flapping wing by using preconditioned Navier-Stokes equations and the chimera grid method. Xue et al.explored the flapping wing flight by using a coupled Computational Fluid Dynamics (CFD) and Computational Structural Dynamics (CSD) method. Zhou et al.focused on the unsteady aerodynamic forces of plunging airfoils. Li et al.analysed the individual influence of pitching and plunging motions on flow structures by changing the phase lag between the geometrical angle of attack and the plunging angle of attack.They found that the plunging motion contributes to the development of the leading-edge shear layer, while the pitching motion is the key reason for the instability of the leading-edge shear layer.Lang et al.studied the aerodynamic performance of owl-like airfoil undergoing flapping kinematics which were obtained experimentally. Deng et al.and Tay et al.studied the aerodynamic characteristics of FWMAVs in detail by experimental and numerical method.
A lot of research has also been done on the aerodynamics of flying birds or insects. Young et al.studied aerodynamic function enhancement of detailed insect wing design. Song et al.studied the flow structures and aerodynamic characteristics of hummingbirds both in hovering and fast forward flight by using the immersed-boundary method.The wing kinematics of the hummingbirds were obtained experimentally by using the photogrammetry technique. Using a similar approach, researchershave also studied the aerodynamic characteristics of dragonflies under different flight conditions.
There are also many studies on the wing inertia of flapping wings. By adjusting the extension of wing joints, bats can change the inertia of their wings,thus assisting them to recover from aerial stumbles.By accelerating flapping frequency,beetles increase the wing inertia,which aids the unfolding process of their folded wings.Phan and Parkused a theoretical blade-element model to examine the impact of wing inertia on the power requirement and flapping angles of attack,based on 3D free-hovering flight wing kinematics of a horned beetle.They found that the beetle’s hindwing may not be at an optimal kinematics for hovering flight because of the effect of aerodynamic and inertial forces on its deformation. Xiao et al.performed a numerical investigation on the effects of inertia,wing aspect ratio, torsional stiffness and pivot point on the dynamic response of a low aspect ratio rectangular wing under an initial zero speed flow field condition. The simulation results show that the symmetry breakdown of the flapping wing results in a forward/backward motion with a rotational pitching.
However,the force characteristics of flapping wings cannot be accurately revealed by using two-dimensional models or prescribed kinematics.Besides,when the Fluid-Structure Interaction(FSI)technique is used to solve the flow field around the flexible flapping wing,the structure of the flapping wing needs to be modeled. The flapping wing is composed of highly flexible membranes and anisotropic carbon skeletons.During flapping, the wing membrane will be strained, relaxed, and wrinkled. The complicated deformation pattern of the wing membrane makes it difficult to simulate it accurately. As an alternative approach,the real morphological deformation data of the wing can be obtained experimentally by using the photogrammetry technique.Then, the real morphological deformation data are taken as input to account for the aeroelastic effect in the CFD simulation.Note that,by doing so,the structural modeling will not be necessary since the morphological deformation data of the wing structure are measured beforehand. Although many researchers have used this mixed experimental-numerical approach to study the aerodynamic characteristics of birds or insects,there are relatively few studies on FWMAVs with this approach.
Moreover, the inertial forces play an important role in the flapping motion.Previous studies on FWMAVs have focused on mainly aerodynamic forces. Studies of inertial forces are either absent or obtained by pure calculation, and lack association with aerodynamic forces and further comparison with experimental results. Three common methods are often used to calculate the inertial forces. The first one, also the simplest one, is to calculate the inertial forces according to the rigid body model. The wing deformation is ignored and therefore only suitable for small deformations. In the second method, the wing membrane stretched on the skeleton is removed, and its mass is equivalently distributed on the skeleton.The third method is to measure the inertial force by placing the flapping wing in a vacuum chamber,thus eliminating the aerodynamic forces. The above three methods are all approximations of the real situation in terms of load conditions.Different load conditions will lead to different deformations. Therefore, the accuracy of the inertial force calculated from the deformation under real load conditions is expected to be better than the aforementioned three methods.
In the current study, a dovelike FWMAV, namely, the Dove, developed by the Northwestern Polytechnical University (NPU) is studied. The dynamic deformation data of the wing are obtained by the Digital Image Correlation (DIC)technique. The dynamic deformation data then can be used for two purposes,that is,the calculation of aerodynamic forces and inertial forces. In the calculation of aerodynamic forces,the dynamic deformation data are taken as input to account for the aeroelastic effect in the CFD simulation.The deformation characteristics of the wing are represented by the dynamic deformation data, which in principle excludes the modeling of the complex flapping-wing structure. In terms of the calculation of the inertial forces, the wing was discretized to allow for relative motion between wing particles, and the corresponding kinematic pattern in the dynamic deformation data was applied to each wing particle to account for the deformation experienced by the wing during flapping.
This paper is organized as follows:first,the dynamic deformation data and the force characteristics of the flapping wing are obtained experimentally by the DIC technique and force balance measurement. Then, the dynamic morphological model of the flapping wing is acquired by interpolation of the experimental data. Further, the dynamic morphological model is embedded into the CFD solver to obtain the aerodynamic force and flow structure of the flapping wing in a real deformation pattern. Subsequently, the inertial forces of the flapping wing in the real deformation pattern are calculated by using the dynamic morphological model.Finally,the results which include the flow structures, the aerodynamic forces, the inertial forces,and the total forces are analyzed and discussed.
2. Materials and methods
2.1. Flapping-wing MAV Dove
The Dove, as shown in Fig. 1,is a bird-mimic FWMAV developed by the MAV research group of Northwestern Polytechnical University around 2011. It has a wingspan of 600 mm and weight of 220 g.It is capable of autonomous route flight, real-time reroute, and graphics acquisition. It has a cruising speed of 8-10 m/s,operating radius of 4 km,and time of endurance of more than 20 min,and is powered by a lithium battery.The range of flapping frequency is 4-12 Hz.The wings are made of polyester film and carbon rods.The polyester film is responsible for the generation of aerodynamic forces while the carbon rods play as supporting structures.In the following experiment, the flapping frequency is set to 6 Hz. The corresponding Reynolds number is about 23,000 based on the mean chord length and mean tip velocity. The experiment was carried out under the condition of zero wind speed and zero incidence.
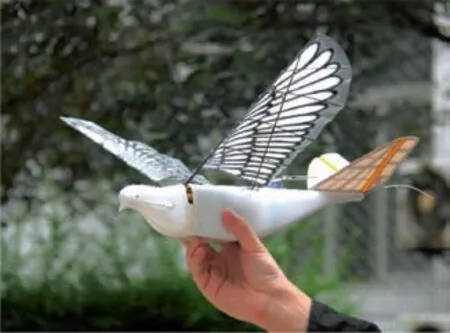
Fig. 1 The Dove.11
2.2. Wing deformation measurement
The previous studieshave shown that the flexibility of the flapping wing has an important effect on its propulsive performance. Therefore, it is necessary to accurately obtain the deformation pattern of the wing during flapping.
For the wing deformation measurement, the DIC technology was used. The DIC technology is quite suitable for the measurement of flapping wing deformation due to its nature of image correlation, thus having no interference to the test subject. As shown in Fig. 2, it has two synchronized highspeed cameras that align with each other by a certain angle.The angle is carefully adjusted,which ensures that the flapping wing lies in the viewport of both cameras.To ensure sufficient light supply,two LED lamps that emit uniformly and powerful white light are used to illuminate the flapping wing.
Before the measurement, the two cameras need to be calibrated.As shown in Fig.3,a series of images of the calibration grid need to be acquired before calibration. For a typical setup, 15-20 images will be a good number. For each image,a number of points extracted are displayed. When the extraction is complete, the calibration will be computed;a score will be displayed for each image; a final score will be displayed in the lower right. After the calculation is complete, one will be presented with a report of calibration results and error scores.The errors will be displayed per image, as well as an overall error score.Below the calibration scores,the intrinsic parameters of the two cameras and their relative position information are listed. Each result is listed with a confidence interval that indicates the quality of the image sequence. When the error score and confidence intervals are acceptable, the calibration is complete.
Point tracking is carried out manually by the operator.Thus,besides the accuracy of camera calibration,the accuracy of the measurement is also related to the operator.If the camera calibration error and human tracking error are not taken into account,then according to the 2048×1088 pixels resolution of the cameras and the 25 cm × 50 cm size of the field of view, it can be calculated that the measurement error of the system is 0.23 mm.
Once calibration is complete,the camera model(the intrinsic parameters of the two cameras and their relative position information) is built. The displacement of the marker can be calculated by substituting the pixel coordinates of the marker on the two cameras into the previously obtained camera model.
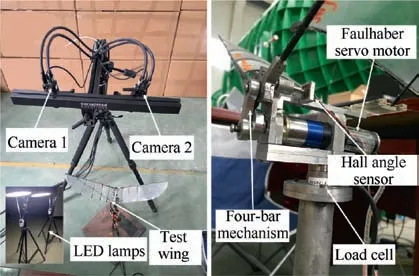
Fig. 2 Measurement of wing deformation and forces.
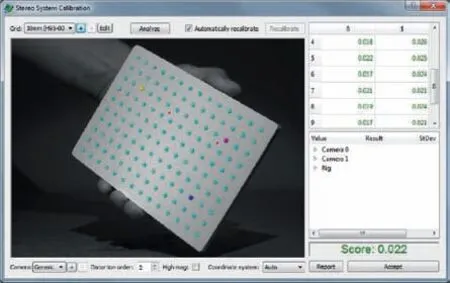
Fig. 3 Camera calibration.
The flapping wing consists of polyester film and carbon rods. The polyester film is bonded to the carbon skeleton.The carbon rods can be further classified as leading rod, oblique rod, inner ribs, and outer ribs. The markers were prelabeled on the wing using sticky conspicuous markers, and they included seven points on the leading edge, five points on the trailing edge, and five points within the surface of the wing where the stiffeners intersect, as shown in Fig. 4. The markers are made of matt material to ensure smooth light scattering to facilitate the identification of the markers in different directions.
During flapping, the two cameras, with a resolution of 2048 × 1088 pixels, were operated at a sampling frequency of 200 Hz.The flapping frequency of the Dove is 6 Hz,and this yields 34 image pairs in a flapping cycle, which provides sufficient temporal resolution to resolve the flapping cycle. After the videos were taken, the markers were tracked frame by frame to extract their three-dimensional coordinates.
2.3. Wing force measurement
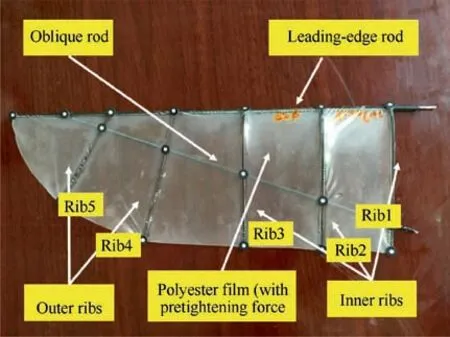
Fig. 4 Flapping wing used in experiment and markers on it.
For the force variation measurement, the wings were connected to a four-bar mechanism (Fig. 2).The four-bar mechanism was driven by a Faulhaber servo motor. A hall angle sensor which was mounted in the flapping axis was employed to capture the flapping angle to define the flapping phase.The whole system was mounted on a miniature load cell(ATI Nano 17) which was used to obtain the total force variation. Butterworth low-pass filter was selected to denoise the experimental data. Since the maximum flapping frequency of the Dove generally does not exceed 15 Hz, the cut-off frequency of the low-pass filter is set to 30 Hz. The curves processed by the low-pass filter eliminate the high-frequency signals but produce a certain phase shift compared with the original data. The magnitude of the phase shift is related to the filter parameters and the fluctuation frequency of the input data.To maintain the phase relationship between the collected signals in the flapping wing experiment, the signals were filtered with the same parameters. Since the fluctuation frequency of each collected signal was the same (i.e., flapping frequency), all the signals would have the same phase shift,thus maintaining the phase correspondence between signals.
The forces obtained by the load cell are composed of aerodynamic forces and inertial forces. The aerodynamic forces and the inertial forces (covered in Section 2.6) were added together. Then the resulted total forces were used to compare with the load cell results.
2.4. Wing surface reconstruction
After the three-dimensional coordinates of the markers were extracted, they were used to reconstruct the wing surface.The reconstructed wing surface at the beginning moment of downstroke (t/T = 0) is illustrated in Fig. 5. The purpose of the wing surface reconstruction is to facilitate the generation of CFD mesh and the calculation of inertial force. The markers are located at both ends of the carbon rods and their intersections. In the process of making the wing, there is a certain amount of prestressing when the membrane is stretched on the wing skeleton (Fig. 4). This enables the membrane to follow the rods well during flapping.In addition,the leading edge and the wing ribs are interpolated by spline curves of the same order as the real slender rods. Therefore, a relatively accurate representation of the wing surface shape can be obtained under the current number of markers.The markers at the leading and trailing edges were connected by splines to obtain the outer profile of the entire wing. Then, the markers at each wing rib are connected by a spline to obtain all wing ribs. Further,the inner part of the wing surface was constructed using a multi-section surface, in which the leading and trailing curves were used as the guide curves and the rib curves as the sections.The outer wing surface was created by filling the closed space surrounded by the leading spline, the trailing spline, and the outermost wing rib and kept tangential to the inner part at the junction (Fig. 5).
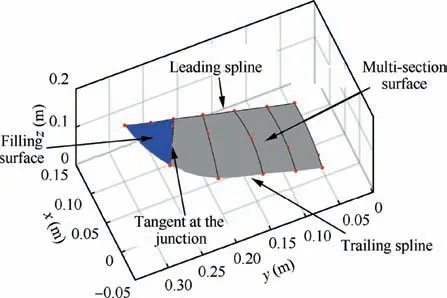
Fig. 5 Wing surface reconstruction based on markers obtained by DIC measurement.
After the wing surface at t/T = 0 was reconstructed, the surface mesh used for CFD simulation was generated on the reconstructed wing surface. The surface mesh was further transferred to the remaining time instants by the Radial Basis Function (RBF) based on the coordinates of the markers of the corresponding time instants. Note that only the surface mesh was transferred, and the deformation of the interior mesh was accomplished by the dynamic mesh algorithm as mentioned in Section 2.5.
The sampling frequency of the cameras is at 200 Hz. The flapping frequency is 6 Hz. This yields 34 instants within one flapping cycle, which are not sufficient to temporally resolve the flow-structure evolution during the flapping motion. The Fourier series fitting with the 8th order was used to perform a temporal interpolation to obtain sufficient temporal resolution for the CFD simulation. The 34 sets of the coordinate data of the surface mesh node within one flapping cycle were interpolated to 500 equidistant time moments by sampling from the fitted data.Fig.6 shows the wing deformation pattern with a 0.02c (where c is the chord length in the wing root,c=0.1 m)thickness at multiple time instants during one flapping cycle. For clarity, the deformation data are only shown subsampled to an increment of 10 instants. Note that t/T = 0 and t/T = 1.0 are the same time instant which corresponds to the end of the upstroke and the beginning of the downstroke as colored red in Fig.6.The assumption was made that the left and right wings have similar deformation patterns.Therefore, the measurement was only performed on the left wing.
2.5. Numerical method and setup
The unsteady viscous flow generated by the Dove was numerically simulated by Fluent. The simulation solves the full laminar flow due to the relatively low Reynolds number. The pressure-based solver was employed to cope with the incompressible low-speed flows existing in the current study. The coupled algorithm was chosen for the pressure-velocity coupling.
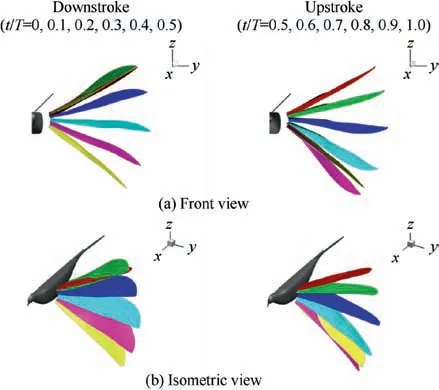
Fig. 6 Wing reconstruction for CFD simulation.
During the simulation,the wing undergoes substantial rigid body rotation and structural deformation. This configuration challenges the existing dynamic mesh algorithms because the mesh near the wing will experience large distortion and twists which can easily result in negative cell volume, thus aborting the solver. Given this difficulty, the overset mesh strategy was adopted. Fig. 7 shows the computational mesh zones and the overset mesh strategy. Because the Dove wings are symmetrical with respect to the fuselage, only one side of the wings was simulated. A symmetry plane was applied where the middle of the body would be. There are two mesh zones in total,i.e.,the component mesh zone(with the wing wrapped inside)and the background mesh zone(with dense mesh region that wraps the range of flapping). The background mesh and the component mesh have a similar cell size at the overset interface to facilitate accurate data transfer. The size of the background mesh zone and the component mesh zone are 30c × 30c × 30c and 5c × 5c × 5c respectively. The background mesh has a fine mesh region that covers the flapping range of the overset mesh. Note that, during the simulation,the wing undergoes remarkable rigid body rotation and structural deformation.In view of this,the component mesh was set to exhibit the same rigid rotation of the wing to counteract the distortion of the mesh caused by the rigid flapping of the wing.Therefore, the component mesh only needs to deal with the mesh distortion caused by structural deformation, which is much moderate than the distortion caused by rigid rotation.The dynamic mesh algorithm used here is diffusion-based smoothing. For smoothing, the mesh motion is governed by the diffusion equation, as shown in

where u is the mesh displacement velocity, and γ is the diffusion coefficient. The mesh movement of the wing surface was prespecified by a User Defined Function (UDF). Eq. (1) then describes how the prespecified boundary motion diffuses into the interior of the component mesh.
Both the background zone and the component zone consist of unstructured tetrahedrons, whereas the boundary layer of the wing is refined (y=1) with triangular prisms (Fig. 7(d)). The cell amount for the component mesh is about 5 million, and the total cell amount of the entire system is about 8 million. The simulation was carried out in a windless condition, which is consistent with the experiment. The boundaries of the background zone aside from the symmetry plane were set as pressure outlet boundaries.
2.6. Calculation method of inertial forces
If the rigid wing model is used to calculate the inertial forces,it will not be consistent with the real situation. Therefore, it is necessary to find a way to consider the wing deformation.
The calculation of inertial forces is a dynamic problem.There are two basic problems in particle dynamics. The first one is, given the motion of a particle, finding the force acting on it; the second one is, given the force acting on a particle,finding the motion of the particle. When solving the problems of the first type, the second derivative of the motion equation of the particle is taken to obtain the acceleration of the particle, and Newton’s second law is substituted into the equation to find the resulted force. To solve the problem of the second type, it is necessary to solve the differential equation of the particle motion.
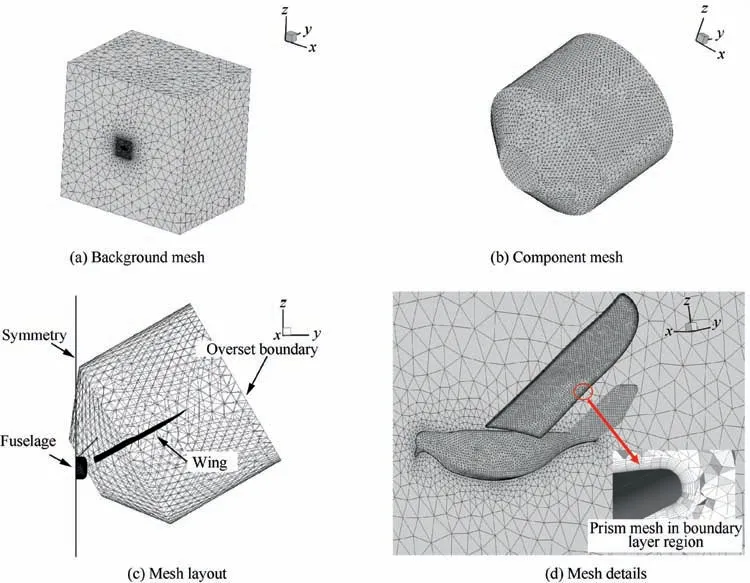
Fig. 7 Mesh strategy for Dove’s wing.
The parameters of the wing components are listed in Table 1.The deformation of the flapping wing is mainly determined by the bending and axial twist of the carbon rods.Therefore, only the equivalent bending elastic modulus (hereinafter referred to as elastic modulus) and the shear modulus of the section (hereinafter referred to as shear modulus) of the carbon rods are measured and listed. In addition, the carbon rods with diameter of 2 mm and 1.5 mm are the main ones that exhibit twist deformation during flapping. Therefore, the shear modulus was measured only for the two rods.
In the current situation, the wing dynamic deformation is measured directly from the real flapping process. To obtain the inertial forces, we need to know the motion equation of each wing material particle. The flapping wing is made up of polyester film and carbon rods of different cross-sections. So long as we know the mass distribution of the wing, we can obtain the inertial forces according to the motion equations of wing material particles. The mass distribution of the wing can be obtained by finite volume modeling of the polyester film and the carbon rods respectively, as shown in Fig. 8.
For the polyester film,it can be equivalent to a spatial surface due to its tiny thickness. The triangular element can be used to approximate the polyester film(Fig.8(a)).Each triangular element can be multiplied by the surface density(listed in Table 1) of the polyester film to obtain its mass. The summa-tion of the masses of all the triangular elements can yield the inertial force caused by the polyester film.

Table 1 Parameters of wing components.
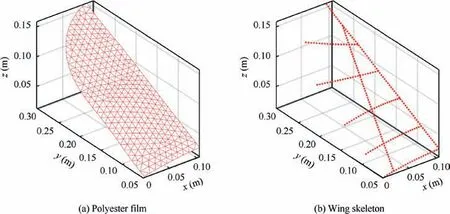
Fig. 8 Discretization of polyester film and wing skeleton for calculation of inertial forces.
For the carbon rods, due to the fact that the cross-section sizes of the carbon rods are much smaller than their lengths,they can be equivalent to spatial curves as shown in Fig. 8(b). The curve models are further approximated by line segments.Each line segment can be multiplied by the corresponding linear density (Table 1) to obtain its mass. The inertial forces of a certain carbon rod can be obtained by adding up the masses of all the corresponding small segments. The summation of the masses of all the carbon rods yields the inertial forces of the wing skeleton.
The method to obtain the motion equations of the wing material particles is similar to the method used to deal with the CFD surface mesh in Section 2.4, that is, the discrete elements of the wing are transferred from the initial moment to the remaining moments by RBF transformation. Then, the Fourier fitting is performed for the centroid position of each discrete element to obtain the analytic motion equation of each discrete element. By doing so, the wing material particles are allowed to exhibit relative motion,and thus the wing flexibility is taken into account.
To make the flapping wing, glue is usually used and is sometimes heavier compared to the rod and membrane. To consider this issue, we examine the wing structure first.
The flapping wing is made up of carbon skeleton and polyester membrane. The membrane is tensioned on the carbon skeleton and further bonded by glue. After a long time of exploration, the wing has a good processing quality, and the glue is basically evenly smeared on the carbon rod. Therefore,the mass of the glue can be considered to be all concentrated on the rod and distributed evenly along the rod.
The mass of the whole wing can be obtained by two means:the wing discrete model and the experimental measurement.Usually, the mass of the wing obtained by the wing discrete model will have some deviation from the mass acquired experimentally due to multiple factors,one of which is the influence of the glue attached to the carbon rods. To correct this deviation, the linear density of the rods is proportionally altered to make the mass of the wing discrete model equal to the one obtained experimentally. Since the glue is evenly applied to the rod, the presence of the glue can be considered a change in the linear density of the rod, so it is reasonable to adjust the linear density of the rod. With this treatment, the effect of the glue can be taken into account.
Besides the inertial forces generated by the flapping wings,the parts on the flapping mechanism also produce inertial forces during the flapping.In view of the complexity of the calculation of the inertial force of the flapping mechanism, we measured the inertial force of the mechanism with the flapping wings removed. The result shows that the inertial force produced by the flapping mechanism is very small, and its peak value is not more than 6 g (less than 3% of the total peak value) in lift direction, which is far less than the inertial force of the flapping wings. Since the mechanism is mainly flapped in the vertical plane, there is no fluctuation in the horizontal direction, so the inertial force of the mechanism is basically zero in the thrust direction. Therefore, in the calculation of the inertial force, the influence of the flapping mechanism is ignored, and only the inertial force of the flapping wing is considered.
3. Results and discussion
The grid convergence, flow topology, pressure distribution,vortex structures, aerodynamic forces, inertial forces, as well as total forces, are addressed and discussed in this section.Note that the y direction corresponds to the side direction of the Dove in which the forces generated by the two wings are canceled each other out in the experiment,so we will not cover it in the numerical results.
3.1. Grid convergence study
It is important to investigate the convergence of the solution with increasing grid resolution and decreasing time-step size.Therefore, to determine the proper grid resolution for the wing, a grid convergence study is conducted for the Dove by varying the cell amount of the component mesh, that is, the mesh surrounds the flapping wing. As shown in Table 2,three sets of meshes were selected using different resolutions, i.e.,around 2 million, 4 million, and 8 million respectively. Note that, as the dynamic morphological data acquired by theexperiment were used to move the flapping-wing meshes (500 steps in one period),we thereby only tested the spatial convergence accordingly.
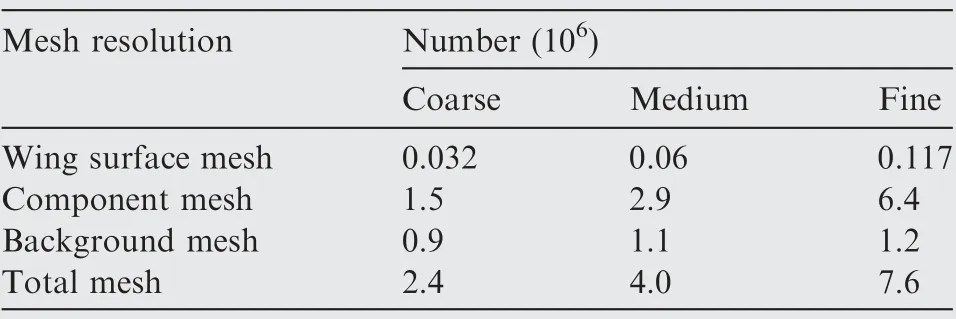
Table 2 Mesh resolution used in grid convergence study.
Fig.9 shows the variation of the forces in the x and z direction during one flapping cycle for the aforementioned three different mesh resolutions.It can be seen clearly that the differences mainly occur at the peaks and troughs of the curves,where the wings undergo a significant unsteady aerodynamic effect.
The maximum disparity of the force curves between the medium case(adopted in this paper)and the fine case is about 2%, indicating that the aerodynamic force results in the current study are grid-independent.
3.2. Wing deformation analysis
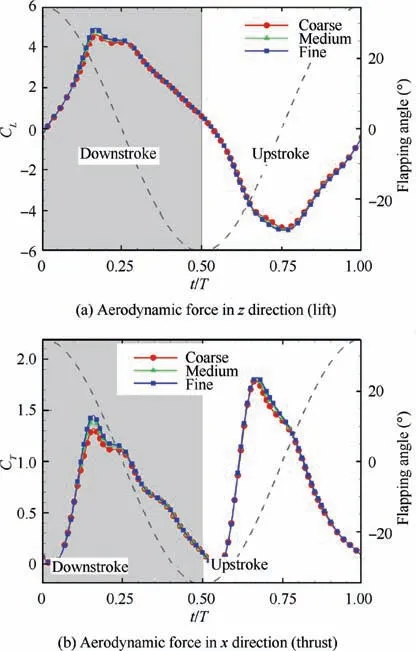
Fig. 9 Forces variation for different mesh resolutions (Black dashed line is flapping phase angle).
Fig. 10 shows the time course of twist angle of Rib4 (the one that has the maximum twist amplitude during flapping)around the leading edge. The twist angle quickly reaches its maximum during downstroke, and then slowly recovers to zero. In the process of upstroke, the twist angle has a similar time course. This relatively long-lasting spanwise twist is the main cause of thrust.
During the flapping process,the wing undergoes noticeable structural deformation. As shown in Fig. 11, the wing surface and skeleton are reconstructed by using the deformation data obtained in the DIC measurement.
At the beginning of the downstroke(Fig.11(a)),the deformation of the leading rod rapidly reaches its maximum value and then quickly returns to a smaller value. This may be due to the high stiffness of the leading rod. At the beginning of the upstroke (Fig. 11 (b)), the deformation of the leading rod rapidly reaches its maximum value and then quickly returns to a smaller value just as it does at the beginning of the downstroke. The deformation of the wing at the beginning of the downstroke and upstroke expands the flapping amplitude of the wing.
To quantitatively describe this expansion effect, we subtracted the amplitude in the case of rigid flapping from the flapping amplitude in the case of real wing deformation to obtain a flapping expansion effect of 44.1 mm, which is 11.5% of the rigid flapping amplitude. Here, the flapping amplitude is defined as the distance from the highest point to the lowest point that the wing tip can reach.
For a static wing, the inner part of the wing has been designed to have a relatively large chordwise camber to facilitate lift generation in forward flight, while the outer part is designed to be flat to enhance thrust.During flapping,the wing exhibits mainly spanwise twist, and less camber change.
3.3. Aerodynamics and flow structures
Fig. 12 shows the instantaneous pressure coefficient Ccontours at t/T = 0.25 (halfway downstroke) and t/T = 0.75(halfway upstroke). At these two moments, the lift reaches to peak and trough respectively. At t/T = 0.25, there is a significant low-pressure area on the upper surface of the wing due to the leading-edge vortex, while a relatively uniform highpressure area on the lower surface due to impacting with the air, as clearly shown in Fig. 12 (a). Similarly, at t/T = 0.75,the relatively uniform high-pressure area is switched to the upper surface, while the low-pressure area caused by the leading-edge vortex during upstroke presents in the lower surface, as shown in Fig. 12 (b). The net pressure difference between the upper and lower surfaces at these two moments are the main reason for the extremum values at these two moments.
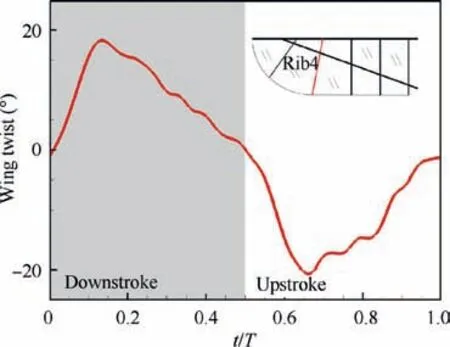
Fig. 10 Time course of spanwise twist.
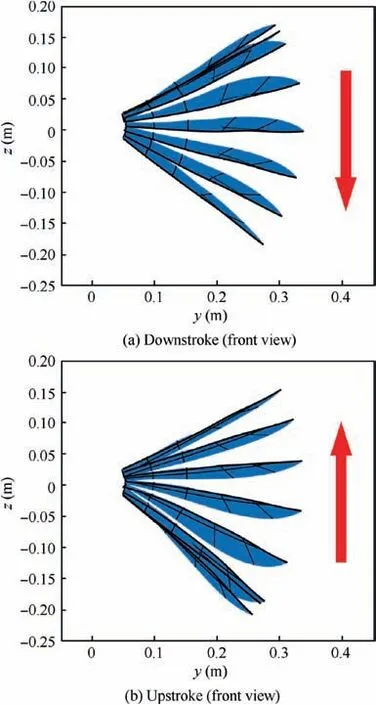
Fig. 11 Reconstructed wing surface and skeleton based on deformation data for inertial calculation.
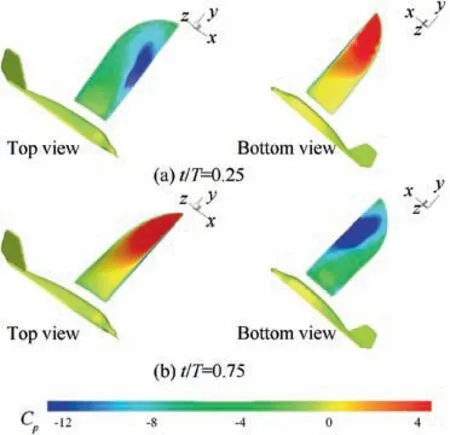
Fig. 12 Pressure coefficient contour during the middle of downstroke (t/T = 0.25) and upstroke (t/T = 0.75).
Wing deformation can enlarge flapping amplitude and delay the flapping phase of the flexible outer part. As shown in Fig. 9 (a), at t/T = 0, the wing root starts to flap down,while the outer part still flaps up because of the inertial effect.This makes the aerodynamic force in z direction (lift) take a negative value at t/T = 0. This is different from a rigid wing case,in which the lift should be positive due to the added mass effect. At t/T = 0.5, the wing root starts to flap up, while the outer part still flaps down,which makes the aerodynamic force in z direction (lift) take a positive value. This is also different from the rigid wing case. The mechanism is the same as that at t/T = 0.
As shown in Fig. 9 (b), compared with the lift, the thrust presents a different variation style.The thrust is basically positive in the whole flapping cycle,and reaches its maximum values at about the midpoint of the downstroke and upstroke.The thrust shows such characteristics because of the existence of wing deformation (mainly spanwise twist). Under current flow conditions (no incoming flow), from an analytical point of view,the thrust will be essentially zero,if the wings are rigid.With the absence of incoming flow,the airflow does not deflect due to the flapping itself, and the rigid wing does not allow to exhibit a spanwise twist(pitching in 2D airfoil),and the resulting force will be mainly point to z direction. There will be almost no component in the thrust direction. In the real wing case,the wing flexibility allows spanwise twist, and this makes a pitching effect produced at the wing sections so that thrust can be generated even without incoming flow.
In order to further analyze the flow structures around the wing,the vortex structures at different moments are visualized by using the Q criterion,which are colored by y vorticity for defining the rotational direction(Fig.13).There are four dominant vortex structures: the Leading-Edge Vortex (LEV), the Trailing-Edge Vortex (TEV), the Tip Vortex (TV), and the vortex ring. Note that the vortex ring is jointed by the LEV,TV, and TEV.
At t/T = 0, when it is at the start of the downstroke, the LEV, TEV, and TV that are generated during the previous upstroke are about to shed from the wing to prepare for the generation of new vortexes. Considering that, if the wing is rigid,the vortex system in the early downstroke should be generated due to the still rising airflow. However, because of the presence of deformation on the real wing, the outer part of the wing is still moving upward, and the early vortex system is delayed compared with the rigid wing.
At t/T = 0.1, a vortex ring is generated on the upper surface of the wing and becomes larger as the flapping goes on.The vortex ring, which is jointed by the edge vortexes (i.e.,LEV, TEV, and TV), is observed to become stronger until the wing rotates to the extreme position where the downstroke ends and the upstroke starts.From t/T=0.1 to t/T=0.5,the vortex ring forms and stretches around the wing and eventually breaks down.
At t/T = 0.5, when the upstroke starts, the vortex structures generated during downstroke are not completely detached due to the still downward-moving outer wing part.Shortly after t/T =0.5, the whole wing flaps up and new vortexes are generated. The following process is similar to that of the downstroke.
3.4. Inertial forces
In this section, the inertial forces of the polyester film and the skeleton will be compared and analyzed. Then, the inertial forces of each carbon rod will be analyzed and discussed.
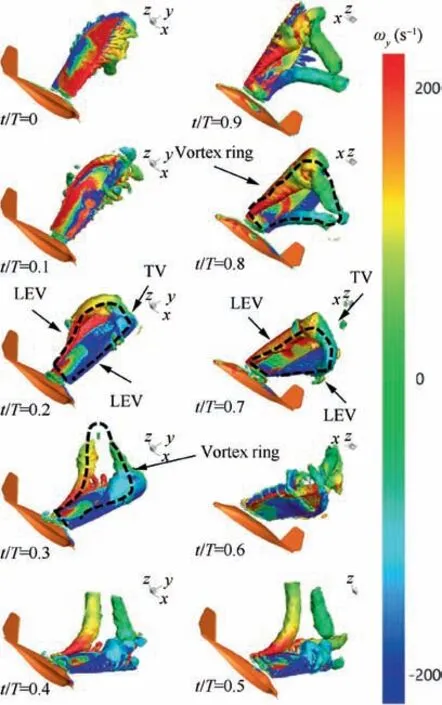
Fig. 13 Isosurface of Q criterion (Q = 5000) colored by y vorticity during one flapping cycle.
Fig. 14 shows the inertial forces of the polyester film and the skeleton. The variation pattern of the two is very similar,but there is a difference in the amplitude. The amplitude of the skeleton is larger than that of the polyester film in the direction of both lift and thrust. For rigid wings, the peaks of inertial forces should occur at the time of the reversal stage,which are the conversion moments of the downstroke and upstroke(i.e.,t/T=0 and t/T=0.5).Note that,in the current study, due to the phase lag, the peaks of the inertial forces in both directions are a little behind the conversion moments.
The slope fluctuations between the peak and trough of the skeleton in z direction, as indicated by small black arrows, are seen(Fig.14(a)).As mentioned before,there is a phase difference between the inertial force of the rigid wing model and the real wing due to the flexibility of the wing. This phase difference is mainly caused by the incongruent movement between the inner and outer part of the wing. To illustrate, we take the blue solid curve as an example(Fig.14(a)).Note that,at the peak,the wing deforms greatly and stores a lot of elastic energy. After t/T=0.25,the inner part of the wing begins to slow down,while the outer part still goes on and rebounds downward due to the release of stored elastic energy,resulting in the slope fluctuation.The mechanism is similar when it comes to upstroke.
In the thrust direction, the two show similar fluctuations(Fig. 14 (b)) and reveal the phenomenon of ‘‘four peaks and four troughs” in the flapping cycle (covered in detail in Section 3.6).
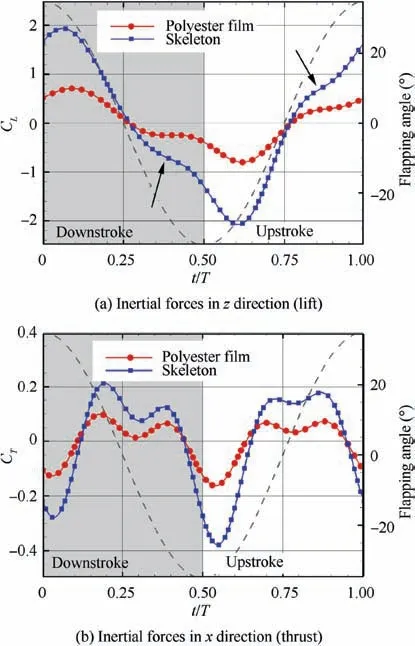
Fig.14 Comparison of inertial forces between polyester film and wing skeleton.
Fig.15 shows the inertial forces variation of the wing components, i.e., the polyester film and the carbon rods. It can be seen from the figure that the inertial force amplitudes of the three wing ribs (Rib1, Rib2, and Rib3) close to the wing root are almost negligible. The two ribs (Rib4 and Rib5) in the outer section of the wing are relatively far away from the rotational center compared with the inner ribs, which leads to larger linear acceleration and thus relatively larger amplitudes than those of the inner ribs. For the leading rod and the oblique rod, because they are made of thicker carbon rod and are longer than the ribs,the inertial forces are significantly greater than those of the wing ribs.
Also, it can be seen from Fig. 15 that the magnitude of the inertial forces of the polyester film are between those of the leading rod and the oblique rod in both directions, indicating that the inertial forces of the polyester film cannot be neglected.
The distribution of the inertial force depends on the distribution of wing acceleration.Therefore,the distribution of inertial forces on the wing can be described by the acceleration distribution of wing particles.The rod and the membrane have the same acceleration where they overlap. In order to identify the position of the rods,the rods are labelled by black lines,so that we can easily find the corresponding acceleration of the rods in the contour.
The particle accelerations on the wing at different moments are shown in Fig.16.The acceleration of the particle is nondimensionalized by

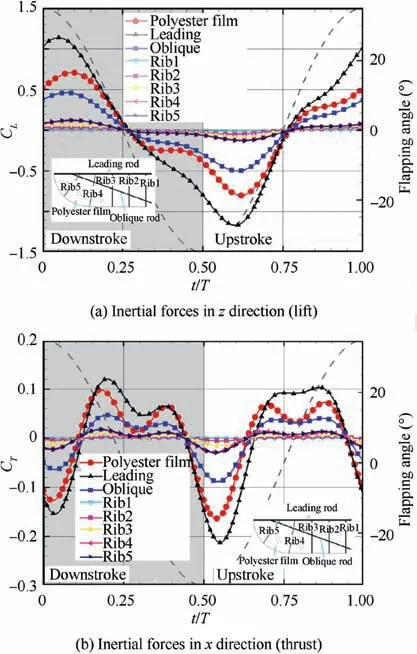
Fig. 15 Inertial forces of different components of wing.
At t/T = 0.1, as shown in Fig. 16 (a), the wing is in the reverse phase. The wing area near the wing tip has greater downward acceleration, as indicated by dark blue.
When t/T=0.25 and t/T=0.75,the wing is in the middle position of the fan-shaped flapping area, and the acceleration of the whole wing is low, as shown in Fig. 16 (b) and Fig. 16(d) with moderate color.
At t/T=0.6,when the whole wing starts to move upward.The outer part of the wing has a large deformation. At the same time, the wing root is trying to pull up the outer part of the wing, which makes the outer part of the wing have a large upward acceleration,as indicated by yellow in Fig.16(c).
The inertial forces of the leading rod, the oblique rod, and the polyester film are the main sources of the inertial forces of the wing, and they are noticeably greater than the inertial forces of the wing ribs.
During flapping,the existence of adverse inertial forces will consume extra energy supply, which is not conducive to the efficient flight of the Dove. The leading rod, oblique rod,and polyester film contribute most of the inertial forces during flapping. This gives us the idea to improve the design of wing structure, that is, we can reduce the adverse inertial forces by optimizing the carbon rod parameter and layout without deteriorating the aerodynamic characteristics. This is a possible way to improve the flight performance of the Dove or indeed any other flapping wing vehicle.
3.5.Comparison between inertial forces and aerodynamic forces
The aerodynamic and inertial forces are both present during flapping. The two are so entwined that it is hard to discern their contribution to the resultant force quantitatively.In view of this, the temporal variation of these two kinds of force obtained in previous sections is plotted in Fig. 17.
Fig. 17(a) shows the variation of aerodynamic and inertial forces in z direction(lift).It can be seen from the figure that the amplitudes of the two are on the same order of magnitude.The aerodynamic force is approximately twice the amplitude of the inertial force.There is also a difference in the phase.The peaks of the aerodynamic force occur around the middle of the downstroke and upstroke, whereas the peaks of the inertial force occur near the reversal moments.
Fig. 17(b) shows the variation of aerodynamic and inertial forces in x direction(thrust).It is seen from the figure that the aerodynamic force is noticeably larger than the inertial force.This means that in the thrust direction,the effect of the inertial force is relatively small. Note that the aerodynamic force is positive most of the time during flapping, while the inertial force fluctuates around the zero value, and its mean value is close to zero.
The averaged values of the two forces are shown in Table 3.In x direction (thrust), the mean values of aerodynamic force and inertial force are 28.74 g and-0.13 g respectively,indicating that the average thrust is almost entirely contributed by aerodynamic force. In the lift direction, compared to the peak values, the mean values of the aerodynamic force and inertial force are around zero, which is expected under the current experimental setup.
3.6. Comparison with experimental results
During flapping,the wing is affected by both aerodynamic and inertial loads. The two loads are coupled together and sensed by the load cell.Therefore,the force measured by the load cell is the resultant force of aerodynamic and inertial forces. To obtain the total forces numerically, the inertial forces and the aerodynamic forces (CFD results) need to be added up.Fig.18 shows the comparison between the experimental results(load cell value) and the numerical results (CFD + Inertia).
Fig.18(a)shows the total force variation in z direction(lift).Close agreement is observed between the experiment and the numerical simulation.The initial position(t/T=0)of the flapping wing is set corresponding to the onset of the downstroke,that is, the position where the flapping angle reaches its maximum value. As shown in Fig. 18(a), the lift obtained by numerical simulation shows a similar trend as the experimental one. The averaged lift forces obtained by experiment and numerical simulation are almost zero compared to their peak values (Table 4). This should be the case because the Dove was installed at zero angle of attack and flapped at zero freestream velocity.Both the positive and negative peaks of the lift are around 250 g. The positive peak lasts longer than the negative peak.This may be related to the asymmetric structure of the cross-section of the flapping wing.The peak and trough in the experiment were well captured by the numerical simulation. In particular, when the lift peak first appears (around t/T=0.2),the numerical result almost coincides with the experimental one. Also, the two are almost identical for the time interval from t/T = 0.8 to t/T = 0.9.
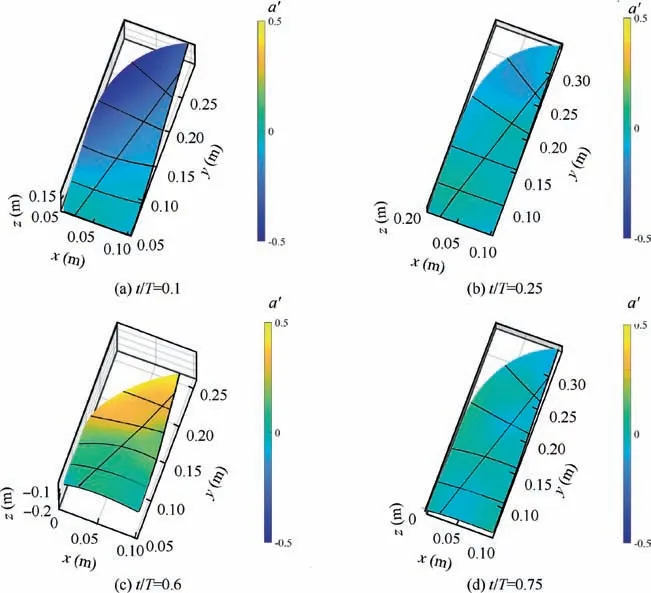
Fig. 16 Instantaneous contours of wing particle acceleration.
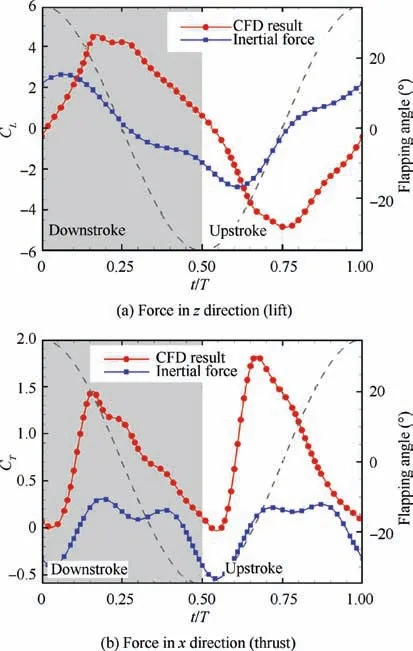
Fig. 17 Comparison of aerodynamic forces and inertial forces.

Table 3 Averaged force comparison between aerodynamic and inertial forces.
Fig. 18(b) shows the total force variation in x direction(thrust).Reasonable agreement is observed between the experiment and the numerical simulation.In the experimental result,the thrust curve presents the phenomenon of ‘‘four peaks and four troughs” in the flapping cycle. The ‘‘four peaks” refer to the four peaks in Fig.18(b),as labeled by black plus signs.The‘‘four troughs” refer to the four troughs in Fig. 18(b), as labeled by black minus signs. Note that, among the four troughs, two troughs of the thrust values are positive, and the other two troughs are negative, whereas all the four peaks have positive thrust values. The numerical simulation qualitatively captures the two peaks and troughs during the downstroke. During the upstroke, the numerical simulation does not capture the fluctuation phenomenon as in the experiment.There is a certain deviation in the thrust variation between the numerical and experimental data. The difference between upstroke and downstroke in peaks and time courses of thrust is mainly caused by the anisotropic stiffness of the wing structure.
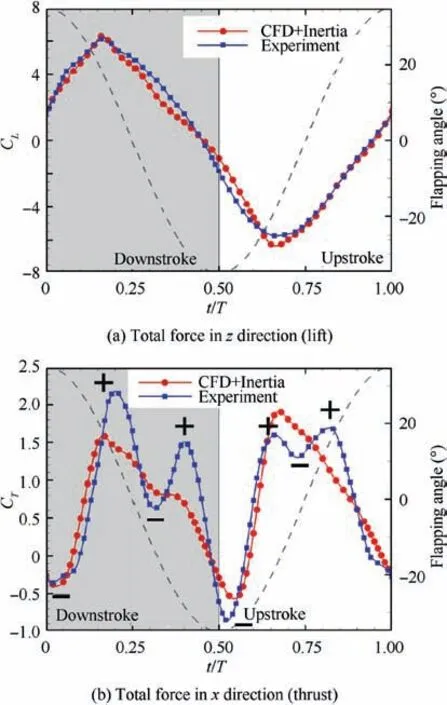
Fig. 18 Comparison of total force with experimental data.

Table 4 Averaged force comparison between experimental and numerical results.
There is a phase difference between the rigid wing model and the real wing due to the deformation of the wing. This phase difference is mainly caused by the incongruent movement between the inner and outer part of the wing.Note that,in the extreme positions (upper and lower extreme position),the wing deforms greatly and stores a lot of elastic energy.The stored elastic energy bounces as it is released, causing the thrust curve to fluctuate. Because the stiffness of the wing surface is asymmetrical (wing section camber, one sided adhesive of the membrane) during the flapping cycle, it results in different time courses of thrust in upstroke and downstroke.
Nevertheless, the mean values of the two are very close,with an error of about 10%, indicating that the numerical result has good accuracy in the mean value of thrust,as shown in Table 4.
4. Conclusions
The mechanism of force generation of a dovelike FWMAV,the Dove, including the aerodynamic forces and the inertial forces,were studied by combining experimental and numerical methods. To acquire accurate dynamic morphological deformation of the flapping wing, the DIC technology was used to obtain the dynamic morphological deformation of flapping wing. Then, the dynamic morphological deformation was embedded into the CFD solver to account for the aeroelastic effects. Note that, the dynamic morphological deformation of the wing was obtained experimentally, thus omitting the demand for a complex FSI model.Also,based on the dynamic morphological deformation, the inertial forces of the wing were calculated by discretizing the wing into a system of particles to take into account the flexibility effect. The following conclusions can be drawn:
(1) The formation and evolution of the vortical structures,including the LEV,TEV,TV,and vortex rings,are visualized by the CFD simulation. In the middle of the downstroke, there is a noticeable low-pressure area on the upper surface of the wing due to the LEV, while a relatively uniform high-pressure area on the lower surface due to impacting with the air. The net pressure difference between the upper and lower surfaces at t/T = 0.25 and t/T = 0.75 is the main reason for the extremum values at these two moments.The vortex ring is formed by the LEV, TV, and TEV according to the theory of vortex dynamics which states that vortex filaments can only end at solid walls or form vortex rings.Because the numerical simulation is carried out under the condition of zero freestream velocity, the vortical structures are advected only by self-induction,and hence tend to stick near the wing,resulting in a complex interference structure around the wing.
(2) Theoretically,for rigid wings,the peaks of inertial forces should occur at the time of the reversal moments. Note that,in the current study,due to the phase lag,the peaks of the inertial forces in both directions are a little behind the reversal moments. For the inertial force in z direction, at the peak, the wing deforms greatly and stores a lot of elastic energy. At t/T = 0.25, the inner part of the wing begins to slow down, while the outer part still goes on and rebounds downward due to the release of stored elastic energy, thus resulting in the slope fluctuation. The mechanism is similar when it comes to upstroke.
(3) The magnitude of the inertial force in the lift direction is on the same order of magnitude as the aerodynamic force, while the magnitude of the inertial force is relatively small in the thrust direction. In the thrust direction, the mean values of the aerodynamic force and inertial forces are 28.74 g and-0.13 g respectively,indicating that the average thrust is almost entirely contributed by aerodynamic force.
(4) The numerical results (CFD + Inertia) were compared with the experimental results (load cell values). In summary,the trend of the variation of the forces was similar for the experimental and numerical result. A very good agreement is revealed for the forces in z direction (lift)in particular, whereas a deviation was found with respect to the forces in x direction(thrust).Nevertheless,the mean values of the two are very close, with an error of around 10%.
The authors declare that they have no known competing financial interests or personal relationships that could have appeared to influence the work reported in this paper.
This study was supported by the National Natural Science Foundation of China (No. 11872314) and the Key R&D Program in Shaanxi Province of China (No. 2020GY-154).
