原位ATR-IR光谱实时研究DKDP的结晶过程
刘发付,张 丛,郭建斌,张 武,曹剑武,张海波,徐明霞
(1.内蒙金属材料研究所,包头 014000; 2.华中科技大学材料科学与工程学院,武汉 430073;3.山东大学晶体材料国家重点实验室,济南 250100)
0 Introduction
DKDP single crystal is a type of nonlinear and electro-optical material used as frequency converter and electro-optical switch in high power laser system[1-5]. With the development of Inertial Confinement Fusion (ICF), more high-quality DKDP crystals with the large size of over half a meter are needed in National Ignition Facility (NIF)[6]. In the past, researchers had paid much attention on the growth processes of KDP and DKDP crystals[7-16]. Most researches focused on the micro-structure morphology of {100} and {101} faces of KDP crystals via Atomic Force Microscope (AFM) technique[7-13]and found that the screw step growth and 2D growth are the two main growth mechanisms of {100} and {101} faces in KDP and DKDP crystals[10-13]. In addition, some highly sensitive methods were used to study the crystallization of KDP crystal[14-17]. For instance, the X-ray technique was adopted to study the solid-solution interface of KDP crystals[14], and it shows the growth order degree in the perpendicular direction layer is stronger than that in the lateral direction layer[14]. Through IR spectra, the (H2PO4-)nnanoclusters are founded as growth unite connected into KDP lattice[15-16]. Via Fourier Transform Infare Attenuated Total Reflection (FTIR-ATR) technique[15-16], the clusters such as (H2PO4--H2O) and (H2PO4--H2PO4-) are observed in KDP solution. Furthermore, by FTIR-ATR technique, the ADP crystallization process was also in situ measured[17]. Therefore, FTIR-ATR is a promising technique to observe the changes of ionic group in solutions during the crystallization process.
Although there are many studies on the growth of KDP crystal, the crystallization process of DKDP crystal will be different from the growth of KDP crystal due to the deuterium segregation. And there is a lack of the research on the of DKDP crystallization. Thus, in this study, in situ ATR-IR spectra was applied to characterize the bonding behaviors of D2PO4-, H2PO4-and HDPO4-ions in unsaturated and supersaturated growth solutions during DKDP crystals growth processes. This research shows that the (H2PO4-)n-x(D2PO4-)xnanoclusters are the growth unite through the appearance of the δ(P—O…H/D—O—P) vibration peak. Besides, the variations intensity of the H—O—H vibration from 1 638 cm-1to 1 652 cm-1and the D—O—D vibration from 1 248 cm-1to 1 294 cm-1can be used to interpret the deuterium non-uniform distribution of DKDP crystals in growth process. Generally, the growth processes of DKDP crystals have been deeply studied in this research, which could be a direction for the growth of DKDP crystals with uniform deuterium content.
1 Experimental section
The crystallization of DKDP crystals in solutions with different deuterium contents (Ds) were conducted at room temperature by ATR-IR technique (Thermo Nicolet 6700). The testing mode of infrared spectrum is the attenuated total reflection mode with internal reflection element of diamond single crystal. The schematics of ATR-IR experimental apparatus and IR light path are shown in Fig.1.

Fig.1 Schematics of ATR-IR experimental apparatus and IR light path
This spectrometer is equipped with high sensitivity DTGS detector. The spectra of DKDP samples were recorded by Nicolet 6 700 spectrometer during the states of growth solutions from unsaturated to supersaturated state. The absorption spectra of all DKDP solutions were conducted from 4 000 cm-1to 600 cm-1. The spectra of all samples were displayed in the form of transmittance as a function of wavenumber. The DKDP solutions with deuterium contents of 0, 10%, 20%, 30%, 40%, 50%, 60%, 70%, 80% and 90% were prepared with high purity KH2PO4salt (National Pharmaceutical Group Chemical Reagent Co., Ltd.), deionized H2O and D2O, while the 99% DKDP solutions was prepared with KD2PO4salt (self-synthesis) and D2O. The deuterium content of DKDP solution was described by formula (1)[18]:
(1)
In which them(D) andm(H) are the moles of deuterium and hydrogen in DKDP solution, respectively. The supersaturation temperature of DKDP solution were controlled at 26 ℃, slightly higher than the room temperature. The DKDP solutions were prepared at 50 ℃, which ensures the sufficient dissolution of KH2PO4and KD2PO4salts in H2O and D2O solvent. Then, the DKDP solution was dripped into ATR cell. As time increases, the solution temperature decreases and the solvent water naturally evaporates, which resulted in saturated and supersaturated DKDP aqueous solutions. Successively, IR spectra of KDP in un-saturated, saturated and supersaturated solutions could be recorded with time increasing, and the testing time lasted for 900 s. The chemical bond information of DKDP solution in crystallization process could be recorded by IR spectra.
2 Results and discussion
2.1 KDP crystallization
As shown in Fig.2, the crystallization process of KDP crystal was recorded by ATR-IR spectra at the time from 0 to 900 s. With the increase of the measurement time, the solution state was transferred from unsaturated to saturated, and then to supersaturated. With the increasing concentration of KDP, the intensity of the υ3(PO4) vibration peaks at 1 150 cm-1and 939 cm-1decreases individually and the width of υ1(PO4) vibration peaks at 1 072 cm-1and 876 cm-1respectively broadens, while the intensity of the δ(P—O…H—O—P) gradually increases with such changes of the KDP solution. These transformations of the IR vibration peaks indicate that H2PO4-ions experienced a process in which the monomers were polymerized into multimers, and then aggregated into the (H2PO4-)nnanoclusters, lastly formed into the lattices of KDP crystals in aqueous solutions[15].

Fig.2 IR spectra of KDP solution at the time from 0 to 900 s
2.2 99% DKDP crystallization
As shown in Fig.3, the peaks at 1 173 cm-1, 1 079 cm-1, 937 cm-1and 858 cm-1belong to the stretching vibration of D2PO4group. As the test time passes, the intensity of the vibration peaks at 1 173 cm-1and 937 cm-1gradually decreases, and finally disappeares. The red shift of these two vibration peaks indicates that the D2PO4-(D2O) hydrated ions in the solution are gradually transformed into D2PO4-. Meanwhile, the trend of red shift wavenumber in the vibration peaks at 1 079 cm-1and 858 cm-1points out that the force constant of P—O chemical bond in (PO4) decreases, and the D2PO4-groups gradually transfer from disorder to order. The intensity of δ(P—O…D—O—P) at 1 294 cm-1increases with the rising time, illustrating the D2PO4-ions breaking from D2PO4-(D2O) aggregates into (D2PO4-)nnanoclusters. The absorption wavenumbers of δ(P—O…D—O—P) in solutions are close to those in DKDP crystals, which shows that (D2PO4-)nis the growth unite to connect the DKDP lattices in the growth process. Moreover, the intensity of the absorption peak of D2O at 1 453 cm-1decreases with the enlargement of supersaturation, indicating that D2PO4-ions break from D2O. Therefore, these D2PO4-ions are the resources of (D2PO4-)nclusters.
Conclusively, the changes of all stretching vibration peaks of D2PO4group proved that D2PO4-ions firstly break from D2PO4--D2O groups and transform into (D2PO4-)nclusters. Then the clusters become larger in aggregated degree with the increasing time, and finally served as growth unites connected with the lattices of DKDP crystals. Accordingly, the crystallization process of the high purity DKDP crystal is the same as that of KDP crystals. Schematics of 99% DKDP crystallization are shown in Fig.4.

Fig.3 IR spectra of high purity DKDP solution at the time from 0 to 900 s

Fig.4 Schematics of 99% DKDP crystallization
2.3 10%~90% DKDP crystallization
The DKDP solution withDs≤90% was prepared from KH2PO4raw material, D2O and H2O in a certain proportion. In the solution, the isotope exchange reaction processes are listed as follows:
(2)
As the reaction equilibrium formula shown, the groups existing in DKDP solution are H2O, D2O, HDO, H2PO4-, HDPO4-, and D2PO4-. The hydrated ions of PO4in the solution include: H2PO4-(H2O), H2PO4-(HDO), H2PO4-(D2O), HDPO4-(H2O), HDPO4-(HDO), HDPO4-(D2O), D2PO4-(H2O), D2PO4-(HDO), and D2PO4-(D2O) etc.
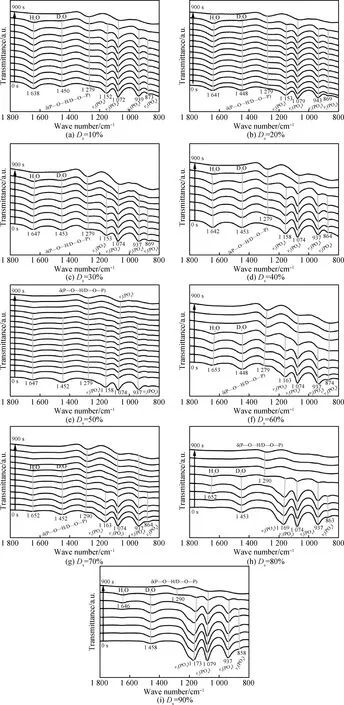
As shown in Fig.5, the IR spectra of DKDP crystallization process in solutions with different deuterium contents (10%~90%) were measured. The vibration wave numbers were shown in Table 1. Due to the existence of H2PO4-, HDPO4-, and D2PO4-ions in DKDP solutions, the wavenumbers ofυ1(PO4) andυ3(PO4) are different from those of KDP and 99% DKDP solutions. Thus, the H2PO4-, HDPO4-, and D2PO4-ions could be simplified as H2-xDxPO4-ions (x≤2).
For all kinds of DKDP solutions, the IR transmittance intensity ofυ1(PO4) andυ3(PO4) stretching vibrations decreases with the increasing concentration of DKDP solution, indicating that the concentration of H2-xDxPO4-ions in DKDP solutions increases the same as its supersaturation. The intensity of δ(P—O…H/D—O—P) at 1 279 cm-1(Ds=10%~60%) and at 1 290 cm-1(Ds=10%~60%) increases with time going on. The absorption wave number of the δ(P—O…H/D—O—P) was between the wave numbers of δ(P—O…H—O—P) and δ(P—O…D—O—P), indicating that the H2-xDxPO4-clusters are consisted of H2PO4-, D2PO4-, and HDPO4-ions. Therefore, the growth clusters could be simply expressed by (H2PO4-)n-x(D2PO4-)x, in whichxis the deuterium content in DKDP crystal.
For 10%~70%DKDP crystals, the bending vibrations of H2O (1 638 cm-1) and D2O (1 450 cm-1) were illustrated together in the IR spectra. The intensity of these two vibrations gradually decreases with measurement time, indicating that the hydrated H2PO4-, D2PO4-, and HDPO4-ions break from the P—O…H—O—H, P—O…D—O—H, and P—O…D—O—D hydrogen bonding,respectively. ForDslower than 50%, the vibration of 1 450 cm-1disappears firstly, demonstrating that deuterium concentration in solution increases gradually with the DKDP crystallization, which results in the non-uniform distribution of deuterium element in DKDP crystals. For theDsof 60% and 70%, the vibration peaks at H2O are about 1 652 cm-1and that of D2O is about 1 450 cm-1, which disappears at the same time, indicating that the concentrations of deuterium and hydrogen in H/DPO4-ions broken from the P—O…H—O—H, P—O…D—O—H, and P—O…D—O—D hydrogen bonding are equal with each other. Therefore, the uniformity of the deuterium distribution in DKDP crystal is better than that of DKDP crystals grown from solutions withDs=10%~50%.
For theDsof 80% and 90%, only the vibration peaks at 1 453 cm-1and 1 458 cm-1of D2O are detected in solution, indicating that most of the hydrogen element exists in the H2PO4-and HDPO4-ions. With the development of the crystallization, the intensity of vibration peaks at 1 453 cm-1and 1 458 cm-1decreases gradually. However, at the later stage of the crystallization, the vibration peaks at 1 652 cm-1and 1 646 cm-1appear firstly, and then disappear, indicating that deuterium element in D2O is replaced by some hydrogen element in H2PO4-and HDPO4-ions and then produces the H2O. The changes of these two vibration peaks demonstrate that H2PO4-, HDPO4-and D2PO4-ions bonding with D2O in DKDP solution. This phenomenon was found in the crystallization process inDsbeing of 99% as described in the previous section.
Accordingly, when theDsis more than 80%, these hydrogen element from the H2PO4-and HDPO4-ions gradually transfers to D2O and generates H2O. Namely, thexin growth cluster (H2PO4-)n-x(D2PO4-)xwould be larger with the crystallization. Therefore, the deuterium contents in early growth DKDP crystal are less than that in later growth DKDP crystal.

Fig.5 IR spectra of DKDP solution with deuterium contents at the time from 0 to 900 s

Table 1 IR vibration numbers of the KH2-xDxPO4 solutions
3 Conclusion
In the crystallization process of DKDP crystal, the growth unite is the (H2PO4-)n-x(D2PO4-)xcluster. For the 99% DKDP crystallization, thexequals to “n”, and (D2PO4-)ncluster is the growth unite; for the solutions with contents ranged from 10% to 90%, (H2PO4-)n-x(D2PO4-)xcluster (x

