Electronic Supplementary Material to:Detection and Attribution of Changes in Thermal Discomfort over China during 1961-2014 and Future Projections*
Wanling LI, Xin HAO,2, Li WANG, Yuqing LI, Jiandong LI, Huixin LI,2, and Tingting HAN,2
1Collaborative Innovation Center on Forecast and Evaluation of Meteorological Disasters/Key Laboratory of Meteorological Disaster, Ministry of Education, Nanjing University of Information Science and Technology, Nanjing 210044, China
2Nansen-Zhu International Research Center, Institute of Atmospheric Physics,Chinese Academy of Sciences, Beijing 100029, China
3Jiangsu Key Laboratory of Atmospheric Environment Monitoring and Pollution Control, Jiangsu Collaborative Innovation Center of Atmospheric Environment and Equipment Technology,School of Environmental Science and Engineering, Nanjing University of Information Science &,Technology, Nanjing 210044, China

Table S1. Rating standard of Humidex.
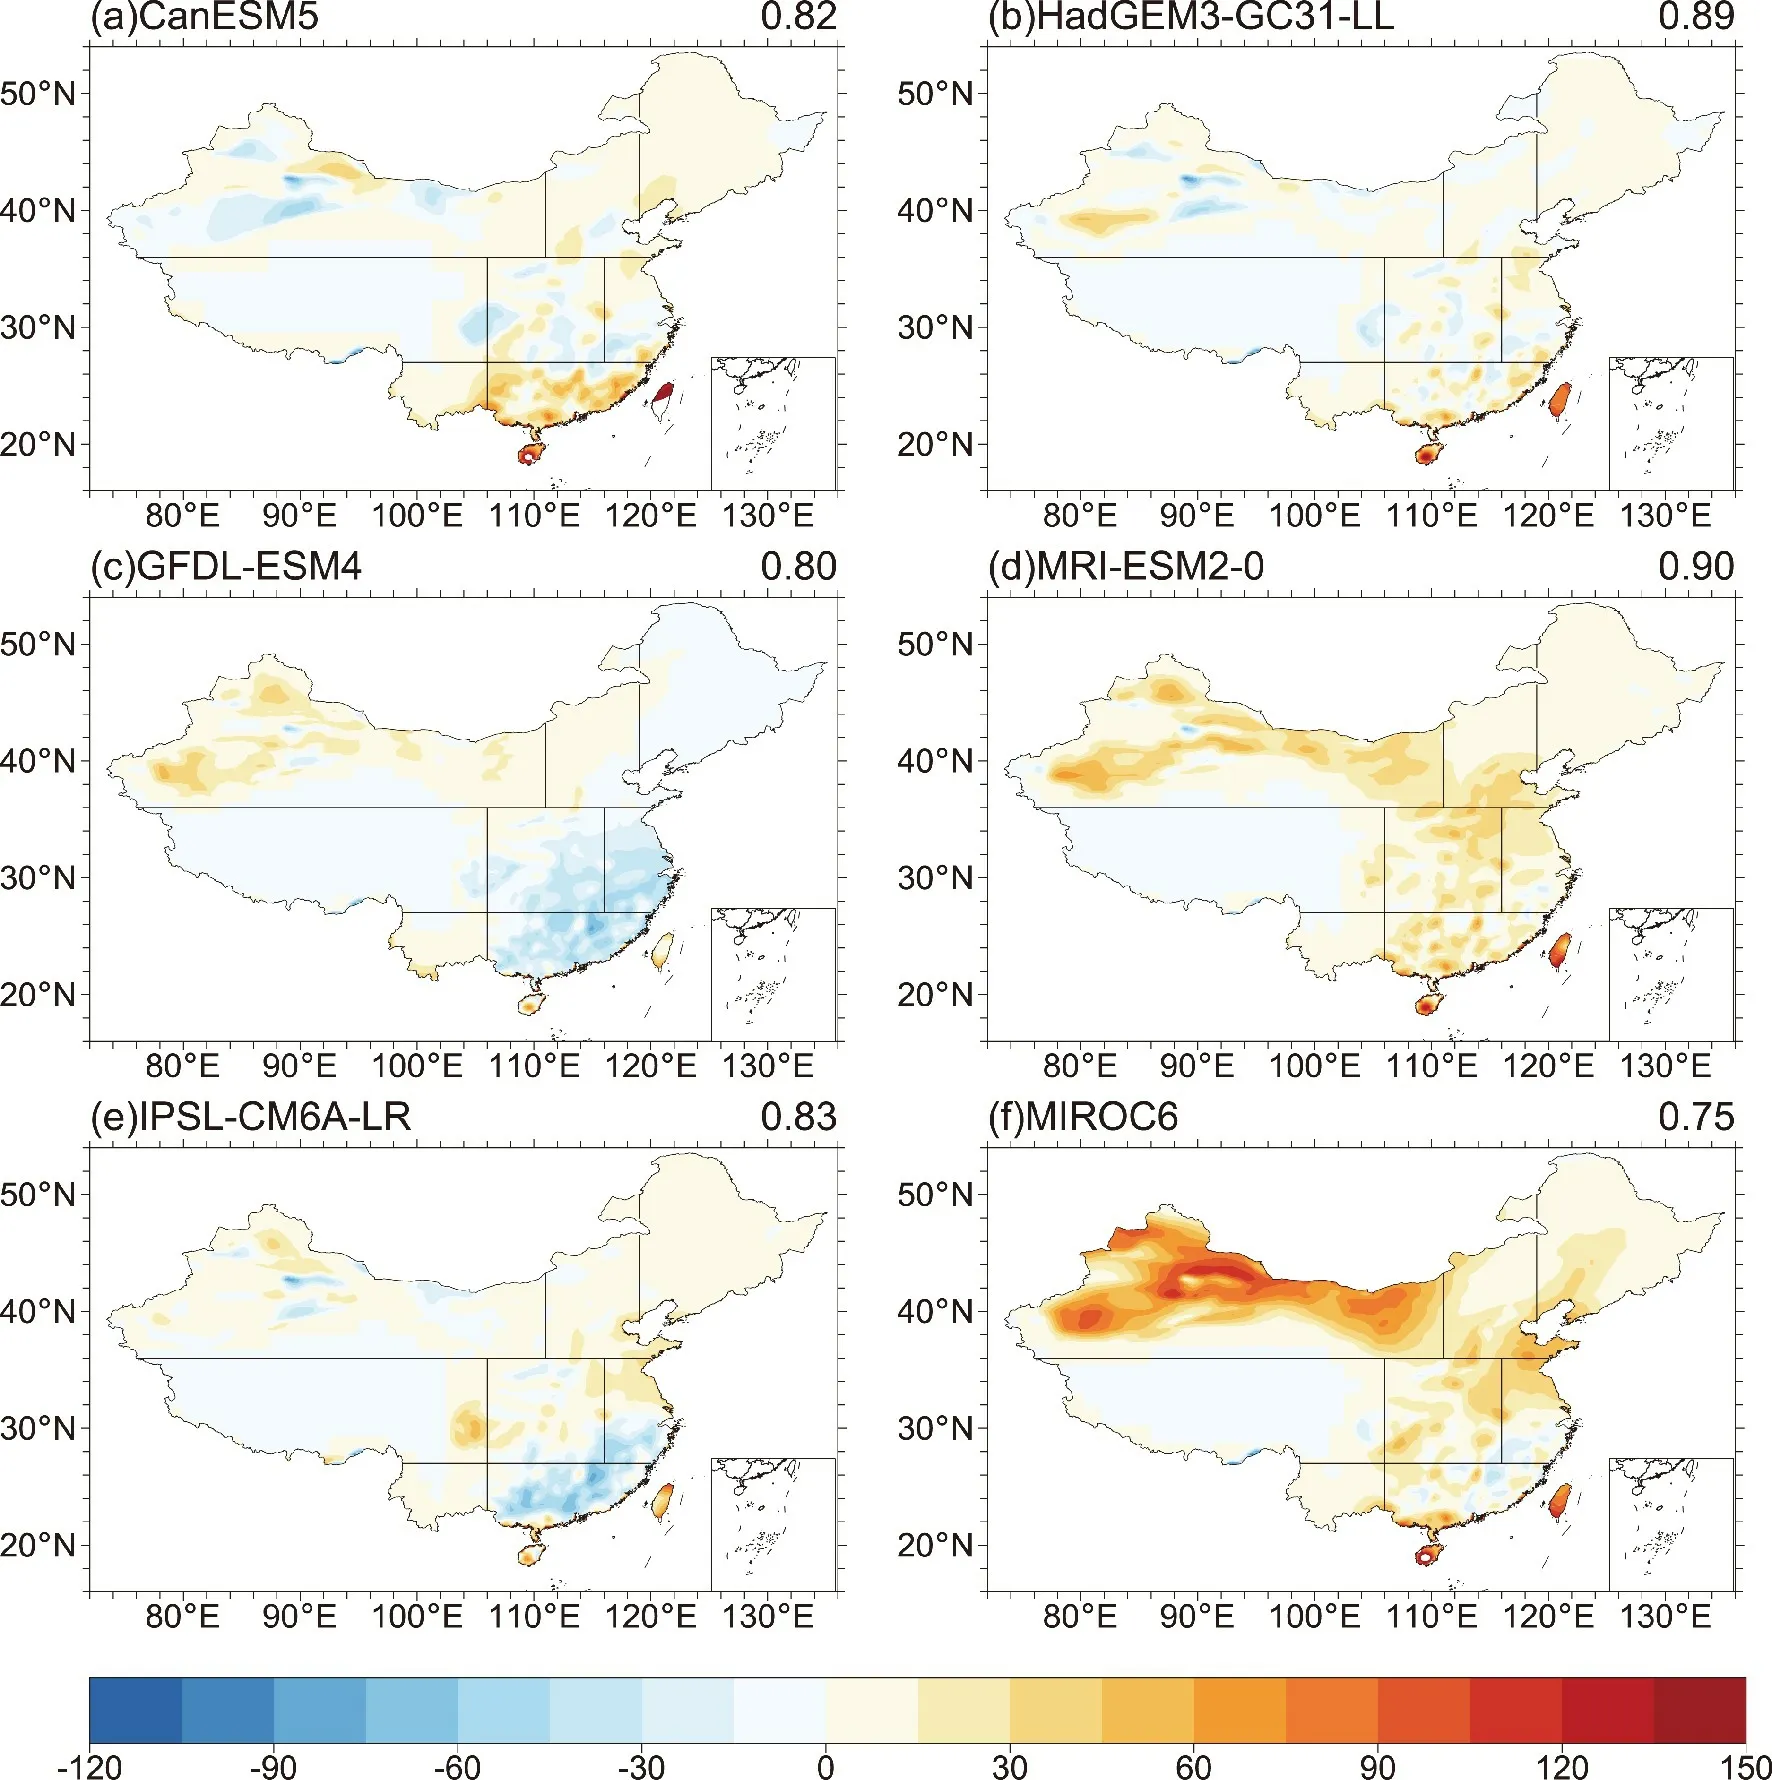
Fig. S1. Differences (units: day) in climatology of the frequency of HDDs between (a) CMIP6 CanESM5 model, (b)CMIP6 HadGEM3-GC31-LL model, (c) CMIP6 GFDL-ESM4 model, (d) CMIP6 MRI-ESM2-0 model, (e) CMIP6 IPSL-CM6A-LR model, and (f) CMIP6 MIROC6 model and observations. The numerical values in the top right corner of panels are the spatial correlations between observations and simulations.
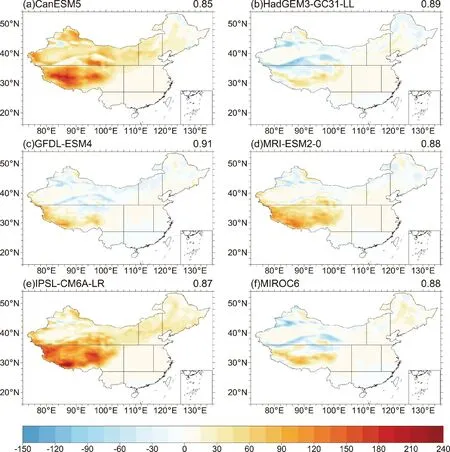
Fig. S2. Same as Fig. S1 but for the frequency of CDDs.
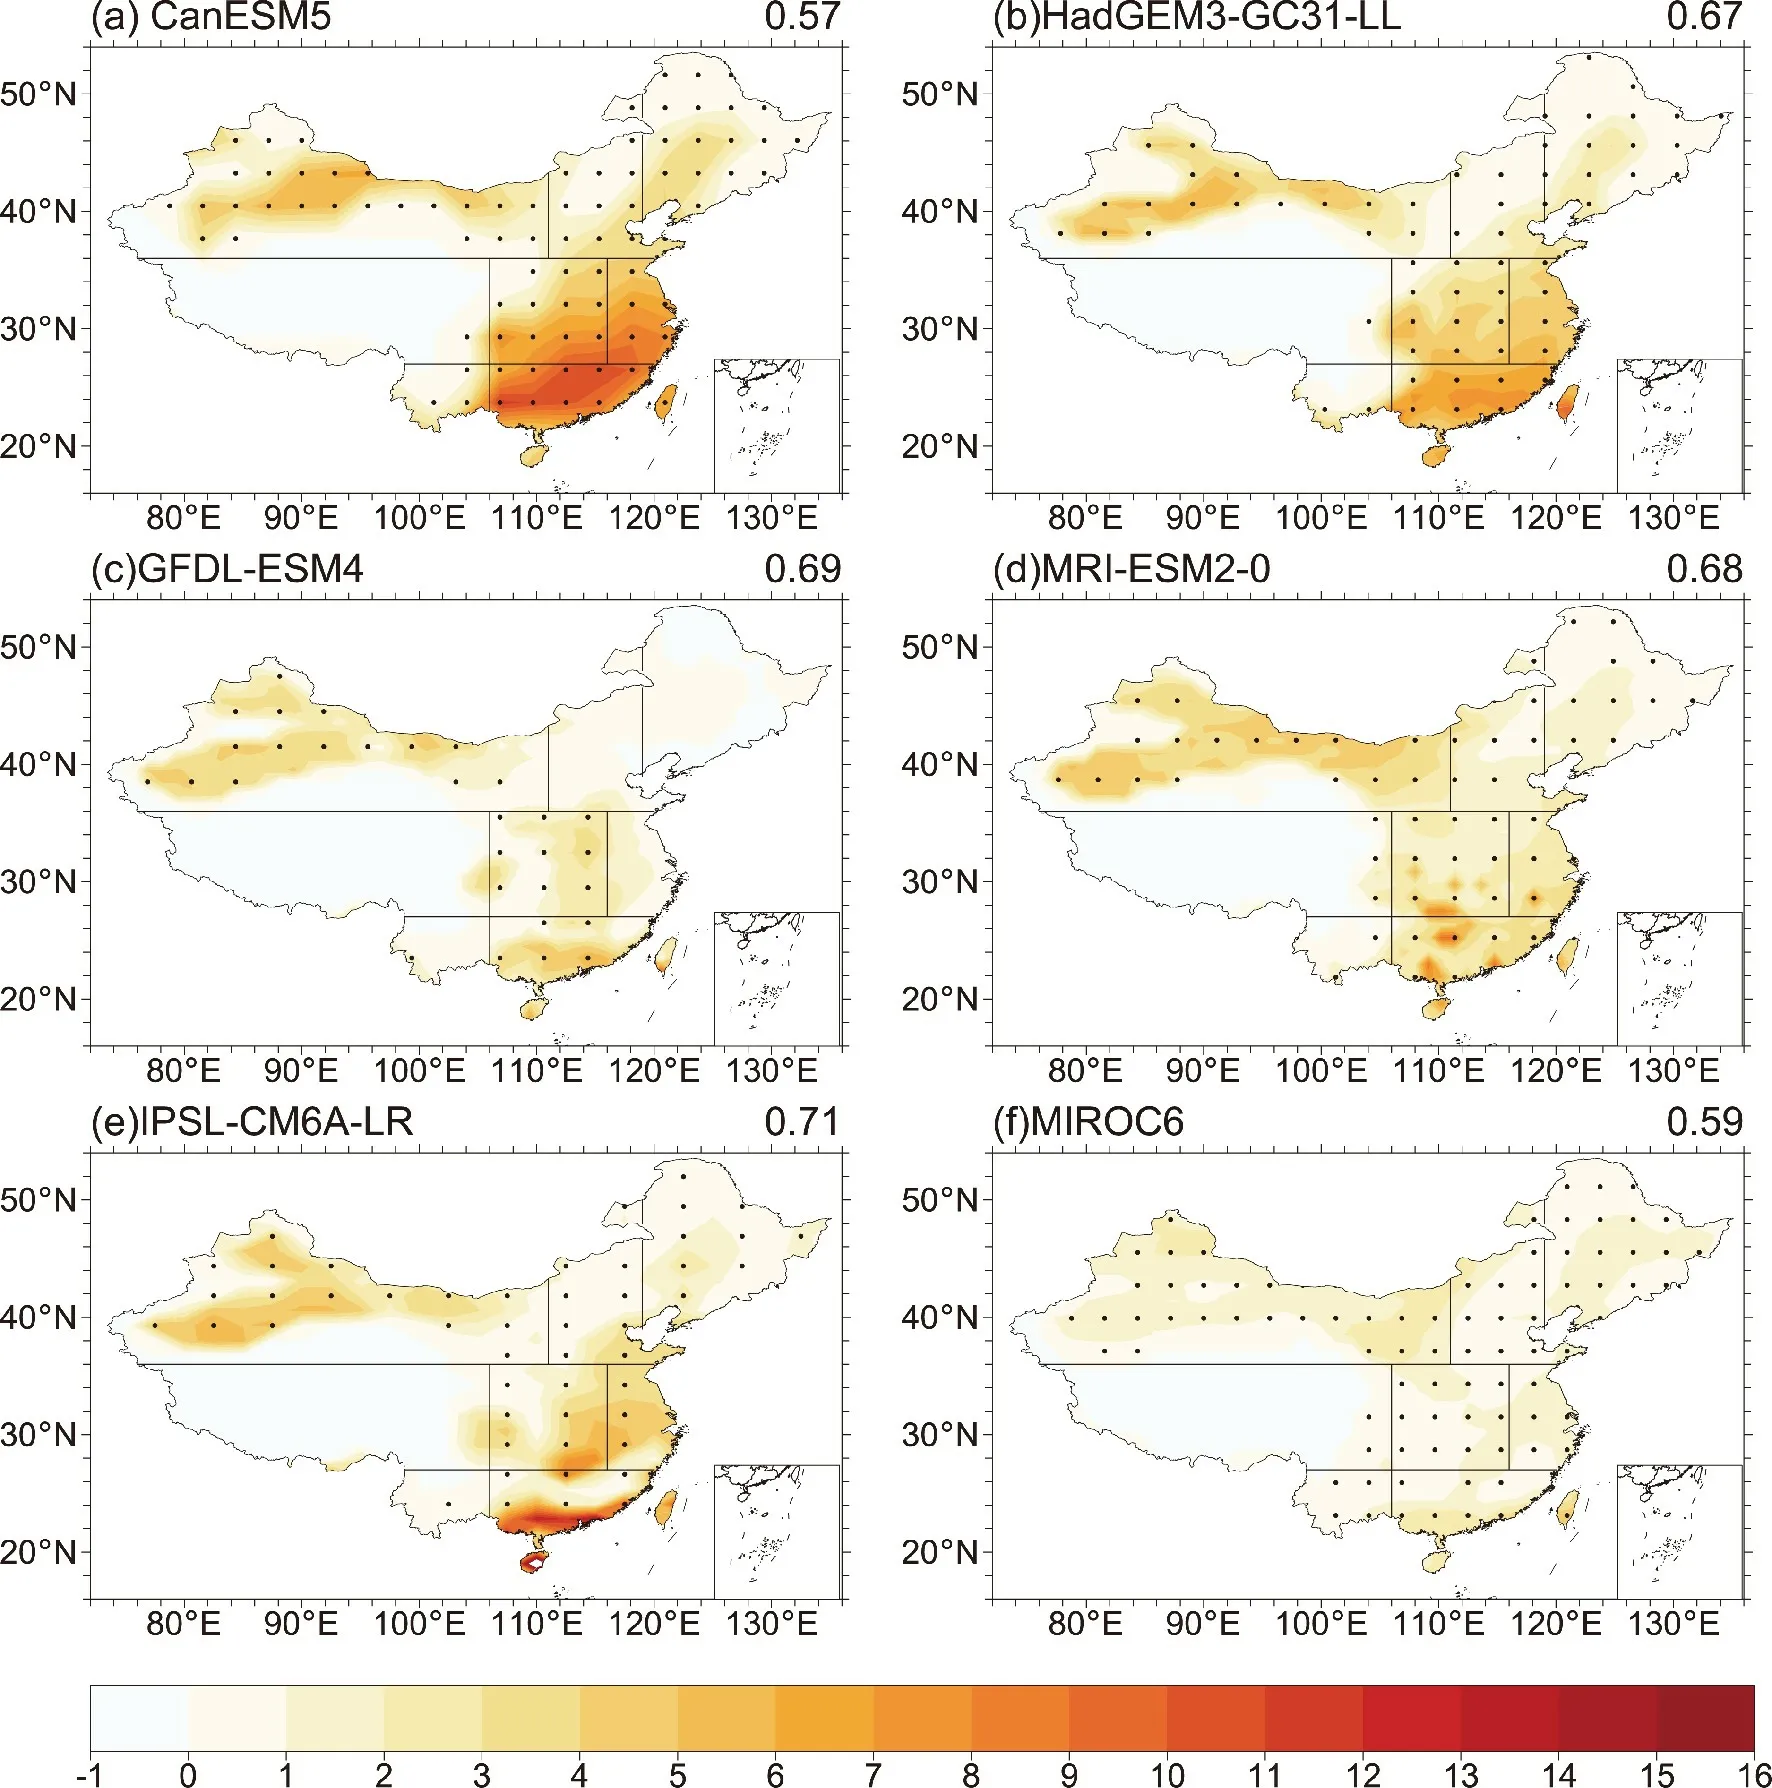
Fig. S3. Linear trends [units: d (10 yr)-1] in the frequency of HDDs of historical simulations from (a) CMIP6 CanESM5 model, (b) CMIP6 HadGEM3-GC31-LL model, (c) CMIP6 GFDL-ESM4 model, (d) CMIP6 MRI-ESM2-0 model, (e) CMIP6 IPSL-CM6A-LR model, and (f) CMIP6 MIROC6 model. The numerical values in the top right corner of panels are the spatial correlations between observations and simulations. The dotted area indicates that the linear trend is significant at the 95% confidence level.
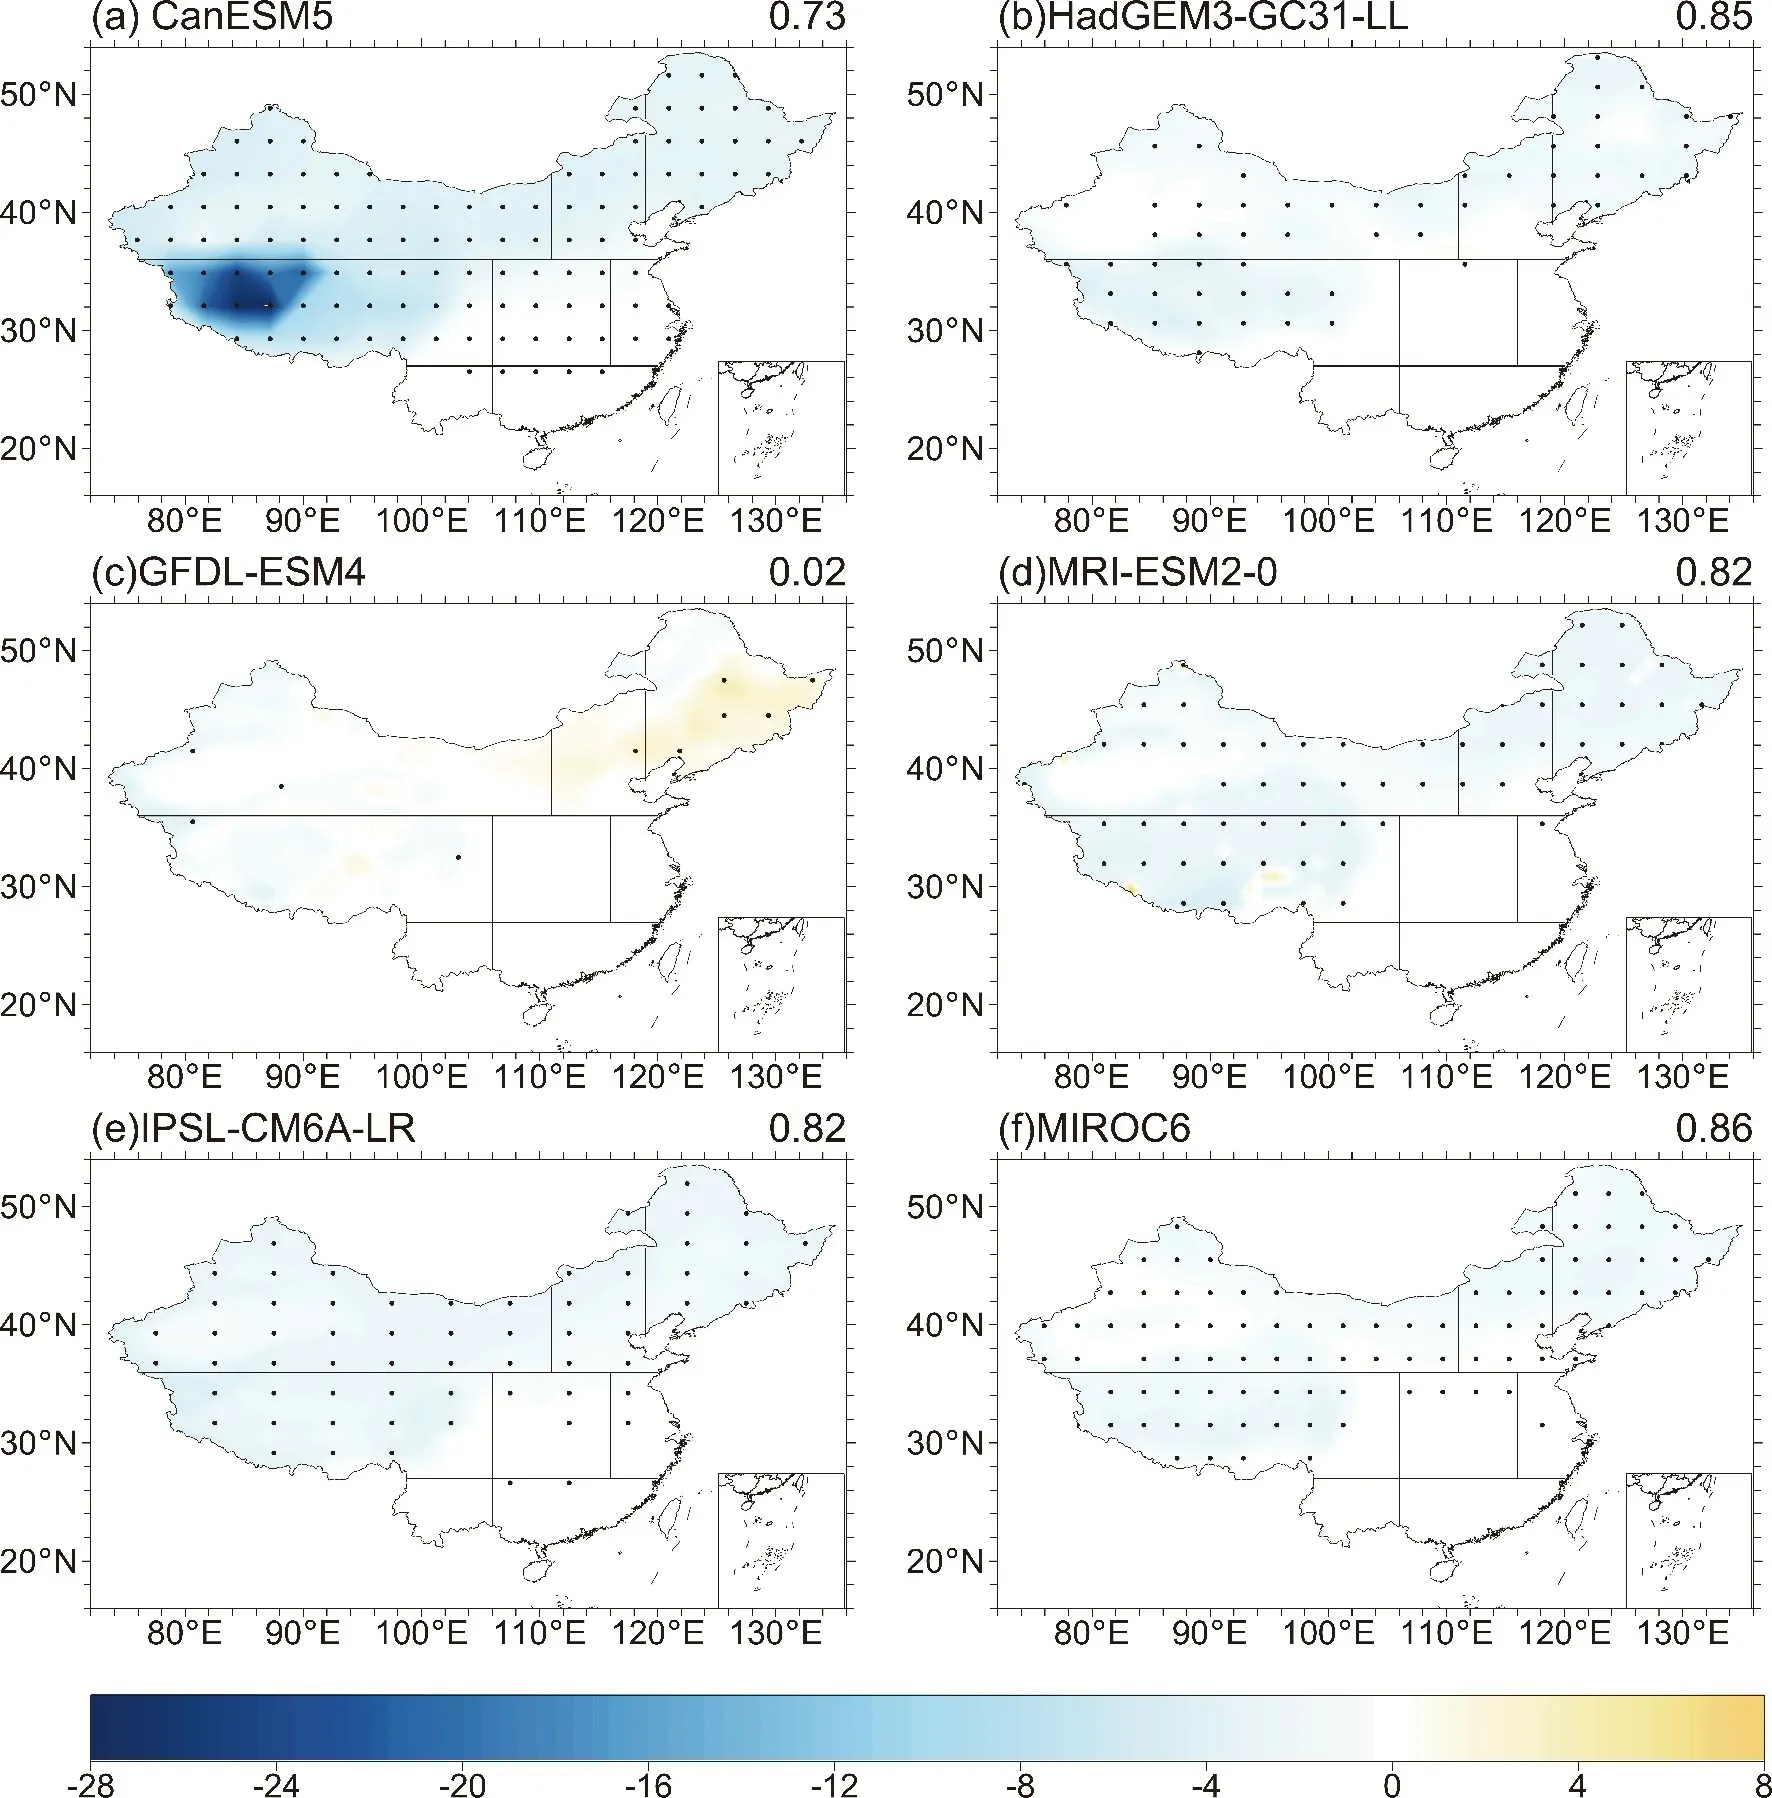
Fig. S4. Same as Fig. S3 but for the frequency of CDDs.

Fig. S5. Time series of regional mean frequency of HDDs anomalies (units: d yr-1) in the eight sub-regions from 1961 to 2014. The black, dotted line represents the original observation data, the blue line is the 10-year running average, the red line is the linear regression, and the green line is the anomaly time series for the ALL simulations.The numerical values in each subplot denote the linear trend of observation (black) and simulation (green) (units:d yr-1), and asterisks denote the 95% significance level.

Fig. S6. Same as Fig. S5 but for the frequency of CDDs.

Fig. S7. Linear trends [units: d (10 yr)-1] in the frequency of HDDs (left column) and CDDs (right column) for the AER forcing from 1961 to 2014. The results from the (a, f) CMIP6 CanESM5 model,(b, g) CMIP6 HadGEM3-GC31-LL model, (c, h) CMIP6 MRI-ESM2-0 model, (d, i) CMIP6 IPSLCM6A-LR model, and (e, j) CMIP6 MIROC6 model are shown. The numerical values on the bottom left of each subplot denote the spatial correlation of linear trends between the observations and simulations. The dotted area indicates that the linear trend is significant at the 95% confidence level.
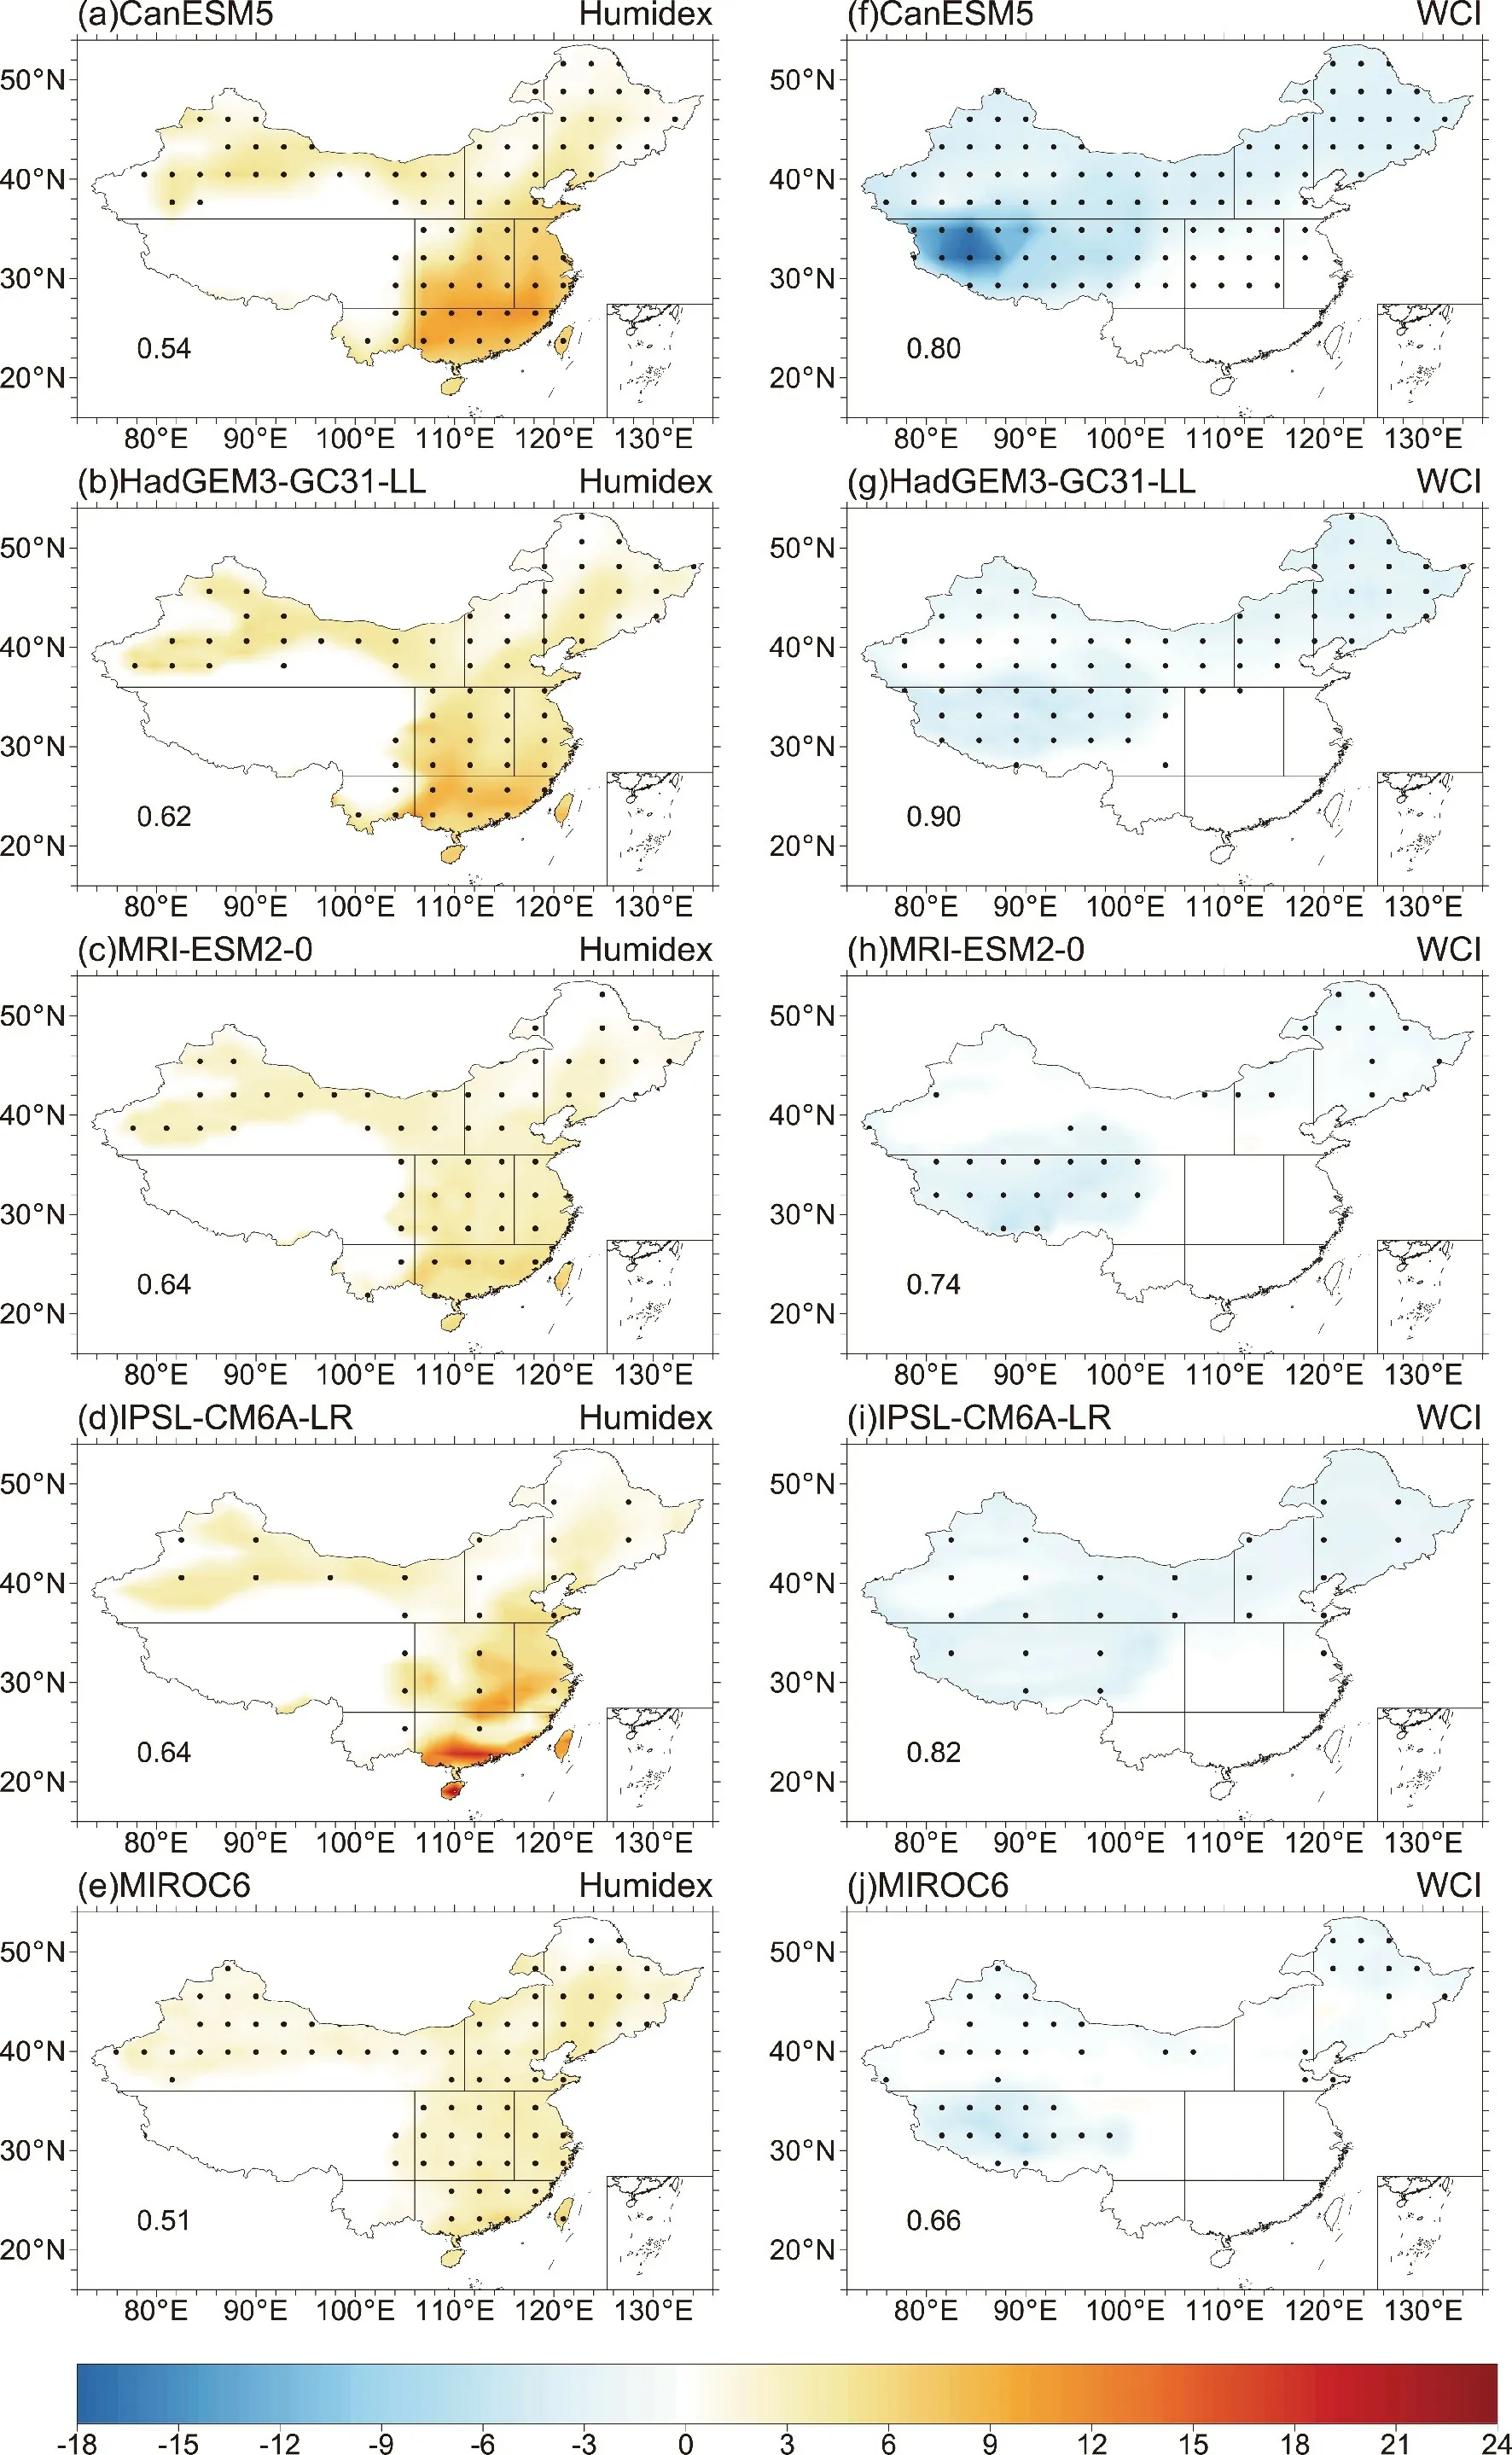
Fig. S8. Same as Fig. S7 but for the GHG forcing.

Fig. S9. Same as Fig. S7 but for the NAT forcing.
 Advances in Atmospheric Sciences2022年3期
- Advances in Atmospheric Sciences的其它文章
- Seasonal Prediction of Summer Precipitation over East Africa Using NUIST-CFS1.0
- Another Record: Ocean Warming Continues through 2021 despite La Niña Conditions
- A New X-band Weather Radar System with Distributed Phased-Array Front-ends: Development and Preliminary Observation Results
- A New Index Developed for Fast Diagnosis of Meteorological Roles in Ground-Level Ozone Variations
- Hydro-climatic Characteristics of Yarlung Zangbo River Basin since the Last Glacial Maximum
- Diagnosing SST Error Growth during ENSO Developing Phase in the BCC_CSM1.1(m) Prediction System
