Optimization design containing dimension and buffer parameters of landing legs for reusable landing vehicle
Bo LEI, Ming ZHANG,*, Hnyu LIN, Hong NIE
a Key Laboratory of Fundamental Science for National Defense-Advanced Design Technology of Flight Vehicle, Nanjing University of Aeronautics and Astronautics, Nanjing 210016, China
b State Key Laboratory of Mechanics and Control of Mechanical Structure, Nanjing University of Aeronautics and Astronautics,Nanjing 210016, China
KEYWORDS Dynamics;Impact test;Landing system;Optimization design;Reusable landing vehicle
Abstract For the landing legs with single air chamber in the buffer structure of the reusable landing vehicle, the geometric topological models and the dynamic model associated with the hard points of the landing legs are established. The geometric constraint relationship in the design of the landing legs is also obtained. The whole vehicle dropping test is conducted, and the test results agree well with that of the simulation model,which validates the dynamic model.Based on the verified model,the effect of hard point positions on the performance of the landing system is analyzed.The multidisciplinary collaborative optimization algorithm and archive-based micro genetic algorithm (CO-AMGA) are used to optimize the design parameters that contain the hard points and the damper.Compared with artificial iteration,the maximum landing impact acceleration response of the vehicle and the buffer struct maximum force are reduced by 30.70%and 14.51%respectively,and the maximum length of retractable pillar decreases by 8.54%while the design margin increases by 69.11%. The proposed optimization method is efficient and can greatly facilitate the design of landing legs.
1. Introduction
The successful recovery of Space-X’s Falcon series of rockets has aroused attention from all countries in the world and triggered a climax in the development of reusable carrier vehicles.Using the Reusable Landing Vehicle(RLV)will greatly reduce the cost of spaceflight. The landing legs, which consists of the pillars and buffers, are widely used in the planetary landerand the RLV landing system. The landing legs should have the function of reducing the landing impact, ensuring the stability of the vehicle,and deploying and retracting.Besides,the volume and mass of the equipment are strictly restricted in space transportation. How to make it lighter and smaller is also a key problem worthy of attention.
Some approaches are explored to improve the performance of landing legs, one of which is the adoption of better performance dampers. For example, based on the aluminum honeycomb buffer with excellent performance and lightweight,Nohmiand Weiet al.established the model of the lunar lander and analyzed its landing performance. While honeycomb buffer’s unrecoverable deformation limits its use on RLV.For some small landing legs, magnetorheological (MR) damper based on semi-active control has tried to be used to adapt to different landing terrain. The paperand Maeda et al.analyzed the cushioning properties of the magnetorheological(MR) buffer in the landing legs. Besides, Wang et al.designed a MR damper applied to the lunar lander and studied its buffering performance.Nevertheless,for the transient characteristics of the landing impact, the actual engineering effect of MR dampers remains to be studied. For the heavy RLV need to be reused,it is restricted to adopt the alternative dampers to improve the performance of the legs. Zhangand Yueet al. earlier designed the prototype of the landing legs of the RLV based on a liquid shock absorber, which shows the usability of the oil buffer in RLV. For specific damper,optimizing the parameters of the landing legs is significantly meaningful. At present, most of the optimizations for landing legs are focused on the damper parameters. For instance,Yueand Leiet al. conducted a landing dynamic analysis for the RLV using the Oleo-Honeycomb damper.The landing performance of the RLV has been improved through the multi-disciplinary collaborative optimization for the damper parameters. Liu et al.carried out the multi-objective optimization on the lunar lander’s damper.In terms of the configuration optimization, Wu et al.optimized the configuration of the legs lander under two landing modes based on the response surface model.Han et al.established a comprehensive optimization design model for the leg lander and optimized its space truss mechanism. However, the above studies did not optimize the damper parameters and dimension parameters at the same time, and their performance indexes were only focused on the landing process and did not include the deploying-retracting process of the landing legs which also are seriously affected by dimension parameters. As mentioned above, collaborative optimization can be used for landing leg optimization under multiple-conditions, to comprehensively optimizing, the retraction topology model of the legs should be coupled to the landing dynamic model for the collaborative optimization.
The design parameters of the landing legs are often adjusted according to experience and iterationduring the design period. Due to random landing conditions and multiple constraints, the iterative process often consumes a lot of manpower and time and it’s difficult to achieve the desired results. As with nearly no research for global optimization of landing legs, the objective of this study is to present a highly efficient overall optimization method to improve the landing legs’ comprehensive performance. Specifically including (A)obtaining the landing legs’ topological structure model of the deploying-retracting process; (B) establishment and verification of the landing dynamic model; (C) extracting key parameters and constraints; (D) collaborative optimization of the coupled models. The structure of the paper is as follows: after the introduction, the geometric topological model and the dynamic model are given. Then, based on the dynamic model verified by experiments, the optimization is implemented.Later,the results and discussions are given.Finally,important conclusions are listed.
2. Geometric model of the retractable landing legs
The overall scheme of the RLV landing device is shown in Fig. 1, which includes four landing legs symmetrically arranged.Each leg contains a retractable pillar with the absorber, an auxiliary shell, and a footpad. Among them, the retractable pillar is composed of a three-stage sleeve. During the launching,the sleeve is in a retracted state.The landing legs are wrapped and protected by an auxiliary shell closely attached to the surface of the vehicle body by a locking device.While ready for landing, the retractable pillars are elongated.The entire mechanism is unfolded around the auxiliary pillar hinge point, and the sleeves are locked by built-in locks when in place. The landing energy is absorbed by the dampers.
2.1. Two-dimensional topology map of the legs
A coordinate system called O-XYZ is given,which is shown in Fig. 2. O at the center of the carrier’s bottom. The positive direction of the OY axis is upward along the axial direction of the carrier body. The OX axis is located on the plane of symmetry of the vehicle whose positive direction points to the left.
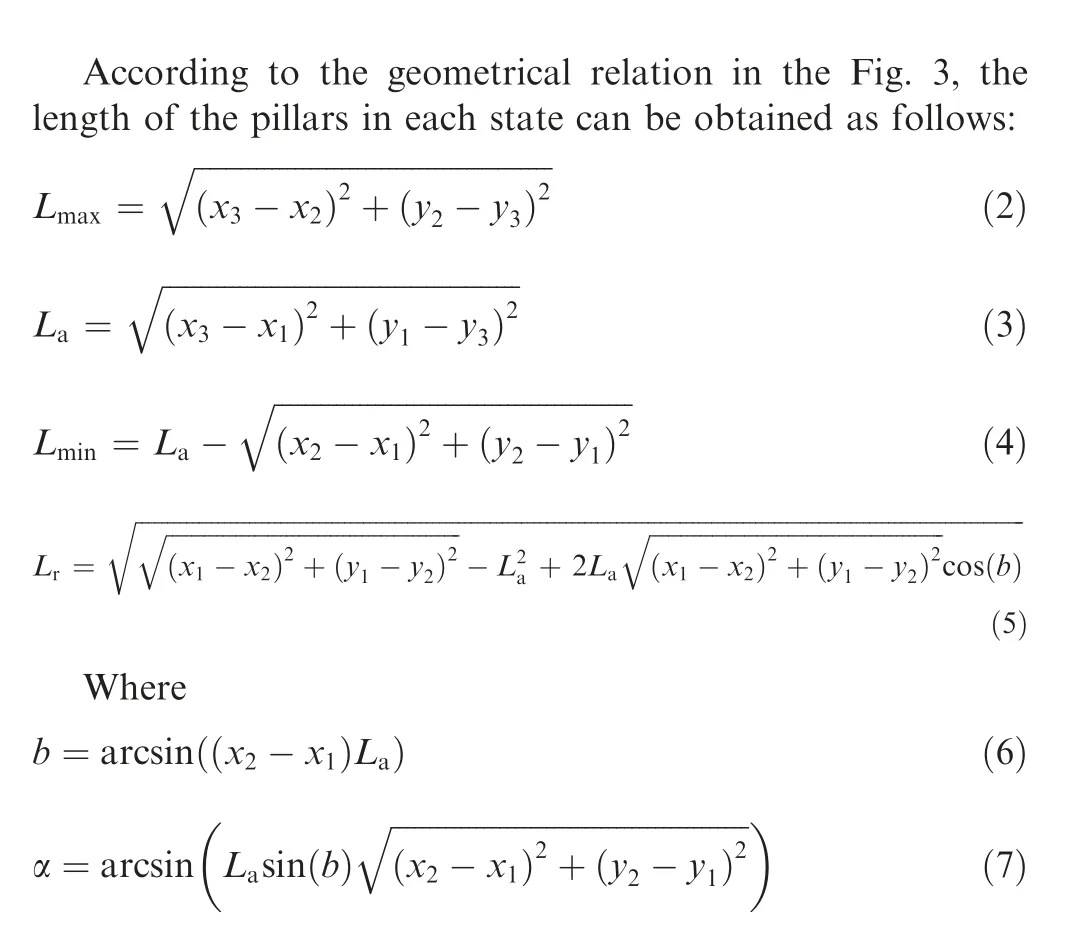
The landing legs are symmetrically distributed in the threedimensional space.Projecting the landing legs in the XY plane.The deploying and retracting two-dimensional topology map of the left landing leg is shown in Fig. 3, which shows three topological states of the legs in the release process before landing: Triangle ABE (State 1: the state of landing leg locked on the surface of the RLV), Line ABD (State 2: the state of the retractable pillar fully retracting) and Triangle ABC (State 3:the state of landing leg fully expanding). The meanings of related geometric elements are listed in Table 1.
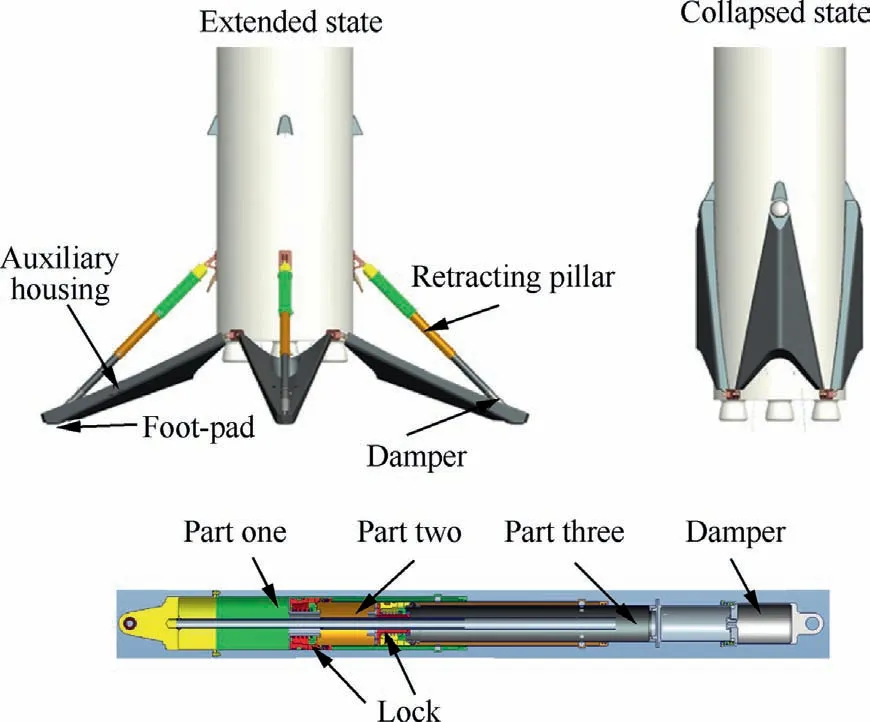
Fig. 1 Overall scheme of RLV landing device.
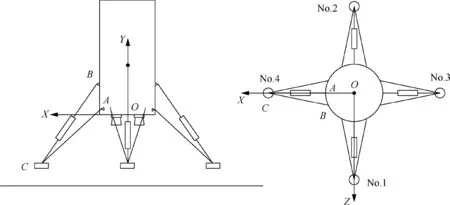
Fig. 2 Coordinate system O-XYZ.
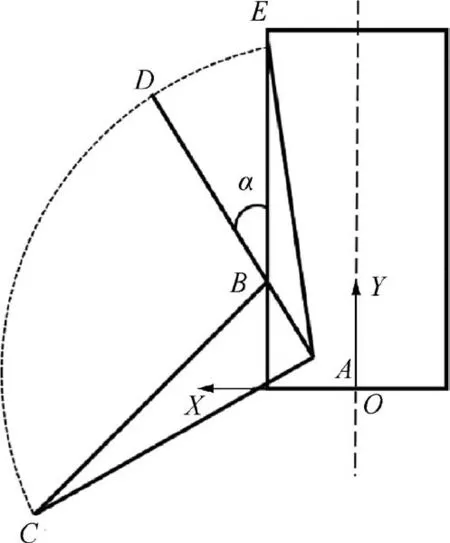
Fig. 3 Geometric topology of landing leg.
In Table 1, L, Lrepresent the maximum (State 3),minimum length (State 2) of a retractable pillar, Lis the length of the retractable pillar when the landing leg is fully retracted (State 1).
Within the coordinate system O-XYZ, the coordinates of point A, point B, and point C can be given as (x, y, z),(x, y,0), and (x, y,0). The relationship of yand zcan be expressed as:

where R is the radius of the vehicle body, which is 1225 mm.
2.2. Simplified model of the retractable pillar
Each retractable pillar consists of a three-stage retractable sleeve and a damper. The second and third-stage sleeves can be moved axially. The lock mechanism is provided on the sleeves to realize the lock-unlock function. To facilitate the analysis of the length of the retractable pillar,the pillar is simplified as follows:

Table 1 Meanings of geometric elements in Fig. 3.
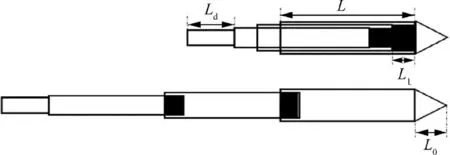
Fig. 4 Simplified model of retractable pillar.

Table 2 Values of L1, L0, and Ld.
(A) Each sleeve has the equal length, which is L;
(B) Each lock is of the equal length, which is L;
(C) The upper of the first-stage sleeve is provided with a cap,and its length is L.
The simplified model of the retractable pillar is shown in Fig. 4, where Lis the length of the damper. The values of L, L, and Lcan be obtained through the previous iterative design, which are illustrated in Table 2.
The minimum and maximum length of the structure can be written as:
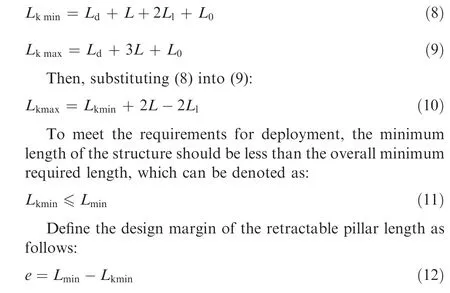
The larger the value of e, the more designable space inside the sleeve.
3. Dynamic equation for vehicle
There are 18 Degrees of Freedom (DOFs) in the dynamic model, which include six DOFs of the main body and three DOFs of each footpad. To facilitate the analysis, the model is simplified reasonably. The assumptions are as follows:
(A) According to the classical assumption of landing gear dynamics analysis theory, the vehicle is divided into one upper mass and four lower mass. The upper mass consists of the main body, three-stage mechanisms, the envelope of the absorbers,and the half mass of the auxiliary housings.The lower mass in each landing leg consists of the piston of the absorber, the half mass of the auxiliary housing, and the footpad.
(B) The upper mass is concentrated on the center of the main body mass, while the lower mass is concentrated on the point that the footpad connects with the pillar.The rotation motions of the lower mass are ignored.
(C) All parts of the vehicle are treated as rigid bodies.
The landing dynamics model can be derivedas follows.
3.1. Definitions of the coordinate systems
Before establishing the dynamic equation, the inertial coordinate system,the ground coordinate system,and the body coordinate system are defined.All the coordinate systems are righthanded Cartesian coordinate system.
(A) The inertial coordinate system O-XYZ: The positive direction of the OZaxis is vertically upward; the positive direction of the OXaxis is horizontal to the right and the OYaxis’ positive direction is determined by the right-hand spiral. The ground coordinate system coincides with the inertial coordinate system.
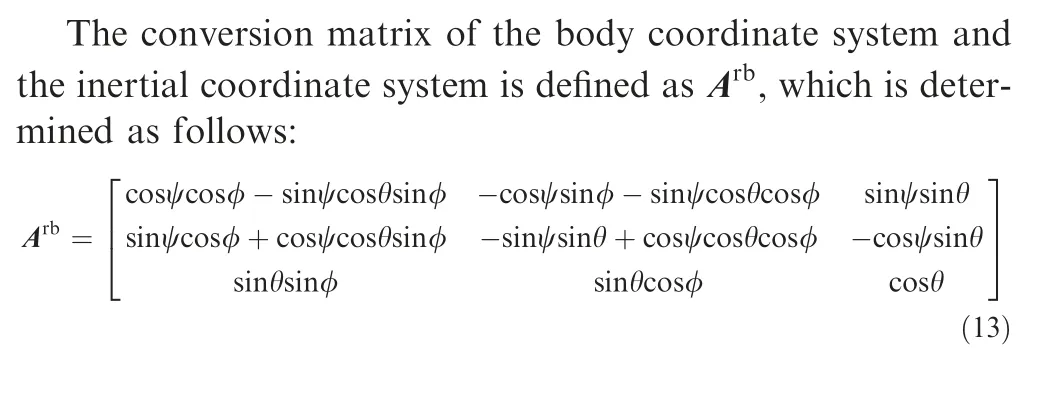
(B) The body coordinate system O-XYZ: This coordinate is attached to the vehicle. Point Ocoincides with the center of gravity of the vehicle, and the positive direction of the OZaxis is upward along the axial direction of the carrier body. The OXaxis is in the symmetry plane of the body and perpendicular to the OZ. The rotation of the carrier can be described by Euler angle coordinates [ψ;θ;φ].
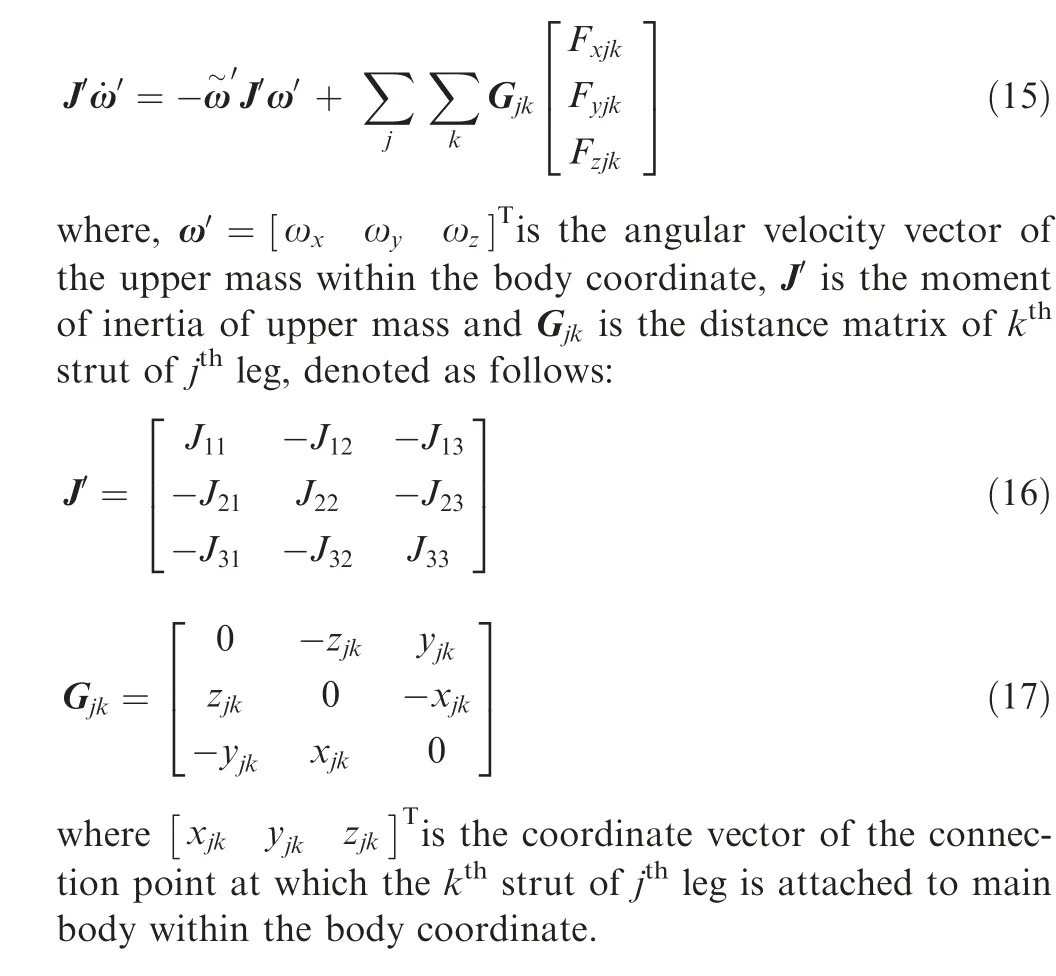
3.2. Dynamic equations for the upper mass
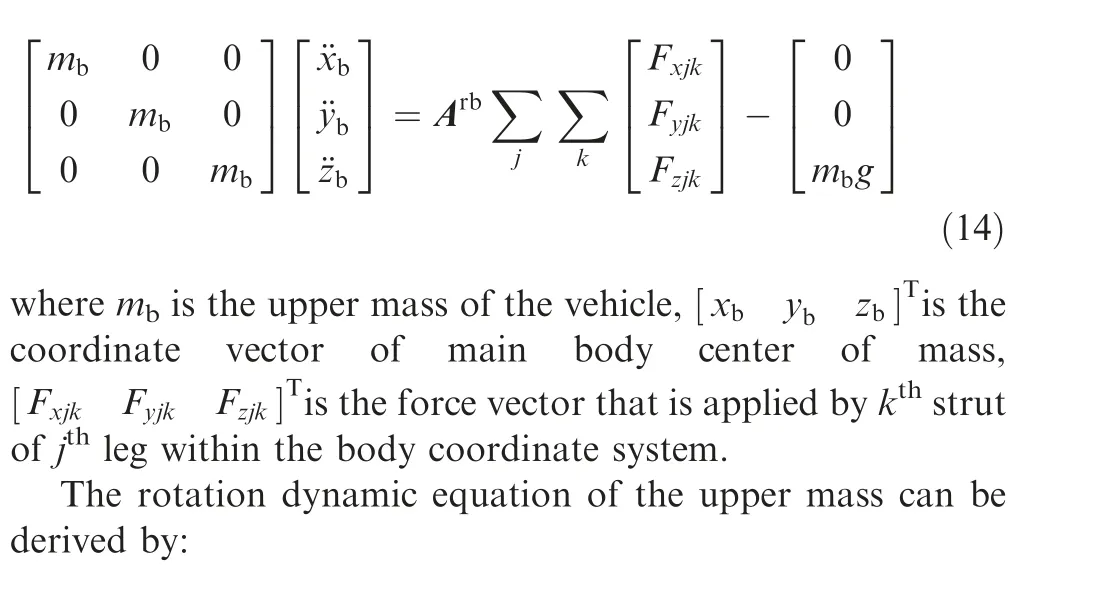
Under the inertial coordinate system O-XYZ, the upper mass’s translational movements can be considered as follows:
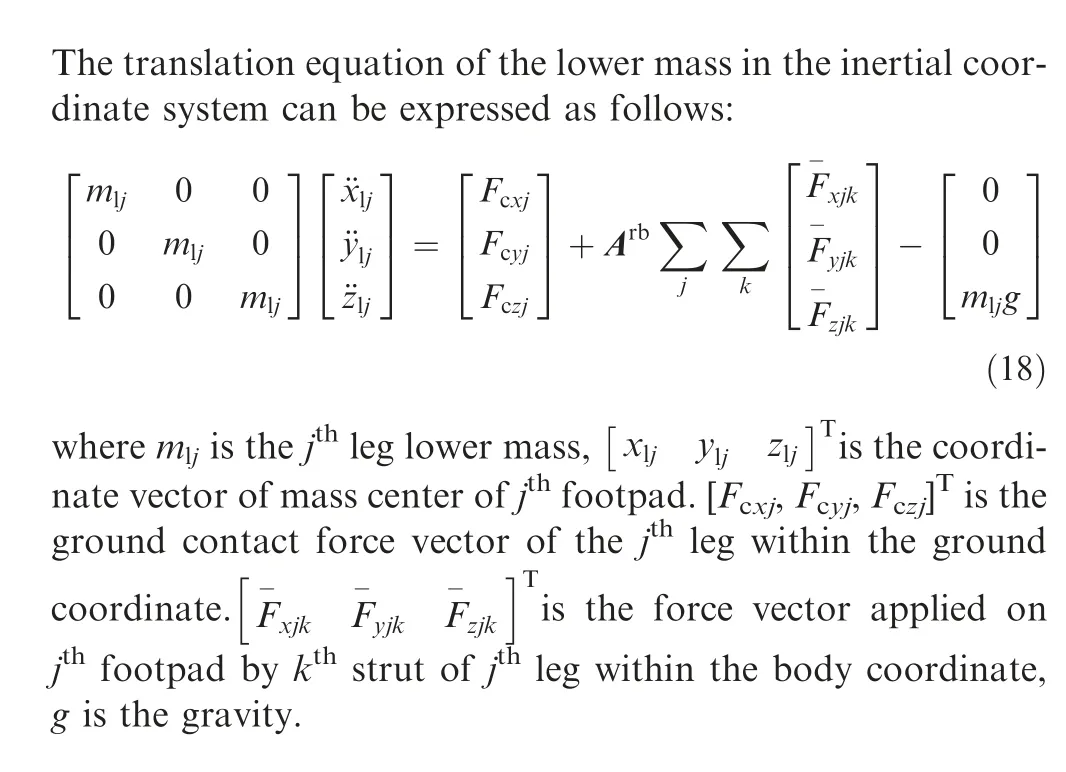
3.3. Dynamic equations for the lower mass
3.4. Dynamic equations for the buffer pillar
The damper selected is the oleo-pneumatic shocker with a single air cavity, whose structure is shown in Fig. 5. When the external force pushing the absorber, the oil in the chamber is squeezed into the gas cavity.The oil flows through one or more small holes,which dissipates energy in the form of heat energy.Meanwhile,part of the energy is stored by the compressed air.The buffer force is composed of air spring force F, oil damping force F,friction force F,and structural support force F,which can be denoted:
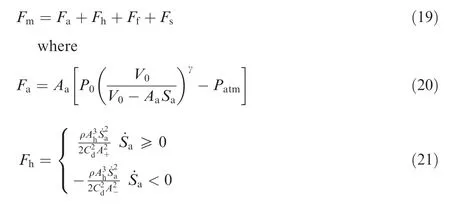
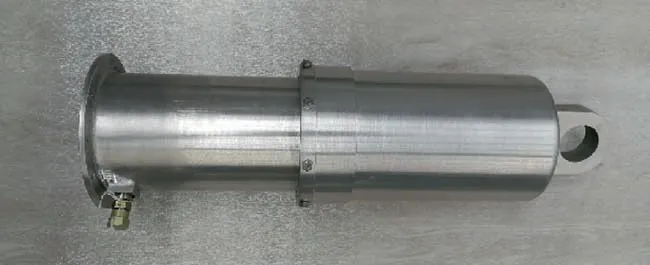
Fig. 5 Oleo-pneumatic shocker.
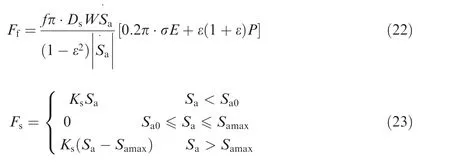
where Ais the area of compressed air,Pis the initial air pressure, Vis the initial air chamber volume, Pis the atmospheric pressure, and γ is the gas change index, Sis the stroke of the piston. ρ is the density of the oil, Ais the compressed oil area,Ais the orifice of the compression stroke,Ais the orifice of the extension stroke, Cis the coefficient of contraction, f is the friction coefficient between envelope and sealing ring, Dis the outer diameter of sealing ring, W is the sectional diameter of sealing ring, E is the elastic modulus of sealing ring, ε is the poisson ratio and σ is the precompression of sealing ring, P is the pressure of oil chamber,Sis the initial stroke of the piston, Sis the maximum stroke of the piston, and Kis the contact stiffness between the piston and the envelope.
The relationship between the axial force of buffer struct Fand its three components within the body coordinate can be given by:
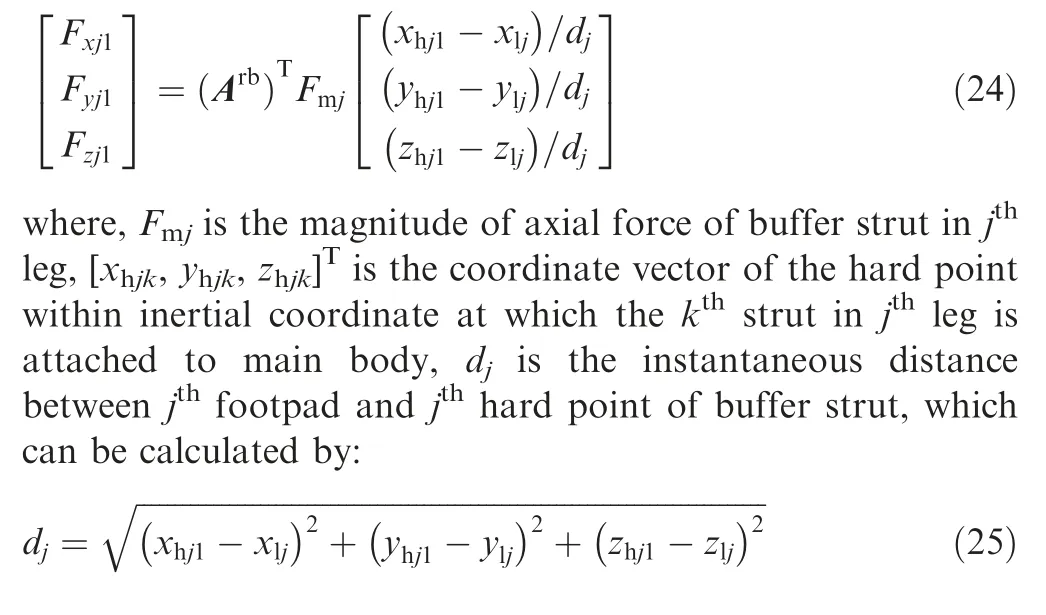
3.5. Contact force model between footpad and ground
The impact function model and the coulomb friction model are used to monitor and solve the interaction force between the footpad and the ground, respectively. The impact function model can be described by a spring-damping model, and its impact force function is expressed as:

where,q is the penetration depth,kis the spring stiffness,r is the shape index, STEP is the step function, qis the maximum allowable penetration depth, and cis the maximumdamping value applied when the maximum penetration depth is reached. The relevant parameters are listed in Table 3.

Table 3 Parameters of contact force.
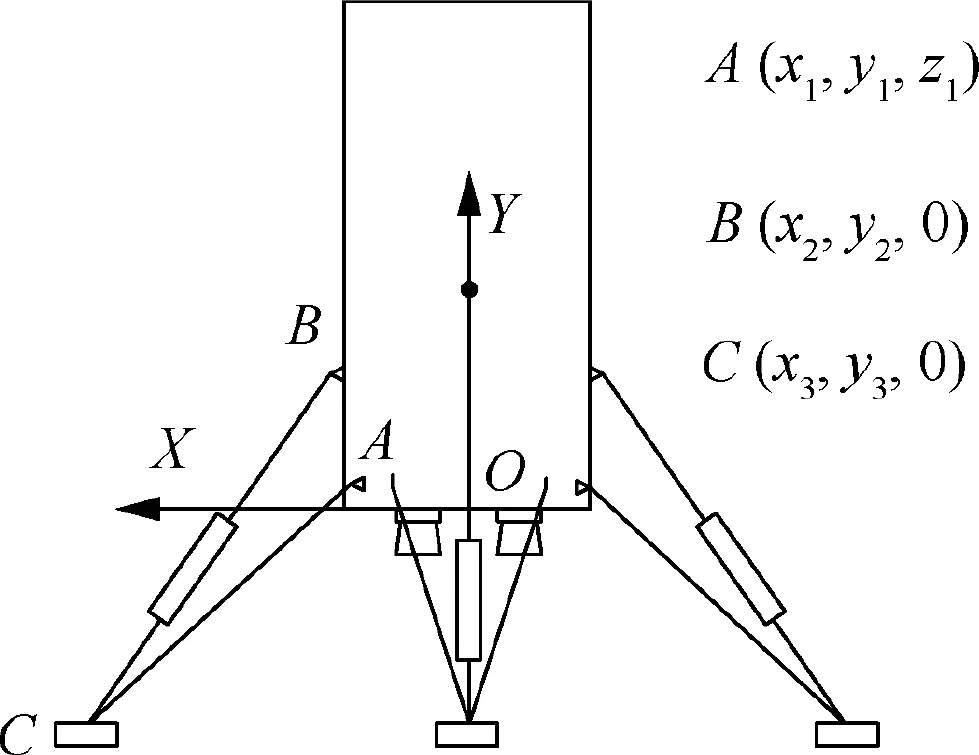
Fig. 7 Meaning of each parameter in Table 7.
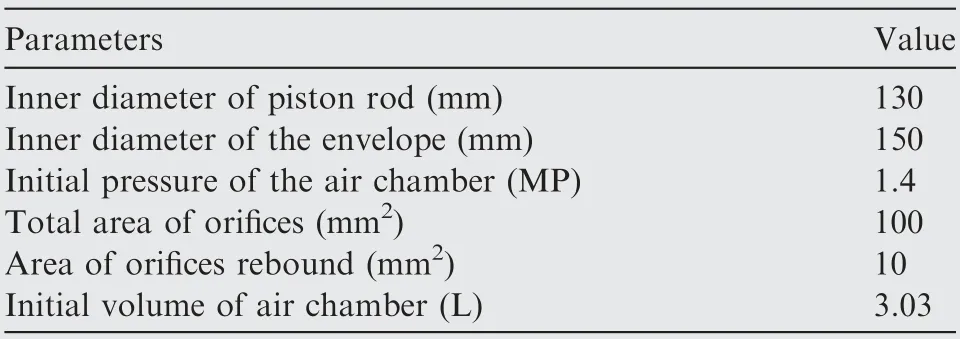
Table 4 Parameters of prototype of vehicle.
The friction force in the contact force is the product of positive pressure and friction coefficient, which can be written as:

In the Coulomb friction model, according to the relative sliding speed of two contacting objects, the friction is converted between dynamic friction and static friction. The formula of the nonlinear friction coefficient model can be derived by:

Table 5 Height of each footpad from ground.
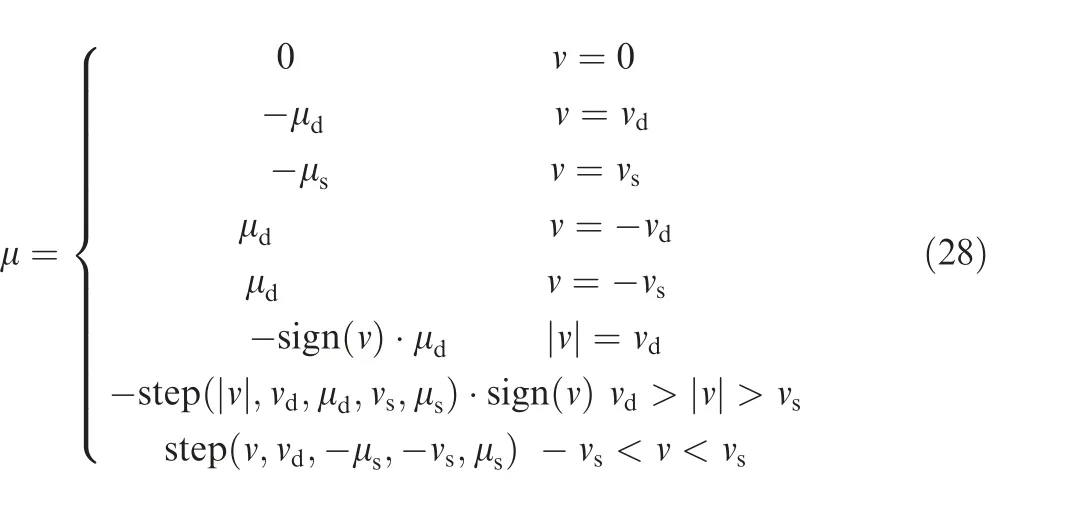
where, μ is the friction coefficient, μis the maximum static friction coefficient, μis the dynamic friction coefficient, vis the static friction transition speed, and vis the dynamic friction transition speed.
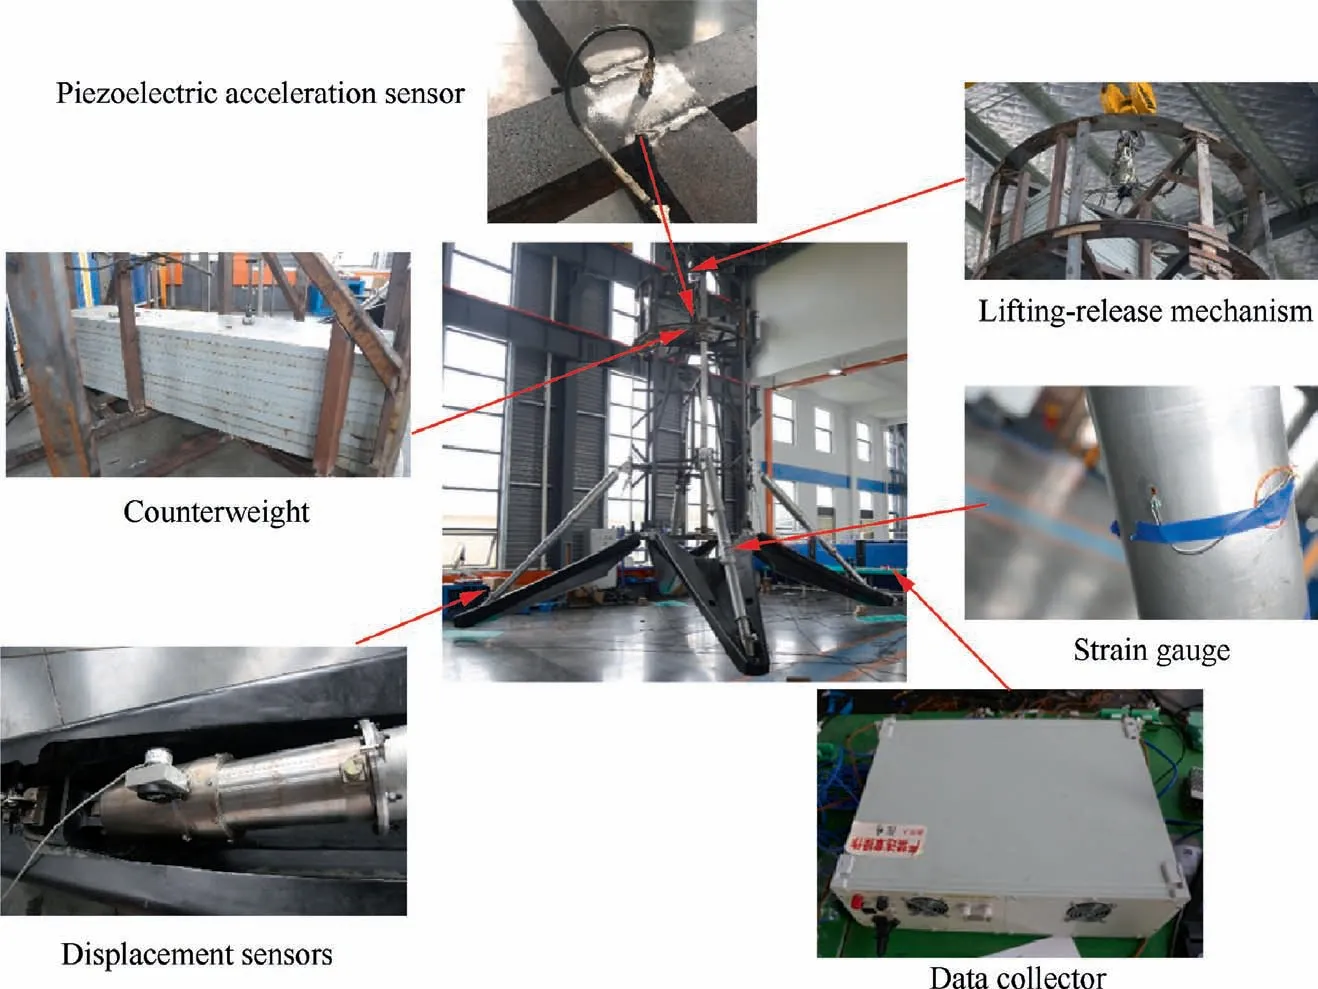
Fig. 6 Test equipment installation location.
3.6. Stroke and velocity for the buffer pillar
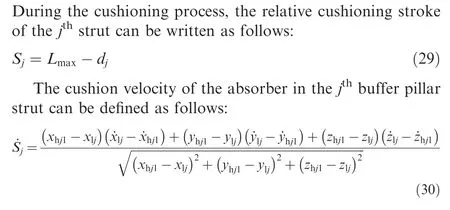
3.7. Penetration depth and penetration velocity for the footpad

Based on the above,through differentiating δ,the penetration velocity can be given.
Finally, the dynamic model can be established in the ADAMS software.
4. Experimental setup
To verify the validity of the landing dynamic model. The prototype of the vehicle with a landing buffer system is designed and built, and a soft-landing drop test is conducted. Table 4 presents the values of the landing leg parameters.The test system includes the principle prototype model with the counterweight, measurement system, data acquisition system, and lifting-release system. The prototype is elevated to a designed height by the lifting-release system before the test. At the beginning of the test, the lock hook of the lifting-release is opened, which causes the prototype to hit the ground. The installation location of related systems is shown in Fig. 6.
The measurement system consists of four (Fig. 7) WPS-Sdisplacement sensors, a 1A106-piezoelectric accelerometer,and some strain gauges. Measuring the stroke of the buffer with the displacement sensor. The accelerometer is installed on the upper part of the vehicle to measure the acceleration response. Considering that the buffer pillar load is not easy to measure directly, this paper adopts the strain gauges to obtain the strain to calculate the load. The data acquisition equipment used is the dynamic signal acquisition and analysis system DH8302 produced by Dong Hua Company.
A relatively safe working condition that all four legs land at the same time is selected for conducting the test, which causes the buffer pillar to bear less load.Because of the larger prototype and uneven ground,the selected landing conditions is difficult to adjust in the test. Therefore, the height of each footpad of the vehicle above the ground is measured to determine its working condition. Table 5 shows the height of each footpad from the ground.
The test results show that the model is reliable. A detailed comparison of experimental results and simulation will be given in Section 6.
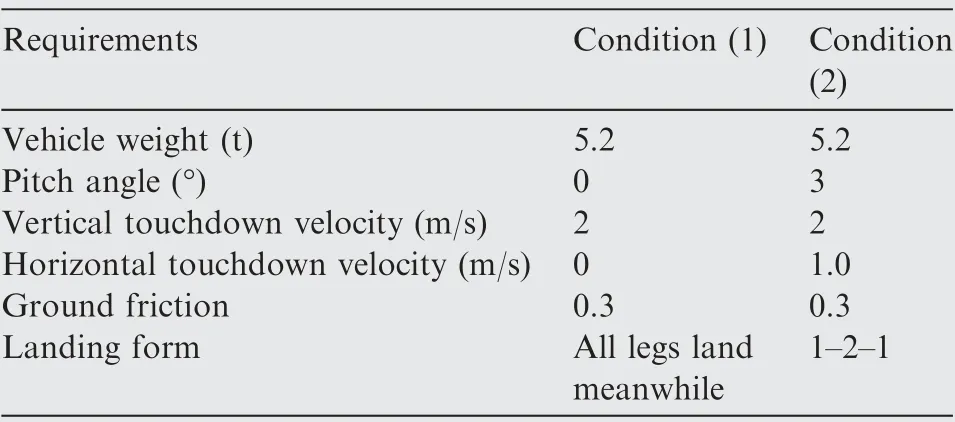
Table 6 Critical landing conditions with the corresponding values of factors.
5. The overall optimization of the landing legs
5.1. The performance indexes of landing buffer system
Based on the design requirements,referring to the relevant performance index of the lunar lander,the overall performance of the landing buffer system is given as follows:
(A) The dead point angle α of the retractable support should meet the design requirements, it should be no greater than 18°;
(B) To increase the stability of the pillar, the full extension length Lof the retractable pillar should be as short as possible;
(C) The maximum value of the vehicle’s landing impact acceleration response(A)should not exceed the limit of 50 m/s, the smaller the better;
(D) The maximum damper stroke Sshould not exceed its design parameter which is 165 mm, the smaller the value, the better.
(E) The bottom of the carrier should not hit the ground,and the minimum distance between them (C) should be greater than 500 mm.
Based on the performance indexes and the given design requirements, a large number of simulations of the landing dynamic under the different combined conditions are carried out. Two critical landing conditions are selected out, which are defined as follows:
(A) Condition (1): In this condition, the landing impact acceleration will reach the maximum value.
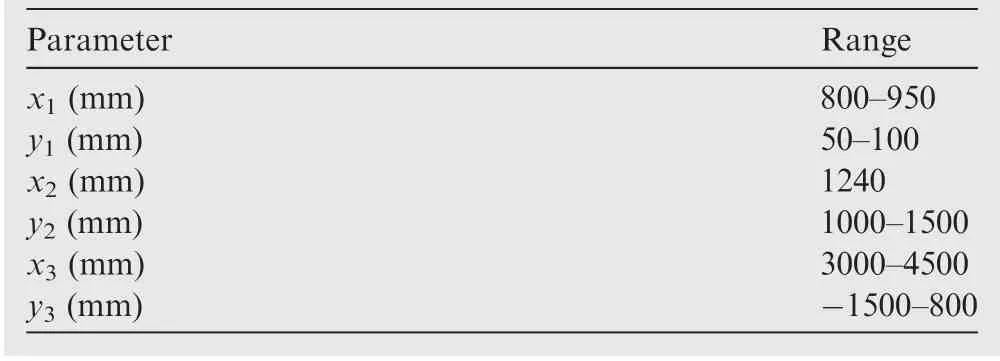
Table 7 Structural parameters range of the landing legs.
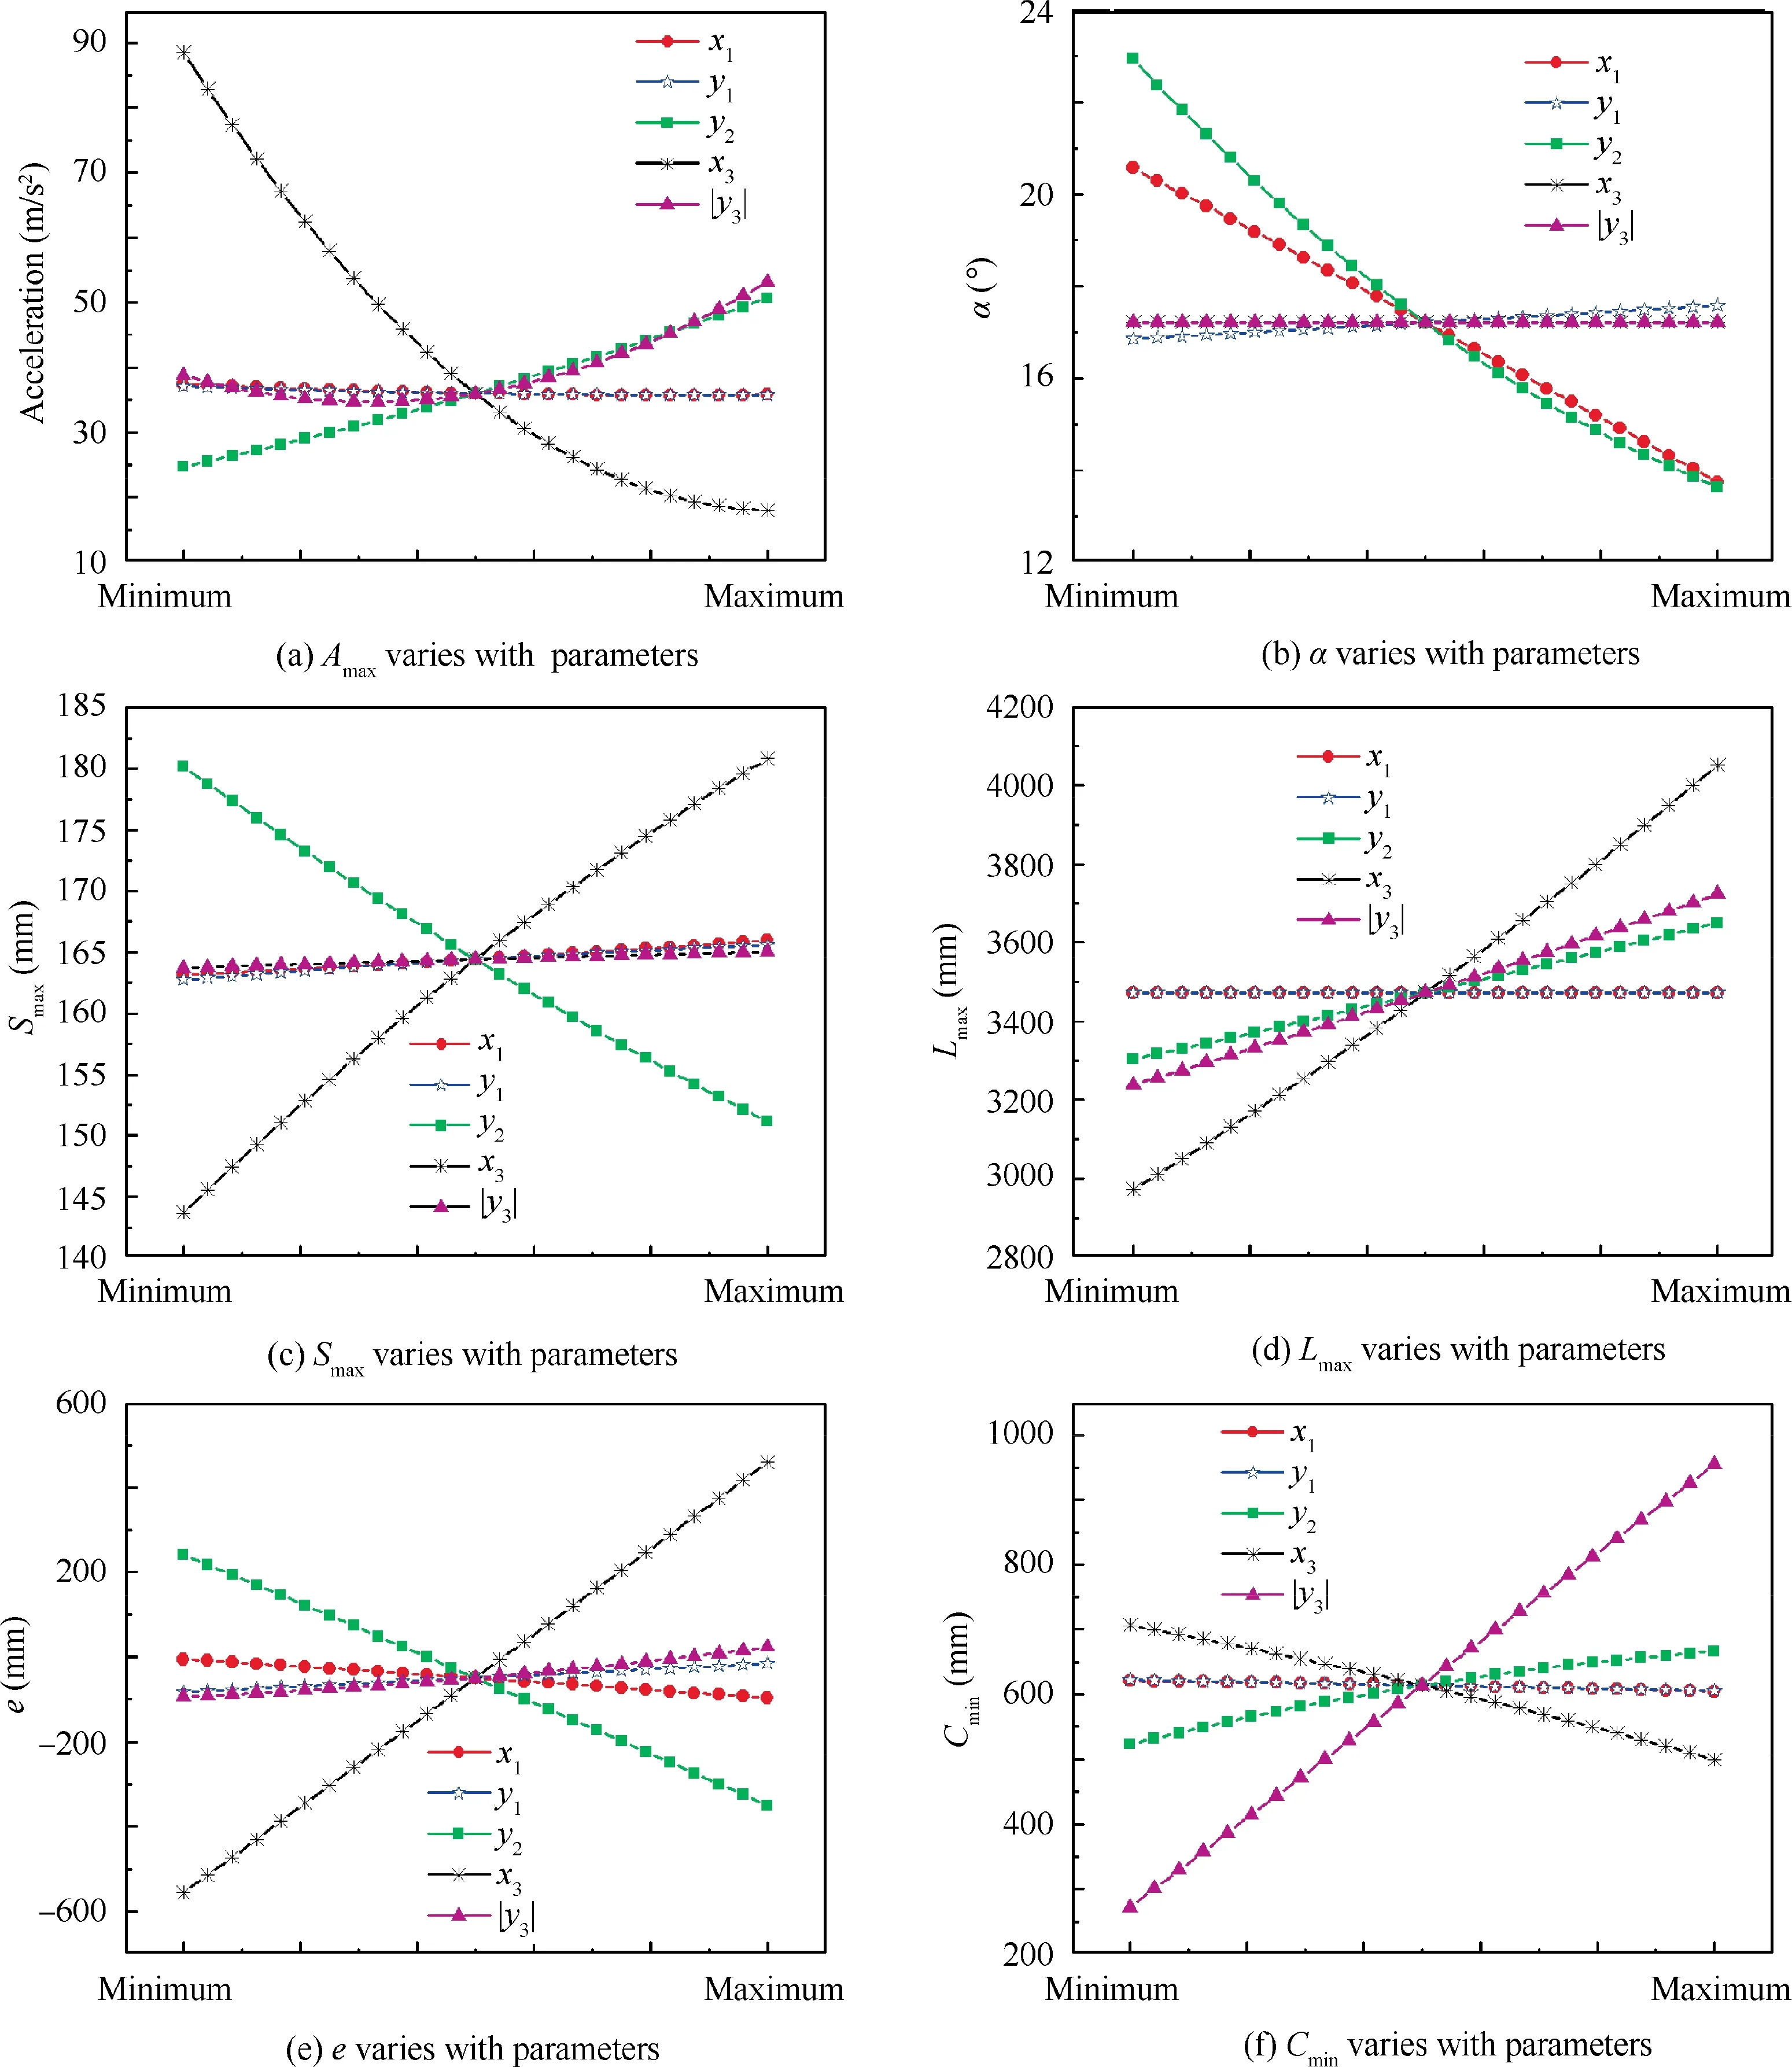
Fig. 8 Effect of design parameters on responses.
(B) Condition (2): In this condition, the minimum distance Cbetween the ground and the vehicle will occur.Besides, the maximum stroke of the damper will occur under this condition.
The two critical landing conditions are listed in Table 6.
5.2. Identification of key parameters
Table 7 shows the design parameters and the corresponding ranges of the values, which are selected by experience and the load-bearing position of the vehicle. Fig. 7 shows the meaning of each parameter in the table.The Design of Experiment(DOE)is used to analyze the influence of the parameters on the response parameters. The response parameters consist of A, α, S, L, C, e .
Fig. 8 shows that the influence of factors in different levels on the responses. According to the figures. It is can be concluded that:

Table 8 Design variables of buffer parameters.
(A) The value of xmainly affects the dead angle,it has little effect on other responses.
(B) If yincreases, the dead point angle and the structural length design margin will increase while the maximum acceleration will slightly decrease. The minimum distance and the maximum length of the buffer pillar will nearly not change. The maximum stroke slightly increases as yincreases.
(C) If yincreases, the maximum length of the buffer pillar,the minimum distance, and the maximum stroke will increase. However, the dead point angle, the structural design margin, and the maximum stroke will decrease with yincreasing.
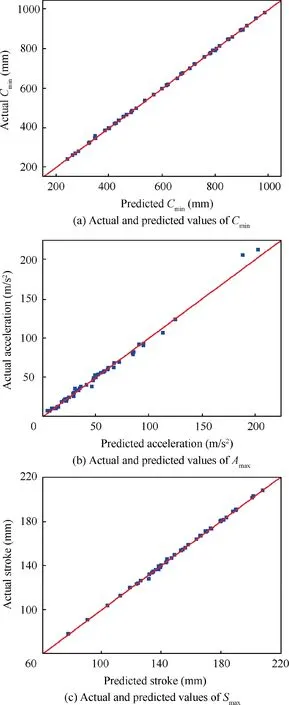
Fig. 9 Fitting results of each response.
(D) The dead point angle does not change along with x. If xincreases,the maximum length of the buffer pillar,the structural length design margin, the minimum height,and the maximum stroke will increase, while the minimum distance, and the maximum acceleration will decrease.
(E) If|y|increases,the maximum length of the buffer pillar,the structural design margin,the minimum distance,and the maximum stroke will increase.The dead point angle does not change. The maximum acceleration decreases first and then increases with |y| increasing. However,the dead point angle is not affected by changes in |y|.
From the above analysis, the coordinates of each node influence the responses, and the degree of influence and trend are different. All the parameters are selected as the optimization design variables. On the buffer parameters, to simplify the problem, only the initial air pressure and the orifice area of the damper are selected as the design variables.Their ranges are shown in Table 8.
5.3. The collaborative optimization method
Collaborative optimization is a kind of multi-branch of learning algorithm of designing optimization. It decomposes the complicated optimization problem into a system-level and some discipline levels.Each discipline level is subject to different constraints, the interdisciplinary compatibility constraints are used to ensure the consistency of shared variables and objectives at the system level.
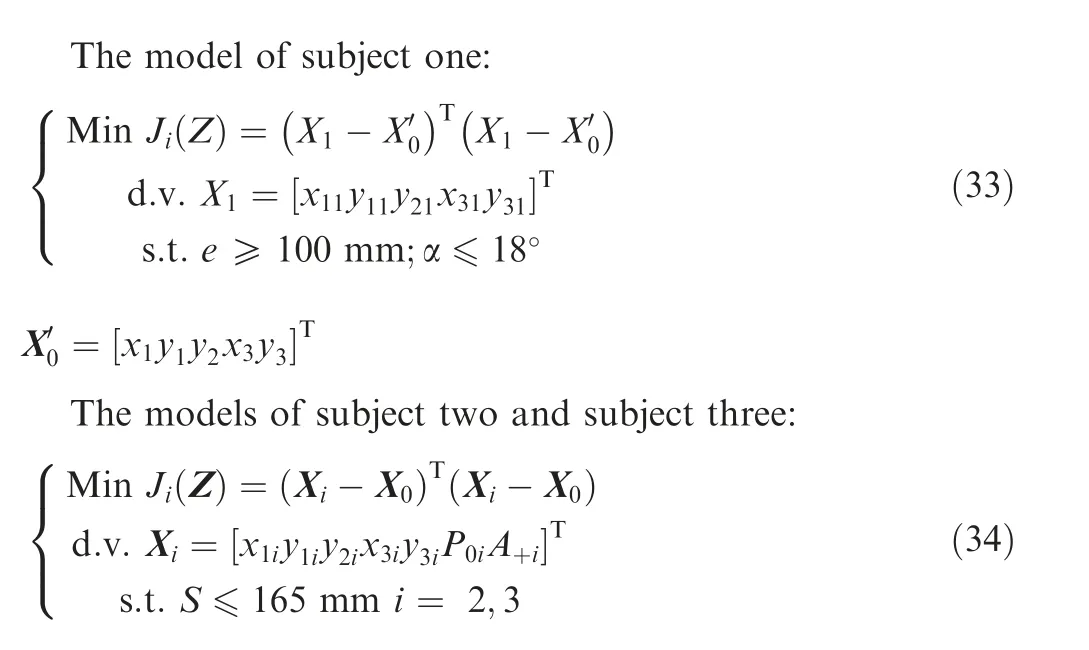
The optimization of the landing leg system is a typical multi-disciplinary problem. Here, the geometric topological model of the retractable pillar is coupled with the dynamic model under multi-working conditions to conduct an optimization, which includes the two disciplines of kinematics and dynamics. Among them, the kinematics optimization focuses on the geometric envelope of the pillar: Minimizing Lis selected as the optimization goal.The constraint conditions are that the dead point angle α and e meet the requirements. Dynamics optimization focuses on the impact process of the vehicle landing, whose optimization objectives are to minimize the vehicle’s maximum landing acceleration (A)and maximize the vehicle’s minimum clearance between the vehicle and ground(C).Choosing a constraint that the Sdoes not exceed the design value. Regarding kinematics optimization as a subject (subject one). While the dynamics optimization is divided into two subjects (subject two and subject three), which correspond to Condition (1) and Condition (2) respectively.
Based on the above analysis, the optimized mathematical model can be obtained as:

Table 9 RMSE and R2 of RBF model.
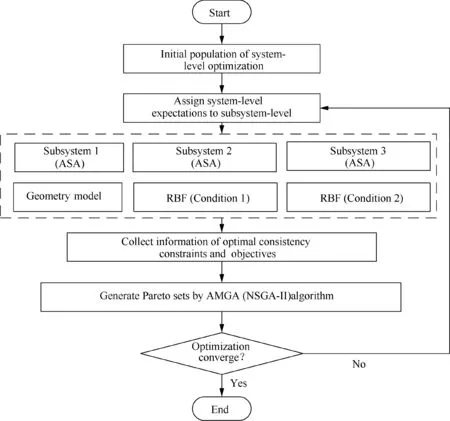
Fig. 10 Process of optimization.
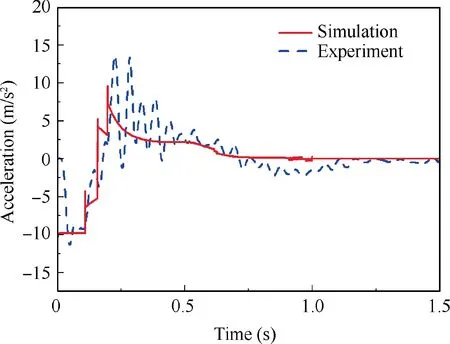
Fig. 11 Impact acceleration in simulation and test.
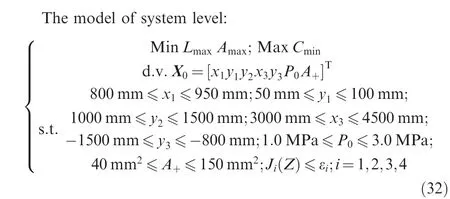
where, Xis the vector composed of system-level design variables, J(Z ) is the system-level consistency constraint, εis the relaxation factor.
5.4. The approximate model
Adopting the actual dynamic models for optimization is timeconsuming,so the Radial Basis Function(RBF)instead of the actual model is used to optimize the design values for improving efficiency.Its main idea is to adopt the experimental design method to select appropriate sample points in the sample space.Then solving the corresponding results through the real physical model.Finally establishing the approximate model by the data. The calculation result of the approximate model is almost the same as the real model, but it greatly reduces the amount of calculation and improves the optimization efficiency. In this paper, the optimal Latin hypercube designis used to get 2000 sample points for each model. Besides, the RBF model is fitted based on the sample points and the results gained by the actual model.
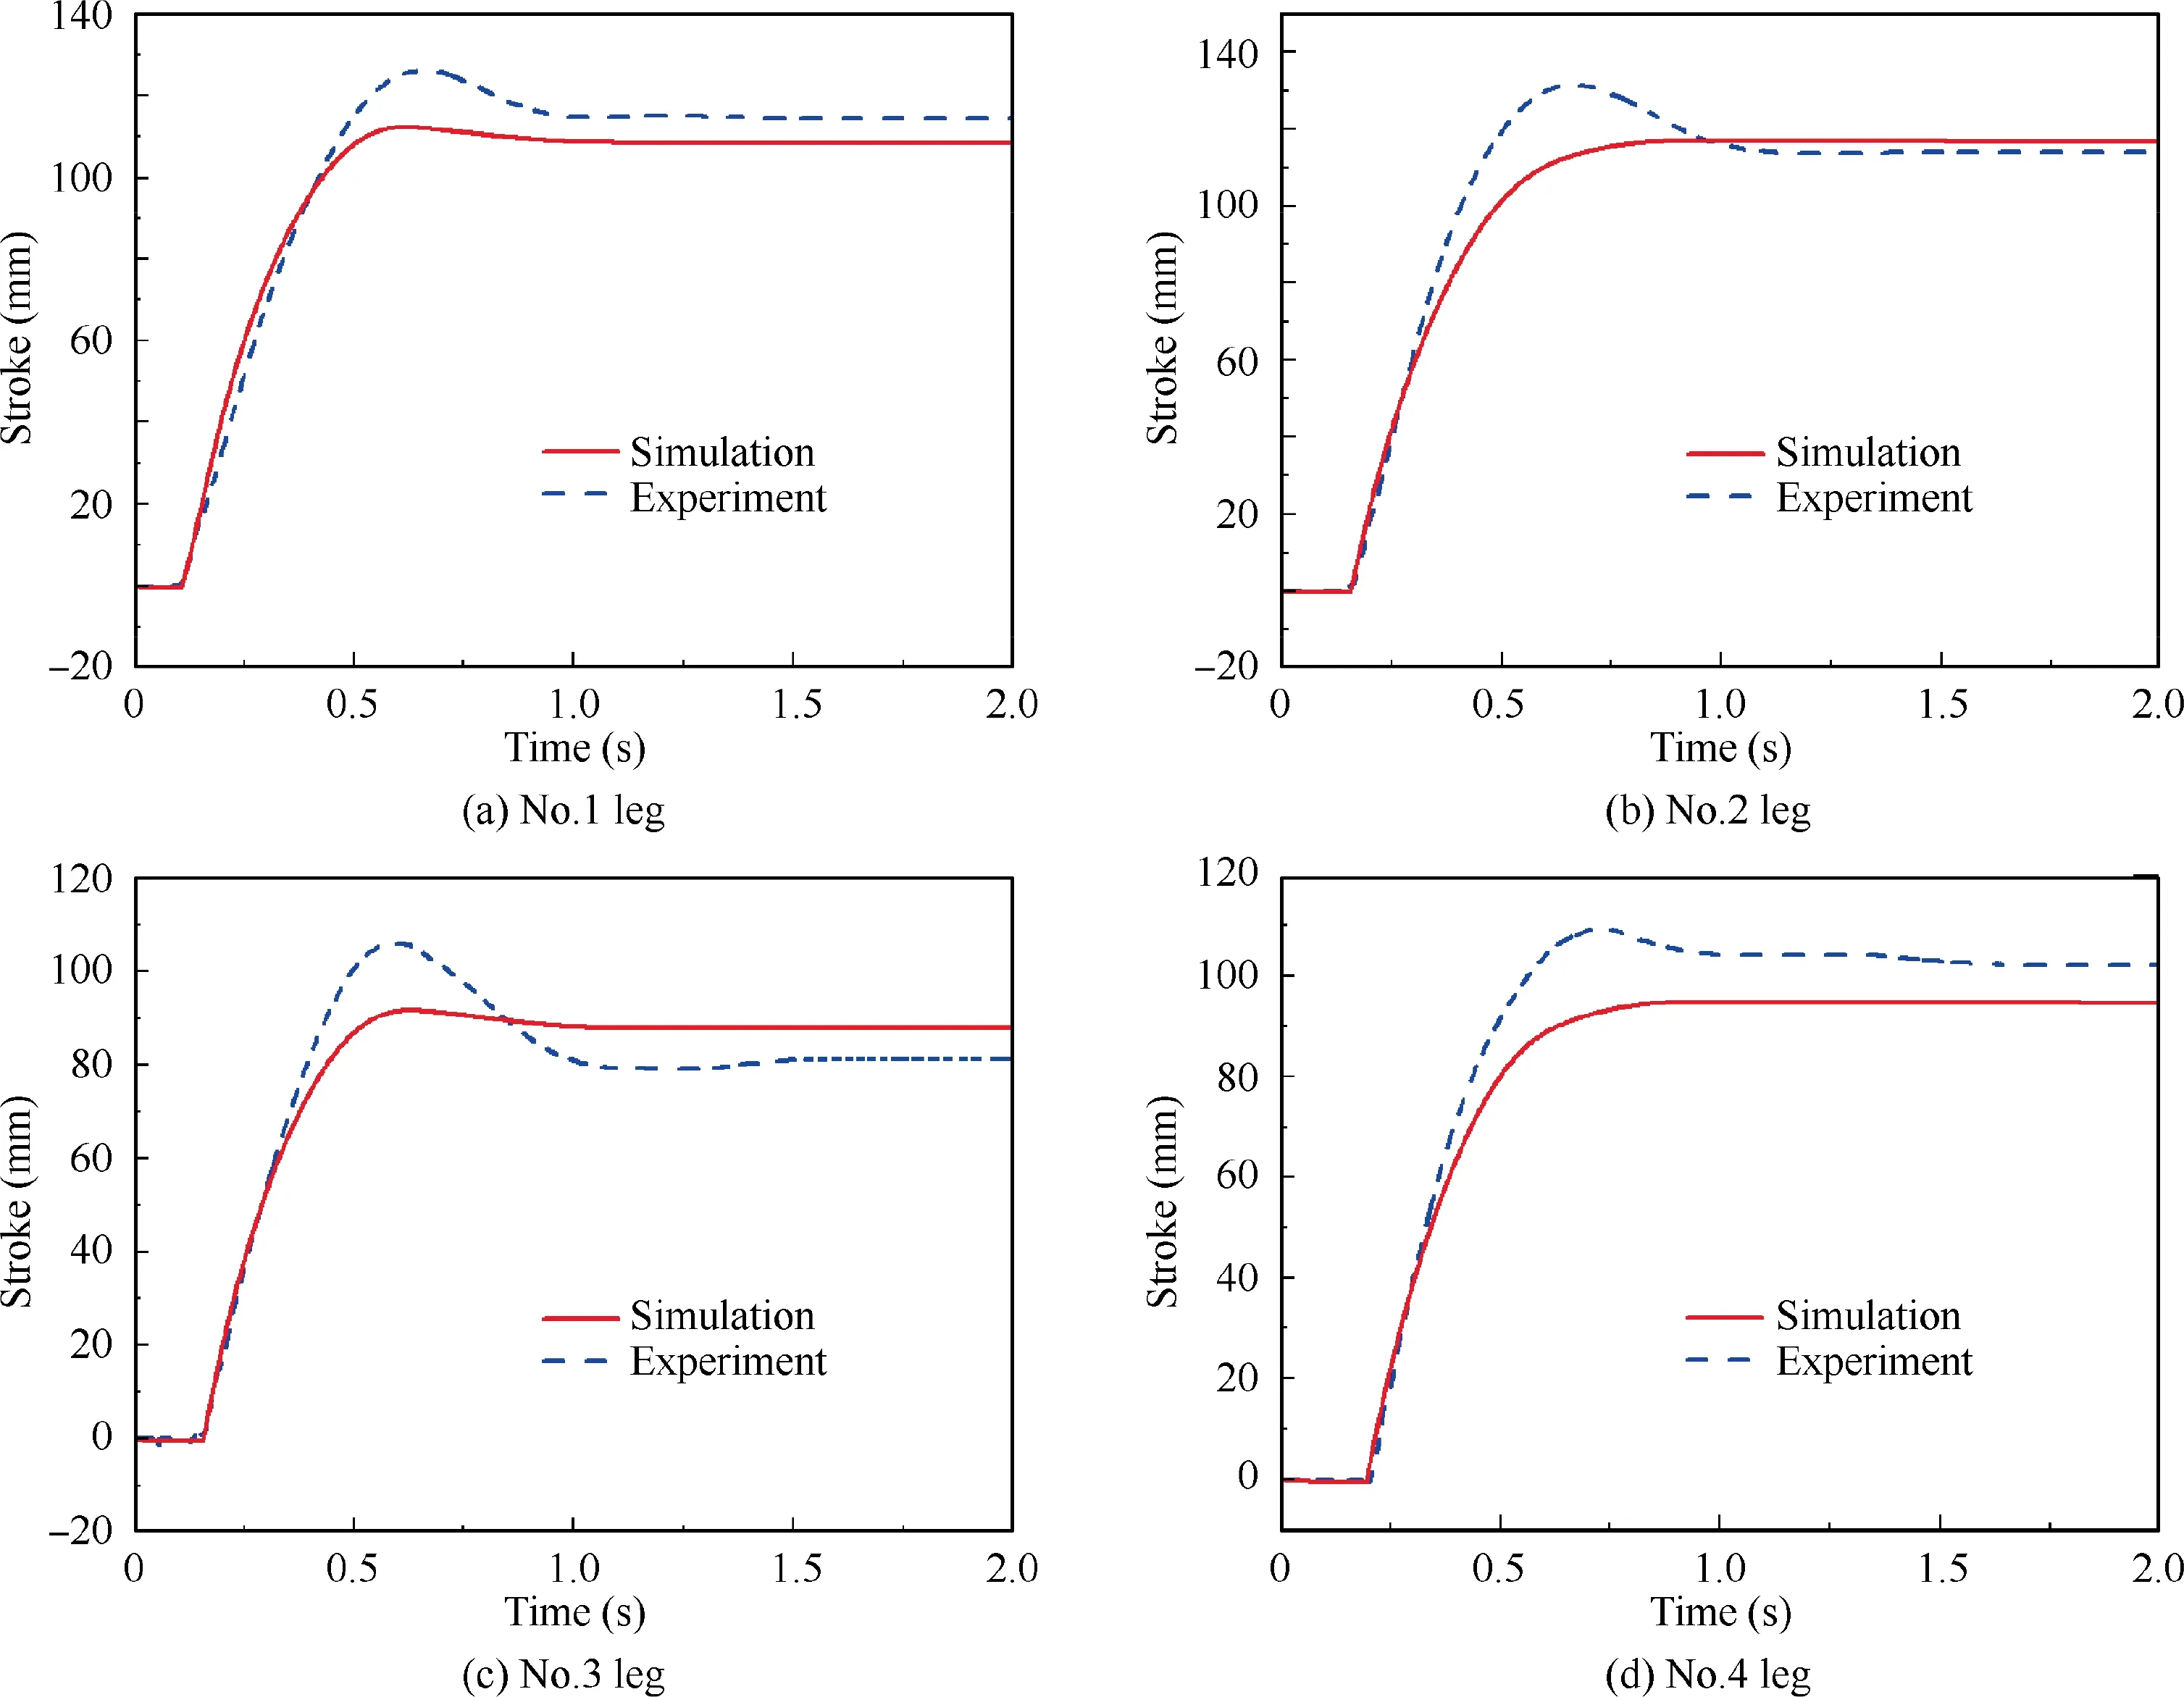
Fig. 12 Comparison of damper strokes.

Table 10 Comparison of peaks of damper strokes.
The Root Mean Square Error (RMSE) and coefficient of determination (R) are adopted to judge the accuracy of the agent model, whose expressions are:
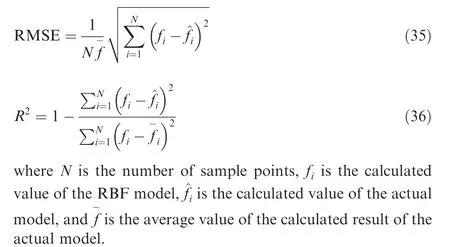
Choosing randomly 50 sets of test points for each model to perform accuracy testing. The actual and predicted values of the three responses are shown in Fig. 9. The data points in the figure agree well with the 45-degree diagonal line, which indicates that the three response functions constructed have excellent predictions for each response.Besides,Table 9 shows the RMSE and Rof the RBF models, it is seen that the approximate models have good accuracy.
5.5. The optimization algorithm
The Archive-based Micro Genetic Algorithm (AMGA)applied to the system-level is an improved algorithm of genetic algorithm. Besides the evolution, an external space is used to store the non-dominated individuals in the search space and the corresponding function values. AMGA is suitable for solving the highly nonlinear and highly constrained optimization problems in this paper.
Also, the Non-dominated Sorting Genetic Algorithm(NSGA-II) is applied in system-level. This algorithm was also developed on the basis of the genetic algorithm. It has the advantages of fast solving speed and high accuracy. Comparing their results to show which one is more suitable in landing legs’ overall optimization.
The Adaptive Simulated Annealing (ASA) algorithm is selected to solve the subject level.ASA algorithm is developed on the basis of traditional simulated annealing and simulated quenching. It can fit the nonlinear models of real-world data.Generating probability density function, acceptance probability density function and temperature schedules constitute its basic structure.It has an advantage in solving highly nonlinear optimization problems, and the global optimal solution can be gained efficiently.
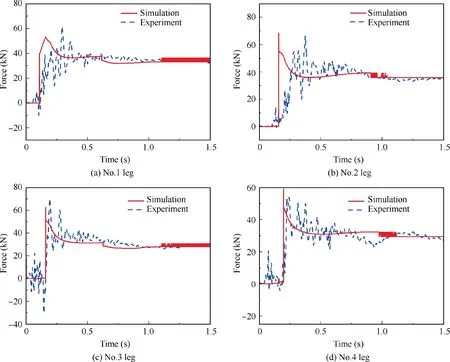
Fig. 13 Comparisons of buffer strut load in test and simulation.

Table 11 Comparison of peaks of strut load.
Based on the selected optimization algorithms, the entire optimization process is shown in Fig. 10. It also shows where each algorithm is applied.
The steps involved in the above optimization are as follows:
Step 1: At the system level, generate an initial population for Xby AMGA (NSGA-II);
Step 2: Transfer each individual of the Xto each subsystem;
Step 3: Use ASA, each subsystem solves its optimization problem respectively;
Step 4: Jand the corresponding variable values of each subsystem are transferred to the system-level optimizer;
Step 5: The system-level optimizer solves its optimization problem and repeats Steps 2–5 for each individual in the population. The corresponding system-level objective values are used to generate a new population. When the set number of iteration steps is reached, the process is terminated and the Pareto solution set of the optimization problem is generated.
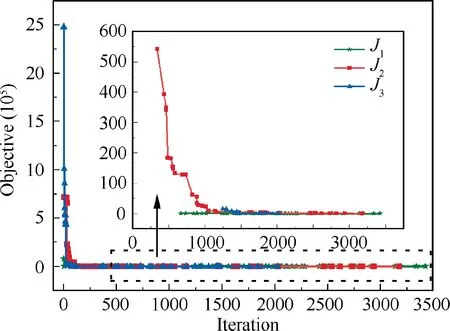
Fig. 14 An iterative process at the subsystem levels.
6. Results and discussion
6.1. Comparison of simulation and experimental results
The data collected by the experiment are compared with the simulation in the same landing condition. The impact accelerations of simulation and experiment are compared in Fig. 11.The experimental curve and the simulation curve have the same tendency in the acceleration. The testing acceleration reached the peak(13.48 m/s)at 0.225 s while the peak of simulation’s acceleration is 9.63 m/sat 0.195 s.There is a certain gap at each connection joint of the real prototype, which causes the nonlinear dynamic response of the contact,resulting in a larger overload peak in the testing.In addition,comparing with the simulation model,the pillars in the prototype are flexible bodies,which causes the acceleration response to delay.In particular, there is an oscillation in the test acceleration curve after the landing owing to the flexible mechanisms.
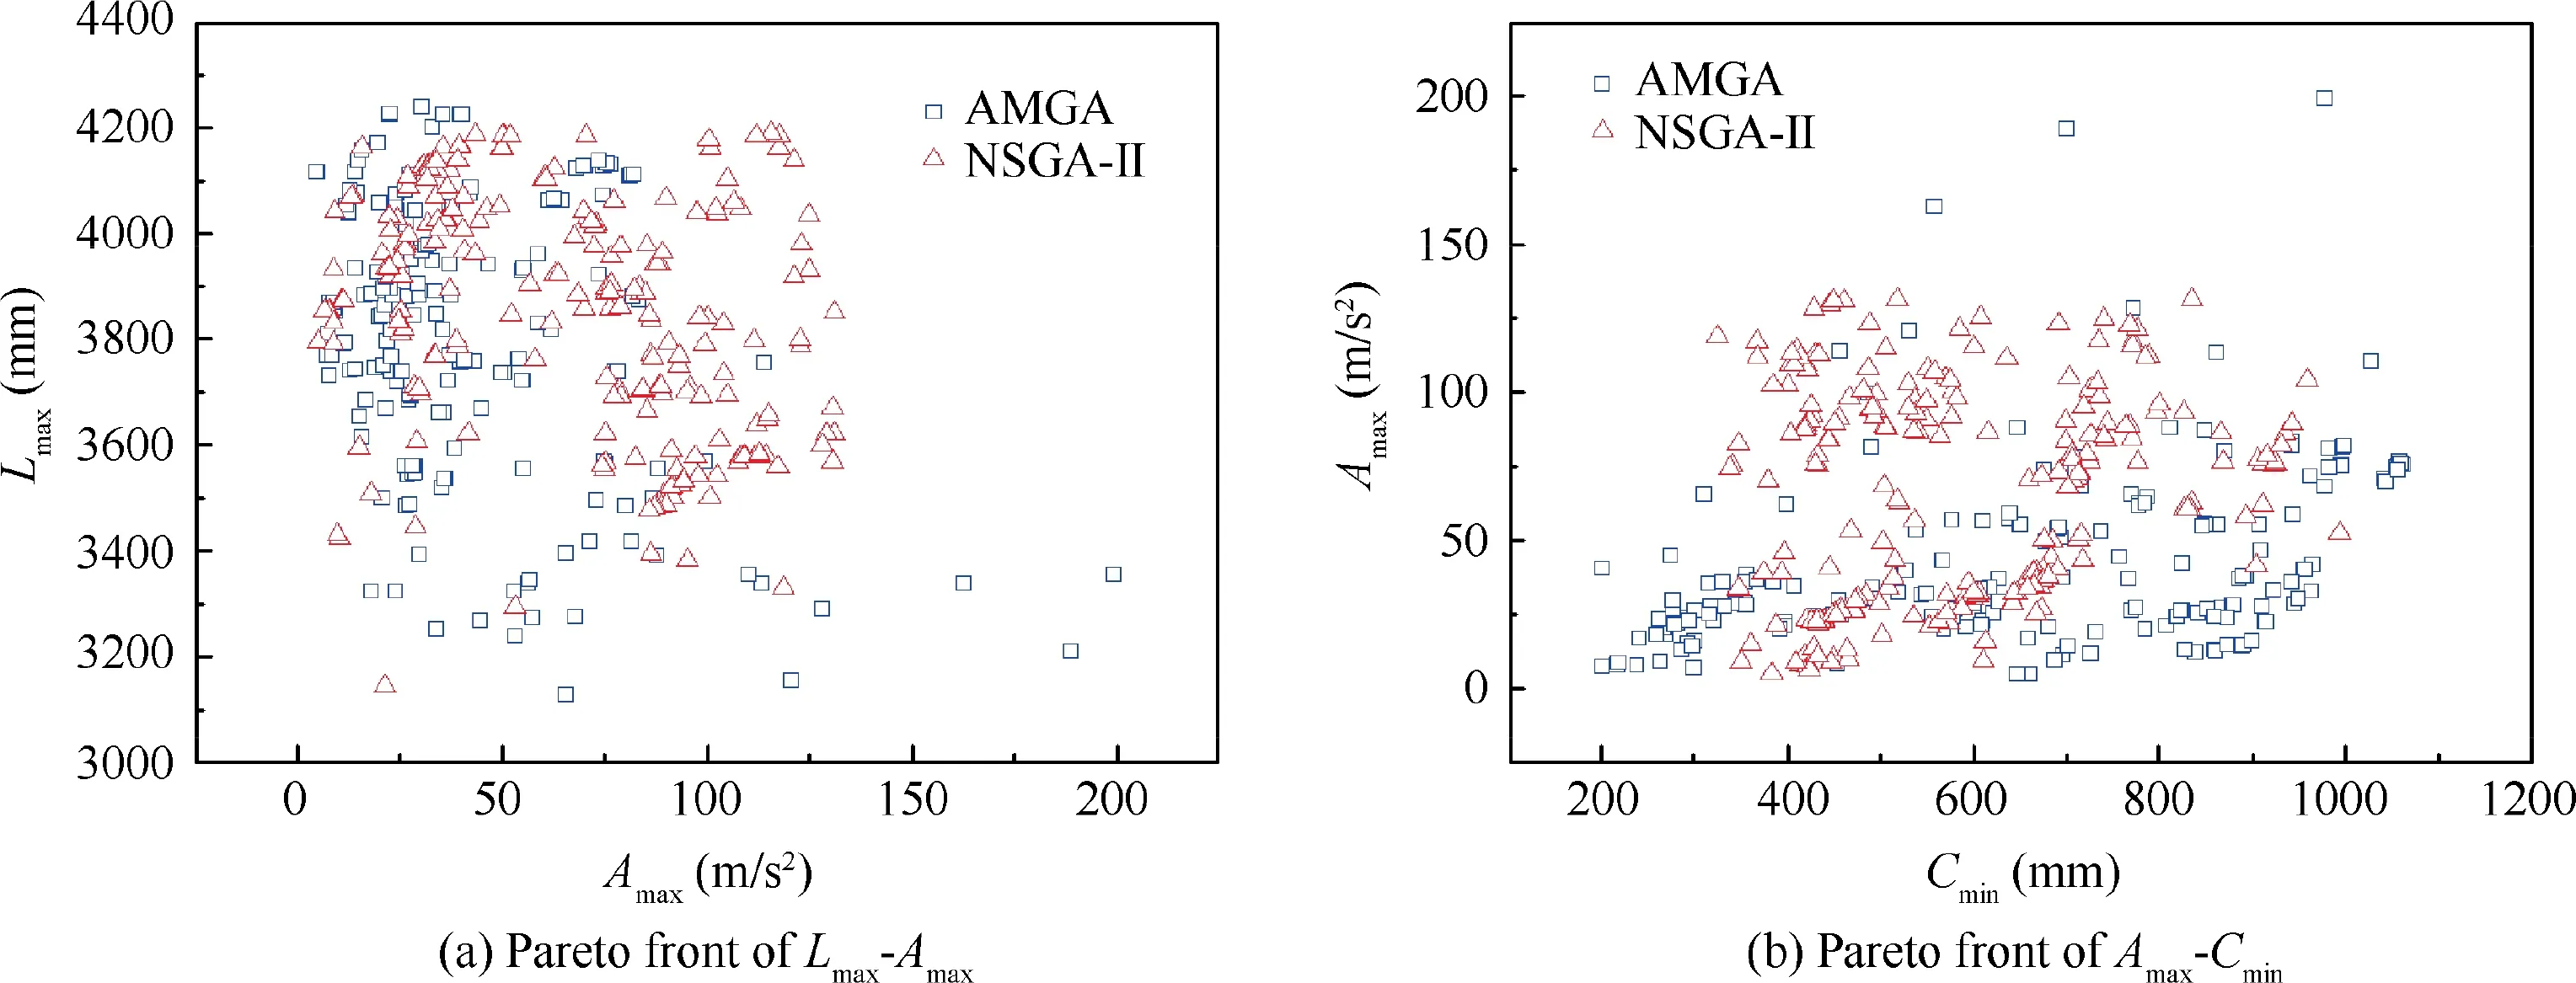
Fig. 15 Data points during the optimization iteration.
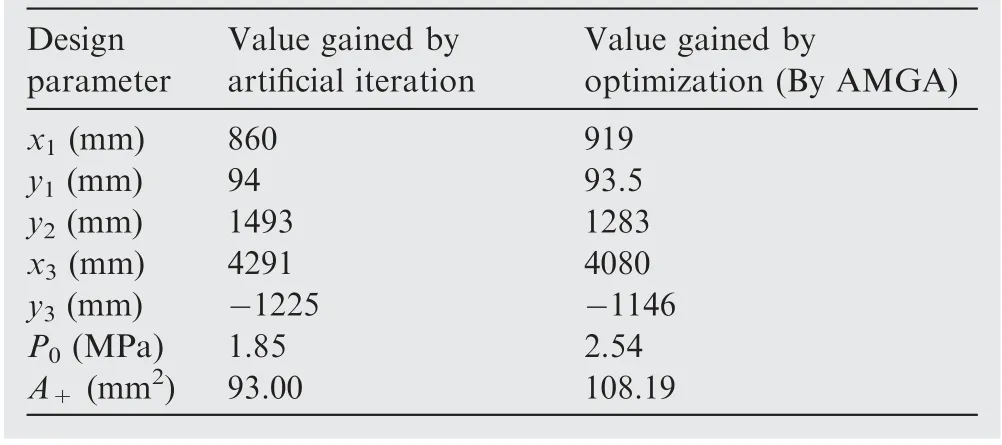
Table 12 Artificial iteration parameters and selected optimal parameters.
Fig. 12 and Table 10 compare the simulation and experiment damper strokes peaks, which shows that the errors of the peaks are acceptable.
Fig.13 illustrates the comparison of the buffer strut load in the test and simulation.The experimental data agree well with the simulation in the tendency.Table 11 lists the peak values of the experiment and simulation. And in the actual project, the errors are acceptable. In practice, the flexible structure will absorb part of energy,which also causes the test peak delaying compared with the simulation. In addition, due to the insufficient rigidity of the long cushion strut,all the load curves oscillate violently.
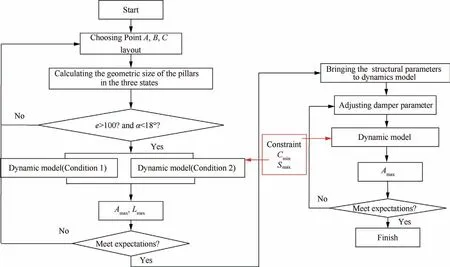
Fig. 16 Artificial iteration processes.

Table 13 Response results before and after optimization.
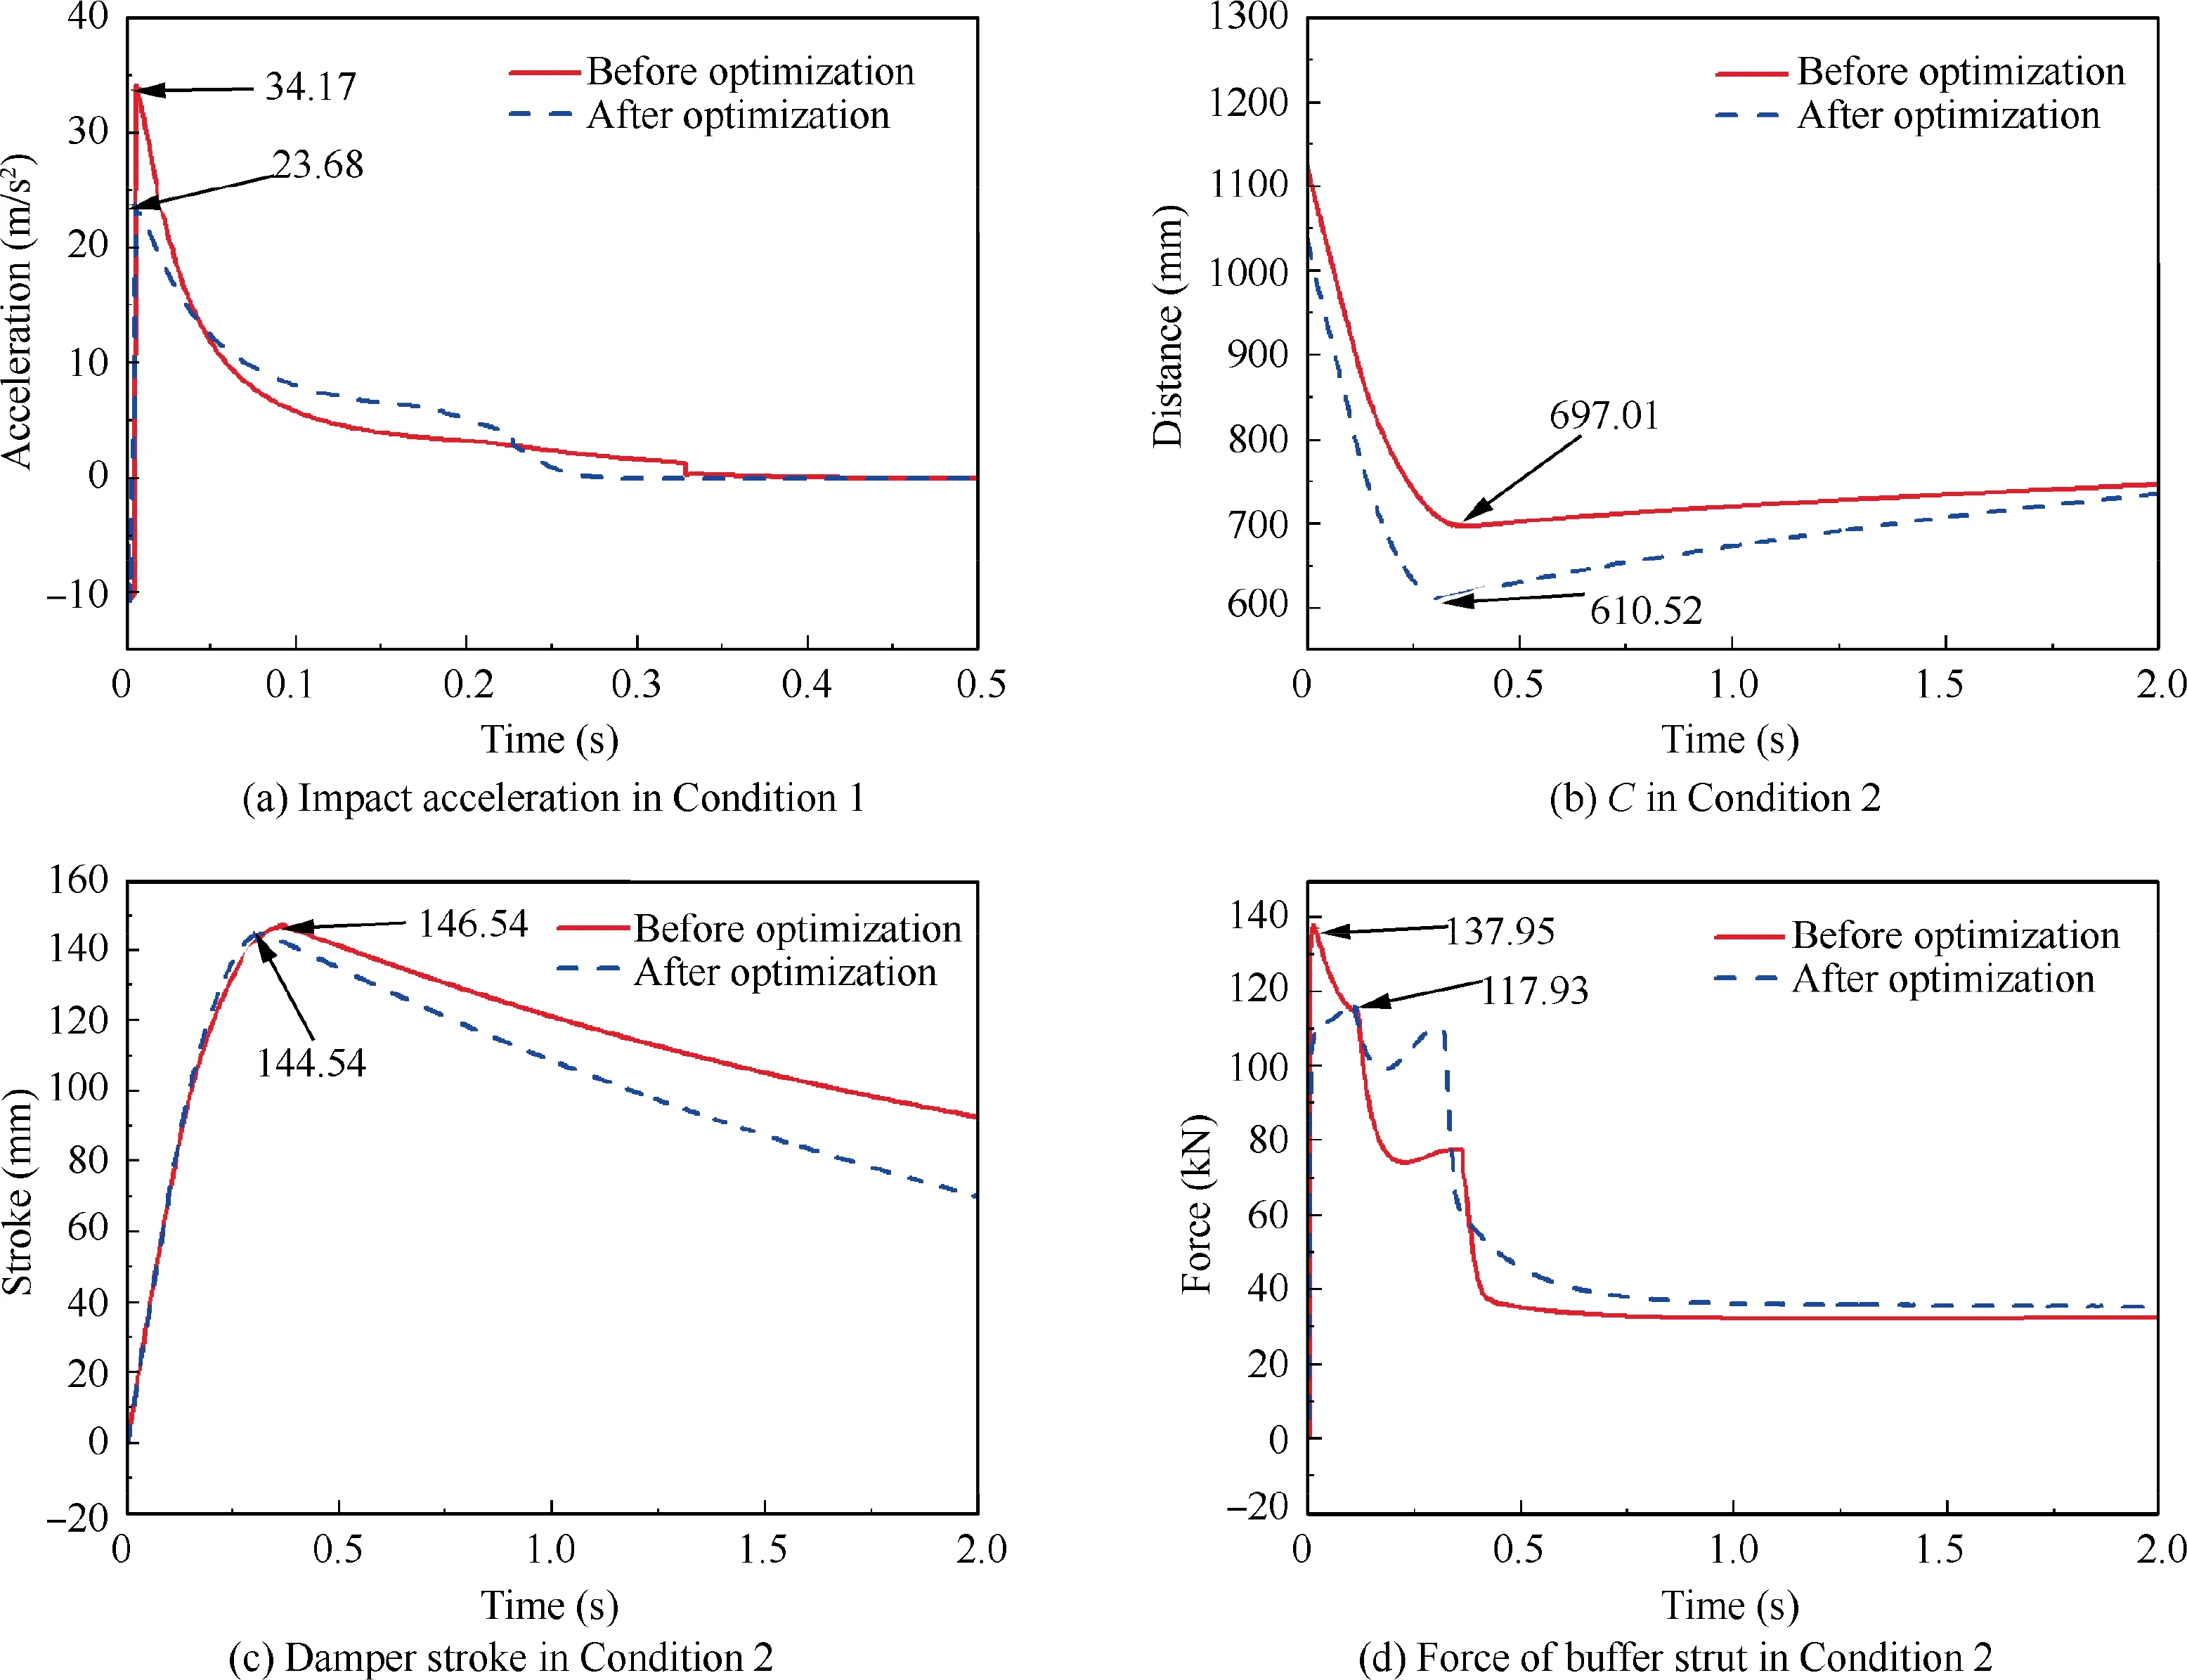
Fig. 17 Comparison of responses.
Due to the simplification of the model, there is a certain error in the test and simulation results, but the errors are within the acceptable range. It can be considered that the established dynamic model is effective.
6.2. The optimization results
By solving the optimization model iteratively, the Pareto noninferior solution set is obtained. An iteration process at each subsystem level is shown in Fig.14,which shows good convergence. And the Pareto frontier diagram is shown in Fig.15. It can be seen that there is a conflict between the optimization objectives. The improvement of one optimization goal will make the other goals go bad.It is impossible to optimize multiple objective functions at the same time.And compared with NSGA-II, the AMGA has a better Pareto front. This paper focuses on reducing the maximum acceleration (A) of the vehicle body and the maximum length of the pillar (L).The values selected optimal parameter solved by AMGA are shown in Table 12.
The artificial iteration process is shown in Fig.16.And the value gained by artificial iteration are listed in Table 12.
To verify the accuracy of the approximate model, the optimal parameters are brought into the dynamic model to solve the real response values.That the real response values are compared with the agent model result is shown in Table 13.It can be seen that the agent model can meet the requirements of engineering accuracy. The landing leg performances obtained by the two algorithms are listed in Table 13. The maximum impact acceleration obtained by the two is consistent, but the pillar maximum length Lgained by AMGA is smaller,which indicates that AMGA leads to a better optimization result.
The comparisons of landing performances obtained by artificial iteration and the proposed optimization method (COAMGA) is shown in Fig. 17.
As can be seen in Fig.17 and Table 12,the maximum acceleration (A) of the carrier under Condition (1) is reduced from 34.17 m/sto 23.68 m/sthrough the given optimization approach without increasing the maximum buffer stroke; the maximum buffer strut force changes from 137.95 kN to 117.93 kN by optimization; the value of Cdecreases from 697.01 mm gained by artificial iteration to 610.52 mm,but they are all above the safe distance, which is 500 mm; the angle of the dead point of the retractable pillar increases slightly, but still meets the design specifications; the maximum length(L)of the retractable pillar is reduced from 4086 mm to 3737 mm;the length margin e of the retractable pillar was significantly increased via optimization, which can make the pillar’s internal structural design more flexible.
To summarize,the maximum impact acceleration,the maximum buffer strut force decreases by 30.70% and 14.51%respectively. In terms of the landing legs dimension, the maximum length is reduced by 8.54% while the design margin e increases by 69.11%. As can be seen in a comparison of the two approaches,the proposed optimization method can obtain a better comprehensive performance of landing legs faster.
7. Conclusion
(1) An eversion landing device for RLV is designed. The device is composed of four landing legs arranged symmetrically.Each leg includes a retractable post,a buffer,an auxiliary housing, and a footpad. The geometric Topological model of the landing leg retractable is given.Besides, the soft-landing dynamic equations is established. The geometric relationship and design constraints in the process of deploying-retracting are derived.
(2) A landing impact test is carried out. The experimental values of the landing impact response under a certain working condition are obtained.The values of the simulation and the test are compared and analyzed. The results show that the test values agree well with the simulation results, which verifies the effectiveness of the dynamic model.
(3) Via coupling the geometric topology with dynamic model, the performance indexes of the landing legs that are focused on both the landing process and the deploying-retracting process of the landing legs are given.Based on the radial basis model,the collaborative optimization method is adopted to optimize the landing legs.
(4) The comparison with the artificial iteration method shows that the proposed optimization gains better solutions more quickly. The RLV’s maximum impact acceleration and the maximum retractable pillar length are reduced by 30.70% and 8.54% with the proposed optimization approach. Not limited to RLV landing legs,the optimization proposed has a certain versatility. By modifying the coupling model according to the actual structure, the optimization method can be applied to the diverse landing legs, which can avoid tedious artificial iteration.
The authors declare that they have no known competing financial interests or personal relationships that could have appeared to influence the work reported in this paper.
This study was co-supported by the Fundamental Research Funds for the Central Universities, China (No.3082019NS2019003) and A Project Funded by the Priority Academic Program Development of Jiangsu Higher Education Institutions, China.
