A step parameters prediction model based on transfer process neural network for exhaust gas temperature estimation after washing aero-engines
Zhiqi YAN, Shisheng ZHONG,*, Lin LIN, Zhiqun CUI, Minghng ZHAO
a School of Mechatronics Engineering, Harbin Institute of Technology, Harbin 150001, China
b Department of Vehicle Engineering, Harbin Institute of Technology, Weihai 264209, China
c School of Naval Architecture and Ocean Engineering, Harbin Institute of Technology, Weihai 264209, China
KEYWORDS Aero-engine washing;Data step changes;Exhaust Gas Temperature Margin (EGTM);Neural networks;Transfer learning
Abstract The prediction of Exhaust Gas Temperature Margin (EGTM) after washing aeroengines can provide a theoretical basis for airlines not only to evaluate the energy-saving effect and emission reduction,but also to formulate reasonable maintenance plans.However,the EGTM encounters step changes after washing aeroengines, while, in the traditional models, a persistence tendency exists between the prediction results and the previous data, resulting in low accuracy in prediction. In order to solve the problem, this paper develops a step parameters prediction model based on Transfer Process Neural Networks (TPNN). Especially, ‘‘step parameters” represent the parameters that can reflect EGTM step changes. They are analyzed in this study, and thus the model concentrates on the prediction of step changes rather than the extension of data trends.Transfer learning is used to handle the problem that few cleaning records result in few step changes for model learning. In comparison with Long Short-Term Memory (LSTM) and Kernel Extreme Learning Machine (KELM) models, the effectiveness of the proposed method is verified on CFM56-5B engine data.
1. Introduction
After running for a long time, the air foulant deposits on the surface of the aero-engine blades. The compressor is the most significant area for fouling.The foulant not only causes pitting of compressor components but also reduces compressor power and air flow. As compressor power accounts for 60%–65%of the total,a small decrease in its power can significantly reduce the engine thrust.In order to compensate for the thrust, the engine controller increases the fuel flow,consequently reducing the oxygen contents in the combustion chamber and increasing the combustion temperature, which results in increasing NOemissionand reducing the overall performance of the engine.Statistics demonstrate that 70%-85% of engine performance loss is caused by fouling.
Engine fouling has received more attention due to its increase in fuel consumption, environmental pollution, and aviation operating costs.Most countries pass relevant laws to limit harmful gas emissions.According to statistics, the aviation industry accounts for 13% of the transportation industry’s total fuel consumption and 2% of the pollution gas emissions.Due to the high operating costs in association with the aviation industry, a small reduction in engine fouling can significantly reduce overall operating costs, energy consumption, and environmental impacts.It is estimated that if fouling is reduced,2735 t(1 t=1000 kg)of fuel consumption and 8626 t of harmful gas emissions can be reduced per 100 engines per year, and the cost will be saved by 10.08 million dollars.
Therefore,the aviation industry put forwards the slogan of‘‘energy conservation and pollution reduction”, using water washing to solve the problem of engine fouling.Water washing is an efficient and economical method, contributing to saving fuel and reduce emissions.Water washing refers to cleaning the gas path of the engine. Water washing can remove blade dirt, restore air flow, and thrust, reduce fuel consumption and Exhaust Gas Temperature (EGT), prevent blade pitting and prolong engine life. Therefore, washing has been widely valued and applied globally. In the maintenance procedure,water washing of the engine is listed as a necessary item.
Reasonable planning of water washing can maximize the useful life of the engine at low operating costs.Engine washing includes off-wing washing and on-wing washing. Off-wing washing demands cooling and dismantling of the engine and achieves a significant recovery of performance.However, it costs much time and expenditure,having no operating income for a long time. On-wing washing is to clean the cold running engine on the wing, which can thus avoid the high cost of dismantling.Although on-wing washing can delay the time of offwing washing, the cost of rental equipment for on-wing washing is also extremely expensive,which indicates that on-wing cannot be carried out at a high frequency. Therefore, it is crucial for airlines to understand the overall decline trend of engine performance to reasonably plan the cycle of on-wing washing, thus minimizing the operating cost of engines during their whole life.Fig. 1 presents engine performance under different washing cycles.
For each type of engine, the engine Original Equipment Manufacturer(OEM)provides a recommended on-wing washing cycle of 3–8 months.However,the optimal washing cycle is affected by numerous factors such as the number of flight cycles and exhaust gas temperature marginand even the last washing can also affect this washing cycle, etc.. If airlines copy the regular water washing plan provided by the manufacturer, it will exert an impact on engine life, fuel-saving, and emission reduction. At present, the washing cycle provided by OEM is usually longer than the actual need in the local,and thus the local engine is often not washed in time. Fig. 2 presents a photo of the engine interior taken by means of a borehole probe in the Beijing maintenance base. Due to not washing in time,a lot of dirt adhered to the compressor blade.
Accurate prediction of the performance improvement effect after washing is of great significance to ensure the efficient and economic operation of the engine.Basendwah et al.investigated the effect of turbine washing on the total cost and net profit and showed that optimized washing procedures can have a considerable impact on revenue. The washing effect prediction technology can allow the operator to make service decisions based on the current situation of the gas turbine rather than the regular water washing schedule.Therefore, in order to help airlines optimize the on-wing washing interval, it is of necessity to evaluate the engine washing effect on a performance perspective.
In engineering practice, the performance of engines is mainly evaluated by condition monitoring, and the simplest and direct way is to monitor EGTM.EGTM is provided by OEM, which is defined as the distance between the EGT and the EGT red line when the engine generates rated full thrust and the ambient temperature is 35 ℃at sea level under standard conditions.According to the engineering practice,the operating conditions highly related to EGT include takeoff thrust,field temperature,field pressure,and engine bleed state.To eliminate the influence of the above conditions, OEM collects three types of data when calculating EGTM: (A) aircraft identification information; (B) EGT, low pressure rotor speed(N) or Engine Pressure Ratio (EPR), Total Air Temperature(TAT) when EGT reaches the peak value; (C) engine bleed state. OEM uses the above data to convert engine operating conditions to standard operating conditions when calculating EGTM. Therefore, EGTM has excluded the influence of highly relevant factors.
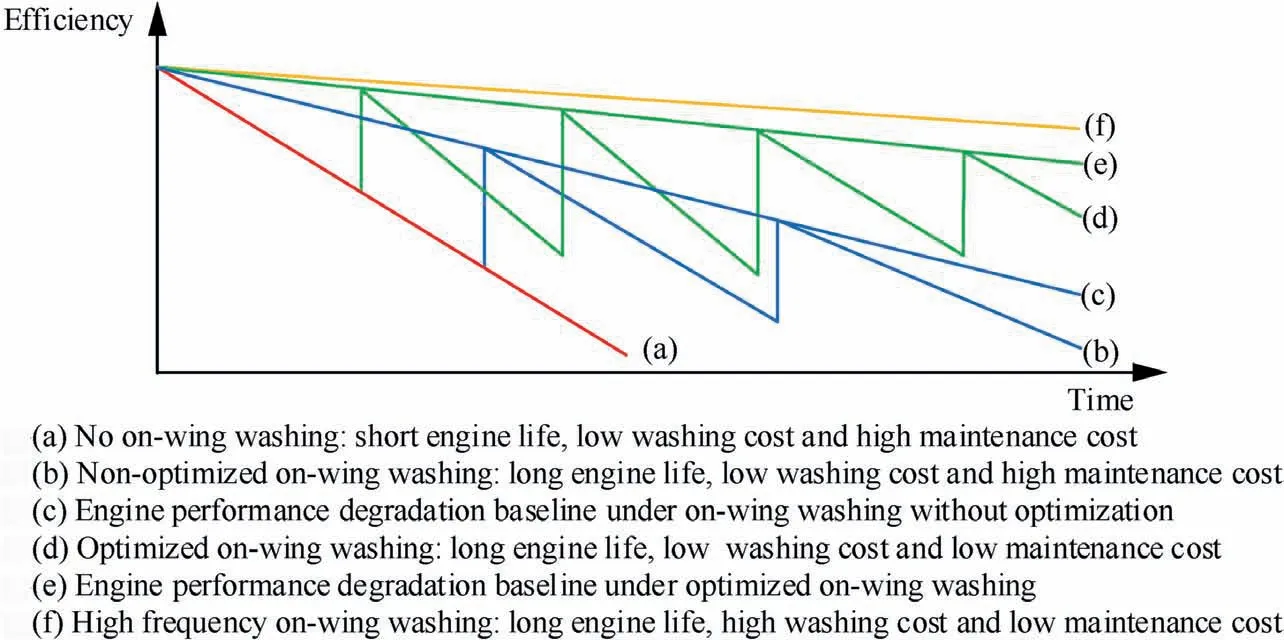
Fig. 1 Engine performance under different washing schedules.
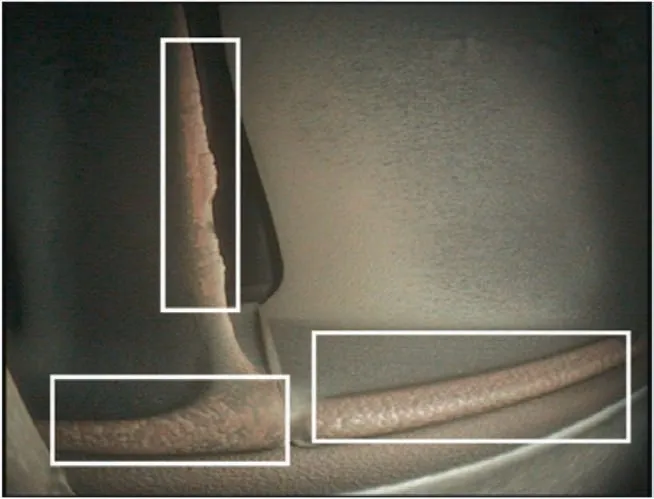
Fig. 2 Unoptimized washing schedule causes fouling in compressor blades.
Therefore, this paper uses EGTM as a reference to the washing effect. Real EGTM is represented by dots and Fig. 3 shows that EGTM descends before washing. After washing, EGTM has a step and then continues to descend.If the change of EGTM after washing is accurately predicted,airlines can not only use the prediction results to calculate the duration of washing effect but also evaluate the emission reduction of pollutant gas after washing,providing data support for engine emission control and environmental impact assessment. This will help to extend the useful life of the engine, save energy, and reduce emissions, thereby improving the economic benefits of airlines.
Numerous studies use EGTM as an engine performance index to predict. Li et al.modified the engine maintenance schedule by taking EGTM as an engine health status index by employing the reinforcement learning method. Liu et al.combined the state space method with the Kalman filtering algorithm to evaluate engine residual life with EGTM. Additionally, EGTM prediction can also be used to estimate fuel consumption and carbon emissions.Zhong et al.combined Convolutional Neural Networks (CNN) with Support Vector Machines (SVM) to evaluate the aero-engine on-wing time with EGTM, and then diagnose engine fault based on other parameters as auxiliary. Guo et al.proposed a continuous function prediction model to predict EGTM, which is proved to have high prediction accuracy.
However, this study confronts a challenge. The traditional methods can not accurately predict the step change of EGTM after washing. As shown in Fig. 3(a), the prediction data of traditional methods must have a persistence tendency with the previous data, such as Long Short-Term Memory(LSTM)and Kernel Extreme Learning Machine (KELM).However, airlines need to accurately predict the step change and the subsequent performance trend before washing,as presented in Fig.3(b).Due to the difficulty of prediction,the current method adopted by the front line is to refer to the historical EGTM improvement after monthly washing.However, this method is only effective for a single type of engine working in a specific area, and not for others working in other regions. Therefore, it has low prediction accuracy.
Another challenge for this study refers to that the small number of samples due to the less washing times of the engine during on wing, although washing can significantly improve EGTM and effectively prolong engine life. According to the current washing schedule, the average washing cycle is more than 300 flight cycles in the on-wing period of 3000 flight cycles, resulting in less than 10 times of washing during on-wing. Moreover, the maintenance records of washing are often missing in reality. Thus, only about 5 records can be collected from each engine. Therefore, the prediction of washed aero-engine data remains a typical small sample prediction task.
Based on the above problems, this paper proposes a new EGTM prediction method,concentrating on solving the problem of small sample size and step change which could hardly be accurately predicted due to the persistence tendency. The rest of this paper is organized as follows.Section 2 analyzes the relevant parameters of the EGTM step change. In Section 3, a step change parameters prediction model is proposed, including parameters prediction model structure and learning method.In Section 4,followed by the conclusion of Section 5,experiments are arranged to verify the effectiveness of the model.
2. Analysis of parameters related to EGTM step change after washing
Due to the existence of persistence tendency, it is difficult to accurately predict step change by learning historical EGTM data directly. The current research intends to let the model focus on the perception of step change.Especially,the parameters related to the EGTM step change are extracted as learning samples for subsequent EGTM step change prediction model.
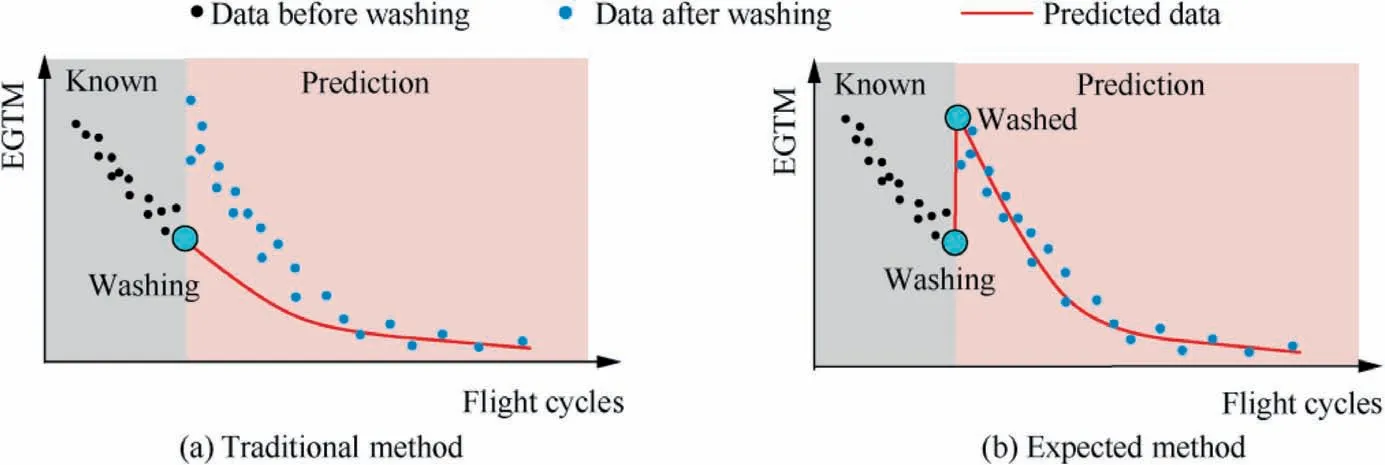
Fig. 3 Difference between traditional method and expected method in prediction effect.
2.1. Analysis of parameters that reflect EGTM step changes after washing aeroengine
Firstly, the EGTM step change-related parameters are introduced. Fig. 4 shows the change of EGTM from washed CFM56-5B engine. The corresponding time scale is expressed by the flight cycle of the engine.
The parameters related to EGTM changes after engine washing are as follows:
(1) CSN. CSN means cycle since new, which is the total number of engine flight cycles from the factory to the present.The washing time in Fig. 4 is characterized by the CSN of the engine when washing. As shown in Fig. 4, the overall performance trend is gradually decreasing in the whole engine flight cycle. With the increase in CSN, each step change after washing will be different. Therefore, CSN is taken as the relevant influence parameter of step change.
(2) ΔCSN. ΔCSN is the engine washing interval, which is characterized by the CSN difference between the current washing and the last washing.According to Ref.,ΔCSN is positively related to the washing effect.Therefore,it is regarded as an important parameter.
(3) VBW. VBW is the Value Before Washing (VBW).According to Ref., VBW is inversely related to the current washing effect, and thus it is an important parameter.
(4)INC.INC is the increment of EGTM after washing.As shown in Fig.4,if the current washing times are i and the number of flight cycles is t, the step change at t, is INC. INC directly reflects the washing effect.Thus,it is one of the important parameters to be predicted.
(5) DR. DR is the linear decreasing rate of EGTM after washing.Since the small fluctuation of EGTM does not affect the calculation of main oil saving and the analysis of the overall performance trend in the whole useful life,the linear decline is taken to describe the EGTM after washing with reference to the relevant paper.DR not only reflects the washing effect but also can be used to calculate the oil saving and evaluate the engine’s performance degradation rate during the whole useful life. It is also one of the required important parameters.
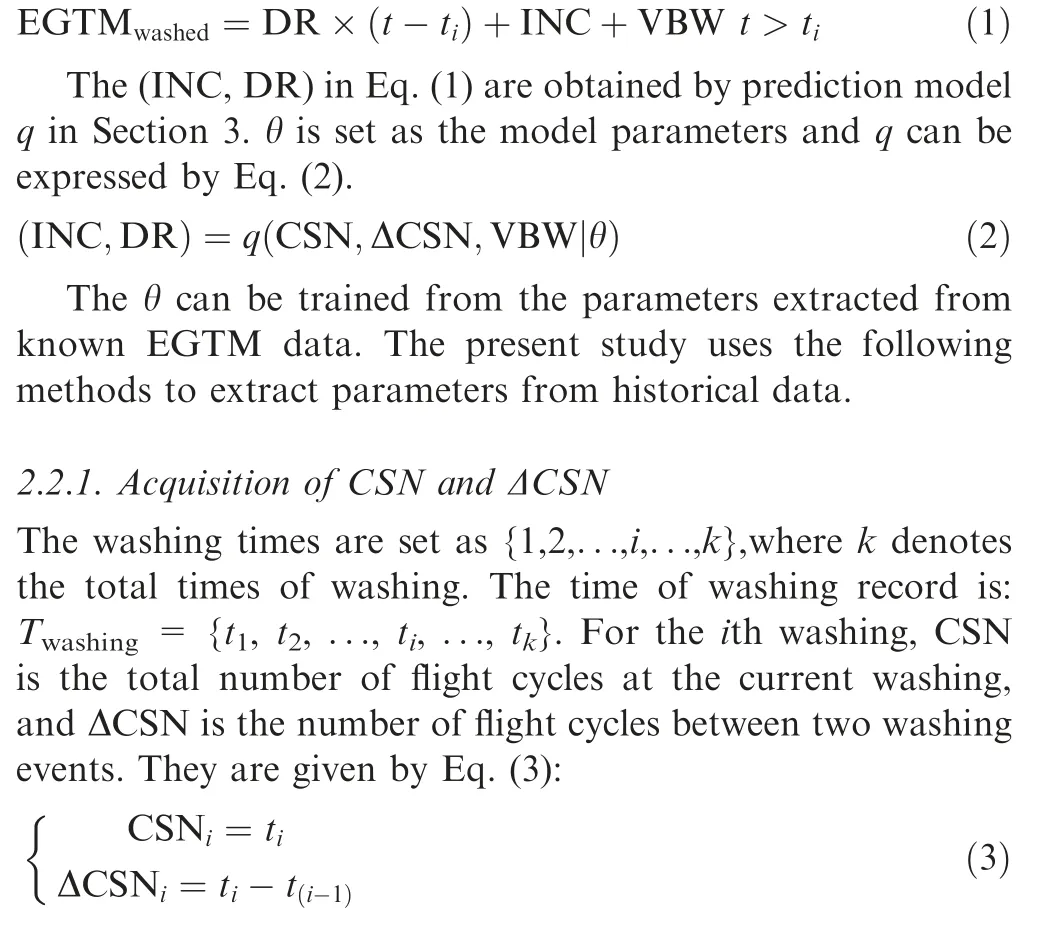
Based on the above analysis, this study focuses on the calculation of(INC,DR)according to(CSN,ΔCSN,VBW),and calculates the EGTM after washing further.
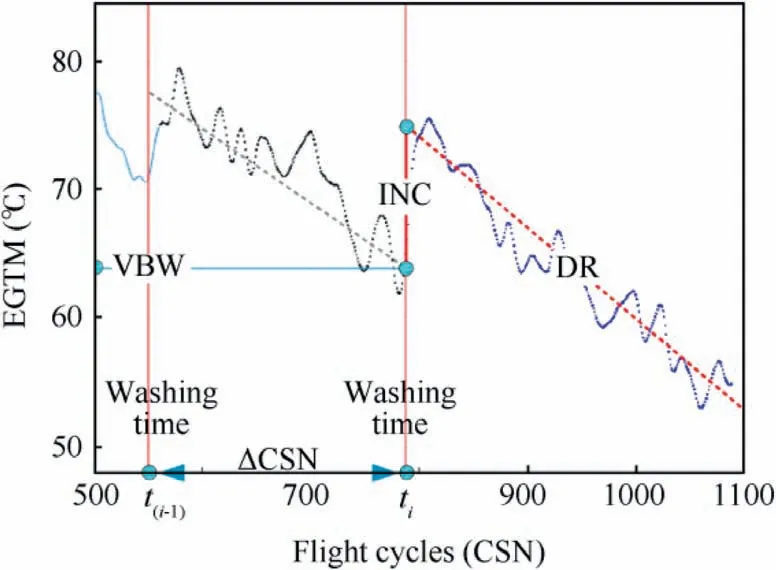
Fig.4 Parameters related to EGTM step change((INC,DR)are EGTM data parameters before washing,and(CSN,ΔCSN,VBW)are after washing).
2.2. Step parameters value acquisition
If the number of flight cycles is t,the number of washing times is i, the number of flight cycles when washing is tand the EGTM after washing is expressed by Eq. (1).
2.2.2. Acquisition of VBW
Because there are a lot of outliers in EGTM data, it is not accurate to use EGTM value before washing as VBW.Instead, in the current study, the data before washing is linearly fitted, and the value at the washing point of the fitting function is taken as VBW. For the ith washing, the number of flight cycles before washing is set as t∊{t+ 1,t+ 2, ... ,t}. The parameters of the linear fitting function are set as band a. Then, the linear fitting function is expressed by Eq. (4):

Set the EGTM data in the sample as E={e,e,e,...,e},where n is the total number of data. E can be divided into k + 1 groups by T, which is given by Eq. (5):
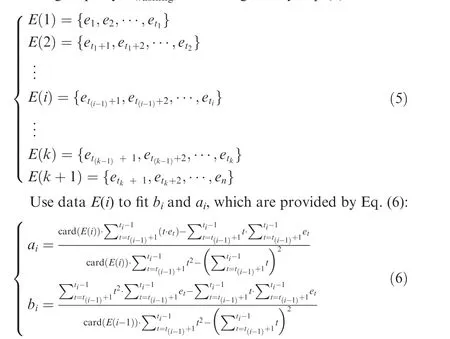
where card(E(i)) denotes the number of elements in E(i).
The VBWof the ith washing can be calculated by Eq. (7):

2.2.3. Acquisition of INC and DR
The INC and DR were obtained by the method presented in Fig. 5. Move the EGTM data to the origin of the coordinate and linearly fit it. The intersection of the fitting line and the vertical axis is the INC, and the slope of the fitting line is the DR.
The process is as follows. The corresponding VBW is subtracted from each group of data in Eq. (5), and the result is given by Eq. (8):
3. Transfer Process Neural Network (TPNN) model
Since washing can affect the decline rate of EGTM and the next washing effect,the parameters related to EGTM step change are affected by all previous washing events.As a result,the prediction of EGTM step change parameters belongs to time series parameter prediction, which indicates that the prediction model q in Eq. (2) can not only realize the mapping from (CSN, ΔCSN, VBW) to (INC, DR), but also consider the cumulative effect of all washing events.
For the time series parameter prediction, the LSTM,KELM, and Process Neural Networks (PNN) are employed to realize the prediction task in related researches,and effective results are achieved.However,the LSTM model has a complex structure and is not suitable for small samples prediction.KELM is ridge regression prediction,and its ability to predict highly nonlinear data is insufficient. Therefore, LSTM and KELM are not suitable for this study.
This study intends to use the PNN as the predictive model q.PNN is a derivation of traditional artificial neural networks in the time domain, which can reflect the time accumulative effect of aero-engine data. The model takes historical data as training samples, and its output contains the cumulative response to a series of washing events.Thus,the output results are accurate. In addition, the number of extracted parameters is less than 50 due to less than 10 washing records of on-wing,which is not enough to train PNN.In the current work,transfer learning is introduced to solve the problem of insufficient training. Especially, the basic framework of the model is trained with other engine data and then transferred to the target engine for fine-tuning to obtain the target model. Fig. 6 expresses the process of model training and EGTM prediction after washing.
3.1. Principle of PNN
PNN was first proposed by He and Xu.It is suitable for small sample data with high nonlinearity due to only a few parameters and good robustness.PNN is therefore used to analyze the gas path parameters of aeroengines. PNN is composed of process neurons,which includes three parts including weighting,integration,and excitation.The process neurons are shown in Fig. 7.
If the sample collection temporal interval is [0, I], the input of process neurons in the hidden layer is given by Eq. (10):

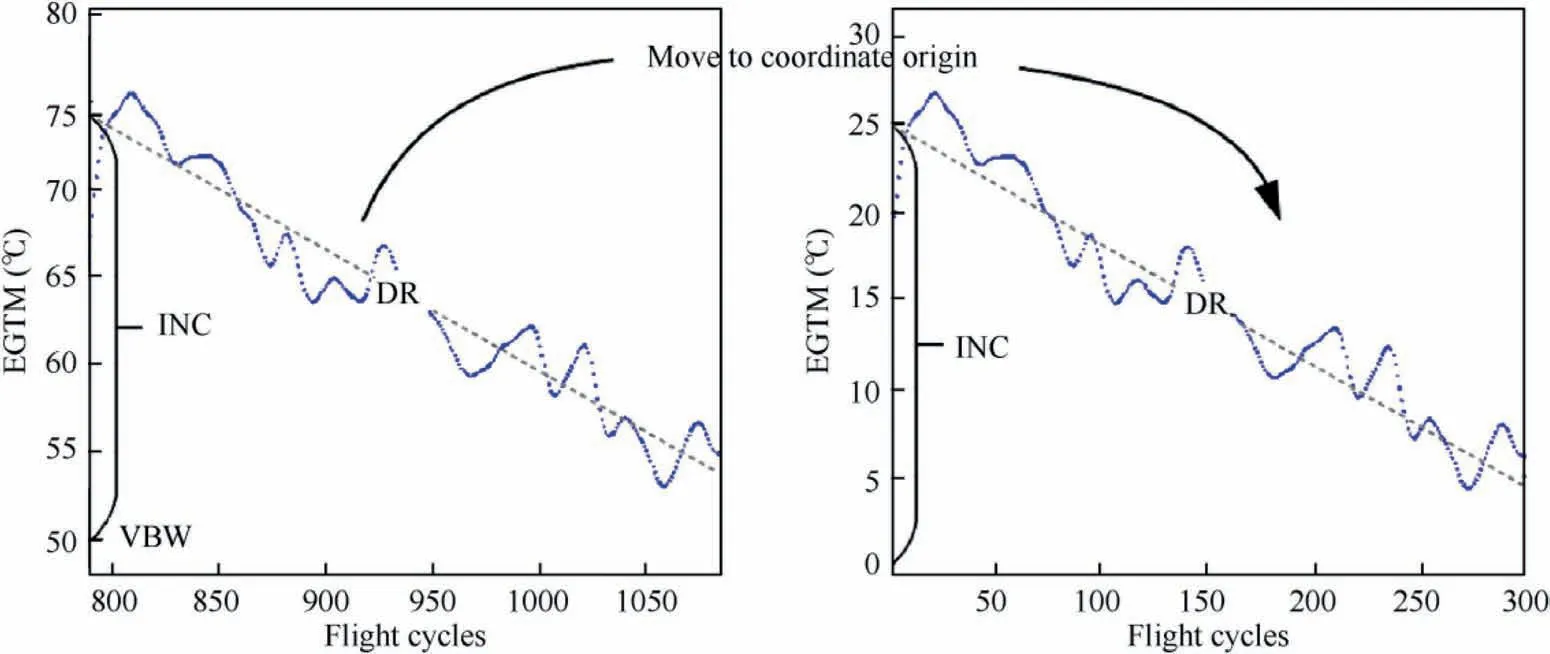
Fig. 5 Move data to origin of coordinate and then fit to get DR and INC.
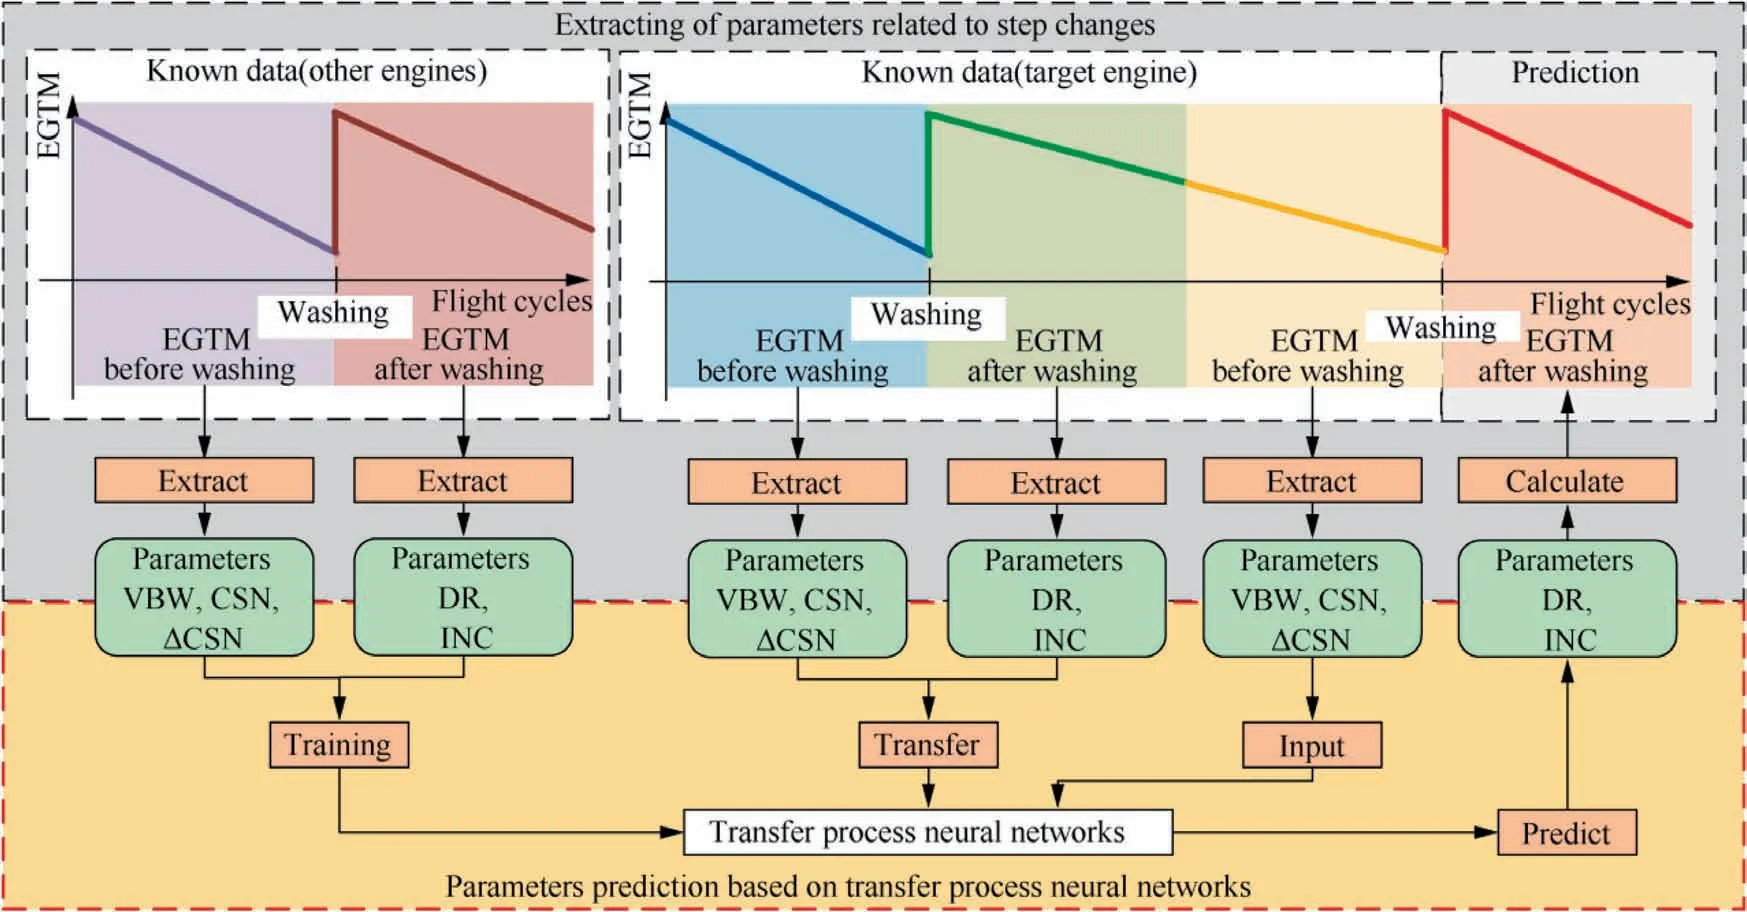
Fig. 6 Step changes parameters prediction model based on TPNN.

Fig. 7 Process neuron.

The output of the process neurons in the hidden layer is provided by Eq. (11):

where θis the bias of hidden layer process neurons;g(∙)is the activation function of hidden layer process neurons. In this study, it is set as sigmoid function.
Set the weighted output of the hidden layer as z, and The activation function f(∙)of the output layer as a linear function:f(z) = z. Finally, the expression of the TPNN is given by Eq.(12):

where vis the weight connecting the jth neuron of the hidden layer and the output neuron,it is one element of weight vector v in Fig.7;θis the jth bias of hidden layer;θis the jth bias of output layer; nis the number of hidden nodes in the network.
However, there are two problems with the application of PNN in this study:
(1) There are insufficient samples to support the prediction of feature parameters because the washing records and data provided by airlines are incomplete. Although PNN requires less sample size than LSTM, it remains difficult to predict the feature parameters (INC, DR) with less than 10 samples.
(2) The traditional backpropagation algorithm could hardly be applied to PNN due to PNN including time aggregation operators. As a result, the calculation of PNN gradient is still the direct derivation of the loss function to the model parameters, resulting in a large amount of calculation.
For the problem of insufficient samples, this study combines transfer learning and PNN into the TPNN model in order to make up for the lack of PNN training.See the model in Section 3.2 for details. For the problem that the traditional backpropagation algorithm is not applicable, this paper designs a gradient solution method for the two-layer cumulative structure of TPNN, which will be introduced in Section 3.3.
3.2. Structure of TPNN model
The data collected from the engine includes the samples with full records and non-full records.However,the amount of data with full records is too small to support model learning. This study proposes a secondary transfer method to complete the model training.Firstly, the model is trained with a large number of non-full records samples.Then,the model is transferred to the full records samples for fine-tuning.Finally,the model is transferred to the data of the target engine. This model makes full use of the samples with incomplete records, which can ensure the accuracy of model learning and prevent the model from overfitting.
The hidden layer structure of TPNN affects the accuracy of prediction. Set nas the number of input layer nodes, and nas the number of output layer nodes. According to Ref.,the number of hidden layer nodes nin Eq.(12)of TPNN is determined by Eq. (13):

According to the data sample and maintenance record, the characteristic data are extracted as:data=[input data:(CSN,ΔCSN, VBW), label data: (INC, DR)]. For engines with nonfull records,define source domain S´={S,S,...,S,...|S={data, data, ...}}. For the engine with full records, define source domain S= {S, S,..., S,...| S= {data, data,...}}.For the target engine in the prediction task,define target domain G = {G, G,..., G,... | G= {data, data, ...}}.
In order to ensure a similar distribution of data samples,source domain S´,S,and target domain G all collect the same type of engine.Most of the engine data are not fully recorded.Therefore, the sample number of S´ is larger than that of Sand G. This paper adopts three steps to train:
Step 1. S´ with non-full records is used for preliminary training of the model framework and thus the range of model parameters w(i) and v are close to the convergence region.Non-full records mean that the Elements Sin S´ may not be adjacent to each other in time. Therefore, the cumulative response of washing events learned from S´ does not conform to the real situation. However, only S´ contains enough samples to support model learning. Therefore, TPNN has to use the samples of the source domain S´for the first training to initially obtain the model parameters (CSN, ΔCSN, VBW) and(INC, DR). Make ‘‘loss” represent the loss function of the model, which is given by Eq. (14):
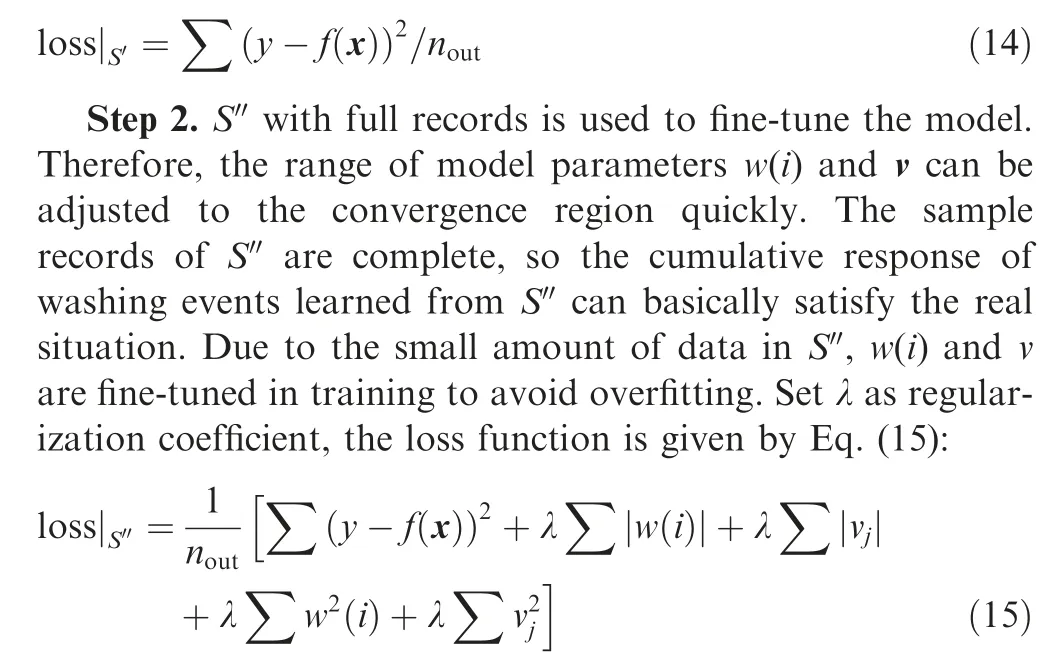
Step 3. The target domain G is used to further train the model, and thus the parameters w(i) and v are transferred to the convergence region of the target domain G.Due to the different working conditions of other engines and target engines,the model trained by source domain S´ and Sis not perfectly suitable for the target engine. Therefore, the model is transferred to the target domain G for final training. Due to the small amount of data in the target domain G,the loss function involved also considers the prevention of overfitting. The loss of the target domain G is same to Eq. (15):
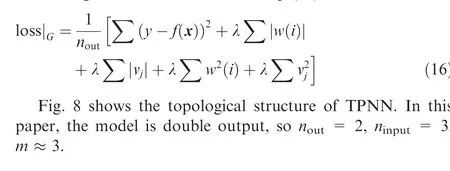
3.3. Gradient solution for double accumulation structure of discrete TPNN model
In the calculation of gradient,the traditional back propagation algorithm is difficult to apply to TPNN.Therefore,the process of calculating the TPNN gradient is extremely complicated.
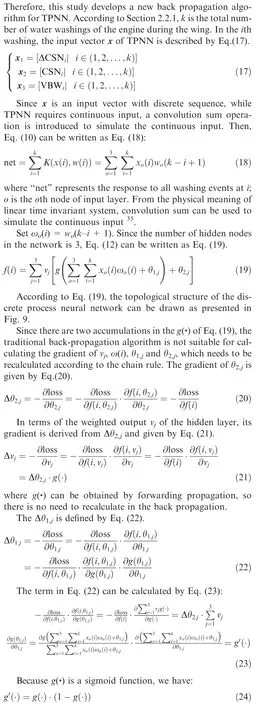

Fig. 8 TPNN model.
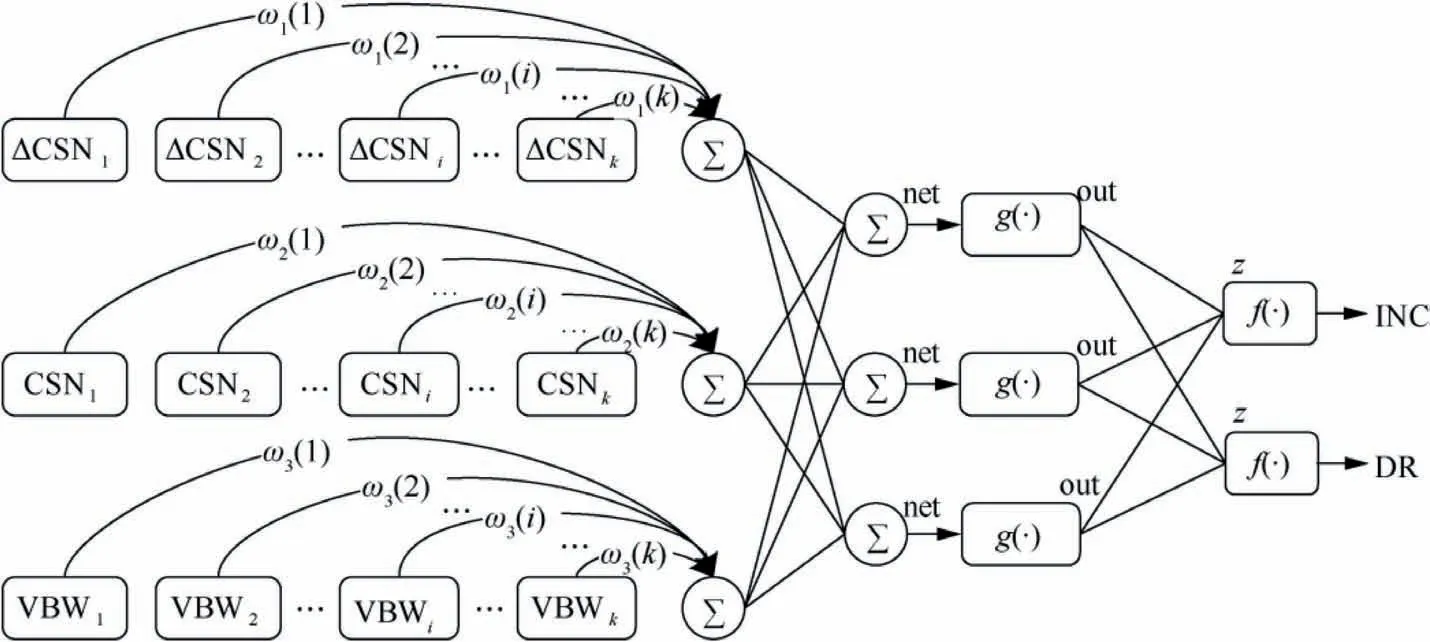
Fig. 9 Topological structure of TPNN.
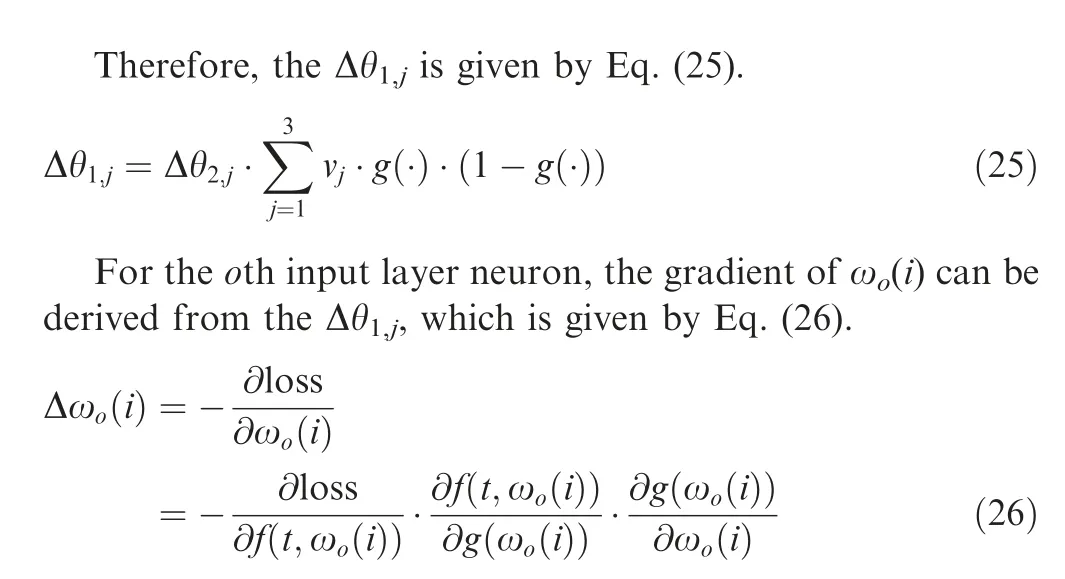
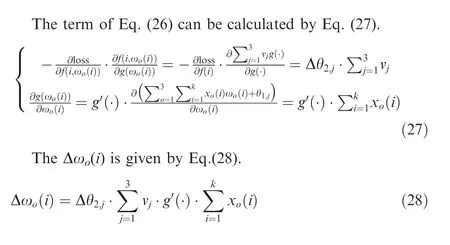
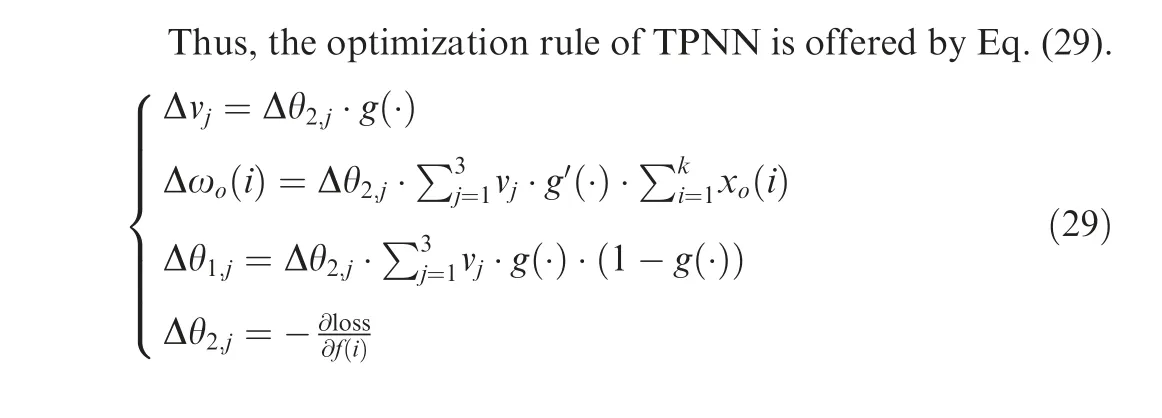
4. Experiment and discussion
4.1. Aero-engine data preparation
The data in the thesis are collected from CFM56-5B aeroengine, which is widely used in Boeing 737,Airbus A320,Airbus A340-200/300, KC-135, and other aircraft. EGTM is derived from the inlet temperature of the high-pressure turbine. Fig. 10 presents the measurement point of the aero engine exhaust temperature.
The data needed for the research is the maintenance records and the corresponding EGTM data which needs to be extracted from the data package provided by the airline. The airline provided four materials concerning the CFM56-5B aircraft engine,including:OEM data in Table 1,disassembly and assembly records in Table 2,and washing records presented in Table 3.
The data needed for this research is scattered over various tables. Fig. 11 presents the process of data extraction as follows. Firstly, read each washing data provided in Table 3. According to the aircraft ID and washing date in Table 3, locate the aircraft ID and the interval of status start–end date in Table 2 to obtain the corresponding ESN. Then, a data sheet with ESN as an index is established, and the items without initial state are removed from the data sheet. Collect all EGTM data from Table 1 for each ESN in the data sheet. Finally, the washing date and EGTM data are added to the data sheet, which is needed for the present study.
The parameters (CSN, ΔCSN, VBW, INC, DR) related to EGTM step changes after washing were collected from 33 engines. However, the data collected from 31 engines have the problem of non-fully recording. Only 2 engines have full washing records.Fig.12 shows a set of data with relatively full recordings.
The blue line presented in Fig. 12 is the EGTM extracted from OEM data, and the red lines are the washing records provided by the airline. There are 10 washing records in total.However, EGTM data are not complete, falling to cover all the washing records. Therefore, only the feature data of the first 9 washing records can be obtained and shown in Table 4.
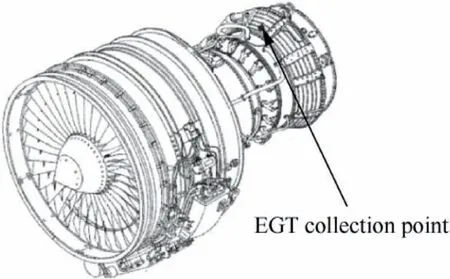
Fig. 10 EGT collection point of Aero-engine.
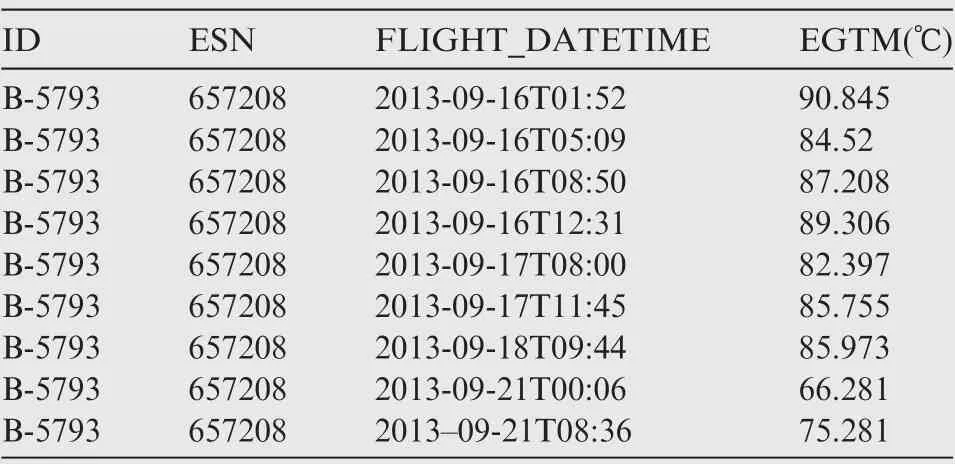
Table 1 OEM data.
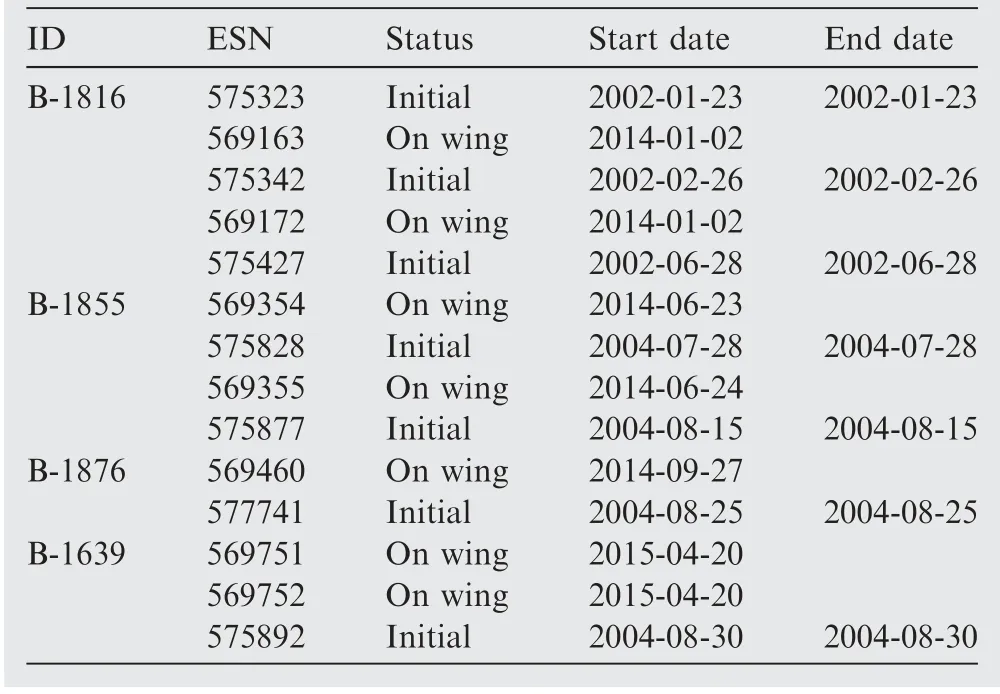
Table 2 Disassembly and assembly records.
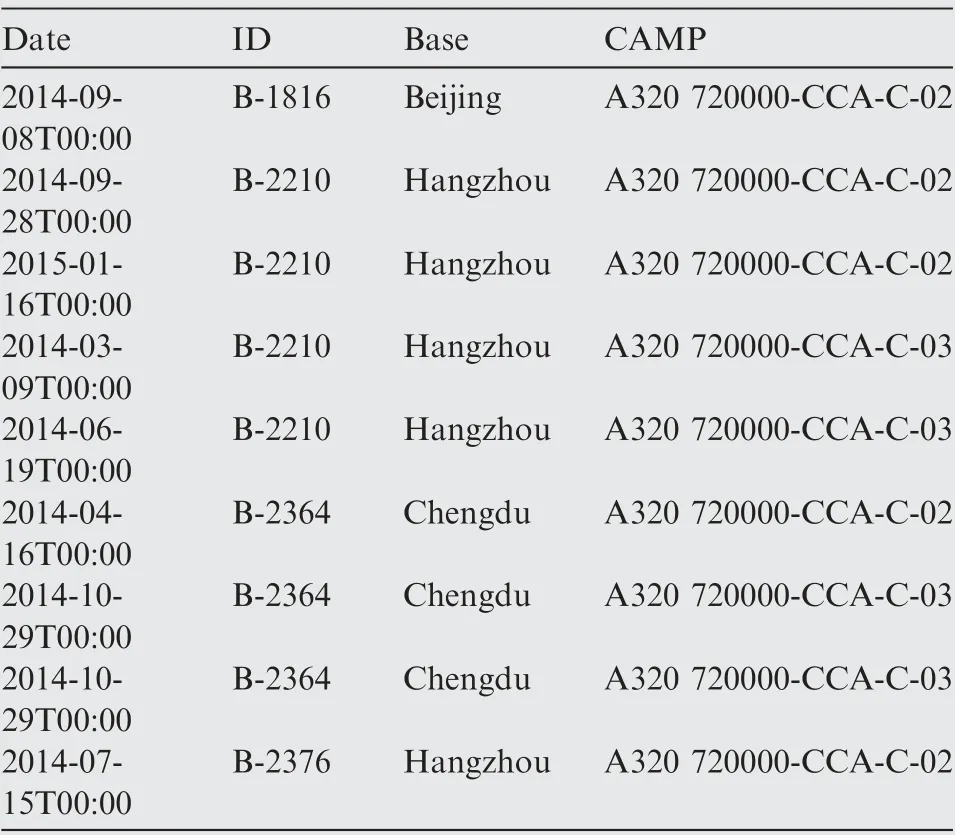
Table 3 Washing records.
4.2. Validation of EGTM step parameters prediction
4.2.1. Control group model setting
The experiment is completed in the Python environment, and the CPU platform is Core2 Duo@2.80 GHz. The control group model takes the relatively complete engine data as the prediction object,takes 1476 data from the factory to the fifth washing as the learning sample, and forecasts 227 data after the fifth washing.To prove the effectiveness of the step parameter prediction method,other models in the control group will directly learn the historical EGTM data to predict the data after washing. The washing data consist of 0 and 1, where 1 indicates that washing was performed before the flight. 0 means not. Table 5 shows some of the data. In order to improve the prediction accuracy of the model, EGTM and flight cycle data were normalized. The flight cycle data and washing records are combined into two-dimensional data as input data and EGTM as label data.
Due to the limitation of space, we have uploaded a set of relatively complete real data from CFM56-5B engine for readers to study. Please visit: https://github.com/Maris123571/EGTM-data/archive/main.zip
(1) LSTM model
LSTM refers to a variant of the recurrent neural networks,which are often used to process time series data.The prediction object of this project is EGTM with hundreds of cycles after washing, belonging to medium and long-term prediction.Therefore,LSTM is selected as the comparison.Fig.13 shows an LSTM cell structure.If the cell output is h and the cell state is c, then hand care the previous outputs, and hand care the current outputs.σ and tanh denote the activation functions sigmoid and tanh.
LSTM model parameters are initialized with reference to Ref.. The input data and the output data determine that the dimension of the input data is 2 and the dimension of the output his 1. Since the engine is to perform a weekly inspection, the stack number of LSTM is set to 6. No method can be used to determine the hidden number dimension of LSTM, which can be determined by Eq.(30):
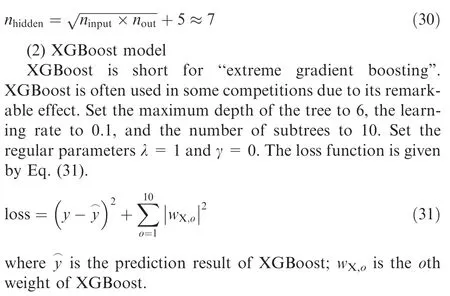
(3) KELM model
The Radial Basis Function (RBF) is selected as the kernel function of the KELM model. Since there is no need to set the number of hidden layer nodes of the model, the instability caused by the initial weight and bias of the hidden layer can be avoided. The only parameters that need to be determined include the regularization coefficient C and the kernel parameter P.In order to achieve the best performance of KELM,the paper employs Particle Swarm Optimization (PSO) algorithm to determine the optimal parameters as C = 0.11 and P = 500.
(4) Step model prediction model
Because the length of the fully-recorded washing record is 10,the experiment arranged the first nine data as training data and the last one as test data. The data from other engines are sorted into 9 data groups as training samples for transfer learning. For the TPNN of the step model prediction model, the input node is set to 3, the input length to 9, and the output node to 2. In addition, the number of hidden layer nodes is determined by Eq. (13) as 3.
4.2.2. Predicted results
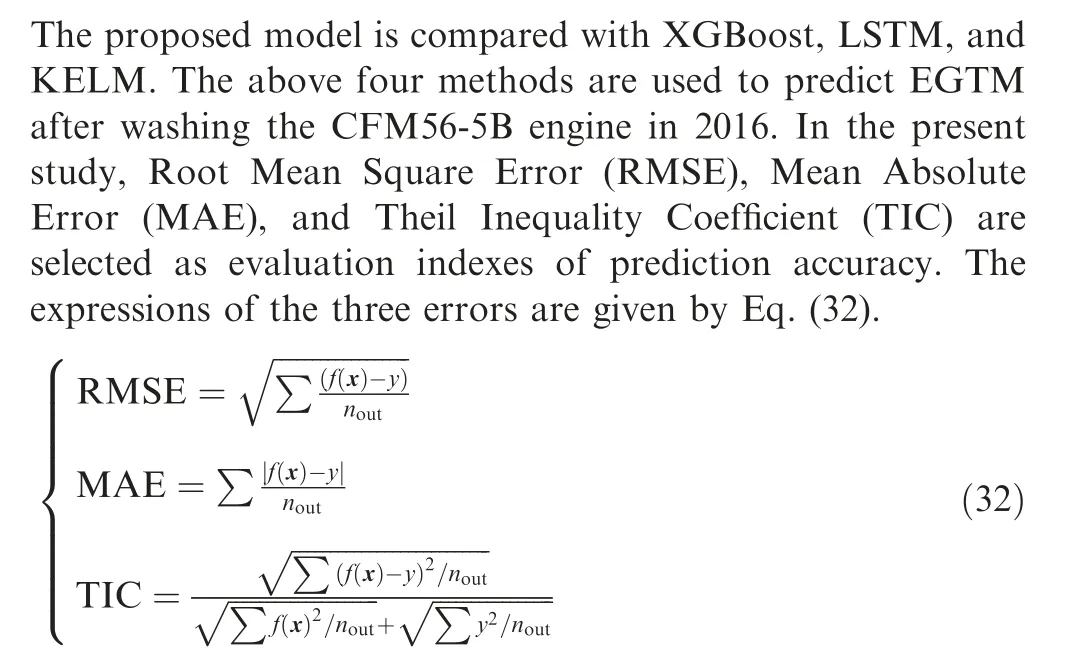
The values of RMSE, MAE and TIC are compared in Table 6.
Fig. 14 presents the EGTM prediction results of all four methods. The figure contains the real data of EGTM and the prediction data of all prediction methods.
Based on Table 6 and Fig. 14, although the output of LSTM has a step,it shows a large error.This reflects the cumulative effect of long-term prediction errors of the LSTM model,causing large errors at a later stage. Each washing means that the engine system working condition changes. The LSTM model trained by the data under previous working conditions could hardly accurately predict EGTM data under the new working conditions.
The output of XGBoost and KELM is close to a straight line, and neither the amount of step after washing nor the declining trend after washing is predicted. It shows that XGBoost and KELM can only expand the trend of previous data to predict the future data, and can not mine the impact of washing events on the data. Additionally, this also reflects the weak long-term predictive ability of XGBoost and KELM.
The step parameters prediction model uses TPNN to predict data parameters and then calculates EGTM data after washing with data parameters. The model can evaluate the trend of engine EGTM data in a large time span,thus providing important reference value for making long-term engine maintenance planning.
The residual normal probability plot and residual histogram are tools used to verify the accuracy of the model.The residual normal probability plot is also used to test the normal distribution of residuals.In the standard case,the normal probability graph is a straight line, as shown by the red dotted line in Fig. 15(a). The points are approximately near the red dotted line, which indicates that the points approximately obey a normal distribution.
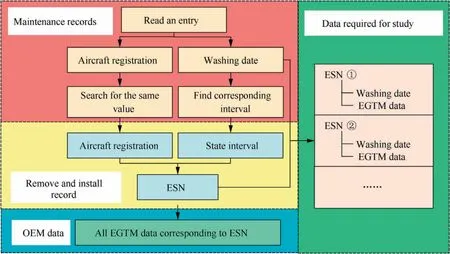
Fig. 11 Extraction process of data needed in this study.
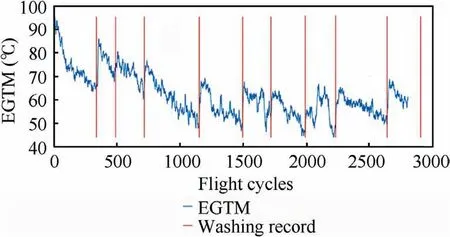
Fig. 12 EGTM data (blue line) and washing record (red line).
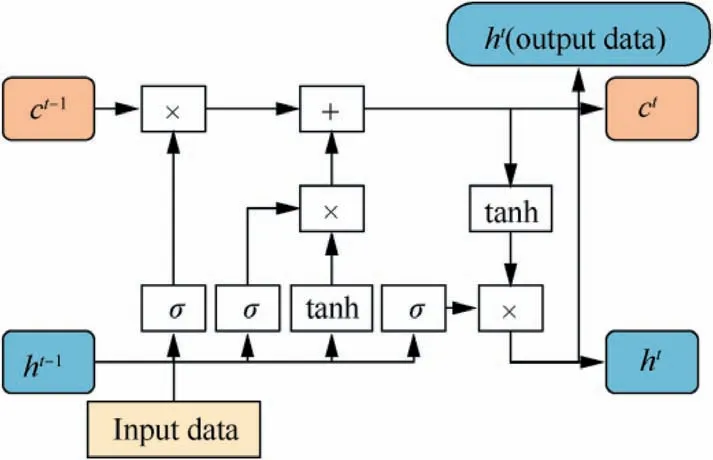
Fig. 13 LSTM structure.
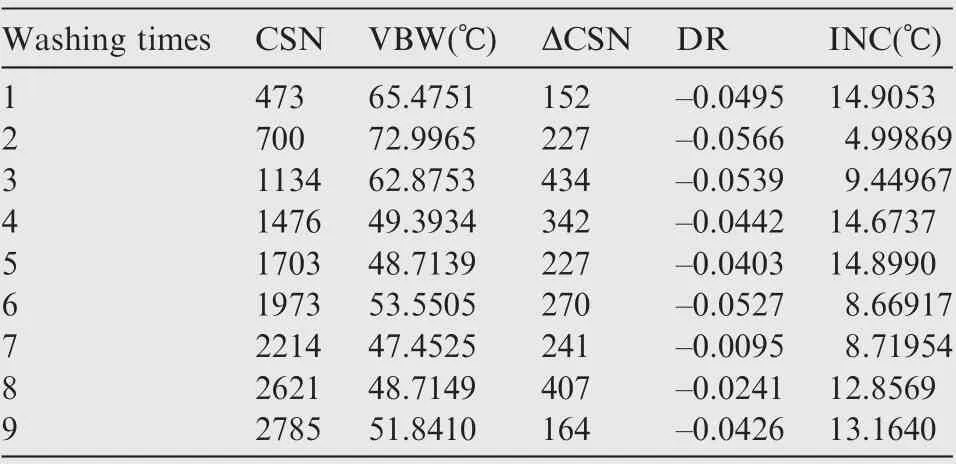
Table 4 Data parameters.

Table 5 Data used by participating models in control group.
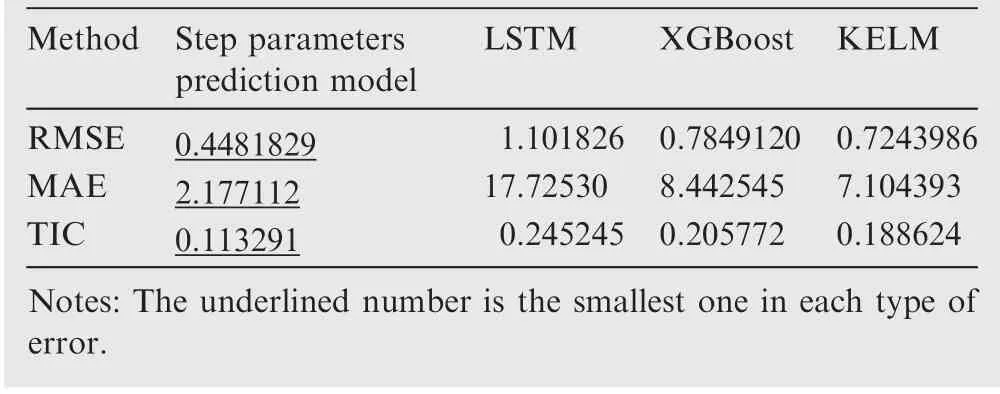
Table 6 Prediction errors of methods.
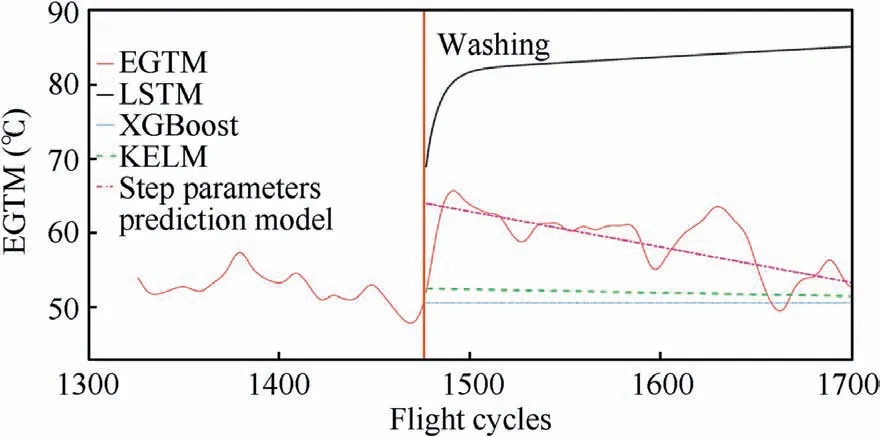
Fig. 14 Prediction results of four methods.
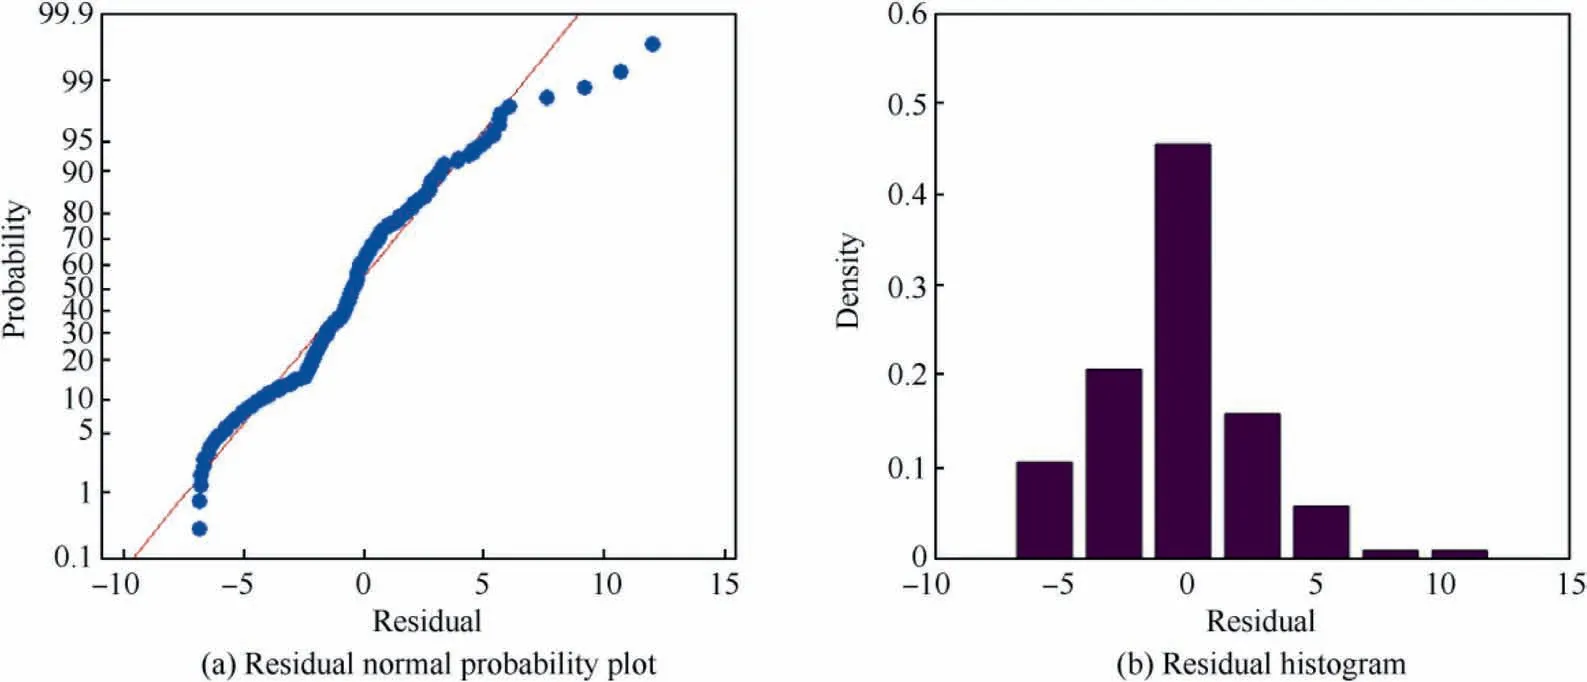
Fig. 15 Residual error of data parameter prediction model based on TPNN.

Table 7 Features prediction errors of three methods.
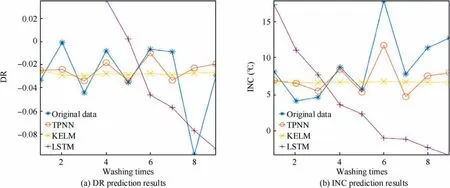
Fig. 16 Prediction results of three models.
The residual histogram is shown in Fig. 15(b). It is used to reflect the distribution of residuals.It can be observed from the figure that residual distribution is basically in line with normality.The residuals are basically distributed in horizontal stripes of equal width on both sides. Therefore, the model fits the data well.Obviously,the step parameters prediction model fits well.
4.3. Validity verification of TPNN
This section highlights the irreplaceability of TPNN in the step prediction model by comparing TPNN with LSTM and KELM. In the current section, DR and INC data in Table 4 are used as prediction objects. For the TPNN model and LSTM, the input node is set as 3, the hidden node is 3, and the output node is 2. For KELM, the optimal parameters determined by the PSO algorithm are C = 0.26 and P = 10.
TPNN are transfer process neural networks for step changes parameters prediction.With the data in Table 4 as test data and other collected data as training data, TPNN are trained with transfer learning training strategy presented in Section 3.The RMSE,TIC,and MAE of the KELM method,LSTM method as well as TPNN to predict (INC, DR) can be found in Table 7, where the underlined numbers indicate the optimal result of the prediction methods for a single parameter. In addition, Fig. 16 shows the prediction results of the three methods for (INC, DR).
There is a large error in LSTM and thus the LSTM curve is not completely shown in Fig.16.The reason is that the LSTM model contains many parameters. Therefore, it can not train well in the case of insufficient data. In the current task, the input node n= 3, the output node n= 2, and the hidden layer node n= 3. The number of LSTM parameters is given in Eq. (33):
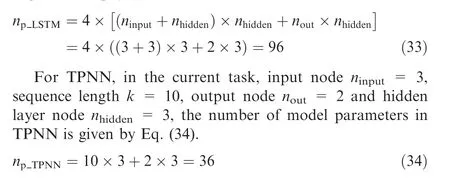
The number of TPNN model parameters is smaller than LSTM. The total sample size included in this prediction task is only 281 × 5 = 1405, which is not enough to train the LSTM while it can support the training of TPNN. Therefore,the prediction accuracy of TPNN is higher than that of LSTM in this task.
Table 7 shows that the TIC error of KELM predicting INC is smaller than that of TPNN and other errors are very close to TPNN. However, Fig. 16 shows that the output of KELM is close to a straight line, indicating that KELM could hardly effectively reflect the trend of real data. In contrast, the trend of TPNN predicted data is closer to the real data with a higher fitting degree than KELM.
The data predicted by TPNN is close to the real data.TPNN is the extension of neural networks in the time domain with the ability of time series prediction such as LSTM.The TPNN needs less sample size than LSTM, possessing the ability of obtaining sufficient prior knowledge from the source domain. When training in the target domain, the loss function is used to avoid the problem of over fitting.Therefore, the TPNN is most suitable for parameters prediction in this study.
5. Conclusions
To conclude, step change parameters prediction model is proposed to estimate the EGTM after washing.Instead of directly extending the EGTM data, the model concentrates on analyzing the changes of data. With CFM56-5B aero-engine data as samples, the performance of the proposed model is compared with LSTM,XGBoost,and KELM.The results show that the step change parameters prediction model can accurately predict the EGTM after washing.
TPNN is proposed to predict the step change parameters of the above-proposed methods. Firstly, the model is trained in not full-recorded samples with large-scale. Then, the trained model is transferred to the full-recorded sample set and finally transferred to the sample training from target aero-engine.TPNN can be trained well with only a few samples. The prediction accuracy of TPNN is higher than that of LSTM and KELM in the case of 281 samples.
EGTM reflects the overall performance of the engine.If it is of necessity to reflect the engine performance more comprehensively, N, high pressure rotor speed (N), Pressure Ratio(PR),and other parameters can be added for parameter fusion analysis.However,the present study is not to make the health status assessment of aero-engine based on multi-parameter fusion, but to evaluate the step change and the decline rate of EGTM data after washing. The model proposed in this paper can be used to predict the change of multi parameters sensitive to water washing events, such as fuel flow,fan vibration, Nand N. Then, the multi-parameter changes are fused to comprehensively evaluate the engine performance changes after water washing. Moreover, the current work will provide a theoretical basis for engine maintenance, which is also our work to be carried out.
The authors declare that they have no known competing financial interests or personal relationships that could have appeared to influence the work reported in this paper.
This study was supported by the National Natural Science Foundation of China (No. 1733201).
