Effects of sweep angles on turbulent separation behaviors induced by blunt fin
Dundian GANG, Shihe YI, Feng ZHANG, Haibo NIU
College of Aerospace Science and Engineering, National University of Defense Technology, Changsha 410072, China
KEYWORDS Blunt fin;Flow separation;Hypersonic turbulent boundary layer;NPLS;SIFT
Abstract An experimental study was conducted on turbulent separation behaviors induced by blunt fins with different sweep angles at Mach number 6.0. The Nano-particle based Planar Laser Scattering technique(NPLS)was applied to visualize the flowfield,complemented by pressure tests.Sweep angles of the fins were 10°,20°,...,60°,with the same leading edge diameter of 10 mm. Fine structures of the interference flowfield induced by blunt fins have been obtained,including the shock systems and vortexes.It was found that the features and shapes of the detached shock depended on sweep angle.When sweep angle<50°,the detached shock appeared as the form of trailing shock,and the supersonic jet with its reflection could be observed.The detached shock would be curved for the 50° and 60° fins and became a transmitted shock. The Scale-Invariant Feature Transform(SIFT) was successfully applied to obtain the velocity field from NPLS images, and the extent of the separated region was found to decrease with increasing sweep angle. No separation appeared as sweep angle>30°. Two peak values were detected on the centerline pressure distribution.The first peak did not rely on sweep angle, while the second peak value decreased with increasing sweep angle.
1. Introduction
As to hypersonic vehicles, the capability to withstand severe aerodynamic heating is one of the fundamental design requirements. The areas usually of most concern are in stagnation regions and, in the case of complex flows involving flow separation,attachment,for example,by ramps,fins,or jets used as vehicle control mechanisms.The fin-body junctions are particularly prone to flow separation because of the interaction of the fin bow shock wave with the boundary layer on the surface of the body.The interactions induced by a blunt fin in a hypersonic turbulent boundary layer are dominated by a threedimensional, highly unsteady shock wave structure, horseshoe vortex, and separation, as shown in Fig. 1.
Previous investigations on the problematic threedimensional behaviors associated with the hypersonic flow over a blunt fin have relied on taking surface measurements such as pressure, heat flux, or visualization techniques such as schlieren and surface oil flow.During the 1960 s—1970 s,NASA Langley Research Center studied the interference flowfield induced by blunt fins with different sweep angles and different heights.The pressure distribution results showed that increasing the sweep angle (Λ) of the fin would make the upstream extent of disturbed flow decrease sharply. As concluded from the experimental results of Dolling et al.,under the condition of turbulent boundary layer and fin interactions,there were two pressure peaks on the plate upstream of the fin,and the locations of the peaks were related to the diameters of the fin. The extent of the upstream disturbed flow increased linearly with fin diameter. Haq observed large heating of an unswept blunt fin on a flat plate with a turbulent boundary layer in a Mach number 6.2 flow. The leading edge of the fin was damaged by the excessive heating in the area near the triple point during the experiment.Quan studied the interactions of the supersonic turbulent boundary layer and blunt fins with sweep angles of 0°, 15°, and 30°, and the flowfield was visualized.Based on Particle Image Velocimetry (PIV)results, no separation was detected as to the fin with a sweep angle of 30°.
Researchers also used transducers with a high-frequency response to analyze the unsteady characteristics of the separation shock in front of the fin. Oil flow visualization with measurements of wall pressure and heat transfer was used to test the interactions of the blunt fin and turbulent flow by Wang et al.at Mach number 7.8.The results showed that the shock motion was a low-frequency movement, and most of the energy was concentrated below 5 kHz. Fluctuating wall pressure measurements have been made on the centreline upstream of the unswept blunt fin in a Mach number 5 turbulent boundary layer by Brusniak and Dolling.It was found that local fluctuating wall-pressure was due to distinct pressure distribution,undergoing a stretching and flattening effect.Fox studied the separation in front of the unswept fin using Planar Laser-Induced Fluorescence(PLIF)in the shock tunnel,and thermocouple measurements were made near the fin.The point of boundary layer separation, the angle of the separation shock,and the bow detached shock standoff distance were determined by PLIF results in the symmetry plane. Zhang et al. obtained the temperature distribution of laminar interactions induced by a 56° swept fin mounting on a plate by TSP.
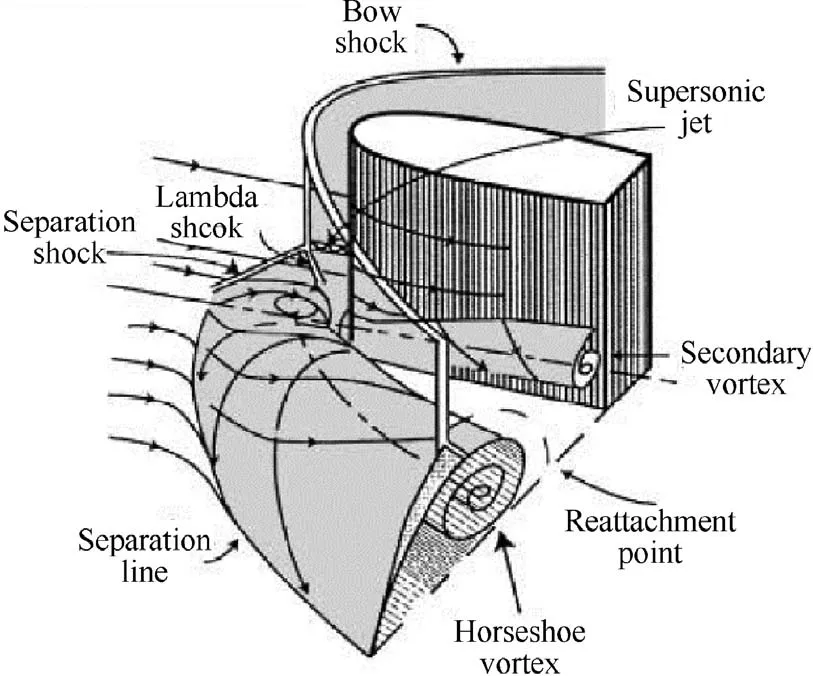
Fig. 1 Schematic diagram of hypersonic flow over a blunt fin.2
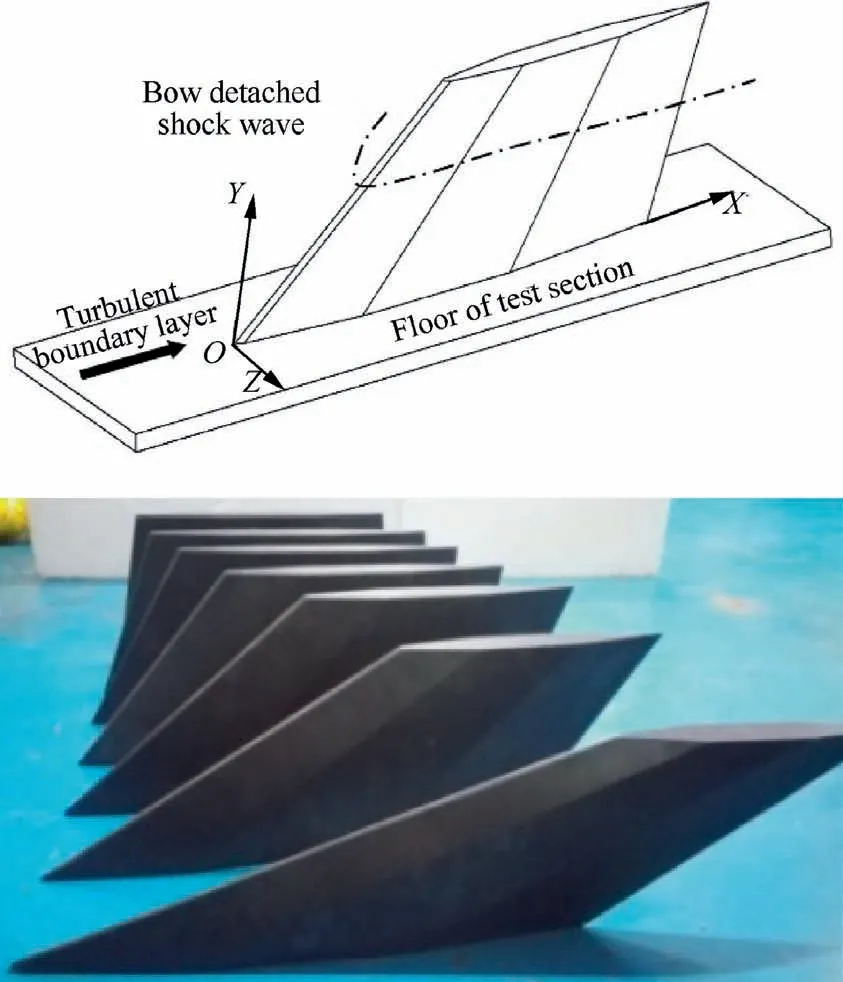
Fig. 2 Schematic diagram of model and picture of the models.

Fig. 3 Schematic diagram of NPLS system.
The blunt fin-plate junction with three different sweep angles of 0°,22.5°,and 45°was numerically simulated at Mach number 14 by Mortazavi and Knight using an MPI code.It was found that the extent of the separated region decreased with increasing Λ and decreased in the strength of the blunt fin shock wave. Localized high pressure formed at the reattachment point of the boundary layer by the formation of a reattachment shock wave, with its maximum peak decreasing with increasing Λ. Numerical simulations of a laminar blunt fin–plate interactions were reported by Houwing et al.. The simulations provided a reasonable prediction of the temperature field in the separation zone upstream of the fin and the overall flow characteristics in that region. A good agreement with PLIF results was shown.
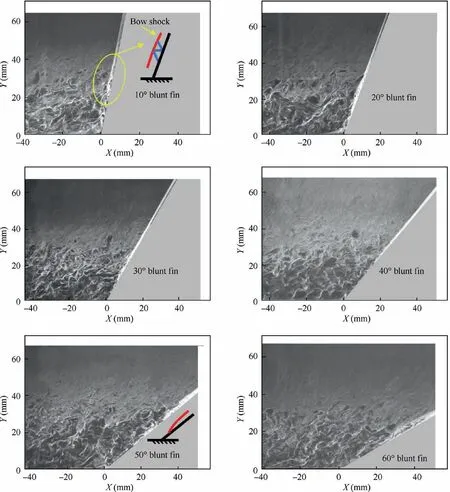
Fig. 4 NPLS images of blunt fins with different sweep angles.
Most of the studies focus on unswept blunt fin induced flow because it is the most typical situation,and other sweep angles will generate a similar flow structure. But the change in sweep angle will definitely greatly influence the whole flowfield.The main objective of the present experiments is to examine the separation characteristics and their correlations with sweep angles. The previous research showed that typical particle tracing-based methods would have following problems when applied to hypersonic flow, while technologies such as schlieren and oil flow were limited by lower temporal and spatial resolution. In the present study, the Nano-particle based Planar Laser Scattering technique (NPLS) is applied to visualize the interference flowfield. The fine flow patterns near the separation region have been clearly distinguished with a high spatial–temporal resolution, and the pressure distribution of the interaction zone has been obtained. Scale-Invariant Feature Transform (SIFT) algorithm is applied to obtain the velocity field based on NPLS images, and separation characteristics of fins with different sweep angles are analyzed.
2. Experimental facility, model, and apparatus
The experimental tests were carried out in a Mach number 6.0 hypersonic blow-down wind tunnel at National University of Defense Technology. The test section is 260 mm by 260 mm in cross-section and is essentially a parallel wall extension connected to the nozzle exit. In the experiment, the total pressure of the wind tunnel was 2.3 MPa, and the total operating temperature was 425 K,corresponding to a unit Reynolds number of 2.6×10/m. This tunnel has an operation time over 30 s,and the optical windows on the test section walls allow flow visualization.
The schematic diagram and the picture of the models are shown in Fig. 2. The blunt fin was mounted on the floor of the wind tunnel. The turbulent boundary layer developed naturally on the wall without the use of trips. In the present research,six blunt fin models are studied,and the sweep angles Λ are 10°,20°,....,60°,with the same leading edge diameter of D=10 mm.The heights of the blunt fins are all 220 mm,corresponding to a height-to-diameter ratio of 22, which is sufficient to be considered semi-infinite so that any increases in the height of fins would not affect the flow. Fig. 2 shows the coordinate system,the origin is at the root of the leading edge,the X-axis is along the flow direction,and the Y-axis is perpendicular to the bottom plate. Pressure holes were arranged on the floor around the blunt fin.
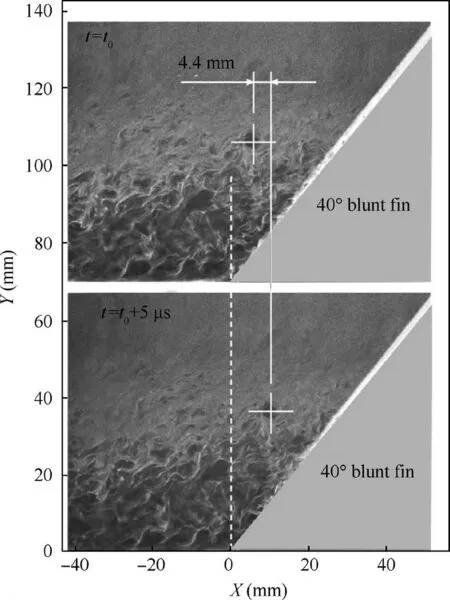
Fig. 5 Successive NPLS images of 40° blunt fin.
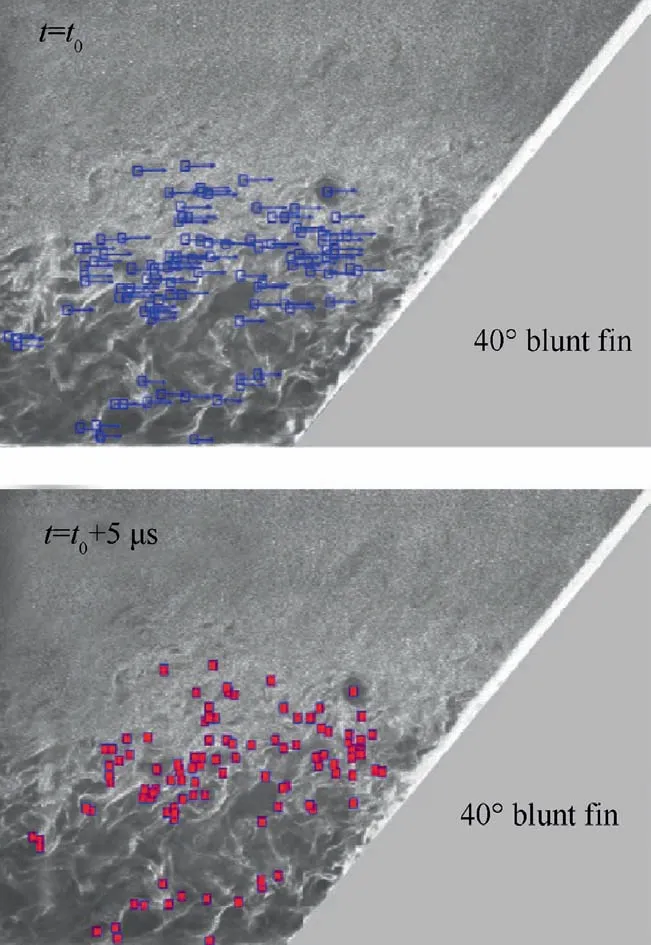
Fig.6 Matched keypoints of a pair of images and corresponding displacement vectors.
The NPLS technique is used to study the fine structures of the interference flowfield induced by blunt fins,and NPLS has been widely used in the visualization of supersonic and hypersonic flow.Fig.3 is the schematic diagram of the NPLS system, and this technique utilizes nano-particles as tracers,having an excellent following ability. There is a certain relationship between the grayscale of the NPLS image and the density of the local flowfield. In the qualitative analysis, it can be considered that the higher grayscale corresponds to a larger density of the local flow.The pulse energy of the Nd: YAG laser was 350 mJ with a pulse width of 6 ns, and the resolution of the CCD camera was 2448×2050 pixels. A synchronous controller controlled the camera and laser. The pressure distribution in the vicinity of the fin root was measured by a pressure scanner, with a sampling frequency of 100 Hz. Pressure data of 63 pressure holes at the center-tocenter spacing of 10 mm on the wall were measured.
3. Results and discussion
3.1. Flow visualization of hypersonic turbulent flow over blunt fins
The instantaneous flowfield upstream of blunt fins with different sweep angles was visualized using NPLS, as shown in Fig. 4. Due to the excellent scattering characteristics and following ability of nano-particles, the detached shock and the vortex structures are clearly observed. Within this region, the turbulent boundary layer thickness has no noticeable growth.The freestream region above the turbulent boundary layer is uniform, and the shocklets around the large-scale vortexes are hazy. In the area near the leading edge, the vortex structures in the upper layer have a tendency of ‘‘Climbing” along the leading edge. The detached shock does not extend to the root of the fin, and only reaches about Y=15 mm.
The detached shock wave of different patterns can be observed. Through comparisons of flowfield induced by fins with different Λ, it can be found that when the incoming flow is the fully developed turbulent boundary layer at hypersonic speeds,there is no obvious separation bubble,even if Λ is only 10°. The detached shock of the 20° blunt fin extends more in depth into the boundary layer than other fins. Theoretically,with increasing Λ, the size of the stagnation region would decrease, which means that the detached shock of the 50°and 60° fins would extend closer to the wall. Therefore, it can be speculated that the interference flowfield in front of the fins should be an obvious unsteady process, and there may be significant differences in the shock patterns at different moments.The unsteady flow structures and the effects of stagnation cause the bow detached shock to fluctuate all the time, and based on the results of Dollingand Zhuang and Lu,the bandwidth of the shock-foot-associated lowfrequency component is a few hundred Hz to several kHz.
Further, as to various Λ, it should be noted that the shock foot features are quite different, and the shapes that shock wave approaches to the wall change significantly.Fig.1 shows the shock patterns of the unswept blunt fin,the supersonic jet,and the triple point. Such structures can be visualized both experimentally and numerically.However, with increasing Λ, the pattern will be altered. Based on the high-resolution NPLS images,the detailed shock structures and the variations with different sweep angles can be detected.In Fig.4,the illustrations of 10° and 50° fins are specially denoted. When the sweep angle is less than 40°,the supersonic jet and the trailing shock system can be observed, and the detached shock stretches to the very near place of the root as a relatively straight line. However, as to 50° and 60° fins, the detached shock becomes curved near the root as a form of transmitted shock, as presented schematically in the NPLS image of the 50° fin in Fig. 4, which is similar in both supersonic turbulent interactions and hypersonic laminar interactions.
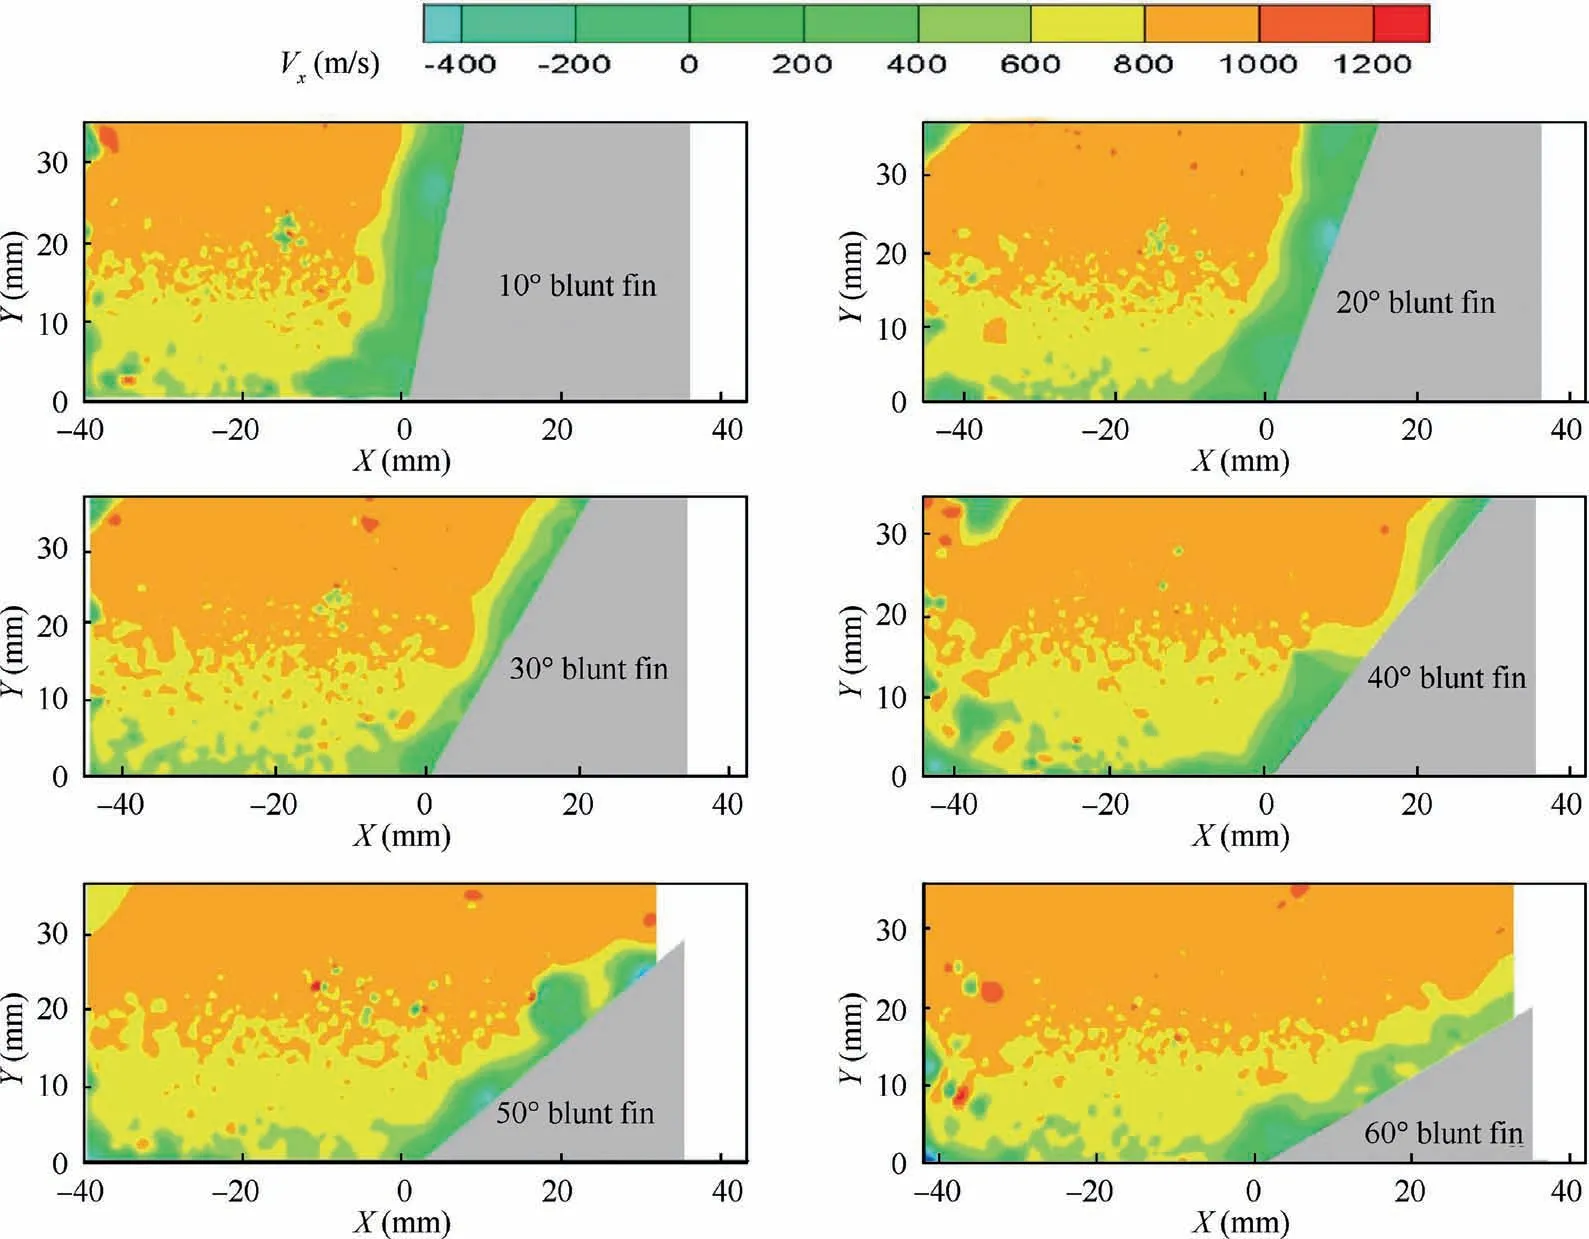
Fig. 7 Velocity contours (Vx) of blunt fins with different sweep angles.
3.2.Evolution characteristics of flow structures and velocity field
The evolution characteristics can be deduced from images taken during a short duration, as shown in Fig. 5. One image was taken at t=t,correspongding to one moment during the experiment,and the successive iamge was taken 5 μs later.The flowfield of the 40° blunt fin was captured in an interval of 5 μs, and the resolution was 0.154 mm/pixel. This paper only presents temporal-correlated NPLS image pairs of the 40°blunt fin due to similar behaviors of the blunt fin flow. In Fig. 5, the dotted line connecting the upper and lower images is marked as the origin to facilitate comparison. As shown in the figure, a vortex structure with clear edges and a large size is selected as a reference. During the period of 5 μs, the displacement is about 4.4 mm, and the freestream velocity is 866 m/s at the total temperature of 425 K. The displacement in the Y-direction is slight (pixel displacement generally less than 3 pixels). The moving distance is close to the theoretical prediction. From another point of view, the influence of the blunt fin on the upper turbulent boundary layer is relatively small, and the flow velocity in the upper layer is not significantly reduced.Since most of the mass flow will be‘‘bypassed”from both sides of the fin, the vertical velocity component in the symmetry plane is definitely small.
As to the change of flow structures around the leading edge,the motion dominates, and the deformation is much weaker.According to Mortazavi’s research of laminar interactions of blunt fins at Mach number 14,the separation region size of the 45°fin was only 10% of the unswept fin. Quan also found that when the sweep angle was larger than 30°, the separation region disappeared.Therefore, the vortex structures near the leading edge of fins with large sweep angles do not bear significant compression or shear and mainly suffer from the stagnation effects.
Although the speed can be calculated by visually recognizing the featured structures, this approach is challenging when the amount of data is large. Scale-Invariant Feature Transform (SIFT) is a computer vision algorithm first published by Lowe in 1999.It can be used to detect and describe local features in the image. It searches for extreme points in spatial scale and extracts their position,scale,and rotation invariants.Based on the large number of high-quality image pairs acquired by the NPLS technique, the featured structures with relatively little change in size and shape can be distinguished automatically and matched between the image pairs. Furthermore, the displacement field and the velocity field can be obtained. The feasibility of SIFT-based velocity has been verified by Ding et al.. Compared to the traditional PIV technique, the synchronous acquisition of flow visualization results and the velocity field can be realized. However, one image pair can only obtain about 100 matched features in Fig. 5, corresponding to 100 velocity vectors that are not enough to analyze the flowfield. Therefore, the SIFT-based velocity can only perform statistical analysis based on a great amount of image data, and in this way, the average velocity field will be obtained.
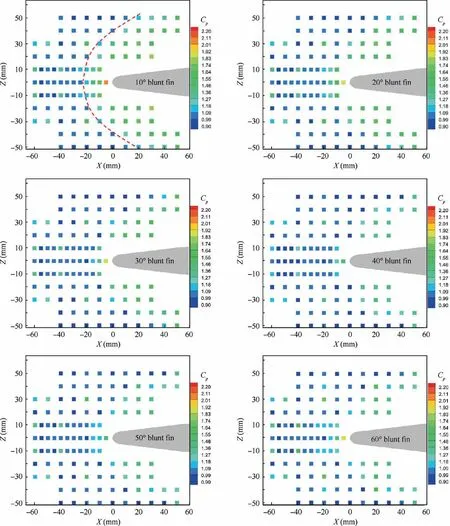
Fig. 8 Pressure coefficient distribution on surface of floor around fin.
As shown in Fig. 6, 125 keypoints are matched between a pair of NPLS images, similar to those shown in Fig. 5. The keypoints are marked with squares, and the blue arrows refer to the displacement vectors of the keypoints. Based on this,more than 100 vectors can be obtained in one image pair,and 50 effective image pairs can be acquired during each tunnel run. Therefore, the average velocity field can be calculated,which is quite meaningful to study the separation characteristics. However, there might be some deviation in the SIFTbased velocity calculation for recognizing points near the image edges, which deserves more attention during the analysis.
The average horizontal velocity Vfield of the interaction region of fins with different sweep angles are depicted in Fig.7.Each case is an average of about 4500 effective velocity vectors within an area of about 35 mm (height)×50 mm(width).Because the number of NPLS image pairs is not large enough and the interpolation method is applied, there is still some noise in the velocity contour. The low-speed stagnation region in front of the leading edge is clearly visualized in all images, while the 10° blunt fin has the largest area of low speed. As to all cases, the thickness of the boundary layer keeps relatively stable, having a typical value of about δ=15 mm.When attention is paid to the root area,it is found that the 10°and 20°fins have a separation region that stretches to as far as X= -10 mm (1D) upstream.
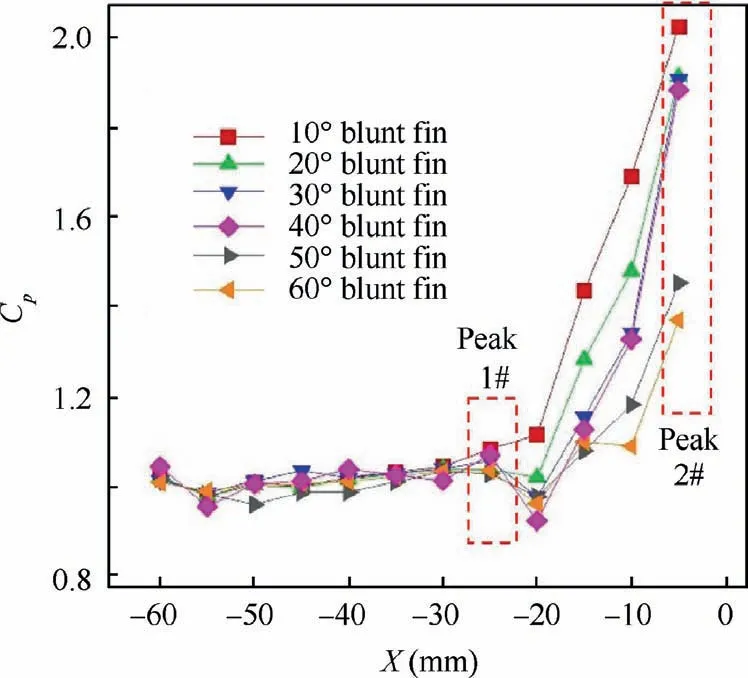
Fig. 9 Normalised pressure distribution on centerline.
With Λ increasing,the adverse pressure gradient tends to be weaker, so the separation region upstream of the leading edge of the fin will be smaller. The fins with larger Λ, for example,30°and 40°blunt fins,do not present any separation based on the velocity field, and these results are consistent with the results of Quan at Mach number 3.0 based on PIV.
3.3. Pressure distribution in interaction region
As shown in Fig. 8, the pressure coefficient Cdistribution around the fins on the wind tunnel floor is plotted. The pressure scanner has an uncertainty of 0.05%. The range is-100–100 kPa, which means that the maximum absolute error is less than 50 Pa. The 63 pressure holes were arranged on one side of the fin.As a result,the data is mirrored on both sides of the symmetry plane to improve the image understanding. The pressure hole nearest to the fin is 5 mm (0.5D) from the leading edge. The pressure coefficient here is nondimensionalized by the value obtained without the influence of the fin. In Fig. 8, the interaction region and the locations of the horseshoe vortex can be depicted, as presented by the red dotted line in the pressure distribution of the 10° fin. The fin with a smaller sweep angle shows a more robust influence on spatial scale and amplitude. Out of the symmetry plane at Z=40 mm (4D), the pressure coefficient of the 10° fin is still around 1.5,while the value is less than 1.1 compared to the 60°fin. As to the present study, which has the same leading edge diameter, the intensity of the horseshoe vortex is strongly dependent on the sweep angle of the fin.Both the pressure data and velocity field prove that the fin with a sweep angle larger than 30°will have a weaker influence on the turbulent boundary layer, while as to the laminar boundary layer, this angle might increase to 45°.
The pressure on the centerline is plotted in Fig.9.There are two peaks for all sweep angles, and the first peak is located at X=-25 mm with dimensionless pressure reaching 1.1. The location of the first peak and peak value are not significantly related to the sweep angle,which is consistent with the pressure results measured at Mach number 3 by Dolling and Bogdonoff.The second peak is located at X= -5 mm, and the pressure peak value decreases gradually with increasing Λ. Based on the results of previous studies and the CFD results, it is found that the pressure peak of the blunt fin/ turbulent boundary layer interactions is significantly smaller than that of the laminar boundary layer.
Through the combined analysis of the present study, the results of Dolling and Bogdonoff,and the pressure measurements at Mach number 3.9 by Aso et al., the following conclusions can be deduced.(A)The first peak location is relevant to the leading edge diameter (about 2D in front of the leading edge) based on Aso’s results. It has no obvious relationship with the sweep angles based on the present study and results by Dolling. According to Wang’s opinions,the peak pressure increases with Mach number, but it does not apply to the present study.The reason might be that the boundary layer is fully developed turbulent on the tunnel wall, while the cases of Wang and Aso are developed on a flat plate with a limited length. (B) The second peak is located near the fin root, and the peak value is dependent on the sweep angles based on the present study and Dolling’s results. The fins with smaller sweep angles will generate higher peak pressure.
4. Conclusions
The current study aims to further advance the understanding of shock/ turbulent boundary-layer interaction induced by blunt fins with different sweep angles at hypersonic speeds.The interference flowfield was studied using the NPLS technique at Mach number 6.0, and the surface pressure measurements were performed.Flowfield images with high spatial and temporal resolution were obtained concerning six different sweep angles, making progress in revealing the separation characteristics induced by blunt fins. SIFT-based velocity was successfully applied to obtain velocity vectors around the fin root from NPLS images automatically. The main conclusions are as follows:
(1) With the change of sweep angles, the detached shock will present different features. When the sweep angle is larger than 50°, the shock will become curved in the form of transmitted shock. The detached shock will extend as a straight line as to fins with smaller sweep angles.
(2) The velocity field and pressure distribution show that,with increasing sweep angles, the size of the separation region will decrease.In the present study,the separation region can extend 1D upstream, and the 10° fin has the most massive separation.When the sweep angle is larger than 30°, separation will be much weaker, which can be validated by the velocity field and the pressure distribution.
(3) The double-peaked mean wall pressure distribution exists in the centerline upstream of the blunt fin. The location and peak value of the first peak have no obvious dependence on the sweep angle. The second peak near the root has a much larger amplitude. The level at the second peak decreases with the increase of sweep angle. The maximum pressure of shock/ turbulent boundary layer interactions is significantly smaller than that of the laminar flow.
The authors declare that they have no known competing financial interests or personal relationships that could have appeared to influence the work reported in this paper.
This study was supported by the National Natural Science Foundation of China (No. 11902354).
