
Molecular subtypes based on DNA methylation predict prognosis in patients with renal clear cell carcinoma
2022-03-04 07:17:06XuDongZhuYangShenMingYangLongLongTangYuanYuanJiMengYuShengHuanZhangZhiYongQuHeSongYe
Medical Theory and Hypothesis 2022年1期
Xu-Dong Zhu,Yang Shen,Ming Yang,Long-Long Tang,Yuan-Yuan Ji,Meng-Yu Sheng,Huan Zhang,Zhi-Yong Qu,He-Song Ye*
1Department of Urology,The Second Affiliated Hospital of Nanjing University of Chinese Medicine,Jiangsu Province Second Chinese Medicine Hospital,Nanjing 210029,China.
Abstract Background:Tumor heterogeneity is closely related to the occurrence,progression and recurrence of renal clear cell carcinoma(ccRCC),making early diagnosis and effective treatment difficult.DNA methylation is an important regulator of gene expression and can affect tumor heterogeneity.Methods:In this study,we investigated the prognostic value of subtypes based on DNA methylation status in 506 ccRCC samples with paired clinical data from the TCGA database.Differences in DNA methylation levels were associated with differences in T,N and M categories,age,stage and prognosis.Finally,the samples were divided into the training group and the testing group according to 450K and 27K.Univariate and multivariate Cox regression analysis was used to construct the prediction model in the training group,and the model was verified and evaluated in the testing group.Results:By univariate Cox regression analysis,21,122 methylation sites and 6,775 CpG sites were identified as potential DNA methylation biomarkers for overall survival of ccRCC patients(P <0.05).3,050 CpG sites independently associated with prognosis were identified with T,N,M,stage and age as covariables.Consensus cluster of 3,050 potential prognostic methylation sites was used to identify different DNA methylation subsets of ccRCC for prognostic purposes.We performed functional enrichment analysis on these 3,640 genes and identified 75 significantly enriched pathways(P <0.05).We then researched the expression of methylated genes in subgroups.Verifing with the training set,suggesting that DNA methylation levels generally reflect the expression of these genes.Conclusion:Based on TCGA database and a series of bioinformatics methods,We identified prognostic specific methylation sites and established prognostic prediction models for ccRCC patients.This model helps to identify novel biomarkers,precision drug targets and disease molecular subtypes in patients with ccRCC.Therefore,this model may be useful in predicting the prognosis,clinical diagnosis and management of patients with different epigenetic subtypes of ccRCC.
Keywords:DNA methylation;renal clear cell carcinoma;TCGA database;prognostic prediction model;bioinformatics
Background
Clear cell renal cell carcinoma(ccRCC)is one of the most common urinary malignancies,accounting for 70%to 80% of renal cell carcinoma(RCC)[1].It originates from epithelial cells of proximal convoluted tubules and is easy to metastasize.Its pathogenesis is determined by environmental factors and genetic abnormalities[2].At present,the treatment of early kidney cancer is mainly through surgery,but early diagnosis is very difficult.About 33% of patients with kidney cancer have metastasis at first diagnosis,and 40% of localized kidney cancer will eventually develop distant metastasis[3].The prognosis of patients with metastatic renal cancer is poor,with most 5-year survival rates below 10%[4].Therefore,it is particularly important to reveal the potential tumorigenic mechanism of renal cancer and make early diagnosis.Recent studies have found that epigenetic regulation of genes plays a leading role in tumorigenesis and tumor progression[5].DNA methylation has attracted more and more attention in the pathogenesis,early diagnosis and prognosis of renal cancer.Most studies of the relationship between DNA methylation and renal cancer have focused on determining the relationship between CpG island or promoter region and Gene silencing changes in relation to each other.It mainly depends on the specific relationship between CpG methylation and gene silencing in renal cancer.
The discovery of reduced genomes in CpG island methylation established the first mechanism for tumor-specific epigenetic abnormalities,This suggests that hypomethylation of all CpG islands may induce genomic instability in tumors,This causes tumor genes to undergo evolutionarily selective stress,This results in promoter hypermethylation and tumor suppressor gene silencing[6].Many of the key tumor suppressor genes in tumors(e.g.CDKN2A,RASSF1A,MLH1,CDH1,etc.)are inactivated by promoter methylation.Studies have shown that the proportion of CpG island methylator phenotype(CIMP)in ccRCC is as high as 31%.Most CIMP tissues have tumor invasion and glycolysis activity[7].
The role of epigenetic abnormalities in ccRCC has been established[8].Bioinformatics analysis of microarray data has broad prospects and clinical significance.Therefore,the era of clinical application of methylation and methylation driver genes is bound to come.However,there is a lack of evidence to study methylation driver genes in ccRCC.The Cancer Genome Atlas(TCGA)enables it to meet the needs of scientists for deeper and more accurate exploration of diseases[9].It contains human genetic data,such as methylated differential genes,as well as various clinical prognostic information,complemented by bioinformatics techniques.So that we have a new understanding of the occurrence and development of cancer.Thus promoting the rapid development of the scientific field.This study collected TCGA(The Cancer Genome Atlas)open data to filter out differential methylation genes associated with ccRCC prognosis.Gene enrichment pathways were visualized and survival and co-survival analyses were performed to determine the relationship between methylation driver genes and patient survival.The aim of this study was to evaluate the relationships between methylation driver genes,gene sites and messenger RNA(mRNA)data in order to further understand the cancer mechanisms involved in methylation and provide valuable medical evidence for the treatment and prognosis of ccRCC.
Materials and Methods
The data
Methylation expression profile data and clinical data of ccRCC patients were downloaded from TCGA[9],including data of 537 ccRCC tumor patients,including 506 ccRCC samples with paired clinical data.The extracted clinical data included overallsurvival(OS),age,sex,tumor grade,T stage,and pathological grade.450K and 27K arrays of ccRCC methylation were downloaded from UCSC Xena[31],corresponding to the methylation data of 300 and 213 patients,respectively.Only samples with clinical follow-up of more than 30 days were included.The level of methylation at each site is indicated by a beta value ranging from 0(unmethylated)to 1(fully methylated).CpG sites with missing data were excluded from the analysis.The remaining data unavailable(NAs)sites use KNN reckoning procedures.The ComBat algorithm in SVA R package was used to eliminate batch effect by integrating all DNA methylation array data and fusing batch and patient information[32].Unstable genomic loci,including CPGS and single nucleotide polymorphisms in sex chromosomes,were removed.Since DNA methylation in the promoter region strongly affects gene expression,CPG in the promoter region was specifically detected.The promoter region was defined as 2 kb upstream to 0.5 kb downstream of the transcription start site.Finally,samples with available gene expression profiles were selected.A total of 424 samples and 21,122 methylation sites were included in the subsequent analysis.The samples were divided into two cohorts:a training set(data from HumanMethylation 450 BeadChip)and a testing set(data from HumanMethylation 27 BeadChip).
COX proportional risk regression model was used to determine the classification characteristics
In the samples used in this study,the ccRCC molecular subtype may affect the prognosis,so the CpG sites that significantly affect the survival rate were classified as features.First,univariate COX proportional risk regression model was constructed using methylation level,T,N,M,age,stage,sex and survival data of each CpG site.Secondly,significant CpG sites in univariate COX proportional risk regression model were introduced into multivariate COX proportional risk regression model as covariables,as T,N,M,age and stage were also significant in univariate model.Finally,CpG sites that were significant in univariate and multivariate Cox regression analysis were selected as characteristic CpG sites.
Consensus clustering was used to identify molecular subtypes associated with prognosisConsensusClusterPlus package in R is used for consensus clustering to identify ccRCC subgroups based on the most variable CpG sites[33].The algorithm first carries out sub-sampling of some items and features in the data matrix,and each sub-sampling is divided into maximum K groups by Kmeans.The number of times the process repeats as specified by the user;these multiple clustering algorithm runs are used to establish consensus values and evaluate the stability of the determined clustering.Paired consensus values,defined as clusters run in proportion to the two items that are combined together,calculated and stored in a consensus for each K-matrix.Then,for each K,the final condensation of the hierarchical cluster uses the distance 1 consensus value to complete and trim to the K group.The algorithm applies a given clustering method to a subset of random data and determines"consistent" clustering by measuring the stability of the clustering results.In each iteration,80% of tumors were sampled and k-means algorithm with Euclidean square distance measure was used.The results wentthroughmorethan100iterations.Afterexecuting ConsensusClusterPlus,we get the results of cluster consensus and Item-Consensus.The graphic output results include a heat map of the consensus matrix,which shows the clustering results,a consensus cumulative distribution function(CDF)graph,a Delta area graph,and allows us to determine an approximate number of clusters.The number of clusters was determined based on the following:the internal consistency of clusters was high,the coefficient of variation was low,and the area under the CDF curve did not increase significantly.In order to generate more detailed classification categories for ccRCC,a large number of categories are required.
The corresponding heatmap of consensus clustering was generated by Pheatmap R package.Consistent values from 0(white)to 1(dark blue)are described using a color gradient;the matrix is arranged in such a way that items belonging to the same cluster are adjacent to each other.Thus,a matrix corresponding to consensus clustering will display a color-coded heat map characterized by blue blocks diagonally on a white background.
Analysis of survival and clinical features
Kaplan-meier plots were used to illustrate the overall survival rates of ccRCC subgroups defined by DNA methylation profiles.Log-rank test was used to evaluate the significance of differences between clusters.Survival kits were used for survival analysis,associations between clinical and biological characteristics,and DNA methylation clusters were analyzed using a square test.All tests are double-sided,All tests were considered to be statistically significant(P<0.05).
Functional enrichment analysis and genome annotation
We used clusterProfiler package in R[34]combined with KEGG to conduct gene enrichment analysis on gene ontology,biological pathway and regulatory motif in DNA and protein genomes.
Construction and test of prediction model
A Cox proportional risk model was constructed using the coxph function of survival packs in R,which was based on methylation profiles and prognostic information of 4 CpG sites.The formula used for this model was:RiskScore= cg03032025*1.55764687213749 + cg06637893*1.68424986790803 +cg12128839*1.7933816877063+cg19547629*1.79032873332247.
Results
Identification of potential prognostic methylation sites associated with OS in training set patients
As described in materials and methods,21,122 methylation sites were identified after pretreatment of patient data(Supplementary Table 1,clinical information in Supplementary Table 2).We then divided the patients into training(Supplementary Table 3)and testing(Supplementary Table 4)data sets.Of 21,122 methylation sites,6,775 CpG sites(Supplementary Table 5)were identified by univariate Cox regression as potential DNA methylation biomarkers for overall survival in ccRCC patients(P<0.05).Multivariate Cox regression analysis was performed on 6,775 methylation sites(Supplementary Table 6)and 3,050 CpG sites independently associated with prognosis were identified with T,N,M,stage and age as covariables.
Consensus clustering was used to identify different DNA methylation prognostic subgroups and intercluster prognostic analysis
Consensus cluster of 3,050 potential prognostic methylation sites was used to identify different DNA methylation subsets of ccRCC for prognostic purposes.The number of clusters was determined according to the following criteria:the area under the Cumulative Distribution Function(CDF)curve did not increase significantly.The area under the CDF curve tends to be stable after 10 categories(Figure 1A and 1B).

Figure 1 The basis for determining the number of clusters.(A)Consensus among clusters for each category number k.(B)The Delta area curve of consensus clustering represents the relative change of the area of each category number K and K-1 under the cumulative distribution function(CDF)curve.The horizontal axis represents the number of categories K,and the vertical axis represents the relative change of area under the CDF curve.
We chose larger clusters where possible to maximize the prognostic value of ccRCC.A consensus matrix was used to help determine the optimal number of clusters.A well-defined ten-block structure is shown in the consensus matrix(K = 10)(Supplementary Table 7)in Figure 2A.Corresponding to Figure 2A,the heatmap annotated with T,N,M,stage,age and DNA methylation subgroups is shown in Figure 2B.

Figure 2 DNA methylation classification of consensus matrix and corresponding heat map.(A)Consensus clustering is applied to obtain the coding heat map corresponding to the consensus matrix k = 10.The color gradient represents a consensus value from 0 to 1;White is 0,dark blue is 1.(B)The heatmap corresponding to the consensus matrix were annotated with T,N,M,stage,age and DNA methylation.
Kaplan-meier survival analysis showed statistically significant difference in prognosis among the 10 groups(P<0.05).As shown in figure 3A,clusters 7 and 4 had the best prognosis,while cluster 10 had the worst prognosis.Then,we analyzed the intra-cluster proportions of the 10 clusters by T,N,M,stage and age,as shown in Figure 3B-3F.The correlation trend between features and specific clusters is as follows:Cluster 9 groups with lower T grade;Cluster 10 had lower N grade;Cluster 2 and 6 had higher M grade;Cluster 10 is in advanced stage;Cluster 10 with younger age.These results suggest that each clinical parameter is associated with a different intra-cluster ratio.

Figure 3 Prognosis among clusters of DNA methylation and intra-cluster ratios for each clinical parameter.(A)Survival curves for each DNA methylation subtype in the training set.The horizontal axis represents survival time(year)and the vertical axis represents the survival rate.Intra-cluster ratios for each clinical parameter.topography score(B),lymphocyte infiltration(C),metastasis Stage score(D),Stage score(E)and age(F).The horizontal axis represents the DNA methylation clusters.

Figure 4 Gene annotations of methylated sites.(A)GO biological process enrichment analysis of annotated genes for the CpG sites.(B)KEGG enrichment analysis.(C)Cluster analysis heatmap of Gene annotations of methylated sites.
Different features were identified based on DNA methylation clustering and clustering specific methylation sites were screened
The 3,050 CpG sites were annotated and a total of 3,640 promoter genes were identified.We performed functional enrichment analysis on these 3,640 genes and identified 75 significantly enriched pathways(P<0.05),as shown in figure 4A and figure 4B.The most significant biological process is regulation of cell cycle phase transition and associated with metabolic process and protein targeting.The three most significant enrichment pathway is Endocytosis,Salmonella infection and Human T-cell leukemia virus 1 infection.We then studied the expression of methylated genes in subgroups.In 294 training expression dataset samples,3,640 out of 3,050 genes had expression values.Heatmap of gene expression are shown in figure 4C and original data are shown in Supplementary Table 10.Different gene expression patterns were found in different subgroups,suggesting that DNA methylation levels generally reflect the expression of these genes.
Next,we screen cluster-specific methylation sites by taking methylation sites as cluster characteristics.The differences among nine clusters were analyzed according to each methylation site described in the materials and methods.Finally,the specific methylation sites are shown at Supplementary Table 11 and the heatmap is at Figure 5.Cluster 10 had the highest number of specific sites and the lowest methylation level among all clusters.

Figure 5 Specific hyper/hypo-methylation CpG sites for each DNA methylation cluster.Arrange the different groups in order along the horizontal axis,The vertical axis is the methylation site.Significant specific sites are indicated by red bars.The degree of methylation increases from blue to red.
Construction and evaluation of prognostic model for ccRCC
We chose cluster 7 as the seed cluster because it contained a certain amount of samples and had a good prognosis.Cluster 7 has seven specific methylation sites.The Cox proportional risk model was constructed using Training model based on the methylation profiles of seven specific sites and prognosis information.The results of ROC analysis using the calculated risk score for each sample are shown in Figure 6A.The area under the curve(AUC)is 0.714,indicating that the model runs well.The samples were then sorted into high risk and low risk according to the median risk score of the Training group to determine whether the methylation level changed systematically with the risk score,Hypermethylation is associated with high risk patients(Figure 6B).There was a significant difference in prognosis between the two groups(Figure 6C).
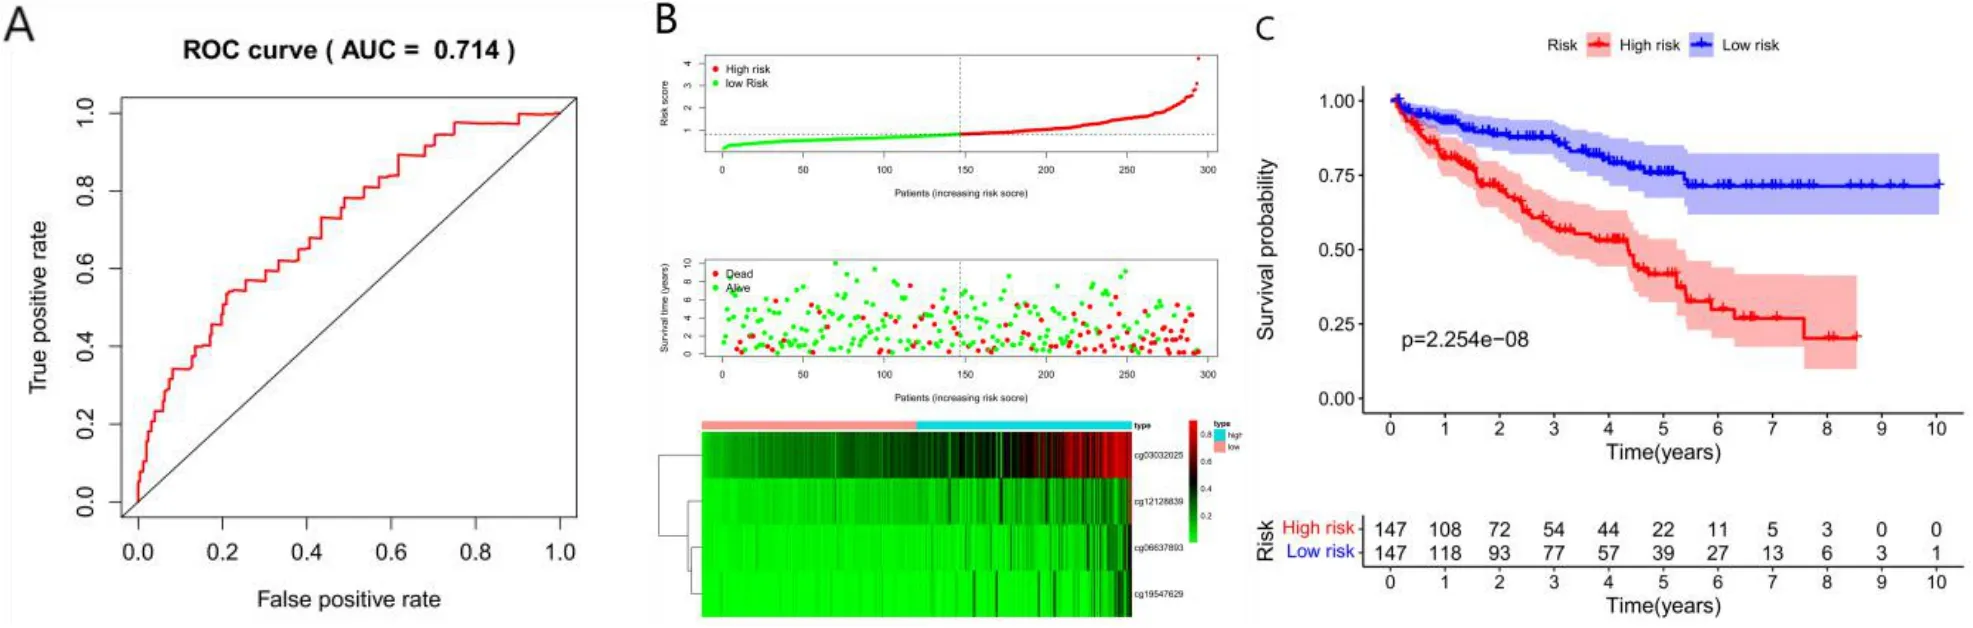
Figure 6 Construction of the prognosis prediction model for training group.(A)ROC curves of prognostic predictors in ccRCC patients.(B)The x-coordinate is the sample,The ordinate is the risk score(top),survival time(middle),and methylation site(bottom).(C)Analysis of prognostic differences in training sets.The numbers represent the number of survivors in the high and low risk groups(bottom).
Finally,prognostic model was used to predict the prognosis of patients in the testing group data set.The testing dataset obtained horizontal methylation profiles for four CpG sites,and risk scores were calculated using predictive models.The testing dataset sample was then divided into high and low risk groups,with the median value of the training group as the cut-off.The results of ROC analysis using the calculated risk score for each sample are shown in Figure 6A.The AUC is 0.687,indicating that the model runs well.Again,there was a significant difference in outcomes between the two groups(figure7B,7C,P<0.05).These results are in agreement with those obtained from the training data set,which proves the prediction accuracy and stability of our model.
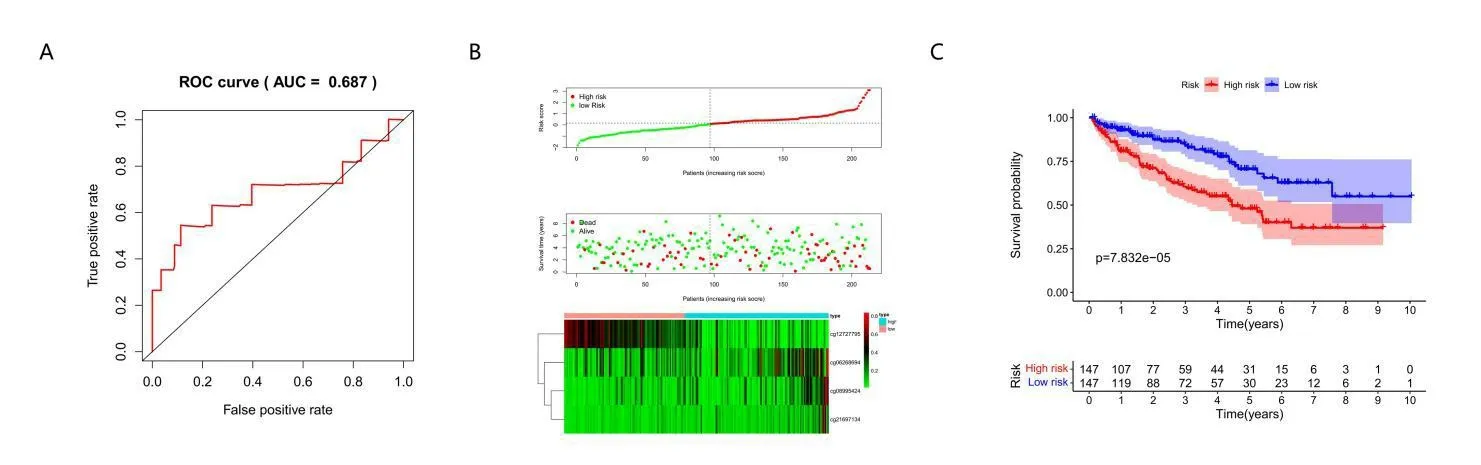
Figure 7 Accuracy and stability of the prognosis prediction model for testing group.(A)ROC curves of prognostic predictors in ccRCC patients of testing set.(B)The x-coordinate is the sample,The ordinate is the risk score(top),survival time(middle)and methylation site(bottom).(C)Analysis of prognostic differences in training sets.The numbers represent the number of survivors in the high and low risk groups(bottom).
Discussion
Traditionally,post-nephrectomy pathological reports have been used to determine tumor stage,nuclear grade,morphology and histology to predict progression and survival in patients with ccRCC[10].However,recent studies have shown that intra-tumor heterogeneity was involved in the occurrence and development of ccRCC tumors,leading to changes in cell proliferation,metabolic activity and tumor microenvironment of ccRCC[11,12].Therefore,clinicopathology may not be an accurate description of tumor characteristics,classification and prognosis of patient survival[13,14].At present,due to high-throughput sequencing technology,a variety of novel biomarkers have been introduced into clinical diagnosis and treatment[15-17].Epigenetic changes have been proved to be key to the regulation of gene expression and are closely related to the clinicopathology of various malignant tumors and other diseases[18-20].CpG island global DNA hypomethylation and regional DNA hypermethylation have been found in a variety of malignancies,which are related to gene expression and multiple positive and negative feedback mechanism interactions[21].Therefore,abnormal methylation of CpG sites could be selected as a new predictive marker for human cancers,including ccRCC.In this study,we identified four combinations of methylation sites associated with survival,genomic alteration,and tumor microenvironment in ccRCC patients and suggested that it may be an independent prognostic factor in ccRCC patients.
In this study,cg03032025 was found to be located at the corresponding S_shaore sites.cg12128839,cg06637893,cg19547629 is located at island site,and the genetypes of the four sites are proteincoding.It is generally believed that methylation of the promoter region can down-regulate the expression of corresponding genes.However,contrary to conventional understanding,our correlation analysis showed that methylation in some promoter regions was positively correlated with the expression of corresponding genes.This is consistent with the results of Spainhour et al[22],showing a large positive correlation(about 30%)between methylation and gene expression in 33 cancer types in the TCGA database.A partial role has been demonstrated,with HOXA5 being methylated 51.6% of the time in tumor tissue and 21% of the time in normal tissue.The protein up-regulates the tumor suppressor gene p53,and its methylated epigenetic silencing plays an important role in tumgenesis.The group with high methylation status had high Fuhrman's nuclear grade[23].The tumor suppressor gene MYRIP and its enrichment pathway(cytoskeletal remodeling_TGF,Wnt and cytoskeletal Remodeling)may be related to the occurrence of HCC,and are regulated by methylation of CpG site[24].Hypermethylation of the CPEB4 gene may be responsible for the downregulation of CPEB4 expression in HNSCC and result in tumorigenesis[25].
In vitro and xenotransplantation studies,hypomethylation agents have been shown to inhibit renal cell proliferation by reexpressing many tumor suppressor genes that are hypermethylated by enhancers/promoters[26,27].The overall effect of hypommethylation agents on ccRCC is tumor suppression by increasing the expression of a large number of tumor suppressor genes,although it may increase the expression of some tumor promoter genes simultaneously.Genome-wide hypermethylation in ccRCC contrasts with hypomethylation that is prevalent in other solid tumors,making hypomethylation agents and other epigenetic modulators,as well as emerging targeted therapies,potential therapeutic agents for ccRCC[28-30].
Although methylation may be an important biomarker in ccRCC,the exact methylation sequence in the promoter region of the affected gene remains unknown.In addition,the clinical and statistical significance of these gene methylations in relation to tumor classification,survival time and prognosis needs to be confirmed in a larger population of ccRCC patients.In this study,we sought to address these issues by developing a taxonomy that incorporates multiple DNA methylation biomarkers for prognostic assessment of treatment efficacy and to help guide treatment selection.This model can help identify new biomarkers,target precision medicine and classify disease molecular subtypes in ccRCC patients.This model also contributes to prognostic prediction,clinical diagnosis and management of patients with different epigenetic subtypes of ccRCC.However,there are some limitations in this study.First,the prognostic prediction model needs to be further validated in our own independent tissue samples.Second,in practice,the construction of predictive prediction models is much more complex and requires platforms or other tools.However,this study aims to explore the possibility of constructing a prognostic prediction model,which is still in the preliminary stage and needs to be further improved.Third,it is very difficult to judge optimal K under consensus.In summary,based on TCGA database and a series of bioinformatics methods,prognostic specific methylation sites were identified and prognostic prediction models for ccRCC patients were constructed.This model helps to identify novel biomarkers,precision drug targets and disease molecular subtypes in patients with ccRCC.Therefore,this model may be useful in predicting the prognosis,clinical diagnosis and management of patients with different epigenetic subtypes of ccRCC.
 Medical Theory and Hypothesis2022年1期
- Medical Theory and Hypothesis的其它文章
- Discussion on the treatment of amenorrhea by"Tihujiegai method"
- Treatment of male infertility from damp heat physique
- Research progress of Chinese and Western medicine on spastic cerebral palsy in children in recent ten years
- Discussion on the application of Ginseng efficacy from "Treatise on Spleen and Stomach"