Distribution Patterns of Synechococcus Indicated Their Environmental Constraints and Related Geochemical Processes in the Yellow Sea
ZHOUYuting, WANGTing, CHEN Xi, QIN Song, ZHAO Zhenjun, GUO Xinyi, and LI Jialin, *
Distribution Patterns ofIndicated Their Environmental Constraints and Related Geochemical Processes in the Yellow Sea
ZHOUYuting1), 2), #, WANGTing1), 3), #, CHEN Xi4), *, QIN Song1), 5), ZHAO Zhenjun2), GUO Xinyi1), and LI Jialin1), 5), *
1)Yantai Institute of Coastal Zone Research, Chinese Academy of Sciences, Yantai 264000, China 2) College of Life Sciences, Yantai University, Yantai 264000, China 3)College of Environmental Science and Engineering, Ocean University of China, Qingdao 266100, China 4) College of Marine Life Science, Ocean University of China, Qingdao 266005, China 5)Center for Ocean Mega-Science, Chinese Academy of Sciences, Qingdao 266071, China
is a widely distributed photosynthetic pico-phytoplankton, which contributes mainly to carbon fixation and maintains the stability of the marine ecosystem. To investigate its distribution patterns in the Yellow Sea, seawater samples were collected during September 2018. Results of flow cytometry analysis showed that theabundance ranged from 6.36× 10²to 4.51×10⁴cellsmL−1, whichcorrelated with salinity (<0.01) and temperature (<0.05). At deeper off-shore sites,showed high abundance at the subsurface thermo-halocline, which was in accordance with chlorophyll(Chl)content along the vertical column. Based on the high-throughput sequencing data ofC1 (partial gene encoding RNA polymerase), twosubclusters, S5.1 and S5.2, were found to coexist in the studied area. Several clades of S5.1, including Clades I, II, and III, were the dominant components, accounting for 6.63%, 26.11%, and 45.5% of the total genus, respectively. Redundancy analysis (RDA) showed that nitrite was the main environmental factor that explained the genus composition among samples. Furthermore, co-occurrence network revealed that the main phyla that coexisted withwere Proteobacteria, Bacteroidetes, Actinobacteria, Planctomycetes, and Verrucomicrobia, which were involved in the carbon (C), nitrogen (N), sulfur (S), and manganese (Mn) cycles. Overall,exhibited biogeographic distribution correlated with temperature-salinity and nitrite in the Yellow Sea, and their geochemical function showed diverse but should be further verified in the future.
;distribution characteristics; environmental constraints; co-occurrence network analyses; the Yellow Sea
1 Introduction
, a cyanobacteria 0.5-2.0μm in diameter, can not only respond rapidly to environmental changes, but also shows strong environmental adaptability owing to its simple cell structure (Scanlan., 2002; Zheng., 2018). Hence,is one of the most widely distributed phytoplankton in the marine ecosystem (Xia, 2019). In marine euphotic layer environments, the abundance ofranges typically between 10 and 106cellsmL−1, with the highest recorded abundance of 3.73×10⁶cellsmL−1in the upwelling area at the Costa Rica Dome (Saito, 2005) and the lowest of 50cellsmL−1occurred at the Atlantic Gateway to the Arctic Ocean (Paulsen., 2016).Marinealso shows rich genetic diversity. Phylogenetically, it can be classified into three subclusters, subcluster 5.1 (S5.1), subcluster 5.2 (S5.2), and subcluster 5.3 (S5.3).Each subcluster can be further divided into diverse clades, which occupied distinct niches (Scanlan, 2012). For example, Clade I of S5.1 is mainly distributed in polar and subpolar cold water regions (Paulsen, 2016), Clade II dominates warm water areas in the tropics and subtropics (Zwirglmaier, 2008), and Clade III branch is most common in oligotrophic waters (Farrant, 2016). Similar to those of other microorganisms,distribution is affected by environmental conditions. In the global oligotrophic sea area, temperature and nutrients were the main factors regulating the distribution ofassemblages (Sohm, 2016).
As a photosynthetic autotrophic prokaryote,contributes to approximately 16.7% of the global net primary production, promoting the global carbon cycle and energy flow (Flombaum, 2013). In addition to the carbon cycle,also participates in other biogeochemical cycles.can assimilate nitrogen, which is mainly regulated by NtcA [a transcriptional regulator which belongs to the CAP (the catabolite gene activator or cyclic AMP receptor protein) family] (Herrero, 2001).Although culture experiments have revealed its possible ecological functions (Muñoz-Marín, 2020), understanding the actual role ofin the field environment is a challenge owing to the rapid turnover and abundance of substances in the ecosystem (Zheng, 2018). The co-occurrence network based on high-throughput sequencing has been shown to be a useful method for identifying the correlated microorganismsand predicting the potential biogeochemical cycles that involved (Ma., 2016; Yang., 2019a).
The Yellow Sea is a typical semi-enclosed marginal sea with complex seasonal variations. In summer, most of the sea area has a double-layered structure in terms of temperature and salinity (Tang, 2000). The Yellow Sea Cold Water Mass (YSCWM) is an important and prominent hydrological phenomenon. It is a seasonal water mass appearing only in summer and is characterized by low temperature (<10℃), high salinity (>32.0‰) and abundance of nutrients (Xin., 2015). YSCWM also plays an important role in the distribution of bacterioplankton, which is mainly affected by water temperature in the vertical direction (Li., 2006).contributes primarily to total phytoplankton biomass in the Yellow Sea, which contributed to 58%, 77%, and 31% of phytoplankton biomass in May 2001, June 2001, and June 2002, respectively (Li, 2007). However, recent studies onin the Yellow Sea have mainly focused on its abundance distribution, but rarely on its phylogenetic composition (Wang., 2008; Qu., 2010; Bai., 2012; Zhao., 2019). It was aimed to investigate the characteristics ofin the Yellow Sea using flow cytometry and high throughput sequencing in this study. Redundancy analysis (RDA) was also used to investigate the relationship betweenassemblage composition and environmental factors. Furthermore, this study will act as a reference for predicting the geochemical processes that may involve.
2 Materials and Methods
2.1 Sample Collection and Determination of Environmental Parameters
Field sampling was performed at six sites of the Yellow Sea in September 2018 on Research Vessel Kexue III (Fig.1). At each site, samples were collected from standard depths according to the standard of GB/T12763.2- 2007. To determine the abundance of, five parallel samples of 1.40mL seawater was filtereda silk sieve with 48μm aperture into sterile cryopreser- vation tubes. After paraformaldehyde (final concentration, 0.5%) was added to the tubes, the samples were rapidly frozen in liquid nitrogen and stored at-80℃. For high throughput sequencing analysis, 1000mL seawater was filtered first with 48μm nylon mesh and then with 0.22 μm polycarbonate filter (Millipore Co., Bedford, MA, USA). The filter membranes were rapidly frozen in liquid nitrogen. Upon returning to the laboratory, the samples were stored at-80℃ for subsequent molecular experi- ments.
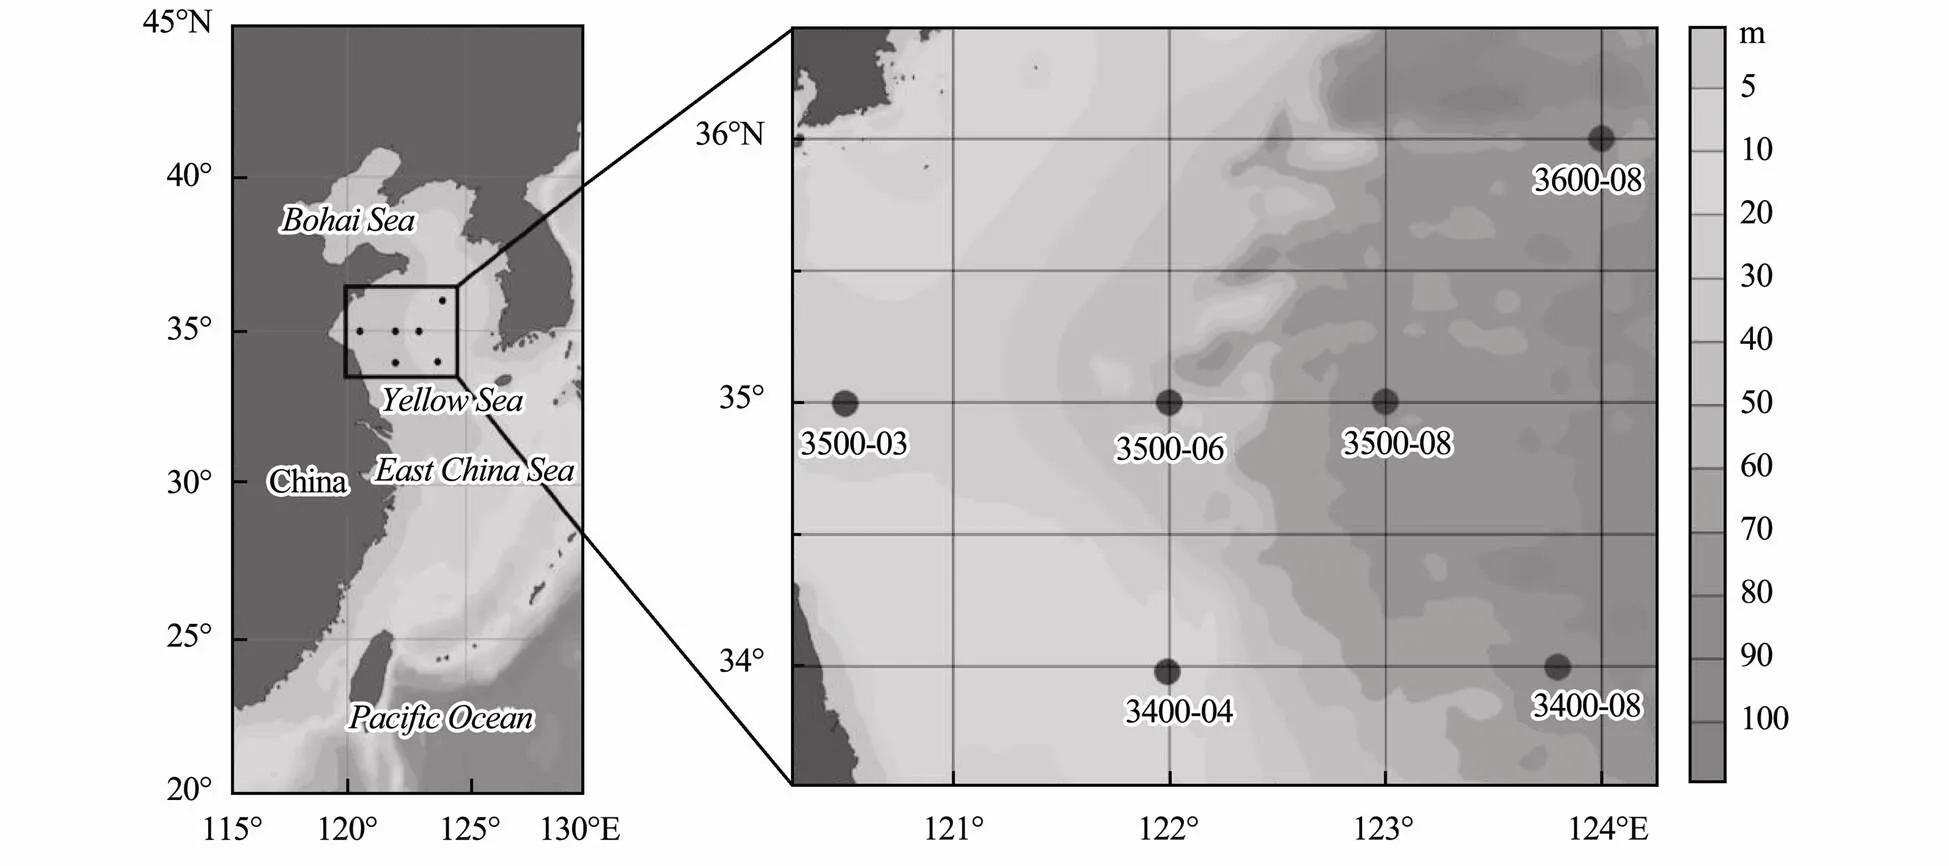
Fig.1 Sampling locations of the Yellow Sea in September 2018.
Temperature and salinity were measured using board- equipped CTD (Sea-Bird Electronics Inc., Bellevue, WA, USA). The nutrient concentration was determined using standard colorimetry with an AA3 segmented flow analyzer (Seal Analytical GmbH, Germany) (Dafner, 2015). The nutrients measured included NO3−, NO2−, NH4+, PO43−, DSi (dissolved silicon), DTP (dissolved total phosphorus), and DTN (dissolved total nitrogen). Chlcontent was measured on the boat with a sensor of Hydrolab MS5 (HACH, Loveland, CO, USA). The sample name was labelled as the site name, followed by the sampling depth suffix; for example, 3500-03-26 represented sample from the 26-meter depth of site 3500-03.
2.2 Abundance of Synechococcus
A flow cytometer (BD AccuriTMAria) equipped with dual lasers at 488nm and 635nm was used to analyze the abundance of(Picot, 2012). WinMDI 2.9 was used to collect, store, and analyze forward and right-angle light scattering and four types of fluorescence signals. Orange fluorescence representsphycoery- thrin (PE), and side scattering (SSC) is an indicator of cell size. Red fluorescence at 488 nm indicated the presence of Chl, whereas red fluorescence at 635 nm was from phycocyanin (PC) (Fig.3b). The sample loading time was 300 s, and yellow-green fluorescent microspheres (2.0 μm, Polysciences, Warrington, PA, USA) with final concentration of 1.1×10⁶cellsmL−1were added to each sample as an internal standard for counting.
2.3 DNA Extraction, Polymerase Chain Reaction (PCR), and Sequencing
Rapid DNA extraction kit (MP BIO, USA) was used to extract DNA from membrane samples. Agarose gel electrophoresis and the Nano Drop 2000c spectrophotometer (Thermo Fisher, USA) were used to assess the quality and concentration of the extracted DNA. The-specific primers, 39F (5’-GGNATNGTNTGYGAGC GYTG-3’) and 462R (5’-CGYAGRCGCTTGRTCAGCTT- 3’), targetingC1, were used for PCR using ABI GeneAmp®system 9700 (Xia, 2019).The DNA was first pre-denatured at 95℃ for 5 min and then subjected to 35 cycles of 30 s at 94℃, 30 s at 55℃ and 40s at 72℃, with final extension at 72℃ for 7min. The universal pri- mers, 515F and 806R, targeting the V4 region of the 16S rRNA gene, were used for amplifying prokaryotic seque- nces. The PCR products were recovered by Axy Prep DNA gel recovery kit (Axygen, USA). High throughput sequencing was performed at Meiji Biomedical Technology Co., Ltd. (Shanghai, China) using the PE300 Illumi- na-MiSeq sequencing platform.
2.4 Data Processing
The processing of high throughput data was based on the QIIME2 software (Bolyen, 2019). FastQC was used for quality control of the original FASTQ data (Brown, 2017). Nucleotide sequences shorter than 50bp were deleted before downstream sequence analysis (Caporaso, 2010). Usearch was used to extract non- repetitive sequences (Bokulich, 2013). Then, non- repetitive sequences (not including single sequences) were clustered into one unit according to 97% similarity, which was defined as an operational taxonomic unit (OTU). To obtain taxonomic information corresponding to each OTU, the OTUs were compared using the Silva database (Quast, 2012). Mothur v.1.30.2 was used for analyzing alpha diversity (Rogers, 2016). Considering the DCA (detrended correspondence analysis) axis length to be 1.47, redundancy analysis (RDA) was used to analyze the correlation between environmental factors andcompositions.
2.5 Co-Occurrence Network Analyses
Rare OTUs, less than 0.01% of the total number of sequences, were removed (Ma, 2016). Then, the psych software package in the R language was used to calculate the Spearman correlation matrix between the remaining OTUs. The correlation matrix of Spearman coefficient (|>0.6,<0.05) was selected, and Gephi v0.9.2 was used to construct a co-occurrence network (Bastian, 2009). The Fruchterman-Reingold layout algorithm was used to link and draw the various nodes of the network. The cycling of the corresponding elements regarding co-occurring microorganisms was derived from the FAPRO TAX database (Louca., 2016).
2.6 Nucleotide Sequence Accession Numbers
The paired-end Illumina sequencing data from this stu- dy were deposited in the National Center for Biotechnology Information (NCBI) Sequence Read Archive (SRA) under accession number PRJNA687132 and PRJNA68 6861.
3 Results
3.1 Environmental Parameters
The temperature of the studied area varied from 7.43℃ (3600-08-72) to 27.73℃ (3600-08-00), and salinity var- ied from 30.47 (3600-08-00) to 32.87 (3400-08-67) (Fig.2). The various physical and chemical parameters of sites 3400-04 and 3500-03, where depth was lesser than 30m, showed negligible change in the vertical water column. At the other sites, the temperature gradually decreased along the vertical water column, while the salinity increased gradually, especially at the depth of 20-40m, which are characteristics of a thermo-halocline (Herrero, 2001). The concentrations of nutrients and Chlat each site are shown in Table 1. The phosphate and nitrate contents at each site also showed significant change in the middle layer, while ammonium and nitrite contents were stable in the vertical direction. At offshore sites (3400-08, 3500-08, and 3600-08), the concentration of DSi and DTP in middle layer was lower than that in the surface layer. The concentration of DTN in middle layer at 3500-08 and 3600-08 were lower than that at the surface of the two sites. The concentration of Chlranged from 0.08μgL−1(3500-08-72 and 3600-08-72) to 2.39μgL−1(3400-04- 00).
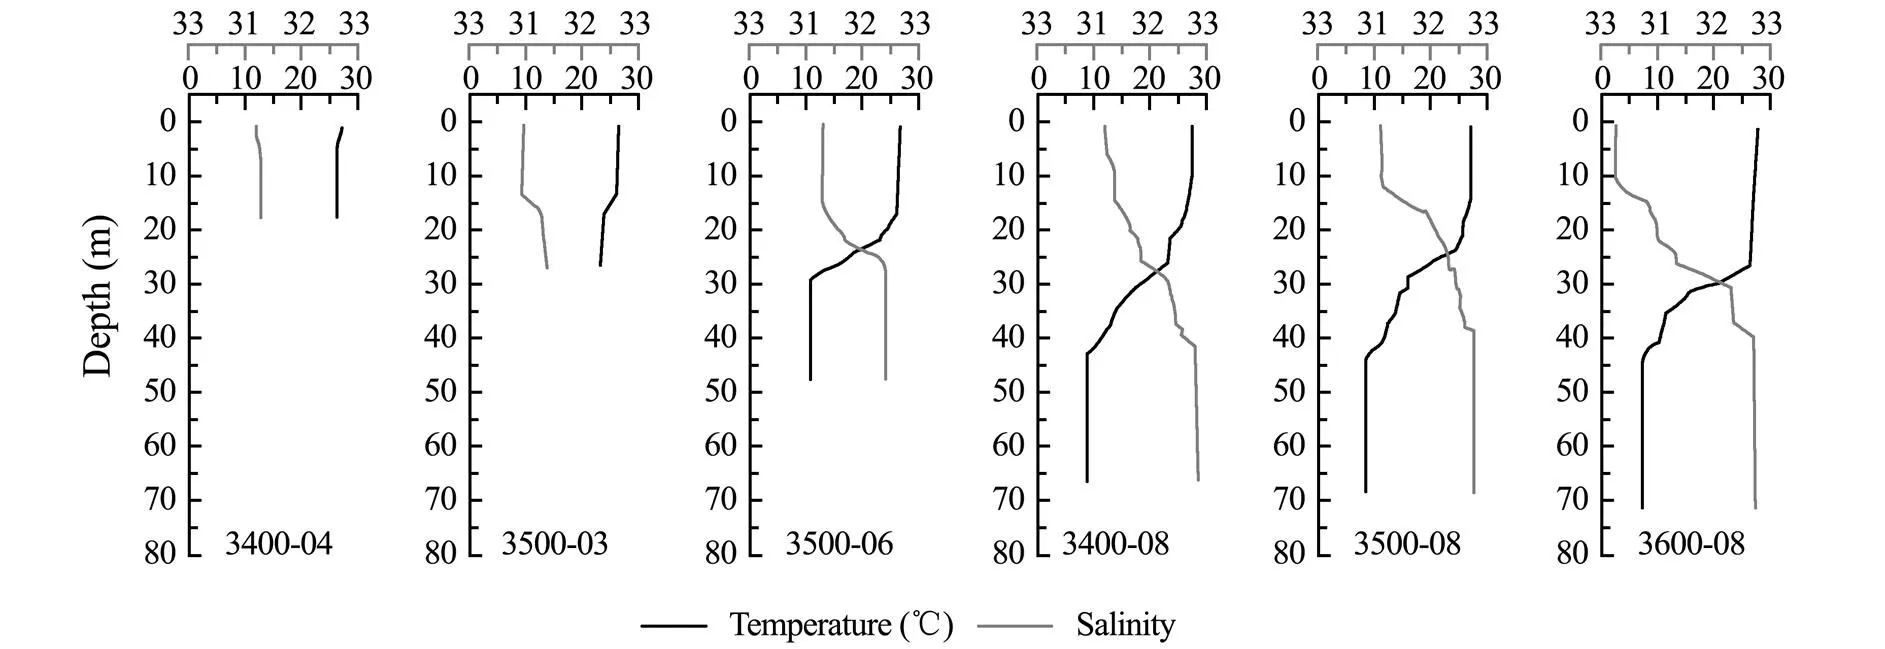
Fig.2 Temperature and salinity of each site.
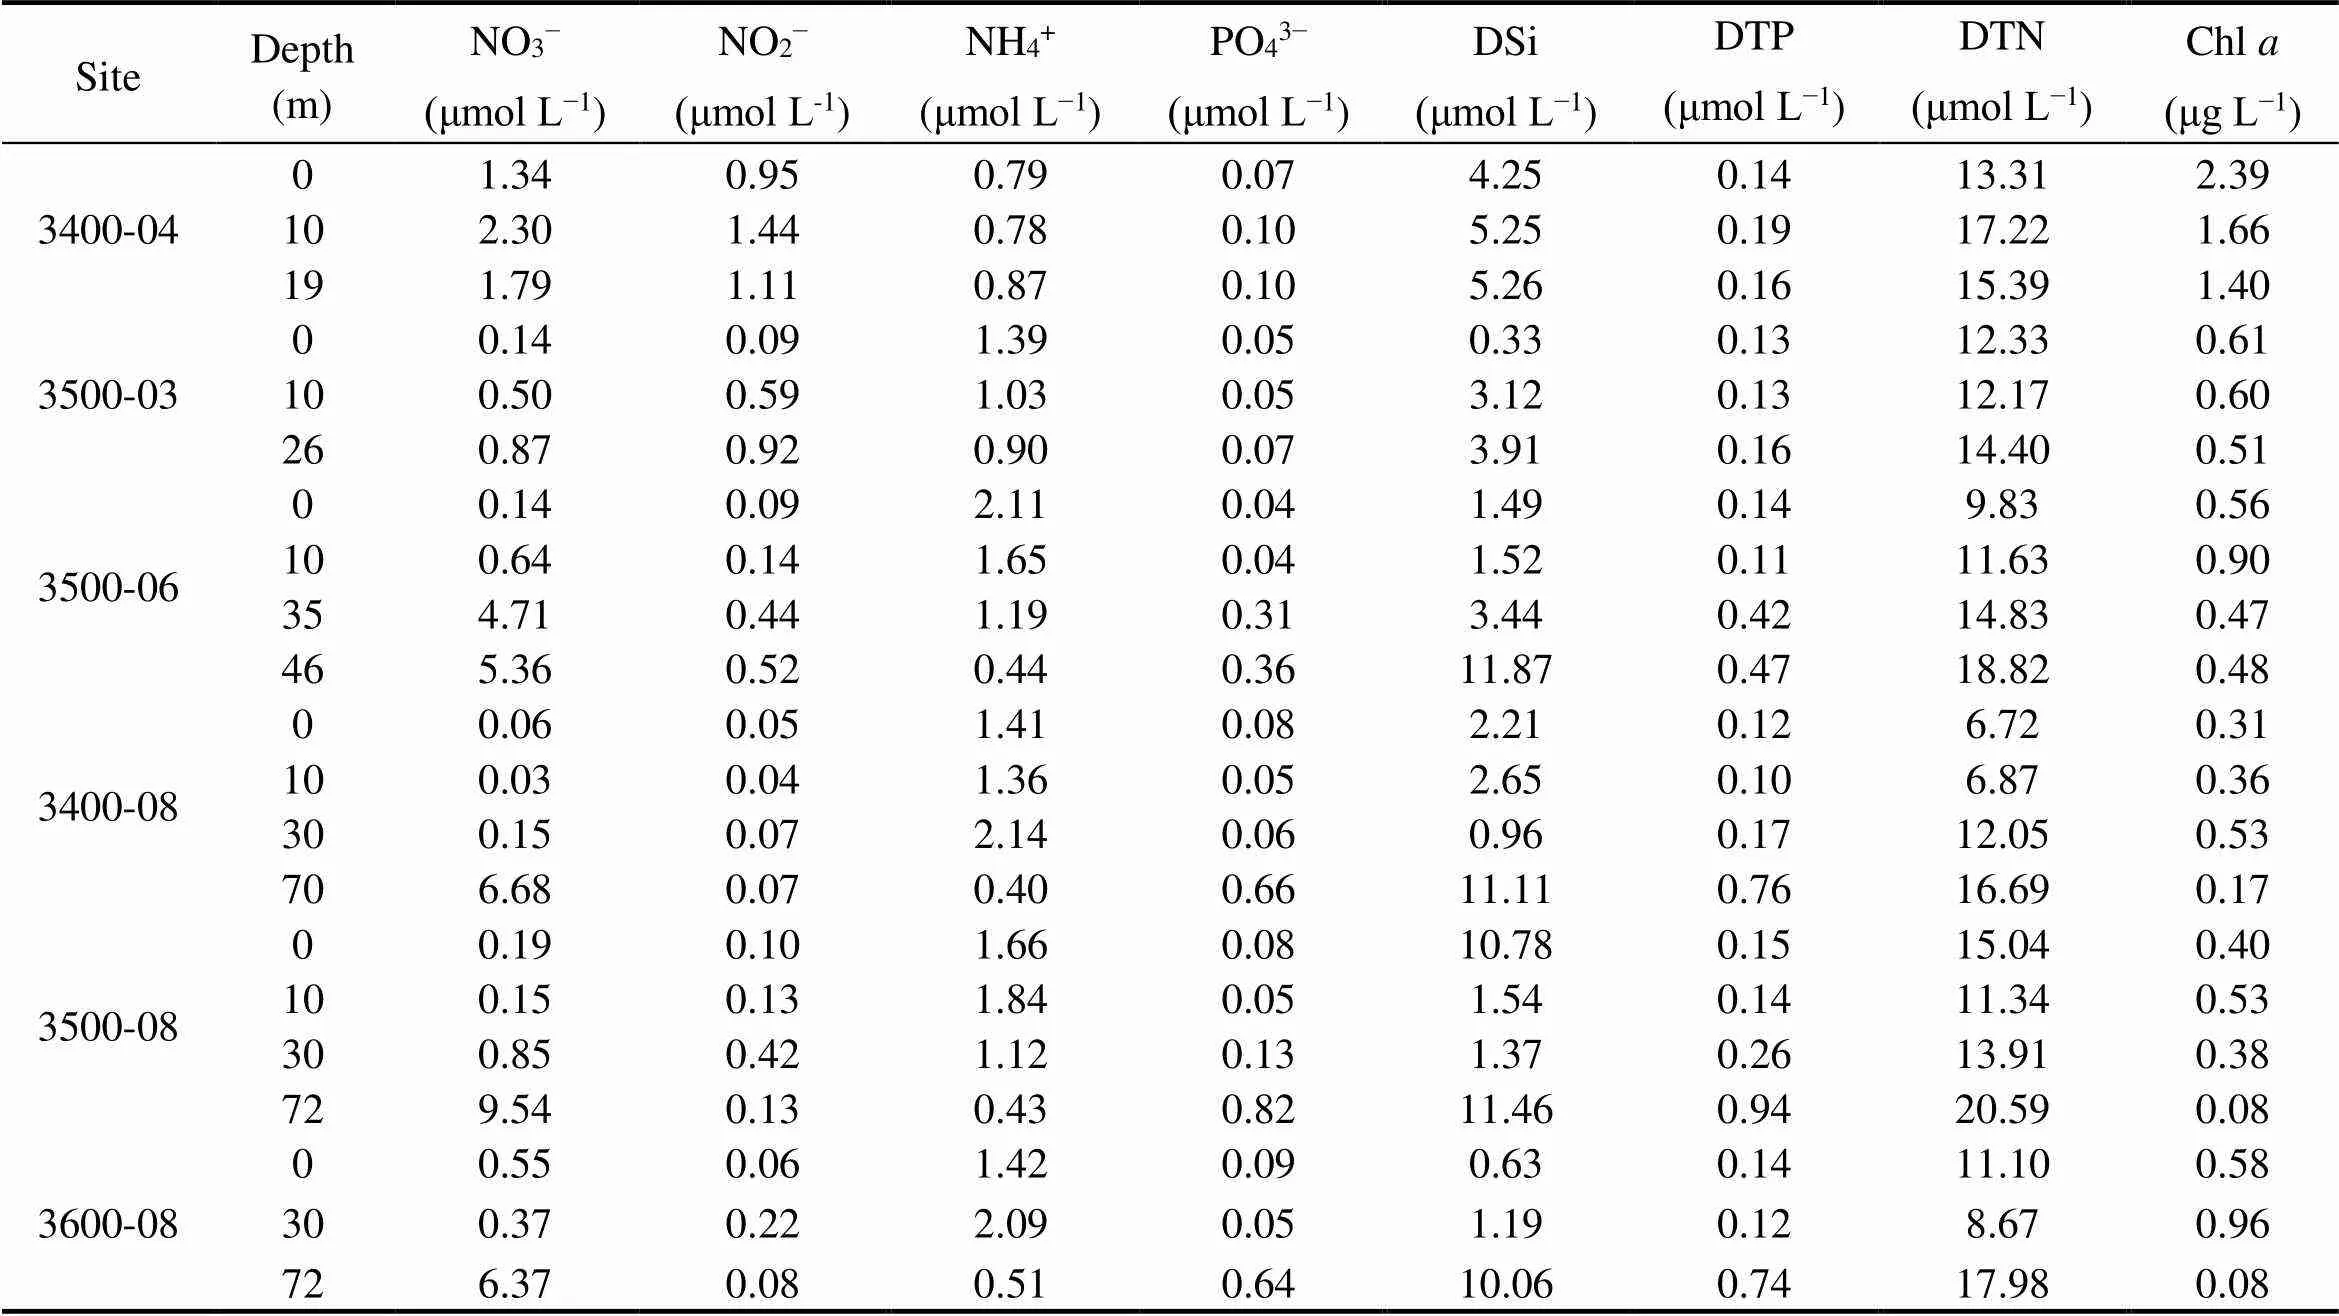
Table 1 Concentration of nutrients and Chl a at each site
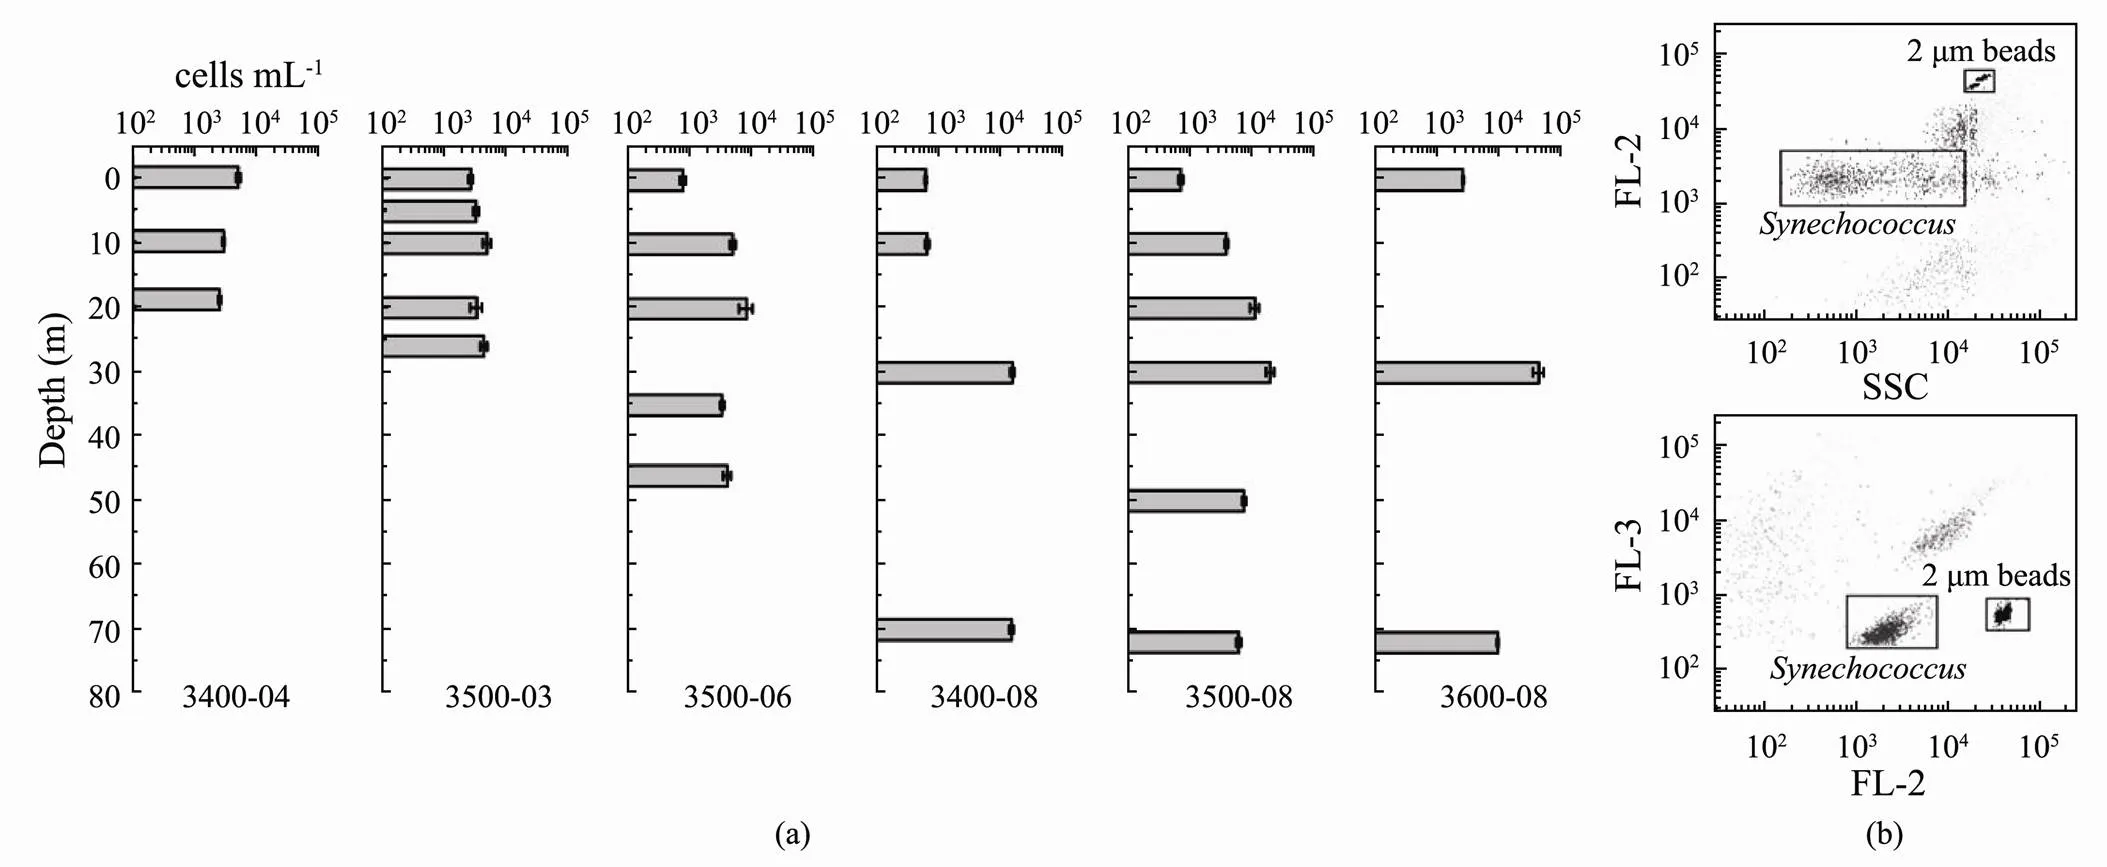
Fig.3 Abundance of Synechococcus in different water layers. (a), histogram showing abundance of Synechococcus; (b), result of flow cytometry. FL-2 and FL-3 represent orange fluorescence and red fluorescence respectively.
3.2 Distribution of Synechococcus Abundance
The abundance ofin the studied area ranged from 6.36×10²cellsmL−1(3400-08-00) to 4.51×10⁴cellsmL−1(3600-08-30) (Fig.3). The average abundance was 6.61×10³cellsmL−1. With the exception of that at site 3400-04, the abundance ofin the vertical column was always highest at the subsurface layer and lowest at the surface layer. Spatially, the mean abundance of the six sites showed an increasing trend from coastal to the off-shore sites. The salinity (<0.01,=0.544) and the temperature (<0.05,=−0.695) correlated significantly with the abundance of.
3.3 Composition of Synechococcus Assemblages
In total, 905072 sequences and 3992 OTUs, were obtained fromC1 sequencing data. The coverages of all samples were higher than 0.99,indicating that the depth of sequencing was reasonable (Table 2). The Sobs index showed an apparent increase from the surface to the bottom at all sampling sites. The Shannon index was higher at the deep layer (4.00), which was approximately double of that at the other sites.

Table 2 Sample alpha diversity index
The clustering results ofassemblages showed that all samples could be divided into three groups with the similarity of 0.38 (Fig.4a), which represented coastal (Group I), off-shore upper (Group II), and off-shore bottom (Group III) samples. S5.1 Clade II was the main component in Group I, with an average proportion of 80.67%. In addition, S5.2 was relatively higher in Group I than in the other two groups. Group II was dominated by the S5.1 Clade III, which accounted for 74.54% of the population. The proportion of unclassified assemblages(54.92% on average) was more in Group III, with less of Clade I (23.32% on average) and Clade III (13.10% on average).
Correlations of the community composition with environmental parameters were analyzed using RDA (Fig.4b). Variance inflation Factor (VIF) variance expansion removed environmental factors with strong collinearity (Wang., 2016), including phosphate, nitrate, DTP, temperature, and depth. The environmental variables of the first two-dimensions explained 44.21% of the total variation of the bacterial composition. Monte Carlo variables tests (999 permutations) showed that the NO2−-N content (=0.001) contributed significantly to the relationship betweenspecies and their environmental parameters. On the RDA1 axis, NO2−content correlated positively with samples derived from coastal areas (3400-04-00, 3400-04-10, and 3400-04-19); on the RDA2 axis, salinity showed positive correlation with samples derived from the off-shore bottom (3500-06-46, 3400-08-70, 3500-08-72, 3600-08-30, and 3600-08-72).
Microbial indicators refer to representative microorganisms that indicate the status of contamination in environmental samples. For example, Bacillus is the indicator for nitrite level in sewage treatment (Mahapatra., 2013; Zheng, 2018; Muñoz-Marín, 2020)., a single-celled organism, adapts sensitively to the environment; hence, it might be an ideal biological indicator for the environment. In RDA (Fig.5a), some OTUs showed significant relationship with environmental parameters including nitrite level and salinity. OTU3114 and OTU1571 fitted linearly with the nitrite level, while OTU26 and OTU952 fitted with salinity (Fig.5b). The correlation values of OTU3114 and OTU26 fitted well, with2>0.6, indicating that these two were the potential OTU indicators that should be investigated further. The phylogenetic tree revealed that OTU3114 belonged to the S5.1 Clade VI and OTU26 was in the branch of S5.1 Clade I (Fig.5c).

Fig.4 Results of clustering and RDA analyses. Others are Synechocooccus, including Freshwater-F, S5.1-VII, and S5.1-VIII, Cyanobium. T, D and S represent temperature, depth, and salinity, respectively. (a), phylogenetic composition of Synechococcus assemblage; (b), RDA bioplot of Synechococcus and environmental factors.
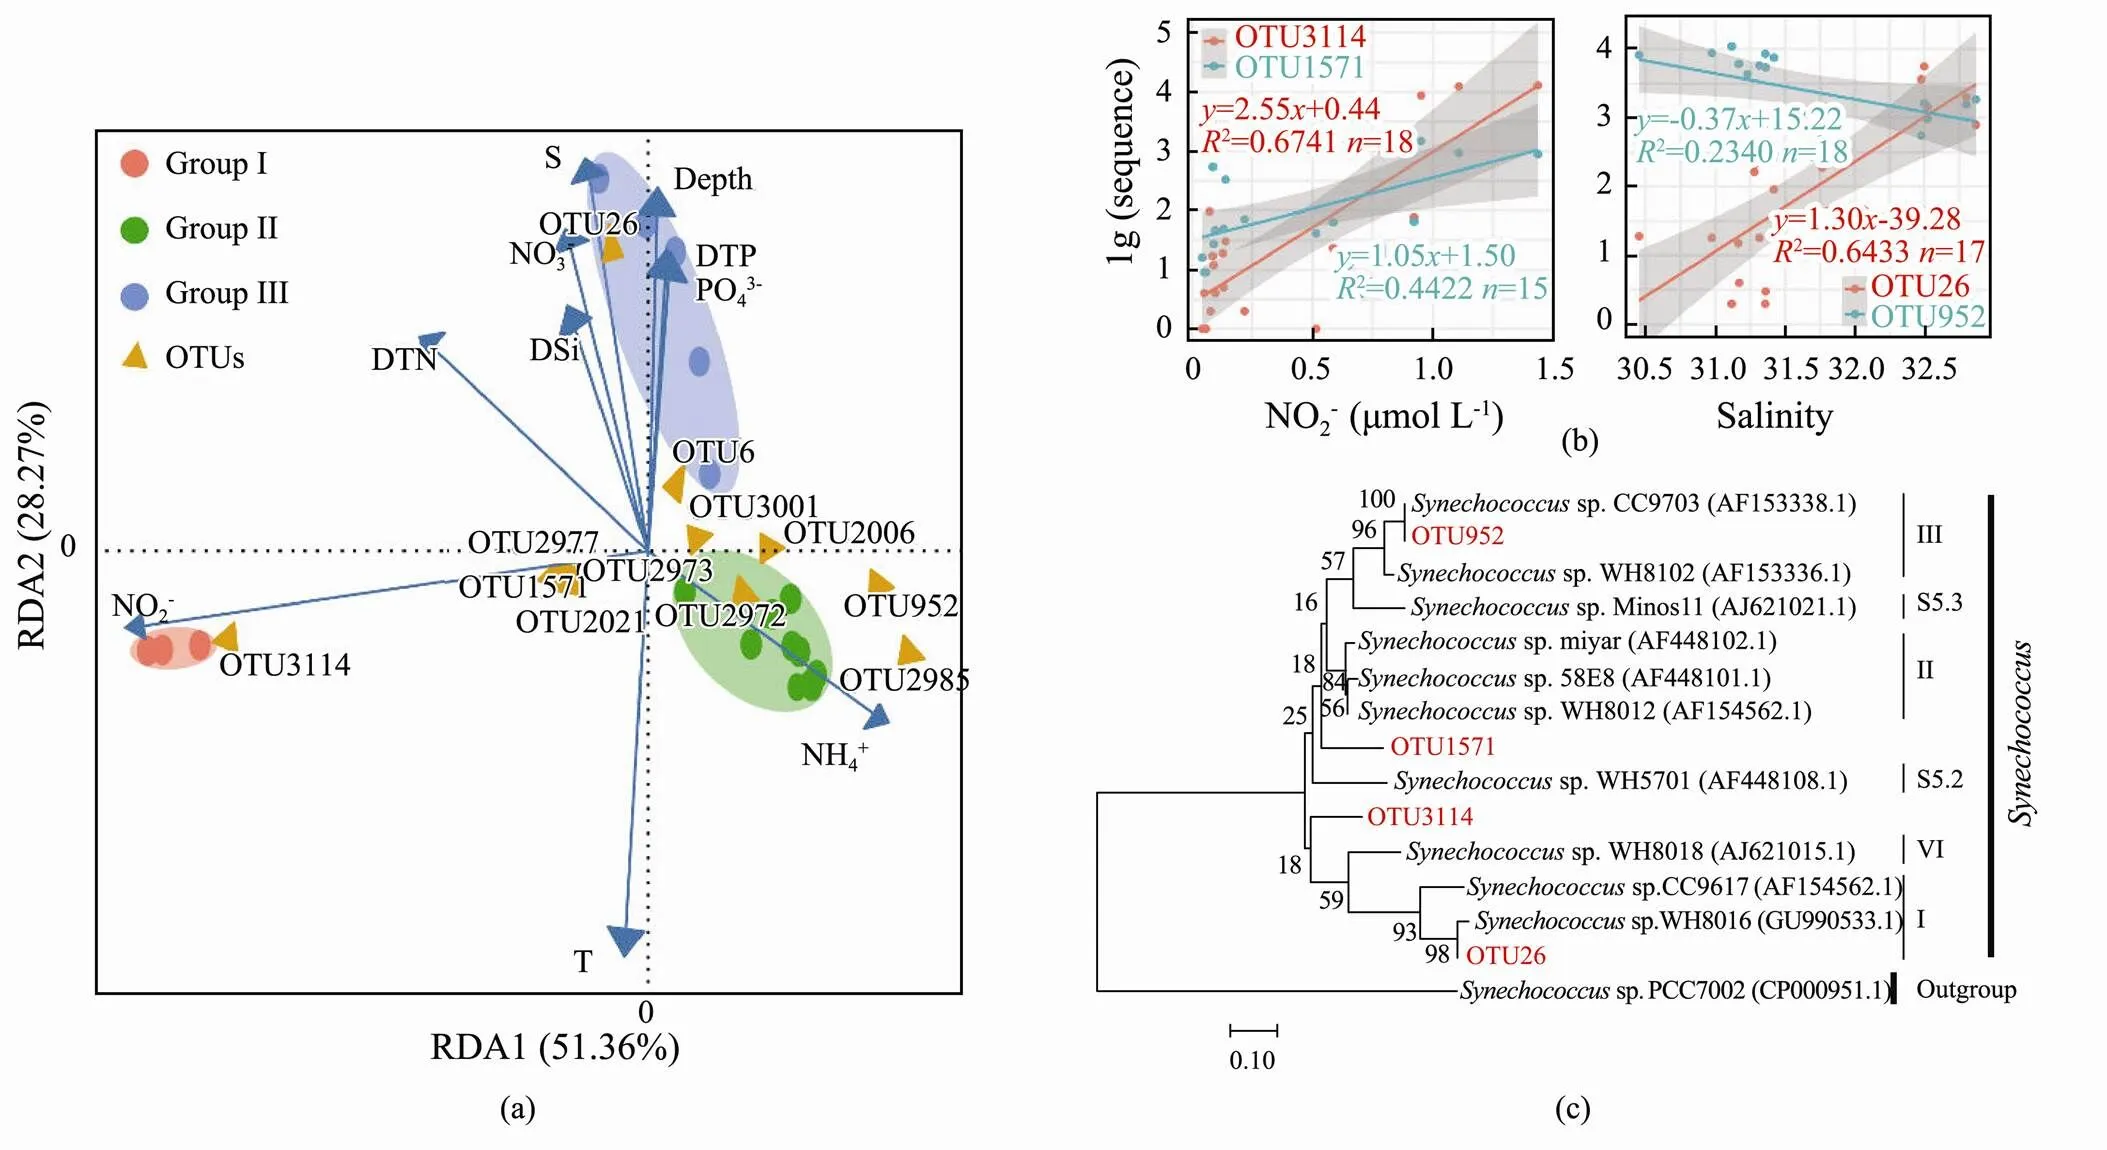
Fig.5 Response of Synechococcus to the environment. (a), RDA bioplot of OTUs and environmental factors; (b), the fitting between OTUs and environmental factors; (c), the location of OTUs that fit well with nitrite level and salinity in the phylogenetic tree.
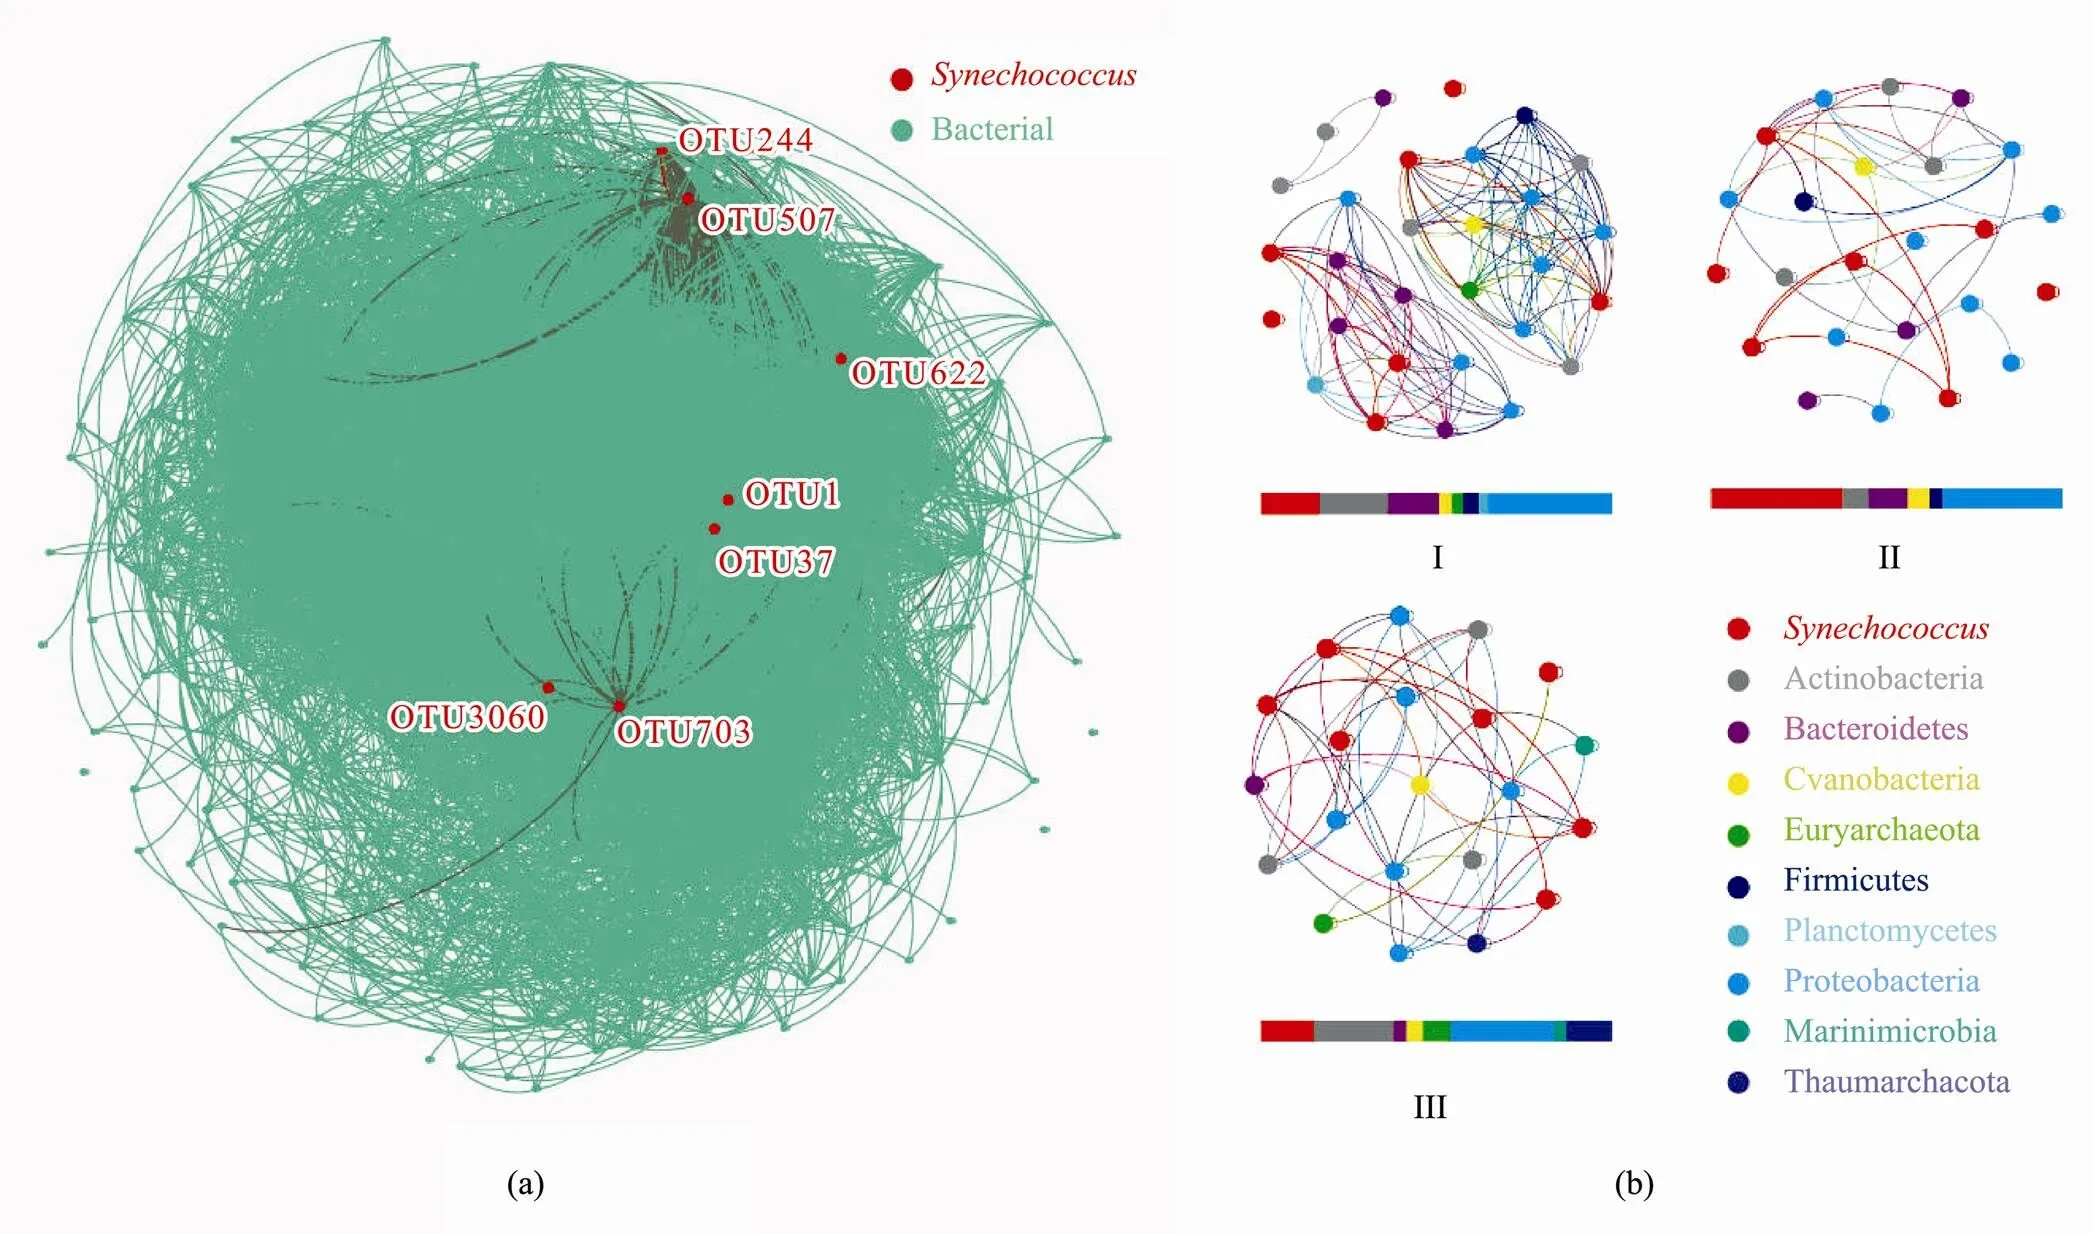
Fig.6 Co-occurrence network. Based on the correlation analysis of the co-occurrence network, the bar graph below the network shows the proportion of each factor. (a), the co-occurrence network of Synechococcus and other microorganisms; (b), the co-occurrence network of Synechococcus and microorganisms in different groups. Grouping according to the clustering results at the species level: coast site 3400-04 is in Group I, 0-30m water layers samples are in Group II, and cold water mass water layers are in Group III.
3.4 Microorganism Coexisting with Synechococcus
In the co-occurrence network, genetic correlation link- ed 557 nodes28868 connections.was connected to 181 prokaryotic OTU nodes (Fig.6a). Proteobacteria was the most abundant (255 OTUs), followed by Bacteroidetes (107), Actinomycetes (49), Planctomycetes (43), and Verrucomicrobia (25). Co-occurrence net- works ofand microorganisms in different groups were listed (Fig.6b). Irrespective of the group, Proteobacteria predominantly coexisted (about 30%) with. In Group I, Proteobacteria (35.56%), Actinobacteria (19.50%), Bacteroidetes (14.61%), Firmicutes (4.42%), Cyanobacteria (3.59%), Euryarchaeota (3.14%), and Planctomycetes (2.58%) were the most abundant phyla related to. Compared to the other two groups, a higher proportion of Bacteroidetes coexisted within Group I. In Group II,(37.29%) and Proteobacteria (34.50%) made up most of the biomass. However, two phyla, Marinimicrobia (3.44%) and Thaumarchaeota (13.15%), which were related to, were absent from Group I and Group II. Furthermore, the proportions of Actinobacteria(22.89%) and Euryarchaeota (7.69%) associated withalso increased compared with the Group I and Group II.
4 Discussion
4.1 Abundance Patterns of Synechococcus in the Yellow Sea
The abundance ofranged from 102to 104cellsmL−1in the studied Yellow Sea area. The abundance was consistent with that observed in previous studies in the Yellow Sea (Qu., 2010; Zhao., 2019) and in northeastern Mediterranean at the same latitude (Uysal and Köksalan, 2017). It was slightly lower than that at the Pearl River Estuary located at approximately 22˚N (Xia., 2017), which might be because of the temperature. Temperature has been found to affectabundance positively worldwide (Jiang., 2016). The vertical distribution ofcorrelated highly with the Chlcontent. In studied area, the maximum of Chlcontent located in the subsurface, and the abundance distribution ofwas consistent with it. This was observed in the studied area after the thermo-halocline was formed during spring, which was caused by higher nutrient concentrations in the lower water mass, combined with proper light intensity. Similar vertical distribution was also observed in the coastal area of the Black Sea (Di Cesare., 2020). Nutrients may possibly be another factor affectingabundance distribution on the regional scale. The horizontal distribution ofin the same layer also showed a decreasing trend from off-shore to the coastal sites concurrent with the changes in the nutrient regime.
The decrease in the concentration ofin the deep layer of the off-shore sites might be related to the YSCWM. The cold water mass of the Yellow Sea is an important phenomenon that occurs in summer. It was previously observed that the North Yellow Sea Cold Water Mass affected the vertical distribution of(Wang., 2008). The nutrients in cold water masses tend to be higher in the open sea and lower at the coast, which affected the vertical distribution of phytoplankton (Li., 2006). Site 3500-06 in the studied area was located on the edge of the YSCWM, and 3400-08, 3500-08, and 3600-08 were in the YSCWM (Yang., 2019b). The abundance ofin the middle layers (20–30m) of these sites was the highest: 3500-06, 8.43×10³cellsmL−1, 20m; 3400-08, 1.61×10⁴cellsmL−1, 30m; 3500-08, 2.06×10⁴cellsmL−1, 30m; 3600-08, 4.51 ×10⁴cellsmL−1, 30m.The abundance ofat the bottom of the cold water mass was lower than that at the middle layers; this might be because the temperature of the cold water mass was low (less than 12℃), which did not support the growth of. Research on Zhangzi Island in summer revealed that under the influence of the North Yellow Sea Cold Water Mass, the maximum abundance ofappeared in the thermo-halocline, while the abundance in the Cold Water Mass was extremely low. This phenomenon only appeared in the area affected by the cold water mass (Zhao., 2018).
4.2 Composition Characteristics of Synechococcus
S5.1 and S5.2 were the two majorsubclusters detected in the studied sea area. In S5.1, Clade I, Clade II, and Clade III were the main components that occupied different niches. Clade I was mainly distributed in the cold water mass water layers. Clade II was dominant at the coastal site (80.64%), and less in oligotrophic waters from the surface layer to the subsurface layer (approximately 20%). Clade III was distributed in each water layer at each site, mainly in the upper water layer (74.54%). The distribution characteristics ofin the studied area are basically consistent with other sea areas in the world (Xia., 2019). S5.2 is a typically estuarine species, with diverse representative strains in different estuaries (Chen., 2006). However, it was detected at the coast in the studied area. Xia. (2017) found that the abundance of S5.2 was relatively high in the medium salinity waters. The distribution of S5.2 in the studied sea area might be related to the salinity.
Distinctassemblages were identified in coastal samples compared to those in other off-shore samples. S5.1 Clade II and S5.2 were the two main species in the coastal site 3400-04. The concentration of Chlat this site was significantly higher than that in the other five sites. RDA showed that this composition distribution could be explained by nitrite content. These two evolution categories (S5.1 Clade II and S5.2) were detected in the chlorophyll front in the southern boundary of the sub- Arctic gyre and the Pearl River Estuary, respectively (Polovina., 2017; Li., 2019). High nitrite concentration was also recorded in the coastal area during June 2001, which could be attributed to the influence of the tidal front in the South Yellow Sea (Li., 2007). Studies have shown that cyanobacteria can assimilate various nitrogen sources, including NH4+, NO3−, and NO2−(Herrero., 2001). S5.1 Clade II and S5.2 might directly absorb nitrite (NO2−). Whethercan use nitrite as a nitrogen source warrants further investigations.
4.3 Geochemical Functions of Synechococcus in the Yellow Sea
The co-occurrence analyses showed thatwas associated with various microorganisms. Based on these broad correlations, we concluded thatparticipated in various element cyclesdirect metabolism or exchange of metabolites.can coexistextensive interactions with various heterotrophic bacteria in different water layers (Fig.5b). The 16S functional microbiota identified using the FAPRO TAX database showed thatand coexisting microorganisms were involved in carbon (C), nitrogen (N), sulfur (S), manganese (Mn), and variable (VA) cycles.may participate in the ecosystem element cycle by interacting with these microorganisms.
contributed significantly to global primary productivity and the carbon cycle (Li., 2018). In addition to the carbon fixation function,also performed various potential ecological functions. Studies over the last 15 years show thatcan use different organic compounds containing key elements such as N (amino acids, amino sugars), S (dime- thylsulfoniopropionate, DMSP), or P (ATP) to survive in oligotrophic oceans (Muñoz-Marín., 2020). Studies have also shown that the PE-richisolates in the Gulf of Mexico and the North Atlantic can transport DMSP (Malmstrom., 2005). Marineisolates can use NH4+, NO2−, NO3−, urea and amino acids as nitrogen sources (Moore., 2002). Thatcan utilize nitrogen source was believed to be related to PE, the light-harvesting pigment- protein of(Wyman., 1985). Under conditions of nitrogen deficiency,can degrade photosynthetic pigments and release nitrogen sources into the environment, which is regulated by NtcA (Herrero., 2001). The major element cycles thatmay be involved in were predicted on the basis of the results of previous studies. However, this is only a prediction, which needs to be verified by elemental culture experiments and molecular experiments.
5 Conclusions
The abundance distribution, genus composition, and environmental constraints ofwere studied in the Yellow Sea. Theabundance ranged from 6.36×10²to 4.51×10⁴cellsmL−1, with the maximum abundance in the subsurface and increase in abundance from the coast to the off-shore area, which was influenced bytemperature and cold water mass. The assemblage composition ofincluded two subclusters, S5.1 (including Clade I, Clade II, Clade III, and Clade VI) and S5.2, in the studied area. Clade I mainly occurred in the water layer of the cold water mass, while Clade II was dominant at coastal site 3400-04. Clade III was the most abundant branch, mainly distributed in the upper water layer. S5.2 was mainly located in the site 3400-04 and few in other samples. The differences incomposition could be mainly explained based on nitrite content.mainly coexisted with bacteria belonging to Proteobacteria, Bacteroides, Actinomycetes, Planctomycetes, and Verrucomicrobia.coexistedextensive interactions with various heterotrophic bacteria to participate in the elemental cycles. Furthermore, the distribution of some OTUs agreed withnitrite level and salinity, which could be potential indicators of seawater condition. This study revealed the distribution patterns ofand their environmental constraints, and it predicts the related geochemical processes in the Yellow Sea. However, these observations regarding the function ofas indicators of environmental conditions are only preliminary and have to be confirmed by more extensive survey data and culture experiments with gradient of nitrites or salinity in the future.
Acknowledgements
This work is supported by the Key Deployment Project of Center for Ocean Mega-Science, Chinese Academy of Sciences (No. COMS2020Q09), the National Key Research and Development Program of China (No. 2018 YFD0901102), and the Science and Technology Program of Yantai (No. 2017ZH095).
Bai, X., Wang, M., Liang, Y., Zhang, Z., Wang, F., and Jiang, X., 2012. Distribution of microbial populations and their relationship with environmental variables in the North Yellow Sea, China., 11 (1): 75- 85.
Bastian, M., Heymann, S., and Jacomy, M., 2009, Gephi: An open source software for exploring and manipulating networks.. 361-362.
Bokulich, N. A., Subramanian, S., Faith, J. J., Gevers, D., Gordon, J. I., Knight, R.,., 2013. Quality-filtering vastly improves diversity estimates from Illumina amplicon sequen- cing., 10 (1): 57-59.
Bolyen, E., Rideout, J. R., Dillon, M. R., Bokulich, N. A., Abnet, C. C., Al-Ghalith, G. A.,., 2019. Reproducible, interactive, scalable and extensible microbiome data science using QIIME 2., 37 (8): 852-857.
Brown, J., Pirrung, M., and McCue, L. A., 2017. FQC dash- board: Integrates FastQC results into a web-based, interactive, and extensible FASTQ quality control tool., 33 (19): 3137-3139.
Caporaso, J. G., Kuczynski, J., Stombaugh, J., Bittinger, K., Bushman, F. D., Costello, E. K.,., 2010. QIIME allows analysis of high-throughput community sequencing data., 7 (5): 335-336.
Chen, F., Wang, K., Kan, J., Suzuki, M. T., and Wommack, K. E., 2006. Diverse and unique picocyanobacteria in Chesapeake Bay, revealed by 16S-23S rRNA internal transcribed spacer sequences., 72 (3): 2239-2243.
Dafner, E. V., 2015. Segmented continuous-flow analyses of nutrient in seawater: Intralaboratory comparison of technicon Autoanalyzer II and Bran+Luebbe continuous flow Autoanalyzer III., 13 (10): 511-520.
Di Cesare, A., Dzhembekova, N., Cabello-Yeves, P. J., Eckert, E. M., Slabakova, V., Slabakova, N.,., 2020. Genomic comparison and spatial distribution of differentphylotypes in the Black Sea., 11 (1979): 1-14.
Farrant, G. K., Doré, H., Cornejo-Castillo, F. M., Partensky, F., Ratin, M., Ostrowski, M.,., 2016. Delineating ecologically significant taxonomic units from global patterns of marine picocyanobacteria., 113 (24): E3365-E3374.
Flombaum, P., Gallegos, J. L., Gordillo, R. A., Rincón, J., Zabala, L. L., Jiao, N.,., 2013. Present and future global distributions of the marine Cyanobacteriaand., 110 (24): 9824-9829.
Herrero, A., Muro-Pastor, A. M., and Flores, E., 2001. Nitrogen control in cyanobacteria., 183 (2): 411-425.
Jiang, T., Chai, C., Wang, J., Zhang, L., Cen, J., and Lu, S., 2016. Temporal and spatial variations of abundance of phycocyanin and phycoerythrin-richin Pearl River Estuary and adjacent coastal area., 15 (5): 897-904.
Li, H. B., Lv, R. H., Ding, T., and Lin, Y. A., 2007. Impact of tidal front on the distribution of bacterioplankton in the southern Yellow Sea, China., 67: 263-271.
Li, H., Xiao, T., Ding, T., and Lü, R., 2006. Effect of the Yellow Sea Cold Water Mass (YSCWM) on distribution of bacterioplankton., 26 (4): 1012-1019.
Li, J., Chen, Z., Jing, Z., Zhou, L., Li, G., Ke, Z.,., 2019.bloom in the Pearl River Estuary and adjacent coastal area–with special focus on flooding during wet seasons., 692: 769-783.
Li, Y., Tang, K., Zhang, L., Zhao, Z., Xie, X., Chen, C. T. A.,., 2018. Coupled carbon, sulfur, and nitrogen cycles mediated by microorganisms in the water column of a shallow- water hydrothermal ecosystem., 9 (2718): 1-13.
Louca, S., Parfrey, L. W., and Doebeli, M., 2016. Decoupling function and taxonomy in the global ocean micro-biome.,353 (6305): 1272-1277.
Ma, B., Wang, H., Dsouza, M., Lou, J., He, Y., Dai, Z.,., 2016. Geographic patterns of co-occurrence network topological features for soil microbiota at continental scale in eas- tern China., 10 (8): 1891-1901.
Mahapatra, D. M., Chanakya, H. N., and Ramachandra, T. V., 2013. Treatment efficacy of algae-based sewage treatment plants., 185 (9): 7145-7164.
Malmstrom, R. R., Kiene, R. P., Vila, M., and Kirchman, D. L., 2005. Dimethylsulfoniopropionate (DMSP) assimilation byin the Gulf of Mexico and Northwest Atlantic Ocean., 50 (6): 1924-1931.
Moore, L. R., Post, A. F., Rocap, G., and Chisholm, S. W., 2002. Utilization of different nitrogen sources by the marine cyano- bacteriaand., 47 (4): 989-996.
Muñoz-Marín, M. C., Gómez-Baena, G., López-Lozano, A., Moreno-Cabezuelo, J. A., Díez, J., and García-Fernández, J. M., 2020. Mixotrophy in marine picocyanobacteria: Use of organic compounds byand., 14: 1065-1073.
Paulsen, M. L., Doré, H., Garczarek, L., Seuthe, L., Müller, O., Sandaa, R. A.,., 2016.in the Atlantic gateway to the Arctic Ocean., 3 (191): 1-14.
Picot, J., Guerin, C. L., Le Van Kim, C., and Boulanger, C. M., 2012. Flow cytometry: Retrospective, fundamentals and recent instrumentation., 64 (2): 109-130.
Polovina, J. J., Howell, E. A., Kobayashi, D. R., and Seki, M. P., 2017. The transition zone chlorophyll front updated: Advan- ces from a decade of research., 150: 79-85.
Qu, P., Zhang, X. L., Wang, Z. L., Pang, M., Fu, M. Z., and Li, Z., 2010. The abundance distribution of picophytoplankton in the southern Huanghai Sea in summer., 32 (4): 155-167 (in Chinese with English abstract).
Quast, C., Pruesse, E., Yilmaz, P., Gerken, J., Schweer, T., Yarza, P.,., 2012. The SILVA ribosomal RNA gene database pro- ject: Improved data processing and web-based tools., 41 (D1): D590-D596.
Rogers, M. B., Firek, B., Shi, M., Yeh, A., Brower-Sinning, R., Aveson, V.,., 2016. Disruption of the microbiota across multiple body sites in critically ill children., 4 (1): 1-10.
Saito, M. A., Rocap, G., and Moffett, J. W., 2005. Production of cobalt binding ligands in afeature at the Costa Rica upwelling dome., 50 (1): 279-290.
Scanlan, D. J., and West, N. J., 2002. Molecular ecology of the marine cyanobacterial generaand., 40 (1): 1-12.
Scanlan, D. J., 2012. Marine picocyanobacteria. In:. Springer, Dordrecht, 503-533.
Sohm, J. A., Ahlgren, N. A., Thomson, Z. J., Williams, C., Mof- fett, J. W., Saito, M. A.,., 2016. Co-occurringecotypes occupy four major oceanic regimes defined by temperature, macronutrients and iron., 10 (2): 333-345.
Tang, Y. X., Zou, E., Lie, H. J., and Lie, J. H., 2000. Some features of circulation in the southern Huanghai Sea., 22 (1): 1-16 (in Chinese with English abstract).
Uysal, Z., and Köksalan, İ., 2017. Short term temporal and spatial fluctuations in marine cyanobacteriumabundance in oligotrophic deep shelf water (northeastern Mediterranean)., 26 (8): 5115-5124.
Wang, J. T., Zheng, Y. M., Hu, H. W., Li, J., Zhang, L. M., Chen, B. D.,., 2016. Coupling of soil prokaryotic diversity and plant diversity across latitudinal forest ecosystems., 6 (1): 1-7.
Wang, M., Bai, X. G., Liang, Y. T., Wang, F., Jiang, X. J., Guo, Y. J.,., 2008. Summer distribution of picophytoplankton in the North Yellow Sea., 32 (5): 1184- 1193 (in Chinese with English abstract).
Wyman, M. R. P. F., Gregory, R. P. F., and Carr, N. G., 1985. Novel role for phycoerythrin in a marine cyanobacterium,strain DC2., 230 (4727): 818-820.
Xia, X., Cheung, S., Endo, H., Suzuki, K., and Liu, H., 2019. Latitudinal and vertical variation ofassemblage composition along 170˚W transect from the South Pacific to the Arctic Ocean., 77 (2): 333- 342.
Xia, X., Guo, W., Tan, S., and Liu, H., 2017.assemblages across the salinity gradient in a salt wedge estuary., 8 (1254): 1-12.
Xin, M., Ma, D., and Wang, B., 2015. Chemicohydrographic characteristics of the Yellow Sea Cold Water Mass., 34 (6): 5-11.
Yang, W., Guan, Y., Zhai, C., Wang, T., Shi, D., Chen, J.,., 2019. Response of fungal communities and co-occurrence network patterns to compost amendment in black soil of Nor- theast China., 10 (1562): 1-11.
Yang, Y., Li, K., Du, J., Liu, Y., Liu, L., Wang, H.,., 2019. Revealing the subsurface Yellow Sea Cold Water Mass from satellite data associated with typhoon Muifa., 124 (10): 7135-7152.
Zhao, L., Zhao, Y., Dong, Y., Zhao, Y., Zhang, W., Xu, J.,., 2018. Influence of the northern Yellow Sea Cold Water Mass on picoplankton distribution around the Zhangzi Island, nor- thern Yellow Sea., 37 (5): 96-106.
Zhao, Y., Yu, R. C., Kong, F. Z., Wei, C. J., Liu, Z., Geng, H. X.,., 2019. Distribution patterns of picosized and nanosized phytoplankton assemblages in the East China Sea and the Yellow Sea: Implications on the impacts of Kuroshio intrusion.:, 124 (2): 1262-1276.
Zheng, Q., Wang, Y., Xie, R., Lang, A. S., Liu, Y., Lu, J.,., 2018. Dynamics of heterotrophic bacterial assemblages with- incultures., 84 (3): 1-16.
Zwirglmaier, K., Jardillier, L., Ostrowski, M., Mazard, S., Gar- czarek, L., Vaulot, D.,., 2008. Global phylogeography of marineandreveals a distinct partitioning of lineages among oceanic biomes., 10(1): 147-161.
January 18, 2021;
April 28, 2021;
June 1, 2021
© Ocean University of China, Science Press and Springer-Verlag GmbH Germany 2022
#The two authors contributed equally to this work.
s. E-mail: chenxi@ouc.edu.cn
E-mail:jlli@yic.ac.cn
(Edited by Ji Dechun)
 Journal of Ocean University of China2022年2期
- Journal of Ocean University of China的其它文章
- Study of the Wind Conditions in the South China Sea and Its Adjacent Sea Area
- A Spatiotemporal Interactive Processing Bias Correction Method for Operational Ocean Wave Forecasts
- Characteristics Analysis and Risk Assessment of Extreme Water Levels Based on 60-Year Observation Data in Xiamen, China
- Underwater Target Detection Based on Reinforcement Learning and Ant Colony Optimization
- Polar Sea Ice Identification and Classification Based on HY-2A/SCAT Data
- Thermo-Rheological Structure and Passive Continental Margin Rifting in the Qiongdongnan Basin,South China Sea, China
