Degradation of tetracycline in water by gas–liquid plasma in conjunction with rGO-TiO2 nanocomposite
Xinghao LIU (刘行浩), Cheng CHENG (程诚), Zimu XU (许子牧),Shuheng HU (胡淑恒),∗, Jie SHEN (沈洁), Yan LAN (兰彦) and Paul K CHU (朱剑豪)
1 Institute of Plasma Physics, Chinese Academy of Sciences, Hefei 230031, People’s Republic of China
2 College of Chemistry and Chemical Engineering, Central South University, Changsha 410083, People’s Republic of China
3 School of Resources & Environmental Engineering, Hefei University of Technology, Hefei 230009,People’s Republic of China
4 Department of Physics and Department of Materials Science and Engineering, City University of Hong Kong, Tat Chee Avenue, Kowloon, Hong Kong, People’s Republic of China
Abstract Tetracycline(TC)is an antibiotic mainly used in livestock production and respiratory infection.Traditional methods are not effective in removing TC from solution.In this study, TC was degraded by gas–liquid plasma in the presence of rGO-TiO2 in solution.The rGO-TiO2 was prepared by modified hummers and hydrothermal method.The electrical and optical properties of the gas–liquid discharge plasma were studied and the produced long-lived reactive species were analyzed by spectrophotometer.The degradation efficiency of TC was improved by 41.4%after plasma treatment for 12 min in presence of 30 mg l−1 rGO-TiO2 compared to that with plasma alone.The degradation efficiency increased with increasing discharge power, but as the initial concentration was increased from 20 to 80 mg l−1, the degradation efficiency of TC decreased.The initial pH had no significant effect on the degradation of TC.The intermediate products were determined by UV–vis spectrophotometry and ESI(+)–MS,and the degradation mechanism was analyzed.The reactive species,including O3,·OH,and H2O2,etc.,produced in the plasma/catalyst system attracted electron-rich functional groups (amino group, aromatic ring, and double bond).Therefore, the gas–liquid plasma/catalyst system could be an effective and promising method for pharmaceutical wastewater treatment in future.
Keywords: gas–liquid plasma, rGO-TiO2, tetracycline, degradation mechanism
1.Introduction
Antibiotics, as a pharmaceutical and personal care product(PPCP), are pharmaceuticals used to cure or prevent diseases caused by microorganisms [1, 2].Tetracycline (TC) is an antibiotic mainly used in livestock production and respiratory infection[3,4].However,traditional methods are not effective in removing TC from solution because the antibiotic wastewater has the characteristics of high concentration, complex components,and poor biochemistry.TC concentrations of 0.07–1.34 μg l−1have been detected in surface water and 0.8–6.8 μg l−1in the Nanming River [5, 6].If bacteria have been in the environment for a long time, it can cause resistance to medicines, and the antibiotic-resistant bacteria can be transferred to humans [7].For the sake of human health and environmental safety, an efficient antibiotic treatment technology is needed.
Advanced oxidation technologies (AOTs) as pollutant treatment technologies include UV/H2O2[8], Fenton processes[9], and photo-catalysis [10].AOTs are based on in situ generation of strong oxygen-based oxidizers, especially hydroxyl radicals (·OH), which possess strong oxidizers reacting with various types of pollutants[11].For example,Rahmah et al[12]reported a high removal efficiency of 250 mg l−1oxytetracycline(OTC) after UV/H2O2treatment for 3 h, and Lee et al [13]indicated that the removal efficiency of chlortetracycline was 65%after the treatment with H2O2and O3for 40 min.Although these methods might be available for treating wastewater containing antibiotics, there is still room for improvement.
Non-thermal plasma(NTP)is normally achieved through different discharge processes.Gas–liquid plasma is one kind of NTP produced in discharge in liquid or at the gas–liquid interface,leading to the generation of various reactive species including short-lived radicals (·H, ·O, ·OH) and long-lived molecules (H2O2, O3, etc), which are widely applied to treat various pollutants [14, 15].Xue et al [16] investigated the NOR degradation effect in aqueous solution by atmospheric microwave plasma jet.The degradation efficiency of NOR(20 mg l−1) reached 98.27% ± 1.03% at 6 min, and the mineralization efficiency reached 68.67% ± 3.21%at 15 min.In addition, Jose et al [17] employed continuous flow pulsed power plasma for treatment of real pharmaceutical wastewater, and obtained COD and BOD removal ratios about 91.8% and 90.9%, respectively.As known, the oxidation potential of ·OH is higher than that of O3and H2O2, and the luminous effect in the system has not been utilized sufficiently in the discharge system; therefore, kinds of the catalysts are considered to add into the plasma system to promote the production of·OH via the reactions between the photon or other reactive species and the catalyst.Nowadays, NTP combined with photo-catalysts has become a hot research topic.Reddy et al [18] used a catalytic non-thermal plasma reactor to degrade endosulfan and showed that mineralization of endosulfan by the combined plasma with catalysts (about 48%) was better than that by the plasma alone (about 16%).Wang et al[19]used DBD combined with catalyst to achieve high mineralization level and degradation efficiency.Jiang et al [20] used gas–liquid plasma-assisted rGO/CdS for degradation of BPA,and the highest degradation efficiency of 87.58%and energy efficiency of 4.22 mg kJ−1were obtained after 60 min plasma-assisted catalytic degradation over rGO/CdS,which were 20.05%and 0.97 mg kJ−1higher than those in the single-plasma system.The degradation efficiency of tetracycline in aqueous solution in the corona discharge plasma combined with Bi2MoO6was higher than that in the single corona discharge plasma system [21].These studies indicate that plasma-catalyst research is recognized to be a feasible method of applying an active catalyst into a contaminated environment.Nevertheless, the limited absorption bands of traditional photo-catalysts restrict their activity and selectivity.Therefore, a highly efficient and readily available photocatalytic material is needed.
Nano-scale TiO2,as a classical photo-catalyst,is potentially useful in the treatment of contaminated water due to advantages such as low toxicity, low cost, excessive demineralization, and fewer byproducts[22].However,it has very low utilization rate in visible light, and reports have shown that visible light intensity is much higher than that of ultraviolet light(UV)in the NTP process[23].Therefore,preparation of TiO2with high catalytic activity has become a catalyst research focus in recent years[23, 24].Graphene oxide (GO) is a two-dimensional carbon nanomaterial with superconductivity and high carrier migration efficiency for inhibiting the recombination of electron holes[25].The photocatalytic activity of TiO2has been shown to obviously improve following the addition of rGO,with composite catalysts having the advantages of a large specific surface area and high catalytic efficiency[26,27].Therefore,rGO-TiO2is selected as the catalyst for the gas–liquid phase plasma system.
In this work, rGO-TiO2was prepared via modified Hummers and hydrothermal method,and the prepared materials were characterized.The effects of important parameters including the dosage of the catalyst, discharge power, initial concentration,storage time,and initial pH of the solution on the degradation of TC were investigated in detail to obtain the optimal conditions for TC degradation and higher degradation efficiency.The intermediate products and proposed pathways of TC degradation were studied in the optimal conditions in gas–liquid plasma in conjunction with the rGO-TiO2system.Finally, the catalytic mechanism of rGO-TiO2was established.
2.Materials and methods
2.1.Materials
Tetracycline (physico-chemical characteristics are shown in supplementary materials,table S1(available online at stacks.iop.org/PST/23/115503/mmedia)) was purchased from Aladdin China and the graphite flakes (200 mesh, >99.95%) were obtained from JinRilai Electronic Material Co.Ltd (Qingdao,China).Tetrabutyl titanate was supplied by Aladdin,and all the other chemicals were reagent grade.Milli-Q water with a conductivity of 0.05 μS cm−1was used.The process of synthesis of rGO-TiO2catalyst and the characterization were shown in Supplementary Materials Texts 1 and 2.
2.2.Discharge reactor and treatment parameters
Figure 1 shows the schematic diagram of the gas–liquid discharge plasma and discharge photograph,respectively.The reactor is primarily composed of a hollow stainless steel needle surrounded by a quartz glass tube with an inner diameter of 4 mm mounted tightly on one end.The length of the quartz tube is 90 mm.The outer and inner diameters of the needle are about 3.6 and 2 mm,respectively,and the length of the needle is about 100 mm.The needle is connected to a high-power DC source as the high-voltage electrode and fed with air as the working gas(75 l h−1).The TC solution servesas the ground electrode, which is connected to the negative pole of the power supply.The spacing between the two electrodes can be varied from 0 to 10 mm(4 mm was chosen in this experiment).The wastewater container is a quartz cylinder capped with a PTFE sheet.To reduce the effect of the heat on O3and H2O2,the reactor is placed in an ice water bath to keep the reaction solution processed for 20 °C.The electrical characteristics of the gas–liquid plasma were monitored by a high-voltage probe (P6015A) and current probe(Tektronix P6021) with a digital oscilloscope (Tektronix MSO 5104).

Figure 1.Schematic diagram of the gas–liquid plasma generation system, the reactor physical drawing, and photograph of the gas–liquid discharge plasma.
2.3.Analytical methods
The concentration of TC was determined by high-performance liquid chromatography (HPLC, Agilent 1200, USA) with a C18 column(4.6 × 250 mm,5 μm,Agilent,USA)at 30°C,and the detection wavelength of the UV detector was 359 nm.The mobile phases included 67% 0.01 mol l−1oxalic acid, 22% acetonitrile,and 11% methanol with the 1.0 ml min−1flow rate.TC and its byproducts were determined by Fourier transform electrostatic field orbit trap high-resolution mass spectrometry (LTQ-Orbitrap XL,Thermo Fisher).The calculation methods of the degradation efficiency of TC,discharge power,and energy yield are shown in Supplementary Materials Text 3.All the experimental data were obtained in triplicate at the same conditions.The standard deviation (SD) and mean values were calculated via Excel software,and the error bar signified the SD for every mean value.In addition, the graphs were drawn using the Origin 9.1 software.

Figure 2.SEM images of(a)pure GO and(b)rGO-TiO2 nanocomposites; TEM images of(c)pure GO and(d)rGO-TiO2 nanocomposites.
2.4.Spectrometric and reactive species determination
The optical emission from the plasma was monitored by the AvaSpec-2048-8-RM spectrometer.The optical fiber probe was installed 10 mm away from the glass tube nozzle.
The concentrations of long-lived reactive species (H2O2,O3, andin the plasma-treated Milli-Q water H2O were determined spectrophotometrically (PhotoLab 6100, WTW,Germany).The analysis was conducted according to the manufacturer’s manual, and was described in our previous reports [28, 29].
3.Results and discussion
3.1.Characterization of GO and rGO-TiO2
The SEM (figures 2(a) and (b)) and TEM (figures 2(c) and(d)) images show the morphology and microstructure of the prepared GO and rGO-TiO2nanocomposites.As shown in figures 2(a) and (c), the prepared material has a flake-like wrinkled structure.Figures 2(b) and (d) show that the nanoparticles are uniform on the nanosheets after the hydrothermal treatment [30].
Figure 3(a) shows the XRD patterns of GO and rGO-TiO2composites.The peaks of the prepared rGO-TiO2are located at 2θ = 25.4°, 38.1°, 48.3°, 54.2°, and 62.9°,which are characteristics of the anatase phase of TiO2corresponding to the (101), (004), (200), (105), and (204)crystal planes, respectively [31], indicating that the nanoparticles are TiO2.According to previous reports, the diffraction peak of pure graphite is at about 2θ = 26°[32].After oxidation, the graphite diffraction peak disappeared and a new diffraction peak at 2θ = 10.8° (interlaying spacing:8.3 Å) appeared, revealing oxidation to GO [33].When GO was converted into rGO hydrothermally, the characteristic peak (2θ = 10.8°) of graphene oxide disappears.
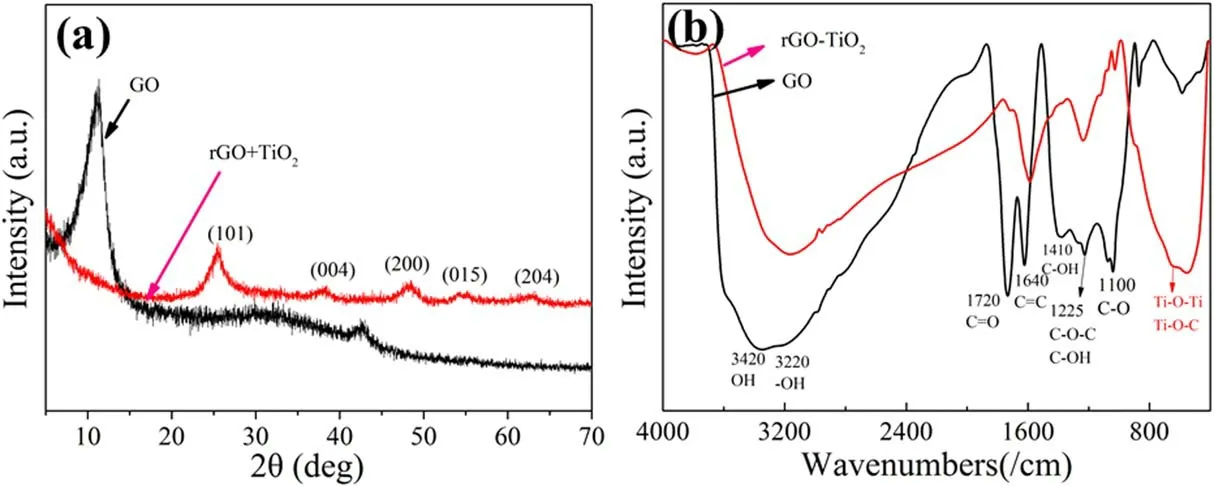
Figure 3.(a) XRD patterns and FTIR spectra of GO and rGO-TiO2.
Figure 3(b)shows the FTIR spectra of the GO and rGO-TiO2nanocomposites.GO possesses several bonds, including water OH stretching (3420 cm−1), carboxylate stretching (3220 cm−1,1720 cm−1), C=C stretching (1640 cm−1), C–OH bending(1410 cm−1), epoxide C–O–C or phenolic C–OH stretching(1225 cm−1),and C–O stretching(1100 cm−1)[34,35].After the hydrothermal treatment of GO and tetrabutyltitanate suspension,the prepared rGO-TiO2composite shows small peaks of the various functional groups between 1000 and 1800 cm−1.However,the bands from 400 to 900 cm−1arising from the stretching vibration of Ti–O–C and Ti–O–Ti are quite intense, indicating that TiO2is bonded to grapheme chemically [35].
Figure 4 shows the XPS spectra of GO and rGO-TiO2,and the C 1s,O 1s,and Ti 2p peaks have binding energies of 283.7, 533.5, and 458.9 eV, respectively, consistent with the literature [36].As shown in figure 4(a), pure GO exhibited two peaks at 283.7 eV(C peak)and at 533.5 eV(O peak),and the survey spectrum of the rGO-TiO2composite showed carbon, oxygen, and titanium.The C 1s spectrum of the GO nano-sheets(figure 4(b))showed four types of carbon bonds:non-oxygenated ring C (284.8 eV, including C–H, C–C, and C=C), C–O in C–O–C or C–OH (285.8 eV), carbonyl C in C=O (287.8 eV), and carboxylate carbon in O=C–OH(289.48 eV) [37].For the C 1s spectrum of rGO-TiO2(figure 4(c)), the intensity of oxygenated carbon species obviously decreased after hydrothermal reaction, indicating that the GO was successfully reduced after hydrothermal reaction and combined with TiO2[38].Some oxygenated groups still existed in the rGO-TiO2, which were consistent with those revealed by FTIR[26].In addition,the positions of C–O (285.24 eV) and C=O (285.92 eV) shifted to the left,which indicated that some Ti atoms were combined with carbon atoms.As shown in figure 4(d),the two major peaks at 458.9 and 464.7 eV signify the Ti 2p1/2 and Ti 2p3/2 spin orbits, respectively, and the difference between the energy of these two spin orbits was 5.7 eV(Ti+4chemical state),which was a feature of the TiO2phase [39].
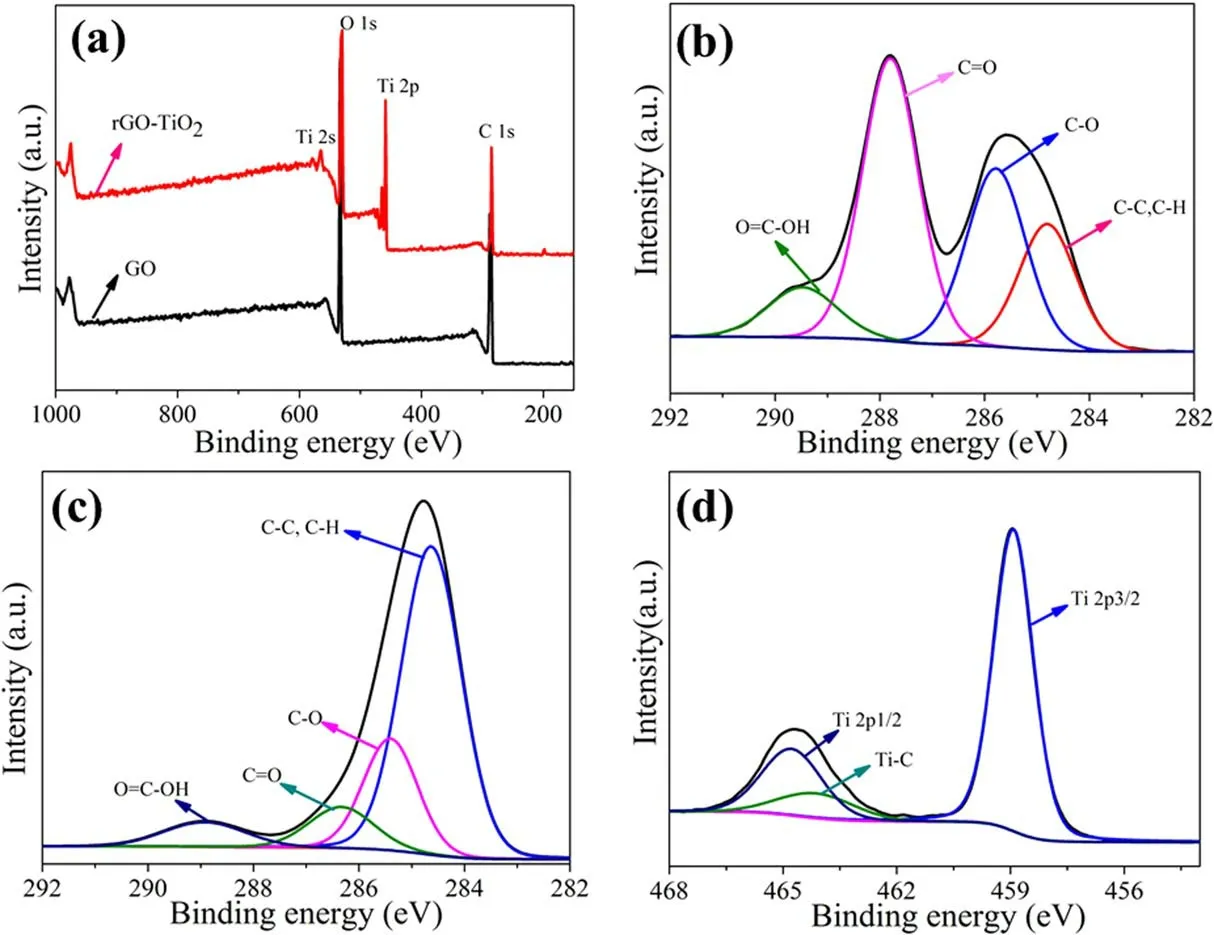
Figure 4.(a)XPS survey spectra of rGO-TiO2 and GO,(b)C 1s spectrum of GO,(c)C 1s spectrum of rGO-TiO2,and(d)Ti 2p spectrum of the rGO-TiO2.
3.2.Electrical and optical characterization of the gas–liquid discharge plasma
The typical voltage–current waveform of the gas–liquid phase air plasma is depicted in figure 5(a).The voltage waveform was repetitive, with a pulse duration of about 1.5 ms and frequency of 670 Hz.The power supply used a circuit to realize a high-frequency AC voltage signal, and then the voltage was boosted to 2 kV by transformer; at last, it was converted into DC high voltage(up to 10 kV)using a voltage doubling rectifier.Due to the problem of filtering in the process of voltage rectification, the high-frequency signal could not be completely filtered out,which lead to there being a superimposed high-frequency signal on the DC high-voltage waveform.The high-frequency oscillation was not caused by discharge, but rather by power supply (homemade in the laboratory).The periodic voltage drop was correlated to the simultaneous rise in the current corresponding to the discharge and plasma generation.According to the graph and calculation (equation (S2)), the discharge current and peak voltage were about 1 A and 4 kV, respectively, and the discharge power was about 19.7 W.
The optical emission intensity of the gas–liquid plasma between 170 and 1000 nm is shown in figure 5(b).In the air with water discharge, the dominant emission lines illustrate the presence of N2lines (300–400 nm), OH lines (306–310 nm), and atomic hydrogen lines of Hα(656.3 nm) and Hβ(486.1 nm),as well as excited atomic oxygen lines at 777.2 and 844.6 nm[40].According to the species mentioned above,they help to explain the final generation of reactive species (RS) in liquid.
3.3.Concentration of reactive species in liquid

Figure 5.(a)Voltage and current waveforms of the plasma discharge,(b)optical emission intensity air plasma between 170 and 1000 nm,(c)concentration of reactive species(RS)in the liquid induced by the plasma,and(d)change of solution pH before and after plasma treatment and concentration of H2O2.Conditions:air flow rate of 75 l h−1,discharge power of 19.7 W(discharge current and peak voltage were about 1 A and 4 kV, respectively), initial solution pH value of 6.5, and with/without initial catalyst concentration of 30 mg l−1.
Active ions and free radicals (O3, ·OH) created by the gas–liquid phase plasma in the gas and liquid phases and part of the gaseous RS would further transfer into the liquid phase,which played important roles in degrading pollutants due to the high oxidation potentials.RS were classified into longlived (H2O2, O3, and N-O3) and short-lived reactive species.In general, monitoring of short-lived species was quite difficult,but long-lived species could reflect the concentrations of short-lived species indirectly (equations (1)–(14)) [41].Shen et al[42]reported that the-e ,hν,O,·OH,and NO etc.played important roles in the plasma-induced chemical reactions.As shown in figure 5(c), the concentrations of H2O2, O3, andchanged with discharge time at discharge power of 19.7 W.With increasing treatment time, theand H2O2concentrations increased significantly while that of O3only went up slightly.The concentrations ofand H2O2were 72.0 and 38.6 mg l−1,respectively,after exposure for 24 min;meanwhile, the concentration of O3was only 6.4 mg l−1.
O3was generated by the interaction between atomic oxygen and oxygen in the gas phase and then spread into the liquid phase,and the O3could break down and generate other reactive species to achieve balance in the solution according to the following reactions [42]:
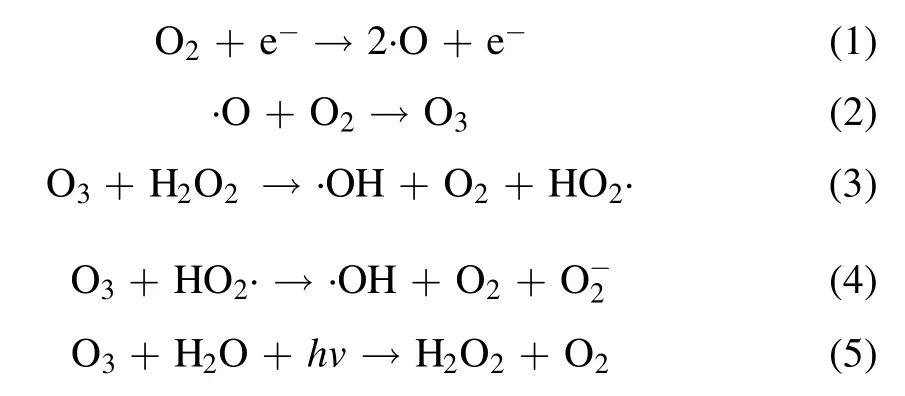
H2O2and ·OH were produced by ionization and/or excitation of water molecules by high-energy electrons in the gas–liquid phase plasma, or generated by other reactive species (equations (3)–(10)) [43]:

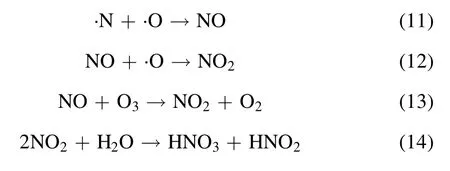
In the air discharge, the solution pH decreased gradually with increasing reaction time.Nitrogen oxides reacted with water to form HNO3and HNO2to decrease the pH (equations (11)–(14)) (figure 5(d)) and the effects of the initial pH on TC degradation were monitored.
As shown in figure 5(d), the concentration of H2O2increased gradually in the single-plasma and in the plasma/rGO-TiO2system,and by adding the rGO-TiO2,the system would promote the production of more ·OH, which would lead to production of more H2O2by reaction(equations (15)–(17)).After 16 min, the concentration of H2O2growth slowed down in the plasma/rGO-TiO2system,which was because the H2O2concentration was related to the generation, adsorption, and decomposition of H2O2on the surface of rGO-TiO2.According to the results, the gas–liquid plasma and gas–liquid plasma/rGO-TiO2system could all induce the generation of multiple short-lived and long-lived reactive species in the aqueous solution at various concentrations,which would synergistically interact with the target organic pollutants and their intermediates, leading to possibly different degradation effects on TC.
3.4.Effects of operating variables on degradation of TC
3.4.1.Effects of catalyst dosage.Gas–liquid plasma degradation of TC was examined using different dosages of catalyst.The rGO-TiO2was defined to be in the saturated adsorption state.Figure 6(a)shows the effect of the rGO-TiO2dosage on TC degradation.As expected, with addition of rGO-TiO2, the degradation efficiency increased compared to that of the plasma alone, and the degradation efficiency increased with catalyst dosage.After treatment for 12 min,the degradation efficiencies for 0.0, 30.0, and 100.0 mg l−1rGO-TiO2were 47.7%, 88.2%, and 90.2%, respectively.However, the degradation efficiency for 100.0 mg l−1rGO-TiO2only showed a small improvement compared to 30.0 mg l−1due to enhanced light scattering and reduced UV transmission for a higher dosage of rGO-TiO2[44].The degradation effect became better with catalyst, which might be caused by the following points.(1) The rGO-TiO2could provide the reaction sites for the generated reactive species and target pollutants.(2)The generated UV light could excite the rGO-TiO2to generate electron-holes (h+and e−), which reacted with water to produce more reactive species(equations (15)–(18)) [44].To achieve better catalytic effects while reducing cost, the dosage of catalyst was chosen to be 30.0 mg l−1in the following experiments:

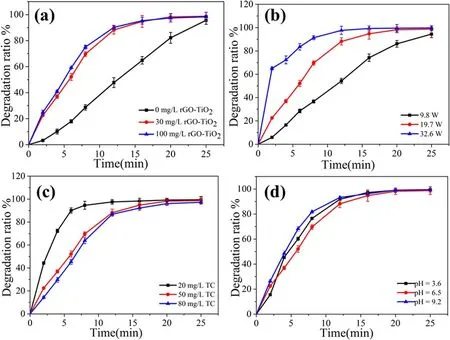
Figure 6.Effects of(a)catalyst dosage on degradation of TC;conditions:discharge power of 19.7 W,initial solution pH value of 6.5,initial TC concentration of 50 mg l−1,and initial catalyst concentrations of 0,30,and 100 mg l−1;(b)discharge power on removal efficiency of TC;conditions: discharge power of 9.8, 19.7, and 32.6 W; initial solution pH value of 6.5; initial TC concentration of 50 mg l−1; and initial catalyst concentration of 30 mg l−1; (c) initial concentration on degradation of TC; conditions: discharge power of 19.7 W; initial solution pH value of 6.5; initial TC concentration of 20, 50, and 80 mg l−1; and initial catalyst concentration of 30 mg l−1; and (d) initial pH on degradation of TC;conditions:discharge power of 19.7 W;initial solution pH value of 3.6,6.5,and 9.2;initial TC concentration of 20,50,and 80 mg l−1, and initial catalyst concentration of 30 mg l−1.

3.4.2.Effects of discharge power.Discharge power, as an important factor in plasma discharge, has various effects(production,transmission,and diffusion)on reactive species[45].Figure 6(b) displays the degradation curves of TC for different discharge power values.The degradation efficiency increased with increasing discharge power,which was consistent with[46].The degradation efficiency,at 9.8 W,was only 36.7%after 8 min,but 69.7% of TC was degraded at 19.7 W.When the discharge power went up to 32.6 W, the degradation efficiency reached 91.4%.Lots of reactive species (such as O3, ·O, and ·OH) and ultraviolet radiation could be generated in the discharge plasma process,and the higher discharge the power,the more densities of reactive species were reactive oxidizing species [47].The UV light energy would also become stronger with additional discharge power, which could activate the band gap to generate the electron-holes on the rGO-TiO2(equations(15)–(18)).Finally,the system could produce more reactive species,which led to the high degradation efficiency of TC under high discharge power.Figure S1 shows the energy yield as a function of treatment time for different discharge power.The energy yield decreased slightly as the input power was increased, and then decreased from 33.2 mg/(kW·h) at 9.8 W to 10.5 mg/(kW·h) at 32.6 W after 25 min.It was difficult to get the best degradation efficiency and higher energy yield at the same time without extra catalyst addition [48].This was mainly because the higher discharge power led to more energy waste (e.g., more electrical energy converted into heat) [22].To evaluate the synthetic effect of the gas–liquid plasma/rGO-TiO2system, later experiments were performed at 19.7 W.
3.4.3.Effects of initial concentration.As shown in figure 6(c),the degradation efficiency of TC is directly related to initial concentration.The initial concentration of TC was increased from 20 to 80 mg l−1,and the degradation efficiency decreased.For an initial concentration of 20 mg l−1,the degradation efficiency was more than 90% at 6 min, and when the concentration was more than 50 mg l−1, the degradation efficiency decreased rapidly to 50%.It had been shown that a low concentration led to high degradation efficiency in the plasma treatment[49].This could be explained by the fact that under certain discharge conditions, the amount of reactive species produced by the system was fixed.In the low concentration of TC,20 mg l−1,plenty of reactive species could react with TC and its by-products.However,in the 50 and 80 mg l−1concentrations of TC, the quantities of TC molecules were much larger than the number of reactive species produced by the system of plasma, which led to the TC molecules and/or its by-products competing and reacting with reactive species [46].Therefore,at high concentration,the degradation efficiency of TC decreased.
3.4.4.Effects of initial pH.During the degradation of TC, a phenomenon was obtained whereby the solution pH decreased gradually with increasing processing time.Therefore,the effect of initial pH (pH = 3.6, 6.5, 9.2) of solution on degradation of TC was explored.As shown in figure 6(d), at pH of 6.5, the degradation efficiency was 69.7%, and under the acidic(pH = 3.6) and alkaline (pH = 9.2) conditions, the degradation efficiencies increased to 76.5% and 81.8%, respectively.In addition, the solution pH decreased continuously with increasing processing time (figure S2), which might be caused by the generation of inorganic acids such as(equations(11)–(14)).Moreover, acidic carboxylic intermediates were also produced, thus synergistically leading to decrease of the aqueous pH [50].The different degradation efficiencies with different initial pH could be explained by the fact that during plasma discharge, the O3was generated, but the pH of the solution influenced the state of O3in solution [51].O3decomposition rate increased rapidly with the increasing pH value [52].The O3was easily decomposed to generate ·OH in alkaline solution(equation(19)),and in acidic solution,the O3could exist stably and the solubility was higher than that in other conditions [53].For the plasma/catalyst system, the TC mainly reacted with the generated·OH in the initial phase,under alkaline conditions, and under acidic conditions, the TC mainly reacted with dissolved O3in solution.As known, the O3and ·OH oxidation potentials were 2.07 and 2.8 eV, respectively.Therefore, the degradation rate in the alkaline condition was faster than that in the acidic condition.At last, the degradation effect tended to be similar,which might be caused by the acidified solution.

3.5.Effect of storage time on degradation of TC after the plasma treatment
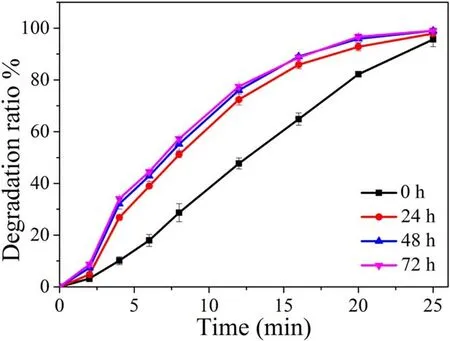
Figure 7.Effect of storage time on degradation of TC after the plasma treatment.Conditions: discharge power of 19.7 W, initial solution pH value of 6.5, initial TC concentration of 50 mg l−1.
The storage time corresponded to the time in the solution after the plasma treatment.To investigate the effects of reactive species on degradation of TC,the storage time was set to be 0,24,48,and 72 h.As shown in figure 7,the degradation efficiency increased at 0–24 h, and afterwards,the degradation efficiency of TC did not change much because the reactive species had been consumed.The results showed that the storage time had a certain effect on the degradation of TC.The plasma/rGO-TiO2system could produce reactive species, including short-lived and long-lived.The shortlived species might immediately react with the TC or other substances to produce the long-lived ones, and the long-lived ones could exist in the solution for a while to continue to react with TC.As the reaction proceeded,the long-lived species were consumed,which meant that the degradation efficiency had no obvious change after 24 h.
3.6.Degradation products and possible degradation pathways
The UV–vis absorption spectra of TC treated in the gas–liquid plasma/rGO-TiO2system for different times are shown in figure S3.The absorbance of TC in solution was characterized at two wavelengths: one in the ultraviolet region at 275 nm and the other band with the maximum absorption at 359 nm.The peak at 275 nm was related to the aromatic ring A structure, including hydroxyl and acylamino in the molecule,and that at 359 nm was associated with aromatic rings B–D consisting of the extended chromophores[54].The decline in the two bands increased with treatment time.This phenomenon was due to fragmentation of acylamino and enolic groups connected to the aromatic ring A and enolic groups connected to the aromatic ring B by oxidizing substance attack.The other reason was that byproducts with a similar chemical structure to TC appear as TC was consumed [55].
TC has pKa1 of 3.3 (combination ‘1’) derived from the tricarbonyl system of ring A,pKa3 of 7.68(combination‘2’)from the dimethylammonium function of ring A,and pKa2 of 9.69 (combination ‘3’) from the phenolic b-diketone system in the C(10)–(12)region(table S1)[56].The reactive species such as O3, ·OH, and H2O2, etc.produced by the plasma/catalyst attract electron-rich functional groups such as amino group, aromatic ring, double bond, and so on.These results confirm that all the intermediates were derived from the reaction between RS and TC at the double-bond site,and two products were formed during the reaction [57].
Seven main intermediates were detected,and the possible TC degradation pathways are illustrated in figure 8.TC was treated by the plasma/catalyst for two minutes and two main negative ions with m/z of 461 and 416 were identified.Compound I came into being in the RS reaction with the C11a–C12 double bond of TC, and then the C11a–C12 double bond was broken to form hydroxyl at C11a and ketone at C12 [58].Compound II was produced by de-amination of TC with collaborative effects of RS and molecular oxygen to generate a ketone group at position C4 [59].At about 8 min,intermediates with m/z of 477, 431, and 364 were detected successively.The double bond at the C2–C3 position, as one of the vulnerable groups,could be easily attacked by RS since this bond had a lower electron intensity than the previous double bond.In the same way, RS could destroy the double bond to generate epoxide, which could be broken to form a ketone group and hydroxyl group at the C3 and C2 positions,respectively, to produce compound IV [58].Compound V came into being by de-amination of compound II, as mentioned above, and intermediates with m/z of 416 and 380 were observed.Compound VI(m/z of 416)was produced by the C2–C3 position being attacked by RS and de-amination,and at position C2,an aldehyde group was formed.A ketone group was formed at C3.Since the C11a–C12 double bond of compound V was attacked by the RS to form a hydroxyl and ketone group at C11a and C12, respectively [60, 61], compound VII was produced.During photocatalytic degradation,the majority of TC degraded to organic and inorganic intermediate compounds.For instance, inorganic ions were produced from the mineralization process, and small molecular intermediates were produced by the open-ring reactions and oxidized into small organic molecules.
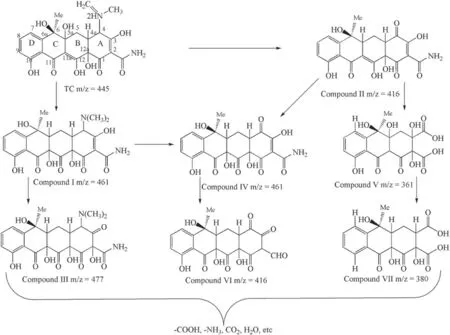
Figure 8.Possible degradation pathway of TC.
3.7.Catalytic mechanism
The catalytic mechanism of gas–liquid plasma/rGO-TiO2consisted of two parts, as shown in figure 9.One is that the active ions and reactive species (O3, ·OH) are created by the gas–liquid phase plasma in the gas and liquid phases.Then,many parts of the reactive species can further transfer into the liquid phase, and they can react directly with pollutants or interact with water to generate other species to react indirectly with pollutants.The other is that the TiO2is stimulated by ultraviolet light produced by the discharge to generate the electron-hole pairs.The electrons can move to the surface of material and react with water to produce ·OH, and the holes react with oxygen to form·O2−.The produced reactive species are effective in removing pollutants from the solution.

Figure 9.Catalytic mechanism of TC degradation.
4.Conclusion
TC was degraded by the gas–liquid discharge plasma in the presence of rGO-TiO2in aqueous solution.The degradation efficiency obviously increased in the plasma/catalyst system compared with that in the single plasma system.After treatment for 12 min, the degradation efficiencies for 0 and 30 mg l−1rGO-TiO2were 47.7% and 88.2%, respectively.The existing long-lived reactive species could still react with TC in the solution.According to the ESI (+)–MS, generated intermediates were detected,and the processes of degradation of TC were complicated but there was a pattern.The gas–liquid plasma-generated RS caused hydroxylation, de-amination, oxidation, and ring opening.The combined use of plasma and catalysts improved the degradation efficiency and was useful in wastewater treatment to eliminate antibiotics.
Acknowledgments
This work was financially supported by National Natural Science Foundation of China (Nos.51777206 and 51541807),Natural Science Foundation of Anhui Province (Nos.1908085MA29, 1708085MB47 and 1708085MA13), Doctoral Fund of Ministry of Education of China (No.2017M612058),Specialized Research Fund for the Doctoral Program of Hefei University of Technology (No.JZ2016HGBZ0769), Chinese Academy of Sciences under Grant No.DSJJ-14-YY02,Science and Technology Cooperation Program between China and Finland (No.2017YFE0115200) as well as Hong Kong Research Grants Council(RGC)General Research Funds(GRF)(No.City U 11205617).
 Plasma Science and Technology2021年11期
- Plasma Science and Technology的其它文章
- Spatial and temporal evolution of electromagnetic pulses generated at Shenguang-II series laser facilities
- Numerical study on the loss of fast ions produced by minority ion cyclotron resonance heating in EAST
- Machine learning of turbulent transport in fusion plasmas with neural network
- Observation of coherent mode induced by a molybdenum dust on EAST
- Investigation of stimulated Raman scattering in longitudinal magnetized plasma by theory and kinetic simulation
- The influence of magnetic field on the beam quality of relativistic electron beam long-range propagation in near-Earth environment
